Abstract
The 2030 Agenda for Sustainable Development and the National New-type Urbanization Plan (2014–2020) put forward the novel principle of “people-oriented” policy. Has the Chinese government’s plan achieved the expected results? To answer this question, the present study evaluates the impacts of New-type Urbanization on the subjective well-being (SWB) of residents. Based on the IV Ordered Probit Model and the data of Chinese General Social Survey (CGSS), we determined that (1) living in cities has a positive impact on SWB, and this impact is significant at a statistical level of 1%; (2) urban household registration (hukou) has no significant impact on SWB; and (3) “Gender”, “Income”, “Job”, “Politics”, “Education”, “Marriage”, and “Health” have significant effects on SWB. To improve residents’ SWB, the government should enhance the attractiveness of the city and significantly reform the household registration system.
1. Introduction
Building sustainable cities and human communities is not only an important goal of the 2030 Agenda for Sustainable Development but also a global issue that the Housing and Sustainable Urban Development (Habitat III) conference is seeking to respond to. By 2050, another three billion people are predicted to flood into urban centers, which means that 70% of the world’s population will live in cities [1]. Within the global context, China has experienced the largest and fastest urbanization process in world history [2]. With increasingly more city settlers, the urbanization rate of China’s permanent population has exceeded 60% [3]. This phenomenon has triggered concern for the carrying capacity of cities. Indeed, China’s traditional type of urbanization has created many problems [4,5,6,7,8,9,10,11] related to the five aspects shown in Figure 1.
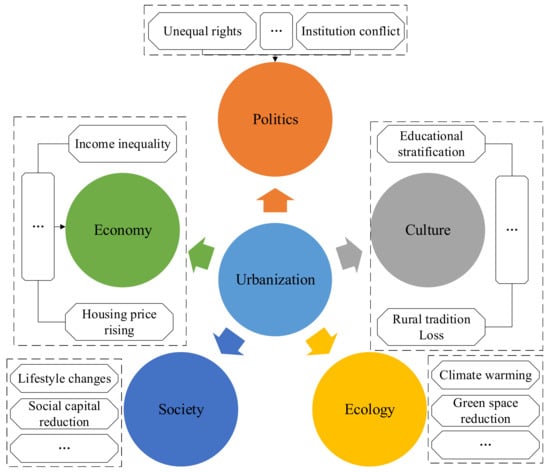
Figure 1.
Negative impacts of traditional urbanization.
To this end, the Chinese government proposed the National New-type Urbanization Plan (2014–2020) which takes “people-oriented, fair sharing” as its principle [12]. Rather than pursuing more cities, New-type Urbanization (NU) focuses instead on development quality, emphasizing people-oriented, sustainable, and high-quality coordinated development. This factor is not only key to the construction of NU but also a criterion for evaluating NU [13]. Subsequently, the Fourth Central City Work Conference focused on “urban development sustainability and livability”. The conclusion of this conference was to promote people-oriented NU, give full play to the maximum potential of expanding domestic demand, and effectively resolve various “urban diseases” [14]. The State Council also issued Several Opinions on Further Promoting the Construction of New-type Urbanization, which detailed the path for achieving NU. For example, the document puts forward the goal of “actively promoting the citizenization of agricultural transfer population” and calls for four measures: accelerating the implementation of the registered residence system reform policy, implementing the residence permit system in a comprehensive way, promoting full coverage of the basic public services of urban residents, and accelerating the establishment of a citizen-driven incentive mechanism for the agricultural transfer population [15]. This strategy marks a new era of urban development in China and also echoes the New Urban Agenda, which notes that “the New Urban Agenda is …people-centered…And all residents have equal access to and enjoyment of cities and human settlements” [16].
Existing studies have carried out explorations in four core domains. (1) Concept definition. NU discards the “urban bias” that traditional urbanization once insisted on. NU no longer emphasizes land-oriented urban expansion and instead responds to the needs of urban residents; that is, NU is “people-oriented” [17]. Moreover, NU advocates the integration of knowledge in the fields of natural sciences and social sciences. It is also necessary to learn from China’s long history of urban construction and development [18]. (2) Development evaluation. Multiple methods, such as a hybrid heterogeneous DEA [19], fully arranged polygon graphical index [20], and dynamic spatial panel model [13], are used to assess urbanization. (3) Impact analysis. In the context of NU, urban planning should give greater consideration to the number and spatial distribution of community recreational facilities to develop healthy communities [21]. (4) Realization path. For regions with abundant mineral resources, eight potential paths can be taken considering the factors of environmental carrying capacity, social and economic foundations, and geographic-location conditions [22]. As the NU plan is drawing to a close, it would be worthwhile to ask whether the goals set by this plan have been achieved. The results appear satisfactory if we only consider the populations of permanent cities. By 2020, 60% of the country’s population already lived in urban areas. However, are these new city residents feeling happy? This factor remains unknown. If the subjective well-being (SWB) of urban residents is lower than that of rural residents, then the “people-oriented” approach advocated by NU will become empty words. Here, the lack of research related to NU’s effects on SWB obfuscates the positive effects of NU and the true effects of NU on SWB.
In this context, we propose three questions: (1) Is it easier to feel happy living in a city? (2) Does urban household registration (hukou) help to enhance SWB? (3) Are there any other factors that have significant impacts on SWB? To answer these questions, this paper uses the IV Ordered Probit Model to analyze China Comprehensive Social Survey (CGSS) data and related statistical data and provide new policy suggestions.
2. Literature Review
2.1. Research Progress and Trends of Subjective Well-Being (SWB)
The earliest research on SWB can be traced back to 1967. Wanner Wilson summarized the characteristics of happy people, such as being young, healthy, rich [23]. However, these factors are not a definition of SWB but rather a simple description of the demographic characteristics related to SWB. In 1974, Chekola interpreted happiness as the harmonious satisfaction of one’s desires and goals [24]. This definition indicates that happiness has at least two characteristics. The first is subjectivity, which emphasizes that happiness is a positive psychological activity. The second is integrity; that is, happiness is the result of a comprehensive evaluation of multiple goals. In 1976, Andrews and Withey proposed that SWB has three components: life-satisfaction judgments, positive effects, and negative effects. Life-satisfaction judgments are an evaluation of the external material environment, while positive effects and negative effects are the feelings of internal psychological activities [25]. Most follow-up studies accepted this view. For example, in 1978, Shin and Johnson defined happiness as “a comprehensive assessment of a person’s quality of life according to self-determined standards” [26]. In 1984, Diener emphasized that SWB belongs to people’s subjective cognition and exists within personal experience [27]. In 1999, Diener et al. proposed that SWB is a broad concept including emotional reflection, satisfaction in specific fields, and overall life satisfaction [28]. In 2001, Diener further improved the concept of SWB and put forward the following views [29]: (1) The three components of SWB can be divided into cognitive evaluation and emotional evaluation; (2) SWB is a comprehensive term, including words used by people in daily life such as happiness, morale, and peace of mind. Diener clearly regarded “happiness” as a part of SWB. (3) SWB has cultural differences. One example is the strong correlation between self-esteem and satisfaction in Western society. However, this correlation does not apply to collectivist societies.
Since the 21st century, the concept of SWB has become more diverse. An important trend today involves emphasizing the background differences of SWB (similar to the cultural differences mentioned above). These background differences are usually closely related to the research scale (country, region, and city). Some studies have discussed SWB on a national scale [30,31]. However, SWB research should focus on the local or urban level because SWB is more vulnerable to adjacent background factors. Scholars who hold this view usually define SWB in cities as a multidimensional concept composed of personal, social, and cultural variables [32]. A growing number of studies have explored the problems of SWB in the context of urban development. These studies were mainly carried out from two perspectives: regional differences and population differences. From the perspective of regional differences, geographical location has an important impact on SWB. Taking the differences between cities as an example, a survey of 1.3 million Americans confirmed that certain regions have characteristics that make people feel happy or unhappy. Therefore, it is easy to understand that there is a difference in SWB between residents of Hawaii, with its sunshine, and those of New York City, with its traffic smog [33]. Taking the difference between cities and villages as an example, a survey of 7396 rural residents, 2836 urban-rural immigrants, and 3304 urban residents showed that China’s rural residents have higher life satisfaction than migrant workers and urban residents [34]. In terms of population differences, SWB varies from person to person. Some scholars have found that middle-aged urban residents are the most unhappy [35]. For residents with different mobility needs, neighborhood relationships with other residents have a greater positive impact than relationships with migrant workers, partly because migrant workers are more difficult to develop stable neighborhood relationships with [36]. Although there are differences in survey data and research methods, the above studies place SWB under the framework of cities. This new research trend reflects the heterogeneous impact of the acceleration of global urbanization on SWB.
2.2. A New Definition of SWB: Under the Background of Urban Sustainable Development (USD)
In 2015, the 2030 Agenda for Sustainable Development put forward the sustainable development goals (SDGs) to “leave no one behind” [37]. This goal requires us to enhance urban sustainability under the background of urban sustainable development (USD). A classic idea for accomplishing this goal is to build an index system composed of economy, society, and environment [38]. Based on statistical data and spatial data, this idea comprehensively evaluates the competitiveness of cities. However, the sustainability of cities should not be based on stereotypes. Paying attention to the residents actually living in cities and evaluating their SWB could provide a new perspective for understanding sustainability. In recent years, social and cultural awareness has become a new engine of USD [39]. “SWB”, from the field of social and cultural awareness, can reflect urban sustainability. This paper holds that the goal of USD is to make residents living in cities feel happy. The process of urbanization should not reduce the SWB of urban residents or immigrants but ensure that everyone who lives in the city is happy equally and continuously. This view is consistent with the theme of “Better City, better life” of the 2010 Shanghai World Expo. Previous Studies have evaluated the differences in the SWB of urban and rural residents. However, it is also necessary to provide new insights on SWB under the circumstance of USD and NU. To this end, the present study makes the following contributions:
- We use SWB instead of happiness. There are two main reasons for this choice. On the one hand, when carrying out quantitative research, scholars prefer to adopt SWB. As Seligman noted, SWB is more of a scientific term than happiness [40]. Although there may be some deviations, directly asking residents whether they feel happy is undoubtedly a way to quickly collect respondents’ psychological experiences. On the other hand, the availability of data limits our choices. The new situation of USD and NU requires that the survey data we choose are timely and comprehensive. Timeliness means that the survey data should be later than the time when the SDGs and NU were proposed. Comprehensiveness requires that the survey data basically cover the whole of China to reflect the actual situation of China to the greatest extent. Therefore, we ultimately selected the CGSS 2015 database, which only sets the problem of SWB. By using a Likert-type five-level scale, there are five possible answers for subjective wellbeing. Compared to a binary question that can only provide two answers, a Likert-type scale can more accurately reflect respondents’ SWB.
- under the background of USD, we redefine SWB. Past studies have interpreted urban sustainability as the coordinated development of the city as a material carrier in economy, society, and the environment, but with a lack of value care for urban residents. This factor could easily lead us to lose sight of the goal of USD. A typical case is the rapid economic growth of many Western states in the past 50 years but the absence of significant changes in the average level of SWB [41,42,43]. This forces us to reflect on whether policies pursuing economic growth are meaningless if they do not make people happier [44]. Indeed, SWB itself is a policy tool that can be used for three purposes: evaluating policy costs and benefits that are difficult to quantify, providing standard measurement units to promote consistent decision-making in various fields, and helping decision makers set policy defaults [45]. Therefore, redefining SWB in the context of sustainability can help realize a positive turn of urbanization from “urban development” to “people’s SWB”. In this way, urban managers will not mechanically seek “wealth in the material world” but pay more attention to “happiness in the spiritual world”. This shift is also in line with the development concept of China’s new urbanization plan, which focuses on “people oriented, fair sharing” approaches. To sum up, we propose a new concept of SWB: that all residents who live in the city or will soon live in the city can feel happiness equally and permanently. The new definition is no longer limited to the city itself but moves the focus to the residents as subjects. In other words, cities that cannot make residents feel happy will eventually experience population loss and lose the vitality needed for further growth, which is unsustainable. Therefore, we argue that USD can be understood and evaluated from the perspective of residents’ SWB. Moreover, improving the sustainability of urbanization will improve the SWB of urban residents. The new goal’s orientation highlights the dominant position of people and will also serve as a link between urban sustainability research and happiness research.
2.3. Proposal of Research Hypothesis
Hypothesis 1 (H1).
Living in cities has a positive impact on SWB.
Previous studies have shown that cities can improve SWB because of their convenient facilities (parks, shopping malls, traffic facilities, etc.) and excellent services (security, education, medical care, etc.) [46]. Thus, cities are better than villages in at least two aspects: (1) Cities provide a good environment for residents. The urban built environment is a space for social interaction and helps people maintain good health [47,48]. (2) Cities supply comprehensive services. For example, due to insufficient medical resources in villages, residents often seek professional medical services in cities [49]. This urban–rural gap is also reflected in the various public services [50]. Hence, rural residents who cannot meet their daily needs are more likely to be unhappy. However, the noise, pollution, and other issues generated by the city can also reduce SWB [51]. In addition, some non-material characteristics in countryside can also improve SWB, such as positive environmental externalities and supportive communities [52]. Therefore, some scholars showed that rural residents are happier than urban residents [53]. Traditional urbanization has indeed caused many problems and reduced the SWB of urban residents. However, under the SDGs and China’s NU, cities will bring more benefits to residents. Based on this concept, we propose our first hypothesis that living in cities has a positive effect on SWB. Living in the city is measured by the City variable.
Hypothesis 2 (H2).
Urban household registration (hukou) helps to improve SWB.
The household registration (hukou) system divides Chinese society into urban and rural parts [54]. Consequently, most of the rural population is forced to stay in the countryside, where it is difficult to obtain the same rights and benefits as urban residents, such as medical care and education [55]. Hukou has become an important mechanism for China’s resource allocation and life opportunities [56]. Therefore, urban hukou is important to SWB. Furthermore, living in cities is different than having urban hukou, as one’s hukou does not have to be in the same as the place of residence. People with a rural hukou can live in the city, and those with an urban hukou can also live in the countryside [55]. When a person who had a rural hukou obtains an urban hukou, a new urban immigrant is produced. Existing studies have found that the SWB of new urban immigrants from the countryside is not only lower than that of urban residents but also lower than that of rural residents [57]. To clarify the impact of hukou on SWB, we propose the second hypothesis that urban hukou helps to improve SWB. Urban hukou is measured by the Hukou variable.
3. Materials and Methods
3.1. Data Source and Processing
The first source of data was a nationwide large-scale sample survey project initiated by Renmin University of China: the CGSS project. This project began in 2003 and is the earliest national, comprehensive, and continuous academic investigation project in China. The most recent publicly-available data were collected in 2015 [58]. Considering the timeliness of the data and the timing of NU, we ultimately selected these data (the data reflect the microscopic situation of residents in 2014). The research objects were randomly selected households nationwide. In 2015, the sample size covered 478 regions (including urban and rural areas) in 28 provinces (autonomous regions and municipalities), with a total of valid questionnaires. After excluding the samples with missing indicators, we obtained a sample of 9626 residents (accounting for more than 87% of the total valid questionnaires), covering 28 provinces (autonomous regions and municipalities), and the overall sample was generally representative.
The second source of data was the China City Statistical Yearbook (2015), including the urbanization rate, the proportion of area of built district, and other macroeconomic statistics [59]. This paper used the above statistical data as instrumental variables.
3.2. Methodology
3.2.1. IV Ordered Probit Model
SWB, as the research object of this study (the explained variable), was measured by a five-level Likert-type scale based on the questionnaire item that “In general, do you think your life is happy”. The options ranged from “very unhappy” (1 point) to “very happy” (5 points). Given the use of typical ordered data, the IV Ordered Probit Model was applied to carry out parameter estimation [60]. The formula was as follows:
where SWB is the explained variable, and Cityi is the explanatory variable (dummy variable) that the model emphasizes. If the residents live in the city, the value of Cityi is 1; otherwise, it is 0. Xi is an exogenous explanatory variable; β is a parameter to be estimated; and ε is the residual term. F (•) is a nonlinear function, and its form is as follows:
where μ1 < μ2 < μ3 < … < μj − 1 is the tangent point including all parameters to be estimated, and y* is an unobservable continuous variable—that is, a latent variable. Therefore, the final form of the SWB model is as follows:
where the β parameter is estimated using the Heckman two-step method. In the first stage, the endogenous explanatory variable (“City”) was used to perform probit regression on all instrumental variables and exogenous explanatory variables. Then, the fitting value of the latent variable () was obtained (). The formula is as follows:
where represents the fitted value of the variable or the estimated value of the parameter, vector Xi is the same control variable used in the ordinary ordered probit model, and Zi is the vector composed of the instrumental variables.
In the second stage, SWB was used to perform ordered probit regression on the fitting value and residual and exogenous explanatory variables of the latent variables. The formula is as follows:
where the letters have the same meaning as above.
3.2.2. Variables
Table 1 shows the description of the variables. The explained variable is SWB measured by five levels, while the endogenous explanatory variable is the item “whether to live in the city”. To clarify the effect of residence on SWB, the exogenous explanatory variables that may interfere with the model need to be introduced and controlled. Generally, exogenous explanatory variables (control variables) consist of personal characteristics, family characteristics, and marriage and spousal characteristics. Considering that marriage and spousal characteristics are based on family, we ultimately selected 12 exogenous explanatory variables, including personal characteristics (9 variables) and family characteristics (3 variables). Specifically, education background (“Education”) and health level (“Health”) are ordered variables; age (“Age”) and family number (“Famnum”) are the corresponding values of the year; and other variables are binary variables.

Table 1.
Variable selection and description.
The instrumental variables are urbanization rate (“Urbanization rate”) and the proportion of built-district area to urban area (“Builtpro”). A high urbanization rate indicates many permanent residents in the city. Hence, it can be inferred that the urbanization rate is positively correlated with the endogenous variable “City”. Notably, the urbanization of land is faster than that of the population in China [61]. Thus, many new towns have become “ghost towns”, reflecting the “the inversion phenomenon” between the proportion of area of the built district and the urban population. Therefore, we inferred that the proportion of area of the built district is negatively correlated with the “City” variable. At the same time, the urbanization rate and the proportion of area of the built district will not be affected by the well-being of urban and rural residents. Thus, the above variables meet the selection conditions of effective tool variables.
4. Results
4.1. Descriptive Analysis
Table 2 shows the basic situation of all variables in the model. For the explained variable “SWB “, the mean value is 3.88, showing that most Chinese residents possess happy life attitudes. As for the endogenous explanatory variable “City”, the mean value is 0.59. This value reflects the basic characteristics of urban and rural residential areas. Among the total sample of 9626 citizens, 5640 respondents live in the city, while the rest live in rural areas. The exogenous explanatory variables further reveal personal and family characteristics. For instance, the mean values of “Gender”, “Hukou”, and “House” are all close to 0.5, indicating that the sample’s male-to-female ratio, urban–rural household registration ratio, and housing ownership ratio are relatively balanced. Further, the mean value of “Health” is 3.6, showing that the health level of most residents is between “ordinary” and “healthy”. The standard deviation of “Income” is 30.03, suggesting that the income gap is large, and the mean value of “Famnum” is 3.41, indicating that the family structure is dominated by a family of three in China.
Table 2.
Descriptive statistics.
Combining these above research topics, we further compared the grading differences in SWB between urban and rural residents. Figure 2 shows that 60.59% and 18.46% of urban residents were “happy” and “very happy”, respectively. Moreover, the proportion of urban residents with the same level of SWB was found to be higher than that of rural residents. Overall, 6.85% of rural residents believe they are “unhappy”, while only 1.66% are “very unhappy”. Furthermore, rural residents reported higher levels of unhappiness than urban residents. In addition, about 15% of urban residents and rural residents had difficulty expressing their level of happiness.
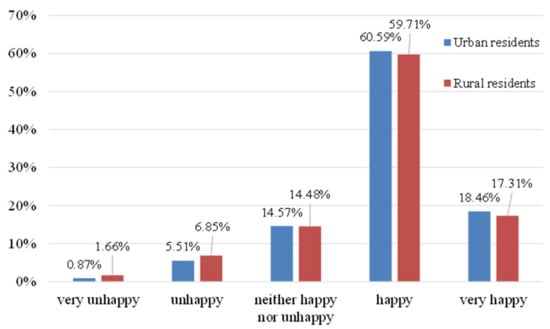
Figure 2.
Difference of SWB between urban residents and rural residents.
4.2. Estimated Results of IV Ordered Probit Model
One-stage regression used a probit regression of “City” to all instrumental variables and exogenous explanatory variables. Specifically, model (1) includes “Urbanization rate” and exogenous explanatory variables; model (2) includes “Builtpro” and exogenous explanatory variables; and model (3) includes “Urbanization rate”, “Builtpro”, and exogenous interpretation variables. Table 3 shows that the larger the family size is, the greater the willingness to live in the countryside. Moreover, those with higher education levels, those with urban household registration, and those without real estate or a job were more willing to live in the city. The coefficient of “Urbanization rate” was significantly positive, which is consistent with the previous hypothesis that the urbanization rate drives people to settle in cities. The coefficient of “Builtpro” was found to be significantly negative, which means that extensive urban construction cannot attract people to settle in cities. The coefficients of the one-stage regression instrumental variables were all significant at a 1% level, and the minimum F statistic of the joint test was 448.31. Hence, there was no weak instrumental variable problem.
Table 3.
Regression results of IV Ordered Probit Model.
Two-stage regression used an ordered probit regression of SWB on the fitted value, the residual of the latent variable, and the exogenous explanatory variable. The p values for the over-identification tests of these models were all greater than 0.1 (Table 3), indicating that the null hypothesis (that the instrumental variables meet the exogenous conditions) cannot be rejected. In other words, these instrumental variables can effectively eliminate the endogenous effects and more accurately estimate the impact of residence on SWB. The coefficients of in models (1) and (3) were both significant at a 1% level and all were positive. This result highlights that living in a city has a positive effect on SWB.
4.3. Marginal Effects
Given that the meanings of the parameters of the ordered probit model were not explicit enough, according to Table 3, only limited quantitative analysis information can be given in terms of significance and parameter signs. Therefore, we further calculated the marginal effect of each explanatory variable on SWB. This process included two main approaches. One was to calculate the continuous marginal effects of exogenous explanatory variables; the other was to calculate the discrete marginal effects and continuous marginal effects of endogenous explanatory variables. Due to the particularity of “City” in the instrumental variable method, the meaning of this variable’s marginal effect was different than the meaning of the marginal effect of exogenous explanatory variables, so “City” discussed here separately.
4.3.1. Marginal Effects of Exogenous Explanatory Variables
First, we calculate how each unit change of the exogenous explanatory variable will affect the probability that SWB takes a certain value when all explanatory variables are at their mean values:
where x represents all exogenous explanatory variables in the second-order regression, excluding “City”. The marginal effect of Formula 8 indicates the probability that the value of SWB will change when the exogenous explanatory variable changes by one unit.
Table 4 shows the marginal effects of all exogenous variables. For the Fam-num variable, every unit increase produces a 0.001 decrease in the probability of being “very unhappy”, a 0.004 decrease in “unhappy”, a 0.001 increase in “happy”, and a 0.01 increase in “very happy”, when the other explanatory variables are at their mean values. These results indicate that the larger the family size is, the stronger the residents’ SWB will be. This result not only reflects the traditional Chinese concept to “have a flourishing population” but also conforms to the reality of the family goal of “emotional maintenance and risk sharing”. Similarly, based on the relationship between other variables and SWB, the people who feel happiest are female, have high income, work less, are Communist Party members, have high education, and are married and healthy (all based on statistical tests). Other variables including “Ethnic”, “Hukou”, and “House” were not significantly related to SWB.
Table 4.
Marginal effects of exogenous explanatory variables.
4.3.2. Discrete Marginal Effects of Endogenous Explanatory Variables
There are usually two methods to measure the marginal effects of endogenous explanatory variables: One is the discrete marginal effect, and the other is the continuous marginal effect. In this paper, the discrete marginal effect of endogenous explanatory variables refers to the probability difference for each value of SWB when other variables are at an average level and the people live in urban or rural areas:
where x(r) represents all explanatory variables except for City*. In the second stage of regression, the explanatory variable is rather than, so the discrete marginal effect needs to be calculated based on the expectation of latent variables.
Table 5 shows the probabilities of SWB in urban and rural areas. Combined with the data in Table 5 and Figure 2, the predicted probability of the model is very close to the actual distribution. The coefficients in Table 5 assume that all variables are mean values, and the mean value of SWB in the actual sample is 3.88. Thus, the prediction of taking 4 as the SWB is consistent (the proportion of urban and rural happy people in the total sample is 60.59% and 59.71%, respectively, in Figure 2, which is close to the values of 62.9% and 61.2% for urban and rural happy people in Table 5). Here, the probability prediction values of 1 and 2, respectively, for SWB are less than the statistical values (the proportion of urban and rural very unhappy people in the total sample in Figure 2 is 0.87% and 1.66%, respectively, which is greater than the values of 0.5% and 1.3% for urban and rural very unhappy people provided in Table 5). To summarize, the respondents living in the city reported a relatively high probability of being “happy” or “very happy”, with a lower probability of being “very unhappy”, “unhappy”, or “neither happy nor unhappy “.
Table 5.
Discrete marginal effect of.
4.3.3. Continuous Marginal Effects of Endogenous Explanatory Variables
The second way to explain the marginal effect of endogenous explanatory variables is continuous marginal effect analysis. The participating in the two-stage regression is the fitting value of the latent variable of “City” obtained from the one-stage regression. Thus, is essentially a continuous variable. Then, we can obtain the marginal effect of the probability of living in the city on the probability of SWB. In this study, the continuous marginal effect of the endogenous explanatory variables indicates the probability that each value of SWB will change accordingly when the probability of living in the city changes. The formula is as follows:
where is the mean value of the independent variable; Prob (City = 1|x) is the probability of living in the city at this time; and Prob (y = i|x) is the probability of the explanatory variable for each value, with the i value ranging from 1 to 5. For example, the probability of “very unhappy” is Prob (SWB = 1|x), and the probability of “very happy” is Prob (SWB = 5|x).
Table 6 shows that when all variables have a mean value, with each increase of Δ in the probability of living in the city, the probability of “very unhappy, unhappy, and neither happy nor unhappy” will decrease by 0.010Δ, 0.036Δ, and 0.053Δ, respectively, while the probability of “happy and very happy” will increase, respectively, by 0.010Δ and 0.088Δ. Thus, when the other variables of the residents are at an average level, choosing to live in a city can greatly increase the probability of being “very happy” but also slightly increase the probability of being “happy”. Meanwhile, choosing to live in a city will greatly reduce the probability of being “unhappy” and “neither happy nor unhappy” and slightly reduce the probability of being “very unhappy”.
Table 6.
Continuous marginal effect of.
5. Discussion
5.1. Main Achievements
Based on the above analysis, the first hypothesis was confirmed. However, the second hypothesis was found to be invalid.
First, we confirmed that living in cities has a positive impact on SWB. This result is consistent with previous studies. Compared to developed countries, residents in developing countries are more likely to feel happy in cities [64]. As China is the largest developing country in the world, Chinese cities have greater advantages over rural areas and fewer disadvantages than rural areas. Considering the advantages of cities, cities are clearly superior to rural areas in many aspects. In 2016, investment in the construction of facilities in urban and rural areas was approximately 1746 and 402.6 billion yuan, respectively. Investments in roads and bridges in urban and rural areas were 75.618 billion and 158.9 billion yuan, respectively. Investments in water supply and drainage for supply facilities in urban and rural areas totaled 174.6 billion and 90.7 billion yuan, respectively, and investments in environmental protection in urban and rural areas totaled 52.38 billion and 42.3 billion yuan, respectively [65]. In 2020, the number of hospital beds per thousand people in urban and rural areas was about 8.81 and 4.95, respectively, and the average number of family cars per hundred households in urban and rural areas was, respectively, about 45 and 27 [66]. This result indicates that the government invested greater funds in the city, making the city’s public infrastructure more complete. More importantly, the income of urban residents is usually higher than that of rural residents. In 2020, the per capita disposable income of urban and rural residents was approximately 43,834 and 17,132 yuan [66], and the per capita disposable income of urban residents was approximately 2.56 times that of rural residents. As shown in Table 4, income has a significant positive effect on “very happy and happy” responses. Thus, because urban residents have higher incomes and can enjoy more public services, living in cities makes it easier to be happy. Rural areas not only lag behind cities in infrastructure and public services but also suffer from more serious aging problems than cities. In 2019, the urban and rural elderly populations aged 60 and above totaled around 8,937,073 and 113,356,294, respectively [66]. The number of elderly people in rural areas is about 1.36 times that in urban areas. As shown in Table 4, age has a significant negative effect on “very happy and happy” SWB. Therefore, because there are more elderly people in rural areas, living in rural areas is more likely to produce an unhappy response.
Secondly, we found that the effect of household registration (hukou) on SWB is not significant. The past view is that having an urban hukou means that one can enjoy greater social benefits [55,56]. However, with the loosening of the household registration policy, increasingly more rural people can easily obtain urban household registrations through various channels. These methods include going to university, joining the army, becoming a government official, buying a house, or simply purchasing a household registration [54]. This means that the urban–rural divide caused by the household registration system is gradually narrowing. A study based on survey data from the Chinese Academy of Social Sciences (CASS) similarly showed that the effect of hukou on SWB is not statistically significant [54]. The National Development and Reform Commission noted in the “Key Tasks of New-type Urbanization Construction in 2019” the goals of “Promoting the settlement of agricultural migrants who are already employed in cities” and “Deepening household registration system reform” and emphasized that “more public services and convenience programs will be provided to residents who do not have a registered permanent residence but have obtained an urban residence permit” [67]. Thus, in the future, the extent to which hukou restricts residents’ access to social welfare will decrease. Therefore, in the long term, the effect of Hukou on SWB will continue to be insignificant.
5.2. Limitations
First, the concepts and measurements of SWBs need more tests. As mentioned earlier, researchers usually divide SWB into two parts: cognitive judgments and effective reactions [29]. In other words, SWB has dual characteristics. The cognitive component is called satisfaction, while the emotional component is considered pleasure or happiness [27]. In this view, the measurement of SWB mainly depends on the satisfaction with life scale (SWLS) and the positive and negative effect schedule (PANAS) [68]. The present study aimed to connect previously disparate USD and SWB research by proposing a concept of SWB under the background of USD. Considering the timeliness and comprehensiveness of the data, the new concept of SWB can still be measured using a Likert-type scale. As a result, although the present definition of SWB is novel, the actual indicators cannot reflect more characteristics of urban sustainability.
Second, policy has a time-lag effect. NU takes 2014–2020 as its implementation cycle, while the time span of the SDGs is 2015–2030. Consequently, there may be dynamic changes in SWB based on the above background. However, the CGSS data for 2020 have not yet been made public. More importantly, it will be difficult for us to conduct large-scale and face-to-face investigations in China due to the COVID-19 pandemic.
Third, missing variables and cross-sectional data limit our ability to determine causal mechanism. The conclusion of this paper is based on CGSS data from 2015. In addition to personal and family characteristics, the SWB between urban and rural residents is also affected by variables such as public service, social capital, and environmental quality. However, the lack of relevant data hindered us from adding more variables, and the cross-sectional data limited our ability to infer causal mechanisms.
5.3. Prospects
First, more research should be encouraged to creatively define SWB combined with background factors. Psychologists usually use well-being to describe SWB and consider people’s thoughts and feelings about their own lives [28]. Economists regard well-being as the ability to satisfy one’s desires or preferences. For management scholars, SWB could be introduced into public policy by combining background factors. Changing background factors will not only enrich the connotations of SWB but also attract the attention of government managers. Future research should consider the role of background factors in shaping SWB.
Second, a set of special questionnaires on USD and SWB should be designed, with continuous observation. To our knowledge, the existing large survey database in China has not established targeted modules for SDGs or NU. This factor makes it difficult for the research on SWB to be transformed into public policies. Future research should spend more time and energy optimizing existing questionnaires.
Third, more capital investment and intellectual support should be encouraged to achieve continuous observation. By doing so, we can determine the causal mechanisms of SWB. Under the new situation of COVID-19, continuous observation is faced with many challenges. For example, (1) the large-scale face-to-face interviews used in the past cannot be carried out smoothly, which increases the difficulty of data acquisition, and (2) the physical and mental trauma that COVID-19 creates for residents may reduce SWB. Therefore, COVID-19 has become a new background factor that cannot be ignored. New forms of engagement such as online interviews and telephone interviews should be considered for continuous observation in the future. Moreover, it is also necessary to increase survey investments among vulnerable groups (i.e., those who do not have access to the internet or do not have a telephone and usually have low SWB).
6. Conclusions and Implications
6.1. Conclusions
The core issue of this paper is whether urban residents are more likely to feel happy than rural residents in the process of NU. This work also discusses the overall SWB of Chinese residents and the possible factors that will affect SWB with statistical significance. The main conclusions are as follows: (1) Living in cities has a positive impact on SWB, and this impact is significant at a statistical level of 1%; (2) urban household registration (hukou) has no significant impact on SWB; and (3) “Gender”, “Income”, “Job”, “Politics”, “Education”, “Marriage”, and “Health” have significant effects on SWB.
6.2. Implications for Policy-Making
First, the attractiveness of the city should be enhanced. To benefit from sound infrastructure, adequate public services, and employment opportunities, increasingly more rural residents are determined to live in cities. To make more urban residents feel happy in the future, the government needs to continue to improve infrastructure and provide convenience in residents’ lives. Moreover, policymakers should expand the scope of public services to provide residents with good education, medical care, pension, and other services.
Second, the household registration system should be significantly reformed. Due to the restrictions of the registered residence system, many rural surplus labors cannot be converted into formal city residents. This factor not only reduces the happiness of rural residents but also is not conducive to the sustainable development of cities. Therefore, in line with NU plan, the government needs to reform the registered residence system and further relax restrictions on settlement.
Author Contributions
Conceptualization, J.Y. and C.L.; methodology, C.L.; writing—original draft preparation, C.L.; writing—review and editing, C.L. and Z.X.; formal analysis, C.L. and Z.X.; visualization, Z.X.; supervision, J.Y.; funding acquisition, J.Y. and C.L. All authors have read and agreed to the published version of the manuscript.
Funding
This work was funded by the Key Project of National Natural Science Foundation of China (72134008), the National Natural Science Foundation of China (71704180, 72074217), the Fundamental Research Funds for Central Universities, and the Research Funds of Renmin University of China (21XNH031).
Institutional Review Board Statement
All authors have taken a designated research ethics course required by the universities. We complied with the laws and regulations of China and followed the ethical guideline to conduct this research. We also provided the respondents with information on the research purpose and data processing and obtained their consent before conducting interviews.
Informed Consent Statement
Not applicable.
Data Availability Statement
Not applicable.
Acknowledgments
Thanks to all anonymous reviewers for their valuable comments and timely feedback.
Conflicts of Interest
The authors declare no conflict of interest.
References
- United Nations. Housing and Sustainable Urban Development (Habitat III). Available online: https://www.un.org/sustainabledevelopment/zh/habitat3/ (accessed on 8 November 2021).
- National Bureau of Statistics. The 17th of the Series of Reports on the Achievements of Economic and Social Development in the 70th Anniversary of the Founding of China. Available online: http://www.gov.cn/shuju/2019-08/16/content_5421576.htm (accessed on 8 November 2021).
- National Bureau of Statistics. National Economic and Social Development Statistical Bulletin 2020. Available online: http://www.stats.gov.cn/tjsj/zxfb/202102/t20210227_1814154.html (accessed on 8 November 2021).
- Sun, Y.; Zhang, X.; Ren, G.; Zwiers, F.W.; Hu, T. Contribution of urbanization to warming in China. Nat. Clim. Chang. 2016, 6, 706–709. [Google Scholar] [CrossRef]
- Chen, W.Y.; Hu, F.Z.Y. Producing nature for public: Land-based urbanization and provision of public green spaces in China. Appl. Geogr. 2015, 58, 32–40. [Google Scholar] [CrossRef]
- Chen, J.; Guo, F.; Wu, Y. One decade of urban housing reform in China: Urban housing price dynamics and the role of migration and urbanization, 1995–2005. Habitat Int. 2011, 35, 1–8. [Google Scholar] [CrossRef]
- Chu, S. Fight for equality in a transforming China: Community development in urbanization. Int. Rev. Adm. Sci. 2004, 70, 673–684. [Google Scholar] [CrossRef] [Green Version]
- Lian, H.; Lejano, R.P. Interpreting institutional fit: Urbanization, development, and China’s “land-lost”. World Dev. 2014, 61, 1–10. [Google Scholar] [CrossRef]
- Zhang, L.; Wang, S.X.; Yu, L. Is social capital eroded by the state-led urbanization in China? A case study on indigenous villagers in the urban fringe of Beijing. China Econ. Rev. 2015, 35, 232–246. [Google Scholar] [CrossRef]
- Wu, D.; Rao, P. Urbanization and income inequality in China: An empirical investigation at provincial level. Soc. Indic. Res. 2017, 131, 189–214. [Google Scholar] [CrossRef]
- Choy, L.H.T.; Li, V.J. The role of higher education in China’s inclusive urbanization. Cities 2017, 60, 504–510. [Google Scholar] [CrossRef]
- Xinhua News Agency. National New-Type Urbanization Plan (2014–2020). Available online: http://www.gov.cn/zhengce/2014-03/16/content_2640075.htm (accessed on 8 November 2021).
- Yu, B. Ecological effects of New-type Urbanization in China. Renew. Sust. Energ. Rev. 2021, 135, 110239. [Google Scholar] [CrossRef]
- CPCNEWS. Previous Urban Work Conferences Held in the History of the Communist Party of China. Available online: http://dangshi.people.com.cn/n1/2016/0801/c85037-28600430.html (accessed on 8 November 2021).
- State Council. Several Opinions on Further Promoting the Construction of New-Type Urbanization. Available online: http://www.gov.cn/zhengce/content/2016-02/06/content_5039947.htm (accessed on 8 November 2021).
- United Nations. New Urban Agenda. Available online: https://habitat3.org/the-new-urban-agenda (accessed on 8 November 2021).
- Chen, M.; Liu, W.; Lu, D. Challenges and the way forward in China’s New-type Urbanization. Land Use Policy 2016, 55, 334–339. [Google Scholar] [CrossRef]
- Yang, J.; Wu, T.; Gong, P. Implementation of China’s new urbanization strategy requires new thinking. Sci. Bull. 2017, 62, 81–82. [Google Scholar] [CrossRef] [Green Version]
- Ji, X.; Wu, J.; Zhu, Q.; Sun, J. Using a hybrid heterogeneous DEA method to benchmark China’s sustainable urbanization: An empirical study. Ann. Oper. Res. 2019, 278, 281–335. [Google Scholar] [CrossRef]
- Wu, H.; Gai, Z.; Guo, Y.; Li, Y.; Hao, Y.; Lu, Z.-N. Does environmental pollution inhibit urbanization in China? A new perspective through residents’ medical and health costs. Environ. Res. 2020, 182, 109128. [Google Scholar] [CrossRef] [PubMed]
- Chen, T.; Hui, E.C.-M.; Lang, W.; Tao, L. People, recreational facility and physical activity: New-type urbanization planning for the healthy communities in China. Habitat Int. 2016, 58, 12–22. [Google Scholar] [CrossRef]
- Zeng, L.; Wang, J.; Zhang, J.; Lv, J.; Cui, W. New Urbanization paths in mineral resource abundant regions in China: A three-dimensional cube framework. Resour. Policy 2020, 68, 101709. [Google Scholar] [CrossRef]
- Wilson, W. Correlates of avowed happiness. Psychol. Bull. 1967, 67, 294–306. [Google Scholar] [CrossRef] [PubMed]
- Chekola, M.G. The Concept of Happiness; University of Michigan: Ann Arbor, MI, USA, 1974. [Google Scholar]
- Andrews, F.; Withey, S. Social Indicators of Well-Being: America’s Perception of Life Quality; Plenum Press: New York, NY, USA; London, UK, 1976. [Google Scholar]
- Shin, D.C.; Johnson, D.M. Avowed happiness as an overall assessment of the quality of life. Soc. Indic. Res. 1978, 5, 475–492. [Google Scholar] [CrossRef]
- Diener, E. Subjective well-being. Psychol. Bull. 1984, 95, 542–575. [Google Scholar] [CrossRef]
- Diener, E.; Suh, E.M.; Lucas, R.E.; Smith, H.L. Subjective well-being: Three decades of progress. Psychol. Bull. 1999, 125, 276–294. [Google Scholar] [CrossRef]
- Diener, E. Well-being (Subjective), Psychology of. In International Encyclopedia of the Social & Behavioral Sciences; Smelser, N.J., Baltes, P.B., Eds.; Pergamon: Oxford, UK, 2001; pp. 16451–16454. [Google Scholar]
- Veenhoven, R.; Hagerty, M. Rising happiness in nations 1946–2004: A reply to Easterlin. Soc. Indic. Res. 2006, 79, 421–436. [Google Scholar] [CrossRef] [Green Version]
- Lee, S.Y.; Kim, R.; Rodgers, J.; Subramanian, S.V. Associations between subjective wellbeing and macroeconomic indicators: An assessment of heterogeneity across 60 countries. Wellbeing Space Soc. 2020, 1, 100011. [Google Scholar] [CrossRef]
- Wills-Herrera, E.; Islam, G.; Hamilton, M. Subjective well-being in cities: A multidimensional concept of individual, social and cultural variables. Appl. Res. Qual. Life 2009, 4, 201–221. [Google Scholar] [CrossRef]
- Oswald, A.J.; Wu, S. Objective confirmation of subjective measures of human well-being: Evidence from the USA. Science 2010, 327, 576–579. [Google Scholar] [CrossRef] [PubMed] [Green Version]
- Cai, S.; Wang, J. Less advantaged, more optimistic? Subjective well-being among rural, migrant and urban populations in contemporary China. China Econ. Rev. 2018, 52, 95–110. [Google Scholar] [CrossRef]
- Han, C. Explaining the subjective well-being of urban and rural Chinese: Income, personal concerns, and societal evaluations. Soc. Sci. Res. 2015, 49, 179–190. [Google Scholar] [CrossRef]
- Liu, Y.; Zhang, F.; Liu, Y.; Li, Z.; Wu, F. The effect of neighbourhood social ties on migrants’ subjective wellbeing in Chinese cities. Habitat Int. 2017, 66, 86–94. [Google Scholar] [CrossRef]
- United Nations. Transforming Our World: The 2030 Agenda for Sustainable Development; United Nations: New York, NY, USA, 2015. [Google Scholar]
- Jiang, Y.; Shen, J. Measuring the urban competitiveness of Chinese cities in 2000. Cities 2010, 27, 307–314. [Google Scholar] [CrossRef]
- Hassan, A.M.; Lee, H. Toward the sustainable development of urban areas: An overview of global trends in trials and policies. Land Use Policy 2015, 48, 199–212. [Google Scholar] [CrossRef]
- Csikszentmihalyi, M.; Seligman, M.E.P. Positive psychology: An Introduction. Am. Psychol. 2000, 55, 5–14. [Google Scholar] [CrossRef]
- Easterlin, R.A. Does economic growth improve the human lot? Some empirical evidence. In Nations and Households in Economic Growth; David, P.A., Reder, M.W., Eds.; Academic Press: New York, NY, USA; London, UK, 1974; pp. 89–125. [Google Scholar]
- Easterlin, R.A. Income and happiness: Towards a unified theory. Econ. J. 2001, 111, 465–484. [Google Scholar] [CrossRef]
- Easterlin, R. Feeding the illusion of growth and happiness: A reply to Hagerty and Veenhoven. Soc. Indic. Res. 2005, 74, 429–443. [Google Scholar] [CrossRef]
- Frank, R.H. Luxury Fever: Money and Happiness in an Era of Excess; Free Press: New York, NY, USA, 1999. [Google Scholar]
- Dolan, P.; White, M.P. How can measures of subjective well-being be used to inform public policy? Perspect. Psychol. Sci. 2007, 2, 71–85. [Google Scholar] [CrossRef]
- Hogan, M.J.; Leyden, K.M.; Conway, R.; Goldberg, A.; Walsh, D.; McKenna-Plumley, P.E. Happiness and health across the lifespan in five major cities: The impact of place and government performance. Soc. Sci. Med. 2016, 162, 168–176. [Google Scholar] [CrossRef] [PubMed]
- Brown, S.C.; Mason, C.A.; Perrino, T.; Lombard, J.L.; Martinez, F.; Plater-Zyberk, E.; Spokane, A.R.; Szapocznik, J. Built environment and physical functioning in Hispanic elders: The role of “Eyes on the Street”. Environ. Health Perspect. 2008, 116, 1300–1307. [Google Scholar] [CrossRef] [PubMed]
- Leyden, K.M. Social capital and the built environment: The importance of walkable neighborhoods. Am. J. Public Health 2003, 93, 1546–1551. [Google Scholar] [CrossRef]
- Veitch, P.C.; Sheehan, M.C.; Holmes, J.H.; Doolan, T.; Wallace, A. Barriers to the use of urban medical services by rural and remote area households. Aust. J. Rural Health 1996, 4, 104–110. [Google Scholar] [CrossRef] [PubMed]
- Guo, X.; Hu, A.; Dai, J.; Chen, D.; Zou, W.; Wang, Y. Urban-rural disparity in the satisfaction with public sports services: Survey-based evidence in China. Soc. Sci. J. 2018, 55, 455–462. [Google Scholar] [CrossRef]
- Fischer, C.S. Toward a subcultural theory of urbanism. Am. J. Sociol. 1975, 80, 1319–1341. [Google Scholar] [CrossRef]
- Gilbert, A.; Colley, K.; Roberts, D. Are rural residents happier? A quantitative analysis of subjective wellbeing in Scotland. J Rural Stud. 2016, 44, 37–45. [Google Scholar] [CrossRef]
- Knight, J.; Gunatilaka, R. The rural–urban divide in China: Income but not happiness? J. Dev. Stud. 2010, 46, 506–534. [Google Scholar] [CrossRef]
- Jiang, S.; Lu, M.; Sato, H. Identity, inequality, and happiness: Evidence from urban China. World Dev. 2012, 40, 1190–1200. [Google Scholar] [CrossRef] [Green Version]
- Wu, X.; Treiman, D.J. Inequality and equality under chinese socialism: The Hukou system and intergenerational occupational mobility. Am. J. Sociol. 2007, 113, 415–445. [Google Scholar] [CrossRef]
- Wu, X.G.; Treiman, D.J. The household registration system and social stratification in China: 1955–1996. Demography 2004, 41, 363–384. [Google Scholar] [CrossRef] [Green Version]
- Knight, J.; Gunatilaka, R. Great expectations? The subjective well-being of rural-urban migrants in China. World Dev. 2010, 38, 113–124. [Google Scholar] [CrossRef] [Green Version]
- Chinese National Survey Data Archive. Chinese General Social Survey. 2015. Available online: http://cnsda.ruc.edu.cn/index.php?r=projects/view&id=62072446 (accessed on 8 November 2021).
- National Bureau of Statistics. China City Statistical Yearbook (2015); China Statistics Press: Beijing, China, 2015; p. 485. [Google Scholar]
- Lian, Y.; Li, W.; Huang, B. The impact of children migration on the health and life satisfaction of parents left behind. China Econ. Q. 2015, 14, 185–202. [Google Scholar]
- Lin, S.; Sun, J.; Marinova, D.; Zhao, D. Effects of population and land urbanization on China’s environmental impact: Empirical analysis based on the extended STIRPAT Model. Sustainability 2017, 9, 825. [Google Scholar] [CrossRef] [Green Version]
- Jin, Y.; Li, Z.; An, J. Impact of education on Chinese urban and rural subjective well-being. Child. Youth Serv. Rev. 2020, 119, 105505. [Google Scholar] [CrossRef]
- Song, Y.; Zhou, A.; Zhang, M.; Wang, H. Assessing the effects of haze pollution on subjective well-being based on Chinese General Social Survey. J. Clean. Prod. 2019, 235, 574–582. [Google Scholar] [CrossRef]
- Okulicz-Kozaryn, A.; Valente, R.R. Urban unhappiness is common. Cities 2021, 118, 103368. [Google Scholar] [CrossRef]
- Ministry of Housing and Urban-Rural Development. Bulletin of China’s Urban and Rural Construction. 2016. Available online: http://www.mohurd.gov.cn/xytj/tjzljsxytjgb/tjxxtjgb/201708/t20170818_232983.html (accessed on 16 November 2021).
- National Bureau of Statistics. China Statistical Yearbook. 2021. Available online: http://www.stats.gov.cn/tjsj/ndsj/2021/indexch.htm (accessed on 8 November 2021).
- National Development and Reform Commission. Key Tasks of New-Type Urbanization Construction in 2019. Available online: https://www.ndrc.gov.cn/xxgk/zcfb/tz/201904/t20190408_962418.html?code=&state=123 (accessed on 16 November 2021).
- Liu, Y.; Zhang, F.; Wu, F.; Liu, Y.; Li, Z. The subjective wellbeing of migrants in Guangzhou, China: The impacts of the social and physical environment. Cities 2017, 60, 333–342. [Google Scholar] [CrossRef]
Publisher’s Note: MDPI stays neutral with regard to jurisdictional claims in published maps and institutional affiliations. |
© 2021 by the authors. Licensee MDPI, Basel, Switzerland. This article is an open access article distributed under the terms and conditions of the Creative Commons Attribution (CC BY) license (https://creativecommons.org/licenses/by/4.0/).