Abstract
This paper aims to quantify tourists’ willingness to walk (WTW) in the intra-destination choice in pedestrian scenic areas. The case study presented is the Tongli Ancient Town (Jiangsu Province, China), which has a significant number of heritage sites, but tourism management has been weak. The main objective was achieved by surveying sequential destination choices in the site, with a total of 272 interviewed tourists. A Multi-Stop Behavior Model (MBM) was constructed to identify the factors that influence tourists’ intra-destination choice and willingness to walk (WTW). On the whole, the evidence showed that tourists prefer core-area attractions to peripheral attractions. Walking distance is the most important variable in tourists’ attraction choice. Moreover, WTWs of tourist segments showed both similarities and disparities, inspiring more pertinent strategies in line with tourists’ preferences. Policy and management implications are drawn based on the empirical findings and their effects are predicted using Monte Carlo (MC) simulation.
1. Introduction
Tourist behavior refers to the joint decision-making process tourists go through when they have choices to make in their tour such as destination, departure time, mode, and route [1,2]. Compared with macro-scale tourist behavior (i.e., travels from home to different tourist destinations), micro-scale tourist behavior (i.e., multi-stops within a destination area) has gained attention in the era of smart tourism [3,4]. On the one hand, tourists’ intra-destination behavior is more complicated. High-resolution data and fine-grained models are essential to depict tourists’ multi-stop choices within a scenic area [5,6]. On the other hand, the value of tourist experiences has been considerably recognized. A high-quality tour experience is indispensable to generate repeat purchase and recommendation to others [7,8], which makes the enhanced understanding of tourists’ preferences and utility quite necessary.
Despite a growing number of studies exploring influential factors of tourists’ intra-destination behavior, ranging from attributes of attractions [1], trip length [9], to travel mode [10] and cultural distance [11], few of them focused on quantifying how long tourists want to walk for attractions in the destination area. Tourists’ willingness to walk (WTW), as an analogy of consumers’ willingness to pay [12,13], is essential to explain tourists’ choice behavior in pedestrian-oriented scenic areas, especially when the cost for tickets was pre-paid before entrance. Some recent studies have investigated people’s WTW to bus stops [14], transportation hubs [15], and underground space [16], pointing out that the WTW directly influence people’s demand patterns and usages of facilities. However, very few studies have applied the concept of WTW to tourists’ intra-destination choice, in which choices of attractions are related to each other and tourists’ preferences are heterogeneous according to individual characteristics. In the real condition, tourists’ willingness to walk (WTW) might vary from teenagers to elders, from males to females, or even from different scenic areas, resulting in overcrowding in some attractions and low utilization in others. Hence, it is necessary to cover this research gap based on empirical studies of pedestrian-oriented scenic areas.
Ever since the 1990s, China has witnessed an increasing number of tourist arrivals in pedestrian-oriented heritage sites [17]. Ancient towns in the south of the Yangtze River, having typical historical and cultural heritage unique to China, attract both domestic and international tourists based on their unique culture, customs, and landscape [18]. However, narrow streets, complicated networks, and intensive inflow in these scenic areas usually lead to the uneven distribution of tourists [19], over-crowded attractions [20], and low utilization of facilities [21], jeopardizing the overall interests of the ancient towns. To this end, the Tongli Ancient Town in the south of the Yangtze River is a suitable case for our study in terms of both methodology and practice. This paper aims to contribute to the field by quantifying tourists’ willingness to walk (WTW) there, and proposes suggestions for its on-site tourism management. Multi-Stop Behavior Model (MBM), a variant of multinomial logit model (MNL) considering a sequence of destination choices within a given area, was constructed based on the tour paths of 272 tourists collected by a survey in Tongli Ancient Town (Jiangsu province, China). To explore the variance of taste, we identified segments according to tourist characteristics and calibrated parameters separately. Finally, we assessed the effects of three management strategies based on the aggregated behavior of 5000 tourists generated by Monte Carlo (MC) simulation, and suggested the most effective one to tourist managers.
The rest of the paper is organized as follows: Section 2 provides a brief literature review on tourists’ choice behavior, Section 3 introduces the study area, data collection, and research methods, analyses and results are presented in Section 4, and finally, conclusions and discussions are in Section 5.
2. Literature Review
2.1. Modeling Tourist Choice Behavior
The complexity of tourists’ choice of destinations has triggered a large number of studies in various disciplines, but they are all related to the following two aspects: one, the needs and motives of tourists, and two, decision on destination, mobility and departure time. Therefore, the choice of destination is related to not only the center of tourism activities, but also other decision-making processes.
Ever since the 1970s, tourists’ destination choice has gained the attention of many scholars. Discrete Choice Model, DCM, which is based on Information Integration Theory [22], Probabilistic Choice Theory [23], and Random Utility Theory [24], has offered us a way of thinking that the choice of destination is, in nature, a result of individual decision-making processes [25,26]. Among them, Multinomial Logit Model (MNL) has been known as the most commonly used one, under which researchers apply a series of variables to explain the utility of options on individuals, and the decisions of individuals are presented with choice probabilities. Those variables tend to be the characteristics or attributes of tourist destinations. Based on the collection approach, data fall into two categories, namely revealed preference and stated preference [27]. So far, related research has covered a great variety of destinations, such as coastal holiday resorts [28], cultural heritage sites [29], and ecological habitats [30]. These studies have offered references to regional or even national policy makers in their coordination and development of scenic attractions, and provided market information to target clients.
Generally speaking, research into tourist behavior has taken into consideration their decision making related to destinations, departure time and mobility. In spite of the insightful interpretation of tourists’ temporal–spatial behavior at city scale, limited by data collection cost and modeling methods, tourist behavior modeling in the early days mainly focused on single choice of destination at the macro level of cities. With the transition of urban development patterns from growth in numbers to quality optimization, and diversification of tourists, it is becoming more and more important to enhance tourism experience at the micro-level of tourists’ behavior [31].
2.2. Factors of Intra-Destination Choice and Willingness to Walk (WTW)
Driven by both actual needs and technological methods, a growing number of studies have begun to focus on intra-destination choice behavior of tourists in such places as scenic areas, large parks, or historic streets. Unlike the hypothesis that tourists had only one single destination in the previous research [32,33], intra-destination choice behavior of tourists features multiple choices for tourists, who tend to visit multiple scenic attractions in the area for a maximum tourism utility [34], i.e., they will have multi-stop behavior. Multi-stop behavior is influenced by not only the individual attributes of tourists, such as their gender, age, and source [35,36], but also the attributes of the scenic attractions [37,38], safety of transportation, comfort of walking environment [39], and some other environmental factors. Additionally, climate change [28], health risk [40], and some other non-spatial factors also impact on the choice of tourists. In addition, the choices of scenic attractions within the area influence each other. For instance, the choice of a particular scenic attraction will enhance the choice utility of the attractions nearby, while reducing the choice utility of the attractions of the same type during the next visit. Lingling Wu has explained the interdependence of destination choices in the study of Tottori Prefecture, Japan, and found that travel time, diversity of destinations, and pursuit of diversity have significantly influenced multi-stop choices [41].
Tourists rely mainly on walking in scenic areas, which is another major feature of their intra-destination behavior. Tourists’ willingness to walk (WTW) has great impacts on the tourist management of scenic area and is highly affected by the walking environment [42]. Many studies focus on the relationship between the environment of scenic area and tourists’ WTW [43]. For instance, one should consider factors from both tourist-level and attraction-level aspects while predicting tourists’ walking trajectories, which can be analyzed using a multicriteria decision-making approach [44]. The factors affecting tourists’ WTW include ticket system, attraction categories, comment rate, tour purpose, and the tourist’s socioeconomic features [45]. Only by integrating these factors into a realistic context can planners measure tourists’ WTW properly. Multi-Stop Behavior Model, MBM, has supported this kind of research greatly. As a variant of Multinomial Logit Model (MNL), MBM is special in that it is based on the hypothesis that individuals are on foot and they will update their spatial location after each stop, thus updating alternative attributes which are influenced by individual’s location and restoring the scenario of their attraction choice in the area. MBM has been widely used to the research into consumer behavior in commercial complexes. For example, Borgers and some other researchers have integrated such variables as total length of repeated routes, line of sight, entrance relations, type of paving, and interface into their studies of the central business districts in the cities of Eindhoven and Maastricht in the Netherlands, trying to create a situation for consumers much similar to the real one [46]. Kemperman and some other researchers have built on such studies by paying attention to the differences between cohorts and making a comparison between consumers with diverse consumption motives (utilitarianism or enjoyment), different degrees of familiarity, and with or without planned route, validating that those factors had significant impact on behavior mechanism [47].
Despite the new perspectives that MBM has brought to studies of intra-destination tourist behavior, most of them have failed to integrate the variables of walking distance and attractions, or analyze the WTW of tourists in different attractions. It is likely that WTW is the comprehensive reflection of their choices of attractions. Therefore, the present paper tried to convert their preferences into WTW, which was analyzed with MBM in the study of multi-stop decision making.
2.3. Impacts of Tourists’ WTW on Ancient Towns in the South of Yangtze River
Ancient towns in the south of the Yangtze River, as a typical historical and cultural heritage unique to China, have been appealing to both domestic and international tourists thanks to their unique culture, customs, and landscape. However, during their development, features such as special hydrology, geography, and narrow streets and lanes there have led to high concentrations of tourists in some attractions, forming a predictable and limited spatial behavior known as “tourismification”, a term coined by Russo in 2002, resulting in uneven distribution of tourists [48], over-crowded attractions [20], and low utilization of some attractions and facilities, jeopardizing the overall interests of the ancient towns. Many stakeholders of the ancient towns have already realized the importance of attraction management, and proposed specific strategies to protect the regional features of the ancient towns, including developing some unpopular attractions [31], creating a strong atmosphere by revitalizing the scenic areas with new elements [49], reinforcing spatial fabric, and controlling tourist arrivals [50].
Despite the fact that an increasing number of scholars have already realized that the importance of tourist preference toward attractions is important for the development of scenic areas, including ancient towns, qualitative and descriptive research into optimization strategy has been prevalent, with little case-based quantitative and comparative research and validation of the strategies through simulation with models, making it difficult to meet the specific needs for comparison of management plans and tourist arrival control. In addition, the environmental and cultural characteristics of ancient towns are apparently different from other types of scenic area. Ancient towns boast special types of attractions, ticket systems, and spatial layouts, which might cause differences in preferences among tourists in ancient towns and other scenic areas. Consequently, it is rather hard to apply existing models to the research on ancient towns. Since walking is prevalent there, how long are the tourists willing to walk? What kind of attractions do they prefer to visit on foot? Will the unpopular attractions become more appealing to the tourists after the optimization of spatial design in the scenic area? To address those problems, planners must further integrate WTW with scenic area management.
3. Methodology
3.1. Study Area and Data Collection
We chose Tongli Ancient Town as the study area, located in Suzhou, Jiangsu Province, China, with more than 1000 years of history. Tongli Ancient Town is known as one of the six major waterside towns in the south of the Yangtze River, in the Provincial-level Unit of Cultural Relics Protection, as a National 5A-class Scenic Area, and the only local ancient town in the province with a World Cultural Heritage site (Tuisi Garden). The core scenic area of Tongli Ancient Town is as large as 0.83 square kilometers, with 9 entrances and 24 main attractions dating back to the Ming and Qing dynasties (Figure 1). Based on the comment preference of tourists on the C-trip website, we classified the attractions into four types, which are listed in Table 1.
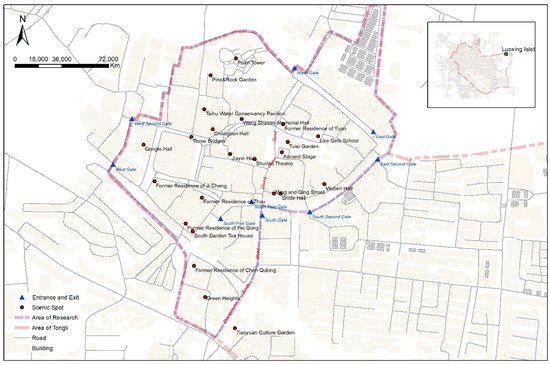
Figure 1.
Study area of Tongli Ancient Town.

Table 1.
Classification of attractions according to C-trip comments.
Our study collected route maps by way of questionnaires from tourists, excluding package tours. There were 277 samples in total, 272 of which were effective, accounting for 98.19%. The questionnaire consisted of three parts: Tongli scenic area tour guide, sightseeing record, and personal information of the tourists. We distributed the questionnaires at the gate of the scenic area, invited tourists to recall their tour routes and collected relevant information related to their tours, including the attractions they had passed or entered, time of arrival, duration, and plan.
3.2. Model Specification
To measure tourists’ willingness to walk (WTW) in the study area, a specific model is necessary to explore the influence of walking distance as well as other factors. For tourist intra-destination choice, our model is based on the random utility framework [51]. Let be the utility for an individual choosing to visit attraction in the scenic area. This can be expressed as:
where is the total number of attractions in the scenic area, and and are the systematic and the random parts of utility. Usually, the random utility follows the Gumbel distribution, and the systematic utility is expressed as a function of attractiveness, accessibility, and other characteristics of attraction as follows:
where denotes the attractiveness related utility, denotes the accessibility related utility, and denotes the utility related to other factors.
Attributes of attractions considered in the study are listed in Table 2. As for the attractiveness of the attractions, we included three attributes: average comment rate , which was collected from the website of www.dianping.com on 15 September 2019; additional check-ins , derived from the unique ticket system in Tongli Ancient Town (tourists are required show their tickets again to enter the attraction, though they are already inside the scenic area); and visited attraction , which equals 1 if attraction has already been visited by tourist . As for the accessibility of the attractions, we included two attributes: walking distance between attraction and the current location of tourist , which is the essential attribute in measuring tourists’ WTW; and average walking accessibility , which is measured using the integration index in Depthmap software. As for other attributes, we included the category of attractions. Three dummy variables were derived from four categories mentioned in Section 3.1. Thus, we treated the category “Former residence” as the reference. Hence, the can be further expressed as a function of follows:
where , , , , , , , and are parameters to be estimated based on observed data.
Table 2.
Attributes of attractions considered in the study.
Our study proposes the Multi-Stop Behavior Model (MBM) to calibrate the aforementioned parameters. MBM is a variant of the Multinomial Logit Model (MNL) widely used in modeling choice behavior. Compared to MNL, MBM considers the interaction between a sequence of choices made by an individual by updating utilities of the latter choices based on the former choices [47]. Moreover, MBM adds a unique alternative into the intra-destination choice set, “leaving”, which is to finish the tour and leave the destination area. For tourist attraction choice in scenic areas, there is another alternative whose systematic utility is noted using . Hence, the utility function in MBM can be defined as follows:
where is the systematic utility of tourist choosing attraction in his/her choice or stop. For a scenic area with attractions, there are alternatives in the choice set, with an additional alternative denoting finishing the tour. We define the utility of choosing “leaving” as linearly related to the total number of attractions visited , weighted by parameter . Moreover, and in Equation (3) become and in MBM, which allows the model to update utilities in each choice iteration.
Since MBM also assumes a Gumbel distributed random utility , the probability of tourist choosing attraction in the choice, given a set of parameters , can be defined as:
where denotes the probability of that single choice, denotes the attraction chosen by tourist , and is the total number of attractions in the scenic area.
Finally, the Log-likelihood of tourist with an observed tour path (including the entrance and a sequence of visited attractions) is defined as follows:
where is the Log-likelihood value and is the total number of visited attractions by tourist . Our model is to calibrate a set of parameters which maximizes the Log-likelihood value. Based on that, we can divide other parameters using the parameter of walking distance to quantify a tourist’s WTW.
3.3. Experimental Design
The willingness to walk (WTW) is calculated as the marginal rate of substitution between each attribute and walking distance , using the following formula:
where denotes a tourist’s WTW for a certain attribute of an attraction, which means the additional distance (in meters) a tourist wants to walk for a one-unit increase in the attribute.
In order to detect preference heterogeneity, the sample was segmented to estimate several MBMs. Our study chose to analyze heterogeneity with several MBMs instead of using more a complicated discrete choice model (e.g., mixed logit or latent class models) since we were interested in developing a tool that could give specific information to specific sample segments and perform simulations quickly. By segmenting the sample, the model could be the most predictively accurate for practical purpose [45,52,53]. Moreover, the WTW of different tourist segments can be compared under the same context. The sample is segmented according to:
- Socio-economic characteristics:Gender: Male (44.4%), Female (54.9%); Age: <30 years (77.9%), ≥30 years (22.1%); Residence: Local residents (69.7%), Non-local residents (30.3%)
- Tour information:Times of visit: First time (59.9%), Second time (40.1%); Duration of visit: Half-day visit (46.6%), Whole-day visit (53.4%); Travel alone: Alone (20.6%), With friends (79.4%); Purchased joint Ticket: JT (53.4%), N-JT (46.6%)
- Travel mode to Tongli Ancient Town:Transit (45.8%), Private car (25.5%), Other modes (28.7%)
- Overall experience:Very satisfied (15.2%), Satisfied (57.8%), Neutral and below (27.0%)
The basic approach of the tourist behavior simulation is illustrated in Figure 2, and can be divided into several steps: (1) assign a gate to tourist based on the gate distribution; (2) calculate the utilities of choosing alternatives ( attractions and “leaving”), transform utilities into probabilities, and select an alternative using Monte Carlo simulation; (3) if the selected alternative is not “leaving”, update the utilities and return back to Step 2; (4) if the selected alternative is “leaving”, finish the simulation of tourist .
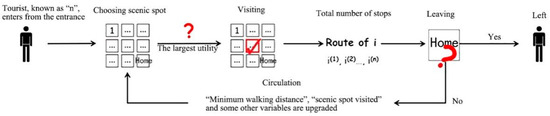
Figure 2.
The flowchart of the tourist behavior simulation.
Based on the simulation approach, our study designed four scenarios to check the effects of three management strategies, which were proposed from the investigation to managers of Tongli Ancient Town (Table 3). The first scenario is the benchmark scenario, which just uses current environment features as a reference. Scenario 1 is to see the effects of adjusting the importance of gates. The percentage of tourists entered from the East Gate and the Wet Gate is set to 40% each. Scenario 2 is to see the effects of improving overall walking environment, such as greater pavement or sanitation. We assume the parameter of walking distance is 0.9 times of the original value. Scenario 3 is to see the effects of improving the attractiveness of rarely visited attractions. A series of adjustment including setting additional check-ins, improving the online comment rate, and attracting specific tourist segments are made. The simulation results are helpful for fostering policy makers’ understanding and prioritizing interventions by providing tourists with services in line with their preferences.
Table 3.
Scenario design.
4. Results
4.1. Descriptive Analysis
The interviews were conducted from summer 2017 to spring 2019 with a sample of 277 tourists, and 272 of them gave effective responses. The sample was composed of 44.4% males and 54.9% females (0.7% no information), and the majority were below 30 years old (77.9%). Figure 3 shows their behavior map in Tongli Ancient Town, which contains information of attraction choice and route choice. The thicker the road segments are, the more often they were chosen. Each pie chart reflects the frequency of an attraction passed (red) or entered (green) by the tourist sample. The larger the pie charts are, the more popular these attractions are. Zhongchuan Road is the most visited road segment by the tourists. The roads connected directly with Zhongchuan Road come next, especially those where Chongben Hall and Three Bridges are situated in. The chances are higher that the attractions along those roads are entered or passed by tourists.
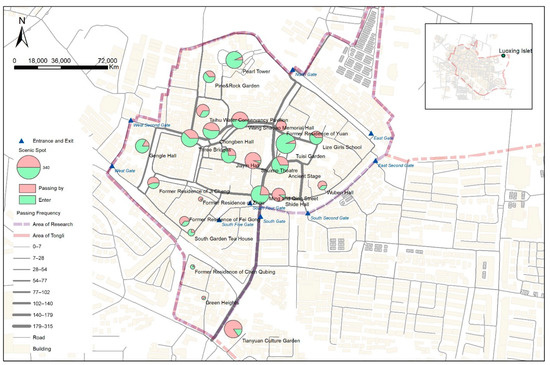
Figure 3.
The behavior map of 272 sampled tourists.
The 24 major attractions in Tongli Ancient Town can be classified into four types according to tourist behavior: (1) the first category has high passing and entering frequency, including Tuisi Garden, Ancient Stage, Jiayin Hall, etc.; these attractions are either cultural relics or must-see attractions popular online, and Most of them are located along the Zhongchuan Road; (2) the second category has high entering frequency while low passing frequency, including Pine and Rock Enlightenment Garden, Luoxing Islet, etc.; spatially, these attractions are poorly accessible since they are far away from the major roads, but their entering frequency is high thanks to their strong cultural appeal to the tourists; (3) the third category has high passing frequency and low entering frequency, represented by Tianyuan Culture Garden and Shuimo Theater; these attractions are more accessible as they are usually adjacent to the main road, but the lack of targeted tourists and interactive activities inside the attractions result in a low entering frequency; and (4) the fourth category has low passing and entering frequency, including South Garden Tea House, Former Residence of Chen Qubing, Former Residence of Ji Cheng, Taihu Water Conservancy Pavilion, etc.; these attractions are located away from the core area, and some of them are not well developed.
In short, Tongli Ancient Town is haunted by problems, such as overcrowded core areas and low-utilized attractions in the peripheral, constraining the development of the scenic area and tourists’ experiences. It is intuitively believed that the existing problems can be mitigated by increasing tourist WTW to low-utilized attractions in the peripheral. To fulfill this, understanding the relationship between tourist WTW and attributes of attractions in Tongli Ancient Town is essential.
4.2. WTW Based on Model Results
MBM models were estimated with MATLAB software using 272 valid interviews. Since each tourist reported several visited attractions in the interview, the total number of observations was 1444. The results of the general model are shown in Table 4. The value of McFadden R-square equals 0.2095, which is slightly larger than the standard value of 0.2. Most of the coefficients are statistically significant and the expected signs, i.e., walking distance, negatively affect utility, while comment rate, additional check-ins, and walking accessibility have a positive effect. Particularly, positive influence of additional check-ins finds expression in two aspects. On the one hand, the information on the tickets guides the choice of tourists. On the other hand, tourists are inclined to make the best use of their tickets’ value. As for the category of attractions, the negative sign of indicates that tourists prefer former residence attractions to architecture landscape attractions, which is probably because they are both indoor attractions, but the former have stronger historical backgrounds. Moreover, the low absolute values of and indicate that tourist have similar tastes for former residence attractions, culture attractions, and garden landscape attractions. The column “b/St.Er.” in Table 4 provides an importance ranking of attributes. The most important attribute is walking distance, which proves that it is indeed an influencing factor on tourists’ choices in the ancient town. Total attractions visited, the attribute unique to alternative “Leaving”, is the second most important, followed by additional check-ins, already visited, and comment rate. The category of attractions is the least important factor.
Table 4.
The results of the Multi-Stop Behavior Model (MBM).
Table 4 reports the WTW of the total tourist sample and the WTW of tourist segments. Results from the MBM using all the sample data suggest that tourists are willing to walk 47.71 m more if the comment rates of attractions increase by one unit, walk 229.2 m more if attractions have additional check-ins, walk 1.06 m more if the walking accessibility increases by one unit, and walk 25.48 m more for culture place attractions (compared to former residence attractions). On the other hand, tourists tend to walk 807.87 m less if the attractions have already been visited, walk 205.15 m less for architecture landscape attractions, and walk 99.62 m less as the total number of visited attractions grows. Several interesting findings came from the results: (1) WTW is a useful indicator not only to reflect tourists’ walking preference, but also to estimate how far tourists are willing to walk to a given attraction, which is important in tourism management; (2) is a quite large negative value, which means tourists are not likely to visit an attraction for the second time; and (3) walking accessibility calculated by Depthmap Software also has the unit “meter”; since the value of is around 1.0, it is possible to place the distance matrix with this aggregated level attribute when the road network is extremely complicated.
By segmenting the sample, the results show both similar tastes for some attributes (i.e., positive effects of comment rate, additional check-ins, walking accessibility) and different tastes for others (i.e., the category of attractions), as shown in Table 5. Female tourists prefer garden landscape and culture place attractions compared to male tourists, and additional check-ins brings a larger utility to them. Younger tourists prefer culture place attractions, while older tourists prefer former residence attractions. Non-local tourists have a lower value compared with local tourists, which means they tend to visit more attractions on the tour. Similarly, tourists who come to Tongli for the first time are willing to visit more attractions compared to second-time tourists, tourists alone are willing to visit more attractions than tourists with friends, and tourists with joint ticket are willing to visit more attractions than tourists without joint tickets. As for travel modes, the absolute WTWs of car tourists are generally smaller than transit tourist, and the absolute WTWs of transit tourists are generally smaller than other modes. This indicates a difference in the importance ranking of walking distance: car > transit > other modes (i.e., walking, bicycle, etc.). It is intuitively reasonable since car drivers might dislike walking and pay more attention to walking distance. Similarly, tourists very satisfied with the tour give walking distance the highest importance, while tourists with a neutral or unsatisfied experience pay the least attention to walking distance. In general, the similarities and disparities among tourist segments give inspiration to implementing more pertinent management strategies.
Table 5.
Willingness to walk (WTW) according to sample segmentation.
4.3. Scenario Simulation
According to the survey among scenic area managers and the analysis in the previous section, the aim of management strategies in Tongli Ancient Town is to (1) increase the overall tourism vitality, and (2) avoid rarely visited or overcrowded attractions. Hence, it is meaningful to check whether the outcomes of proposed strategies are in line with the general aim. Our study conducted behavior simulation for four scenarios, including one benchmark scenario and three scenarios related to three strategies. The benchmark scenario in which no attribute is changed serves as a reference. In Scenario 1, the percentage of tourists entered from the East Gate and the Wet Gate was set to 40% each, representing the adjustment of gate importance. In Scenario 2, the parameter of walking distance was set to 0.9 times of the original value, representing the improvement of overall walking environment. In Scenario 3, we set additional check-ins and increased the comment rate of several rarely visited attractions, and increased tourists with joint tickets (who tend to visit more attractions according to model results) by 20% to represent the attraction to specific tourist segments. In this scenario, we used segmented models.
Our study simulated 500 tourist agents using MATLAB software. The aggregated-level results are shown in Figure 4, in which the results of the benchmark scenario are in blue curves as the reference, and the results of three scenarios are in red curves. The simulation results of Scenario 1 show that the effect of adjusting gate importance is trivial. The number of visited attractions per tourist stands at 5.27, very close to the benchmark scenario. Attractions near the East and West Gates have more tourists entering, but by a small number only. This is probably because tourists will no longer choose attractions in the periphery once they have entered the core area. In that case, adjusting gate importance has limited effects. The simulation results of Scenario 2 show that the improvement of the overall walking environment can help to increase the number of visited attractions per tourist, from 5.27 to 5.39 (2.3%). However, the Gini index of tourist distribution is similar to the benchmark scenario, indicating that tourists are not more evenly distributed after the adjustment. Moreover, improving the overall walking environment requires a large investment, and our study can only provide a rough estimation by tuning down the coefficient of walking distance. The simulation results of Scenario 3 show that increasing the attractiveness of rarely visited attractions (especially increasing percentage of tourist with joint ticket) has the most obvious effect, by increasing the number of visited attractions per tourist from 5.27 to 5.70 (8.2%), at the same time decreasing the Gini index from 0.258 to 0.223. Though the visiting frequency of Shuimo Theater and Tianyuan Culture Garden has obviously increased, accounting for the main proportion of total increase, the overall distribution of tourists is more even than the benchmark scenario. It seems that the third strategy results in the best outcome.
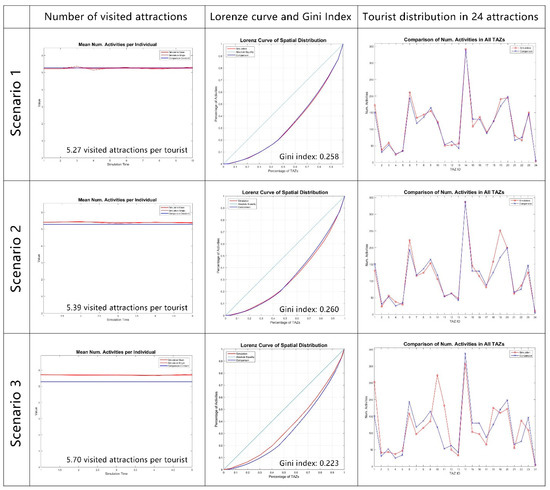
Figure 4.
Simulation results of different scenarios.
The simulation results provide valuable perspectives to tourism managers in Tongli Ancient Town. Adjusting the location of the main gates is a typical strategy to relieve transportation pressure and overcrowding. However, our quantitative evaluation shows that its effect is trivial, at least on tourists’ attraction choice: neither the number of visited attractions per tourist increases, nor does the overall distribution of tourist become more even. As for improving the overall walking environment, though our simulation results proved its effect, detailed cost-effect analyses are necessary to check if the strategy is worthwhile. As for increasing the attractiveness of rarely visited attractions, our results show that it has positive effects on both improving the overall vibrancy and relieving the crowding intensity. Hence, our study contributes to tourism management by quantifying proposed strategies, helping to avoid irrational investments. In that case, tourism managers can review their top-down strategies from the bottom-up lens of tourist behavior.
5. Discussion and Conclusions
The emergence of experience-oriented tourism requires a deeper understanding of tourists’ intra-destination choice behavior. Our study aimed to investigate tourists’ willingness to walk (WTW) to attractions within scenic areas, taking Tongli Ancient Town as an example. We interviewed 272 tourists to collect their tour route-related information, and fit the dataset to Multi-Stop Behavior Models (MBM). We analyzed the WTWs of tourist segments based on model results, and finally evaluated the effects of proposed strategies through behavior simulation. The results complemented the existing literature in several points.
Firstly, our interview provides empirical evidence for the tourist behavior in ancient towns in the south of the Yangtze River. We found that both overcrowded and rarely visited attractions exist in Tongli Ancient Town, indicating that the uneven distribution of tourists is one of the major problems there. To be more specific, tourists prefer attractions in the core area over attractions in the periphery. This calls for building the relationship between tourists’ WTW and attributes of attractions.
Secondly, the model results draw a general picture of how comment rate, additional check-ins, walking distance, and attraction category influence tourists’ choices of attractions. Among these variables, walking distance is the most important one, revealed by the ranking of “b/St.Er.” value, validating our focus on tourist WTW. Moreover, WTWs of tourist segments show both similarities and disparities, inspiring us to implement more pertinent management strategies in line with tourist preferences.
Thirdly, the behavior simulation quantitatively evaluates the effects of proposed strategies, helping managers to pick out the most effective one. According to the scenario comparison, increasing the attractiveness of rarely visited attractions is the most effective strategy. Improving the overall walking environment has some effects, but needs further cost-effect analysis. The effect of adjusting the gate importance is trivial.
We acknowledge that this study has several limitations that are inherently tied to our survey and models. The first limitation is that our sample size is relatively small, which limits multi-segmentation, such as for female tourists with joint tickets, younger tourists with friends, etc. Additionally, the Multi-Stop Behavior Model does not consider correlations between alternatives and choices made by the same tourist, as nested logit (NL) models and mixed logit (ML) models do. However, there might exist inter-attraction or intra-individual heterogeneity. Finally, we only considered three scenarios representing three strategies. More strategies and comprehensive scenarios should be considered. Hence, our future work will focus on enlarging the sample size, adjusting model assumptions to improve the performance, and designing more realistic and on-site scenarios.
Author Contributions
Conceptualization, Y.M., X.R. and D.W.; methodology, Y.M., X.R. and D.W.; software, X.R.; validation, Y.M., X.R. and D.W.; formal analysis, X.R.; investigation, Y.M., L.Y., Q.S. and K.S.; resources, Y.M. and D.W.; data curation, Y.M. and X.R.; writing—original draft preparation, Y.M., X.R., Q.S., K.S. and L.Y.; writing—review and editing, Y.M., X.R., Q.S. and K.S.; visualization, X.R., L.Y., Q.S. and K.S.; supervision, Y.M. and D.W.; project administration, Y.M.; funding acquisition, Y.M. and D.W. All authors have read and agreed to the published version of the manuscript.
Funding
This research was funded by National Natural Science Foundation of China grant number 41971206, National Natural Science Foundation of China grant number 51778384, Jiangsu Provence Association of philosophy and Social Sciences grant number 20SYC-150 and Jiangsu Provence Association of philosophy and Social Sciences grant number 21SYB-002. And The APC was funded by National Natural Science Foundation of China.
Informed Consent Statement
Informed consent was obtained from all subjects involved in the study.
Data Availability Statement
The data presented in this study are available on request from the corresponding author.
Conflicts of Interest
The authors declare no conflict of interest.
References
- Lacher, R.G.; Oh, C.-O.; Jodice, L.W.; Norman, W.C. The Role of Heritage and Cultural Elements in Coastal Tourism Destination Preferences: A Choice Modeling–Based Analysis. J. Travel Res. 2013, 52, 534–546. [Google Scholar] [CrossRef]
- McKercher, B.; Mak, B. The impact of distance on international tourism demand. Tour. Manag. Perspect. 2019, 31, 340–347. [Google Scholar] [CrossRef]
- Tsai, T.H.; Chen, C.M. Evaluating tourists’ preferences for attributes of thematic itineraries: Holy folklore statue in Kinmen. Tour. Manag. Perspect. 2019, 30, 208–219. [Google Scholar] [CrossRef]
- Yu, S.; Zhu, X.; He, Q. An Assessment of Urban Park Access Using House-Level Data in Urban China: Through the Lens of Social Equity. Int. J. Environ. Res. Public Health 2020, 17, 2349. [Google Scholar] [CrossRef] [Green Version]
- De Cantis, S.; Ferrante, M.; Kahani, A.; Shoval, N. Cruise passengers’ behavior at the destination: Investigation using GPS technology. Tour. Manag. 2016, 52, 133–150. [Google Scholar] [CrossRef]
- Shao, Y.; Huang, S.; Wang, Y.; Li, Z.; Luo, M. Evolution of international tourist flows from 1995 to 2018: A network analysis perspective. Tour. Manag. Perspect. 2020, 36, 100752. [Google Scholar] [CrossRef] [PubMed]
- Agapito, D.; do Valle, O.; da Costa Mendes, J. The Cognitive-Affective-Conative Model of Destination Image: A Confirmatory Analysis. J. Travel Tour. Mark. 2013, 30, 471–481. [Google Scholar] [CrossRef]
- Almeida, A.; Garrod, B. Insights from analysing tourist expenditure using quantile regression. Tour. Econ. 2017, 23, 1138–1145. [Google Scholar] [CrossRef]
- Ding, C.; Wang, D.; Liu, C.; Zhang, Y.; Yang, J. Exploring the influence of built environment on travel mode choice considering the mediating effects of car ownership and travel distance. Transp. Res. Part A Policy Pract. 2017, 100, 65–80. [Google Scholar] [CrossRef]
- Qi, C.; Zhu, Z.; Guo, X.; Lu, R.; Chen, J. Examining Interrelationships between Tourist Travel Mode and Trip Chain Choices Using the Nested Logit Model. Sustainability 2020, 12, 7535. [Google Scholar] [CrossRef]
- Bi, J.; Lehto, X.Y. Impact of cultural distance on international destination choices: The case of Chinese outbound travelers. Int. J. Tour. Res. 2017, 20, 50–59. [Google Scholar] [CrossRef]
- Breidert, C.; Hahsler, M.; Reutterer, T. A review of methods for measuring willingness-to-pay. Innov. Mark. 2006, 2, 8–32. [Google Scholar]
- Homburg, C.; Koschate, N.; Hoyer, W.D. Do Satisfied Customers Really Pay More? A Study of the Relationship between Customer Satisfaction and Willingness to Pay. J. Mark. 2005, 69, 84–96. [Google Scholar] [CrossRef]
- Stanesby, O.; Morse, M.; Magill, L.; Ball, K.; Blizzard, L.; Harpur, S.; Jose, K.; Lester, D.; Marshall, E.; Palmer, A.J.; et al. Characteristics associated with willingness to walk further than necessary to the bus stop: Insights for public transport-related physical activity. J. Transp. Health 2021, 22, 101139. [Google Scholar] [CrossRef]
- Sukor, N.S.A.; Fisal, S.F.M. Factors influencing the willingness to walk to the bus stops in Penang island. Plan. Malays. 2018, 16, 193–204. [Google Scholar] [CrossRef]
- Zacharias, J.; Wang, B. Willingness to walk in underground space—Evidence from Singapore. IOP Conf. Ser. Earth Environ. Sci. 2021, 703, 012002. [Google Scholar] [CrossRef]
- Yang, C.H.; Lin, H.L.; Han, C.C. Analysis of international tourist arrivals in China: The role of World Heritage Sites. Tour. Manag. 2010, 31, 827–837. [Google Scholar] [CrossRef] [PubMed]
- Ruan, Y.; Yuan, F. On historic towns conservation—Conservation and development of historic water towns south of the Yangtze river. Urban Plan. Forum 2011, 5, 95–101. [Google Scholar]
- Van Der Zee, E.; Bertocchi, D.; Nl, E.L.V.; Van Der Zee, E.; Bertocchi, D. Finding patterns in urban tourist behaviour: A social network analysis approach based on TripAdvisor reviews. Inf. Technol. Tour. 2018, 20, 153–180. [Google Scholar] [CrossRef]
- Jiang, J.; Shao, Y.; Song, J. A study on tourism transport organization pattern of historic water towns in the south of Yangtze river. City Plan. Rev. 2015, 39, 107–112. [Google Scholar]
- Lupu, C.; Padhi, S.S.; Pati, R.K.; Stoleriu, O.M. Tourist choice of heritage sites in Romania: A conjoint choice model of site attributes and variety seeking behavior. J. Herit. Tour. 2020, 16, 646–668. [Google Scholar] [CrossRef]
- Anderson, N.H. Functional measurement and psychophysical judgment. Psychol. Rev. 1970, 77, 153–170. [Google Scholar] [CrossRef]
- Luce, R.D. Individual Choice Behavior: A Theoretical Analysis; Courier Corp: Chelmsford, MA, USA, 1959. [Google Scholar]
- Thurstone, L.L. A law of comparative judgment. Psychol. Rev. 1927, 34, 273–286. [Google Scholar] [CrossRef]
- Louviere, J.J.; Hout, M. Analyzing Decision Making: Metric Conjoint Analysis; SAGE Publications: Thousand Oaks, CA, USA, 1988. [Google Scholar]
- Timmermans, H. Consumer choice of shopping centre: An information integration approach. Reg. Stud. 1982, 3, 171–182. [Google Scholar] [CrossRef]
- Kroes, E.P.; Sheldon, R.J. Stated Preference Methods: An Introduction. J. Transp. Econ. Policy 1988, 22, 11–25. [Google Scholar]
- Seekamp, E.; Jurjonas, M.; Bitsura-Meszaros, K. Influences on coastal tourism demand and substitution behaviors from climate change impacts and hazard recovery responses. J. Sustain. Tour. 2019, 27, 629–648. [Google Scholar] [CrossRef]
- Choi, A.S.; Ritchie, B.W.; Papandrea, F.; Bennett, J. Economic valuation of cultural heritage sites: A choice modeling approach. Tour. Manag. 2010, 31, 213–220. [Google Scholar] [CrossRef]
- Lee, C.-K.; Lee, J.-H.; Kim, T.-K.; Mjelde, J.W. Preferences and willingness to pay for bird-watching tour and interpretive services using a choice experiment. J. Sustain. Tour. 2010, 18, 695–708. [Google Scholar] [CrossRef]
- Li, Y.; Xiao, L.; Ye, Y.; Xu, W.; Law, A. Understanding tourist space at a historic site through space syntax analysis: The case of Gulangyu, China. Tour. Manag. 2016, 52, 30–43. [Google Scholar] [CrossRef]
- Lue, C.C.; Crompton, J.L.; Fesenmaier, D.R. Conceptualization of multi-destination pleasure trips. Ann. Tour. Res. 1993, 20, 289–301. [Google Scholar] [CrossRef]
- Tideswell, C.; Faulkner, B. Identifying antecedent factors to the traveler’s pursuit of a multidestination travel itinerary. Tour. Anal. 2003, 7, 177–190. [Google Scholar] [CrossRef]
- Smith, S.L.J. Recreation Geography; Longman Group Limited: London, UK, 1983. [Google Scholar]
- Han, H.; Yu, J.; Kim, W. Investigating airline customers’ decision-making process for emerging environmentally-responsible electric airplanes: Influence of gender and age. Tour. Manag. Perspect. 2019, 31, 85–94. [Google Scholar] [CrossRef]
- Park, J.; Musa, G.; Moghavvemi, S.; Thirumoorthi, T.; Taha, A.Z.; Mohtar, M.; Sarker, M.M. Travel motivation among cross border tourists: Case study of Langkawi. Tour. Manag. Perspect. 2019, 31, 63–71. [Google Scholar] [CrossRef]
- Bekk, M.; Spörrle, M.; Kruse, J. The Benefits of Similarity between Tourist and Destination Personality. J. Travel Res. 2016, 55, 1008–1021. [Google Scholar] [CrossRef]
- Leung, Y.F.; Marion, J.L. Characterizing backcountry camping impacts in Great Smoky Mountains National Park, USA. J. Environ. Manag. 1999, 57, 193–203. [Google Scholar] [CrossRef]
- Samarasekara, G.N.; Fukahori, K.; Kubota, Y. Environmental Correlates That Provide Walkability Cues for Tourists: An Analysis Based on Walking Decision Narrations. Environ. Behav. 2011, 43, 501–524. [Google Scholar] [CrossRef]
- Karl, M.; Muskat, B.; Ritchie, B.W. Which travel risks are more salient for destination choice? An examination of the tourist’s decision-making process. J. Destin. Mark. Manag. 2020, 18, 100487. [Google Scholar] [CrossRef]
- Wu, L.; Zhang, J.; Fujiwara, A. A Tourist’s Multi-Destination Choice Model with Future Dependency. Asia Pac. J. Tour. Res. 2012, 17, 121–132. [Google Scholar] [CrossRef]
- Cao, J.; Zhang, J.; Wang, C.; Hu, H.; Yu, P. How Far Is the Ideal Destination? Distance Desire, Ways to Explore the Antinomy of Distance Effects in Tourist Destination Choice. J. Travel Res. 2020, 59, 614–630. [Google Scholar] [CrossRef]
- McKercher, B. The impact of distance on tourism: A tourism geography law. Tour. Geogr. 2018, 20, 905–909. [Google Scholar] [CrossRef]
- Sayyadi, G.; Awasthi, A. AHP-Based Approach for Location Planning of Pedestrian Zones: Application in Montréal, Canada. J. Transp. Eng. 2012, 139, 239–246. [Google Scholar] [CrossRef]
- Le Pira, M.; Marcucci, E.; Gatta, V. Roman holiday: Tourist heterogeneous preferences for walking path elements. Res. Transp. Econ. 2021, 101106. [Google Scholar] [CrossRef]
- Borgers, A.; Timmermans, H. Modeling pedestrians’ shopping behavior in downtown areas. In Proceedings of the 14th Conference on Computers in Urban Planning and Urban Management, Cambridge, MA, USA, 7–10 July 2015. [Google Scholar]
- Kemperman, A.D.; Borgers, A.W.; Oppewal, H.; Timmermans, H.J. Consumer choice of theme parks: A conjoint choice model of seasonality effects and variety seeking behavior. Leis. Sci. 2000, 22, 1–18. [Google Scholar] [CrossRef]
- Zee E van der Bertocchi, D.; Vanneste, D. Distribution of tourists within urban heritage destinations: A hot spot/cold spot analysis of TripAdvisor data as support for destination management. Curr. Issues Tour. 2018, 23, 175–196. [Google Scholar] [CrossRef] [Green Version]
- Xiang, X.R.; Li, L. Discussion on the succession and development of history and cultural context in ancient—Town··type scenic spots—Case study on Tongli scenic spot in Suzhou of Taihu lake famous scenic sites. Chin. Landsc. Archit. 2011, 27, 78–81. [Google Scholar]
- Zhang, L.; Yang, K.; Liu, B.Y.; Liu, S.Y.A. study on the regional characteristics perception of ancient towns in the south of the Yangtze river based on different perspectives of tourists and residents: A case study of Tongli ancient town. Chin. Landsc. Archit. 2019, 35, 10–16. [Google Scholar]
- Marschak, J. Binary choice constraints on random utility indicators. Cowles Found. Res. Econ. 1959, 7, 218–239. [Google Scholar]
- Brida, J.G.; Osti, L.; Barquet, A. Segmenting resident perceptions towards tourism—A cluster analysis with a multinomial logit model of a mountain community. Int. J. Tour. Res. 2010, 12, 591–602. [Google Scholar] [CrossRef]
- Kim, S.S.; Lee, H.; Chon, K.-S. Segmentation of Different Types of Hallyu Tourists Using a Multinomial Model and Its Marketing Implications. J. Hosp. Tour. Res. 2010, 34, 341–363. [Google Scholar] [CrossRef]
Publisher’s Note: MDPI stays neutral with regard to jurisdictional claims in published maps and institutional affiliations. |
© 2021 by the authors. Licensee MDPI, Basel, Switzerland. This article is an open access article distributed under the terms and conditions of the Creative Commons Attribution (CC BY) license (https://creativecommons.org/licenses/by/4.0/).