Article

LEADER Program—An Inclusive or Selective Instrument for the Development of Rural Space in Romania?

Department of Geography, Faculty of Geography and Geology, Alexandru Ioan Cuza University of Iasi, 700506 Iași, Romania
*
Author to whom correspondence should be addressed.
Sustainability 2021, 13(21), 12187; https://doi.org/10.3390/su132112187
Submission received: 3 October 2021 / Revised: 1 November 2021 / Accepted: 2 November 2021 / Published: 4 November 2021
(This article belongs to the Section Sustainable Urban and Rural Development)

Abstract

:
The LEADER program is one of the European Union’s financing instruments dedicated to the development of the rural communities. The instrument was introduced in the Romanian rural territory in 2007, a territory characterised by a high level of local and regional economic inequalities. The main goal of the present research is to question whether the development level specific to the rural communities have influenced their performance in managing the LEADER program. In order to answer this question, the characteristics of the initial level of development were analysed in relation to the spatial distribution of LEADER funds. The indicators taken into consideration were the number of projects, funds per capita, funds per Local Action Group (LAG), and the percentage of employees from the total population. In order to assess the relation between the initial level of development and the LAG’s performance, the method used was the Ordinary Least Squares regression, which calculates a set of statistical parameters that highlight the presence, form, sense, and intensity of the dependency relation. The results highlight no correlation between the level of development and the spatial distribution of the LEADER funds. Analysing the data, the paper reveals that the LEADER program is an inclusive rather than a selective instrument for the development of Romanian rural communities, despite other examples researched in Western countries. The results show that the LEADER program can have an influence in reducing the rural disparities, but its effects are of low importance.

1. Introduction

Sustainable rural development continues to be a researched topic throughout the European Union, both in its developed countries and especially in the developing ones. The reason for this lies in the interregional economic and social gaps at the level of the European Union that manifest at all scales [1]. The European Union aims to address these issues by promoting sustainable development that brings to rural areas changes in the field of agricultural society by meeting a common set of development goals based on people’s needs [2]. These development objectives aim at reducing poverty, inequality, unemployment, ensuring the basic needs of the disadvantaged population, and increasing the participation of the community in the rural development process [3] but especially reducing the development gaps.
The desire to reduce the economic and social gaps has led to the emergence of numerous instruments of financial assistance addressed to the European Union Member States. The LEADER program represents one of these financial instruments made available to European rural areas since 1991, and to the Romanian rural area starting from 2007, the year of Romania’s accession to the European Union. The program is aimed at financing projects for the development of rural areas but especially at stimulating territorial cooperation, increasing the degree of collaboration between local actors [4] in order to identify sustainable solutions to common problems. Compared to other development programs, LEADER differs in the sense that its main focus is on introducing a new model of local governing and supporting innovative projects that could become triggers of development. Thus, the contribution it brings to the development of rural areas is more a qualitative one. The objectives of the LEADER program correspond to those of sustainable rural development, which aims at both economic stimulation and the improvement of living conditions. According to Macken-Walsh [5], the LEADER program is a multidimensional process that aims to create connections and make accessible the links between economic, socio-cultural, and environmental objectives of rural communities. The bottom-up approach, the collaboration between local actors and ensuring a balance between the economic, sociocultural and environmental directions are thus considered key elements leading to the sustainable development of rural areas. However, as stated by Lopolito et al. [6], LEADER has the merit of providing support to rural communities in finding the way to sustainable development [7] but without indicating what actions need to be taken to achieve this goal. Summarising the previous idea, we can say that the LEADER program responds to “how we should act” rather than “what should be done” for the sustainable development of rural areas [4,8].
In order to implement the LEADER program, and especially to achieve its objectives, new territorial administration bodies were set up at the local level, namely, Local Action Groups (LAGs) that are meant to create the favourable premises for sustainable development [9]. The role of LAGs is that of determining the development directions in consultation with local actors, promoting the exchange of good practices between local stakeholders, increasing the level of collaboration, stimulating innovation, reducing economic and social development gaps, and increasing the efficiency of the governance capacity of rural communities [10,11,12,13,14].
Despite efforts to provide development support to European rural areas through the LEADER program, studies researching the results of LEADER indicate a reduced capacity of the program to contribute to the goal of developing disadvantaged rural communities [15,16,17]. Thus, Cañete et al. [18], Christodoulakis and Kalyvitis [19], Medeiros [20], Bakucs et al. [21], Lacquement et al. [15], and Bohlin et al. [22], conducting research on the results of the LEADER program but also on other similar instruments in different European Union countries (Spain, Sweden, Hungary, Greece, Portugal, France, etc.), conclude that there are a number of factors that affect community development, the influence of European funding being often small or insignificant. In the case of the LEADER program, one of the factors that explains the insignificant contribution brought to the development of rural areas is the low amount of funding allocated compared to other development programs. That is because LEADER was designed more as a support tool for innovative development projects and for introducing a new model of local governance (bringing qualitative change) and less as a financial tool able to solve all the development problems of rural areas (bringing less quantitative change). Moreover, the inequitable distribution of funds between regions and the low efficiency of the local communities in managing the funds are other factors that diminish the program’s potential to contribute mainly to the development of disadvantaged rural communities.
Taking all the above into account, the present research goes forward carrying out an extended analysis of the capacity of rural communities to take advantage of the opportunities provided by European financial instruments. Therefore, the goal of the present paper is to assess the extent to which the initial level of development of rural areas can be a factor of influence on the rural community’s performance to absorb LEADER funds. For this, the relationship between the initial level of development of the Romanian rural area and the LEADER funds allocated per capita will be analysed. The hypothesis of the paper is that there is a strong relationship between the two. We assume that a higher level of development leads to a greater involvement of the rural areas in the LEADER program and therefore more projects and a higher degree of absorption of funds. At the basis of this hypothesis lie the results of previous research studies that often demonstrate the failure of the LEADER program to direct its funds towards its main target, namely, less-developed rural communities [15,16,18,23,24]. This is mostly because of the developed regions that frequently prove to be more interested in implementing LEADER projects and absorbing the program’s funds.
In order to verify the validity of this statement, several steps will be followed, which represent the main objectives of this study. These consist in (1) characterising the Romanian rural area’s level of development prior to the LEADER financing, (2) analysing the spatial distribution of submitted projects and LEADER funds accessed at LAGs level, and (3) determining the relationship between the initial development level of LAGs and the per capita LEADER funds allocated at the LAG level using spatial statistics tools. All this will highlight the behaviour of the LEADER program to be a selective or an inclusive tool and the ability of the initial development context of the LAGs to influence this behaviour.
The first section of the paper presents a review of the existing literature on the LEADER program and its ability to contribute to the development of disadvantaged rural areas. Subsequently, the study area on which this paper focuses and the applied methodology are presented. The third section of the paper focuses on the results of the study, these being divided into three subsections as follows: (1) the rural areas’ level of development before the LEADER financing, (2) the quantitative results of the LEADER program in Romania, and (3) the relationship between the level of development prior to the implementation of the LEADER program and the funds allocated at the LAG level. The paper concludes with the presentation of the main findings and the answer to the initially stated hypothesis.

Literature Review

The researchers’ interest in studying the LEADER program as a development tool is considerable, over time being written various scientific papers in which the main concern was the evaluation of the program’s results at the level of the rural communities [25,26,27,28]. The studies carried out so far highlight the role of the LEADER program and its capacity to stimulate rural development. However, there are some obstacles to the proper implementation of the program, often noting differences in the management and approach of the LEADER program at different scales of analysis [15,17,22]. In this respect, from the first years of the introduction of the program, there have been initiatives to evaluate its results and especially to identify its weaknesses. There are researchers who have adopted in their scientific papers quantitative [15,16,18,23] or qualitative [9,10,13,14] methods to evaluate the results of the LEADER initiative, although the frequency of studies on this topic is not as high as expected. In addition, in some European countries (such as Romania) the scientific research focused on isolated case studies conducted on a limited number of LAGs dominates [15,16,23,28,29,30,31]. Thus, the conclusions of those studies cannot be of general application, therefore it is necessary to carry out more extensive studies in which the analysis of the LEADER program should be performed in an integrated manner on a national scale.
The research studies that focus on assessing the contribution of the European financial instrument to the development of rural areas frequently highlight a significant contribution of the LEADER program brought to the more developed communities [18,23,24], while the contribution to severely disadvantaged areas appears to be lower [30]. Cañete, Navarro and E. Cejudo [18], evaluating the effects of the LEADER and PRODER initiatives (Spain’s operational rural development program) on Andalusian communities, note that the funds of the two rural development programs were absorbed mainly by the same more developed territories. The results of their research underlined the failure of the two funding instruments in achieving their objective insofar as the benefits brought to the isolated, depopulated, and heavily underdeveloped territories were minimal. The effect of the development programs was to accentuate the pre-existing disparities between rural communities, the cause of the failure being the fictitious involvement of the local community in establishing the allocation of funds and the excessive involvement of public authorities with decision-making power [32]. The impact of the LEADER and PRODER initiatives was both economic and societal but with a positive meaning only for the most developed rural areas in the region. This shows that an economically unstructured territory is able only to partially absorb these European funds for various reasons related to poor development, including institutional or lack of actors’ involvement. Another study that deals with the same subject of the impact assessment of LEADER projects [24] brings a novelty to the previously cited study, assessing the demographic impact along with the socio-economic one. The research findings show, as in the previously cited study of Cañete et al. [18], that the role of the LEADER program was once again misunderstood, the benefits being brought only to the more developed rural areas, an aspect which can contribute to the accentuation of the inter-rural gaps. It is not only the Spanish territory that seems to have faced problems in the management of LEADER funds. Studies conducted not only on the results of the LEADER program but also on other European Structural Funds in other EU countries tend to highlight the same idea of their low effectiveness in supporting disadvantaged rural communities, the main target of development programs. Thus, Capros and Karadeloglou [33] measured the effects of European funds on the Greek economy and found that they led to an increase in production but were lower compared to the rest of European countries. This means that the gaps between EU countries in terms of the levels of development will widen even more over time because of the differences from state to state in the efficiency of European funds management. This idea is reaffirmed by Lacquement et al. [15], who, analysing the activity of two LAGs belonging to different states (Spain and France), conclude that of major importance is the territorial context in which the new associations created through LEADER are developed. Thus, they note that the LAGs composed predominantly by hard-to-reach, sparsely populated, and poorly performing rural areas are less interested in implementing LEADER projects, unlike LAGs in the vicinity of developed urban centres. Moreover, the difference between the two types of LAGs presented above is visible not only in terms of the number of projects implemented but also in terms of the types of projects. While hard-to-reach and severely disadvantaged LAGs have a tendency to finance mainly basic infrastructure modernisation projects, hard-type projects, those LAGs that enjoy the proximity of economically efficient urban territories finance innovative projects, soft-type projects, in a larger proportion. These differences in behaviour lead to different levels of efficiency of the LEADER program in achieving its objectives.
Therefore, most of the studies that focus on the evaluation of the LEADER program’s results, but also of other European development programs, reach similar conclusions. These conclusions underline their low efficiency in supporting severely disadvantaged rural areas, the main target of development programs, thus indicating a selective behaviour of the programs, but in favour of the already developed regions. According to Shucksmith et al. [34], this selective behaviour seems to have been specific to the LEADER program at least until the end of the fourth funding period in Europe, as it has focused mainly on supporting the more active and developed communities in the detriment of the strongly disadvantaged groups. Most of these studies are analysing the results of the LEADER program at the level of some European countries such as Spain [10,15,16,17,18,23,24,32,35], Germany [7,17], Italy [28,36], France [15,37,38], United Kingdom [30,32,34], or Denmark [13,39] that have benefited from this financial support since the first years of the implementation of the LEADER program, when experience in managing funds was low, which explains some of the mistakes in its implementation. However, with the end of the first LEADER funding periods, the main dysfunctions were identified. To what extent have they been ameliorated, if not completely eliminated, in the following LEADER programs? An answer to this question could be provided by analysing the results of the latest LEADER funding periods recorded in a European country where the implementation of this program is more recent. Thus, the present study can meet this need insofar as it seeks to analyse the results of the last two LEADER financing periods, 2007–2013 and 2014–2020, in Romania, a state integrated into the European Union more recently that is facing strong development gaps and that has implemented the LEADER program later then the aforementioned European countries. This study could highlight if the conclusions of the previous research studies conducted on the more experienced Western countries have been taken into consideration for a better management of the LEADER program. Until present, there were conducted a few research studies on the theme of the LEADER program in Romania and the LAGs’ mode of operation, but most of them concentrate on isolated case studies [29,32,36,40,41]. The present study seeks to complement the existing scientific literature by creating a broader, general picture of the results of the LEADER initiative at national scale and by highlighting its achievements in sustaining the less developed rural communities.

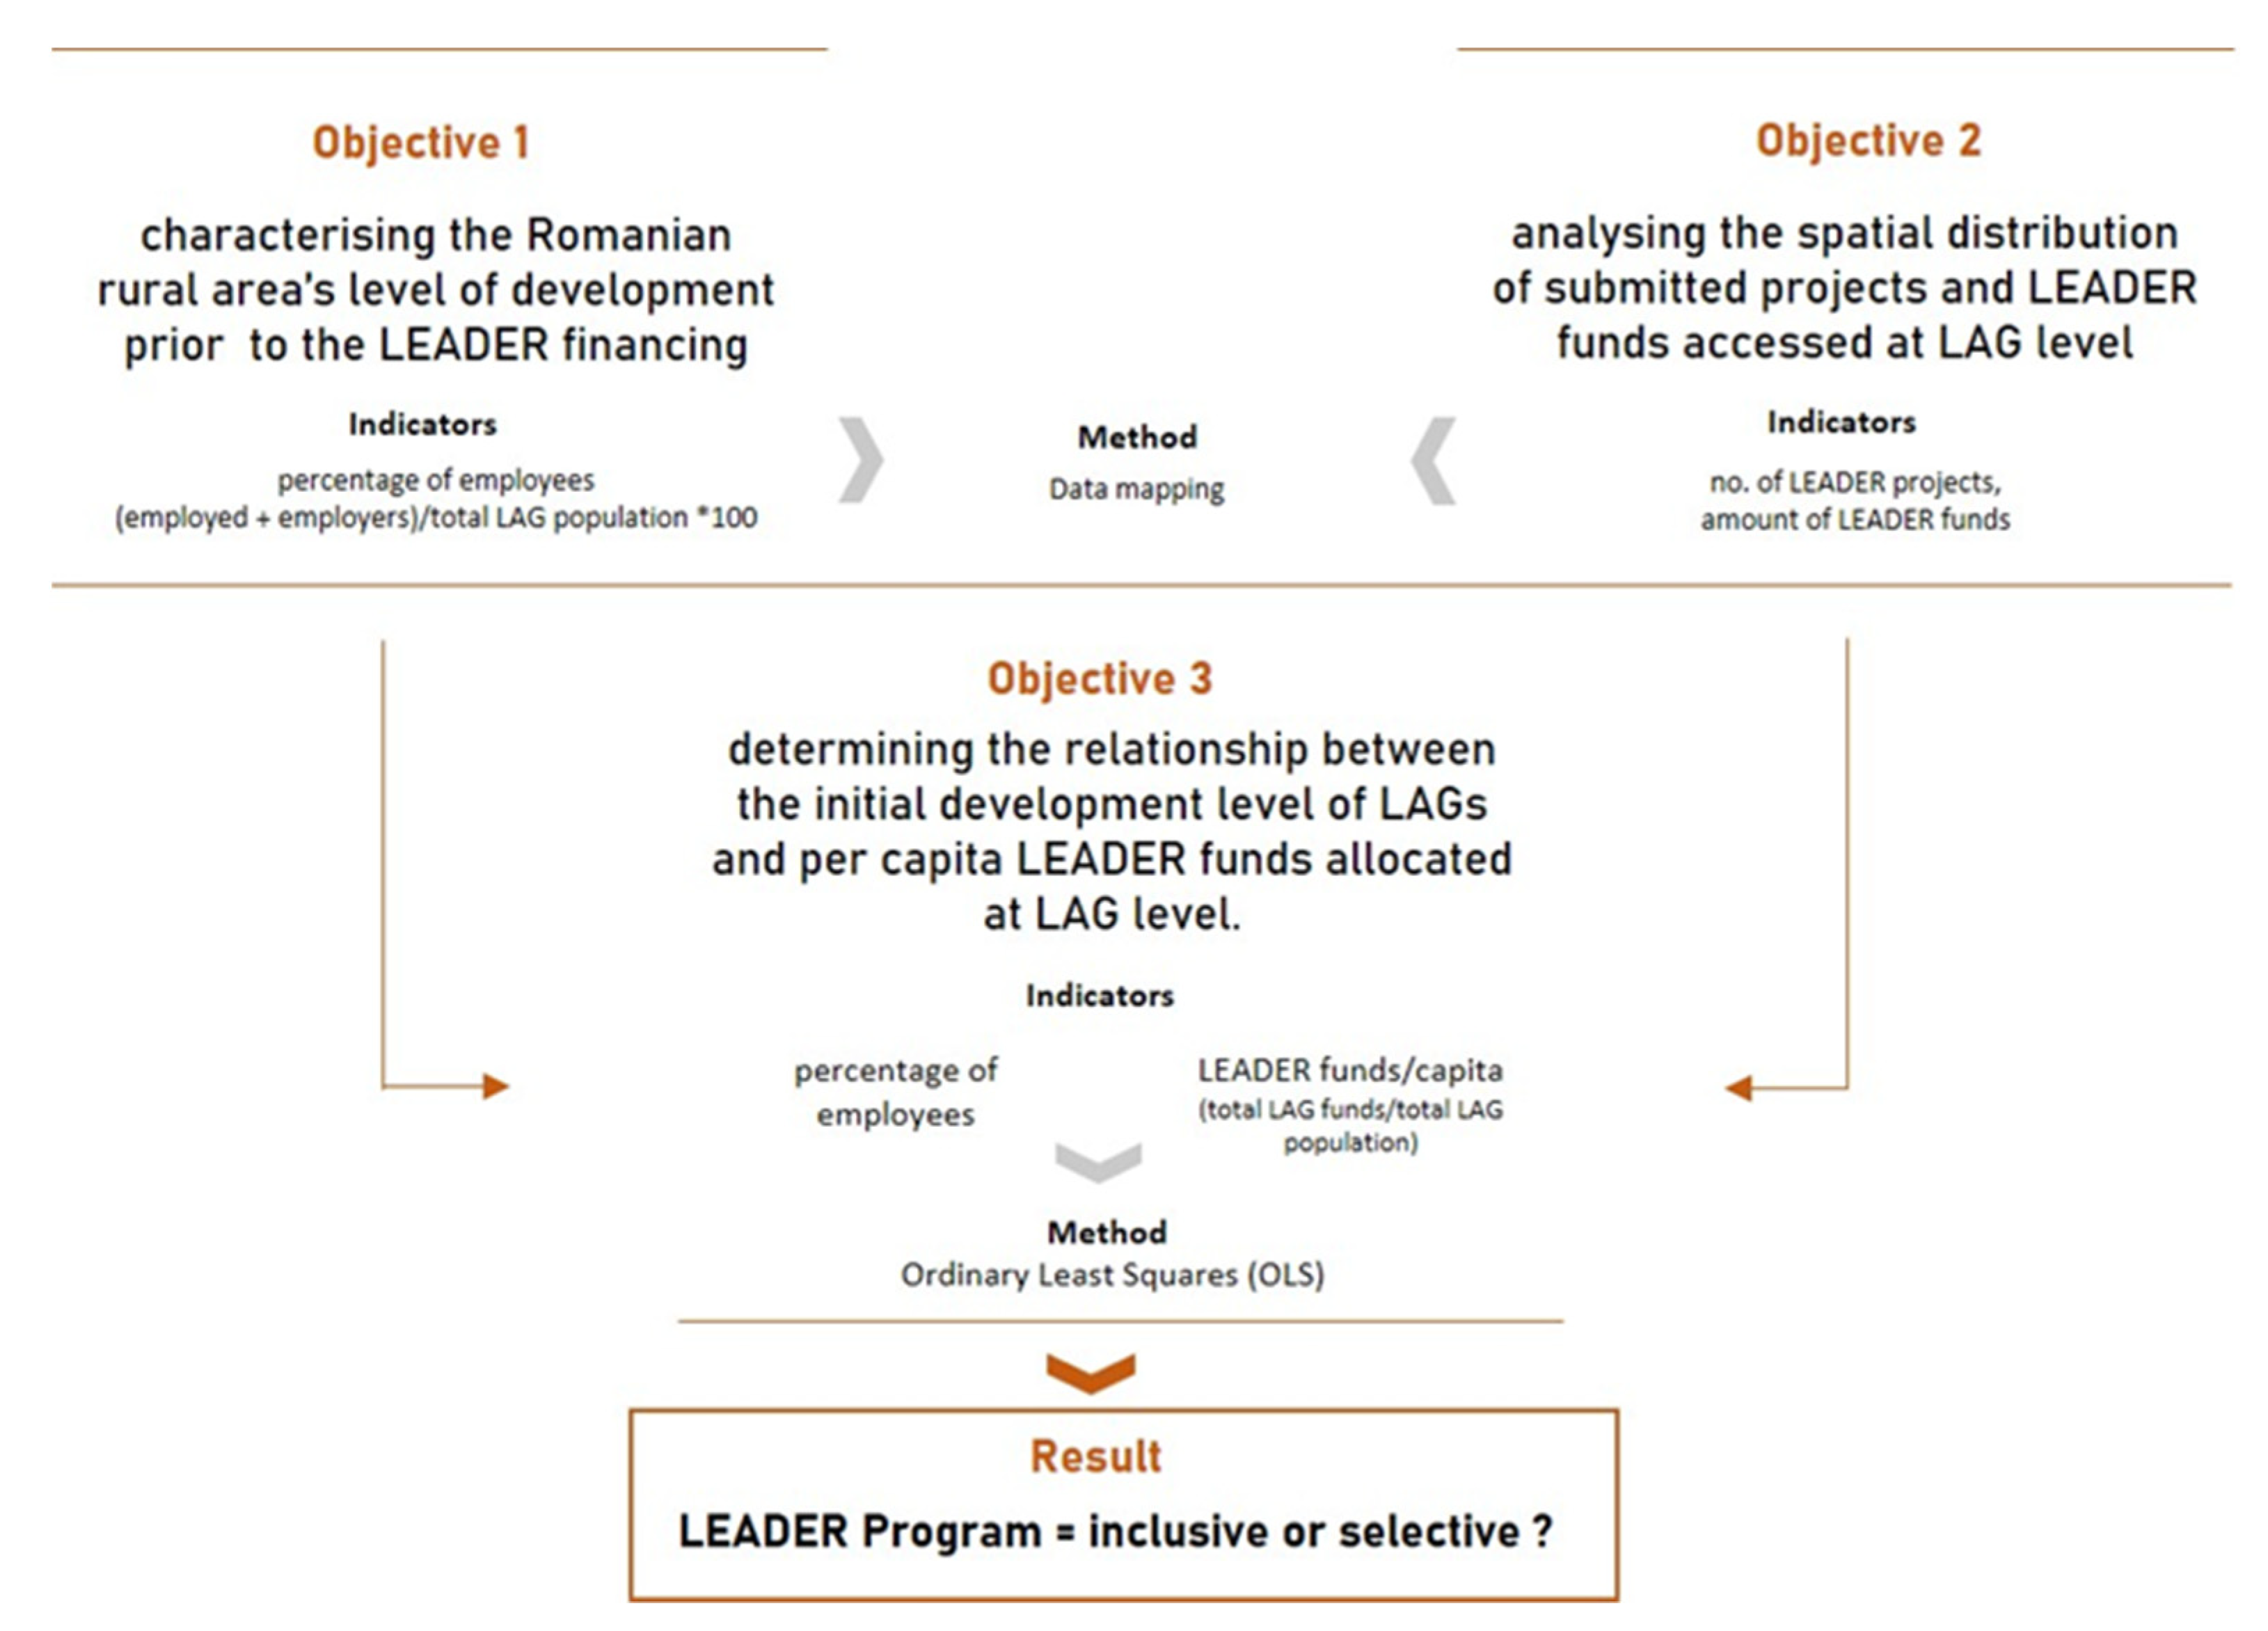
2. Materials and Methods
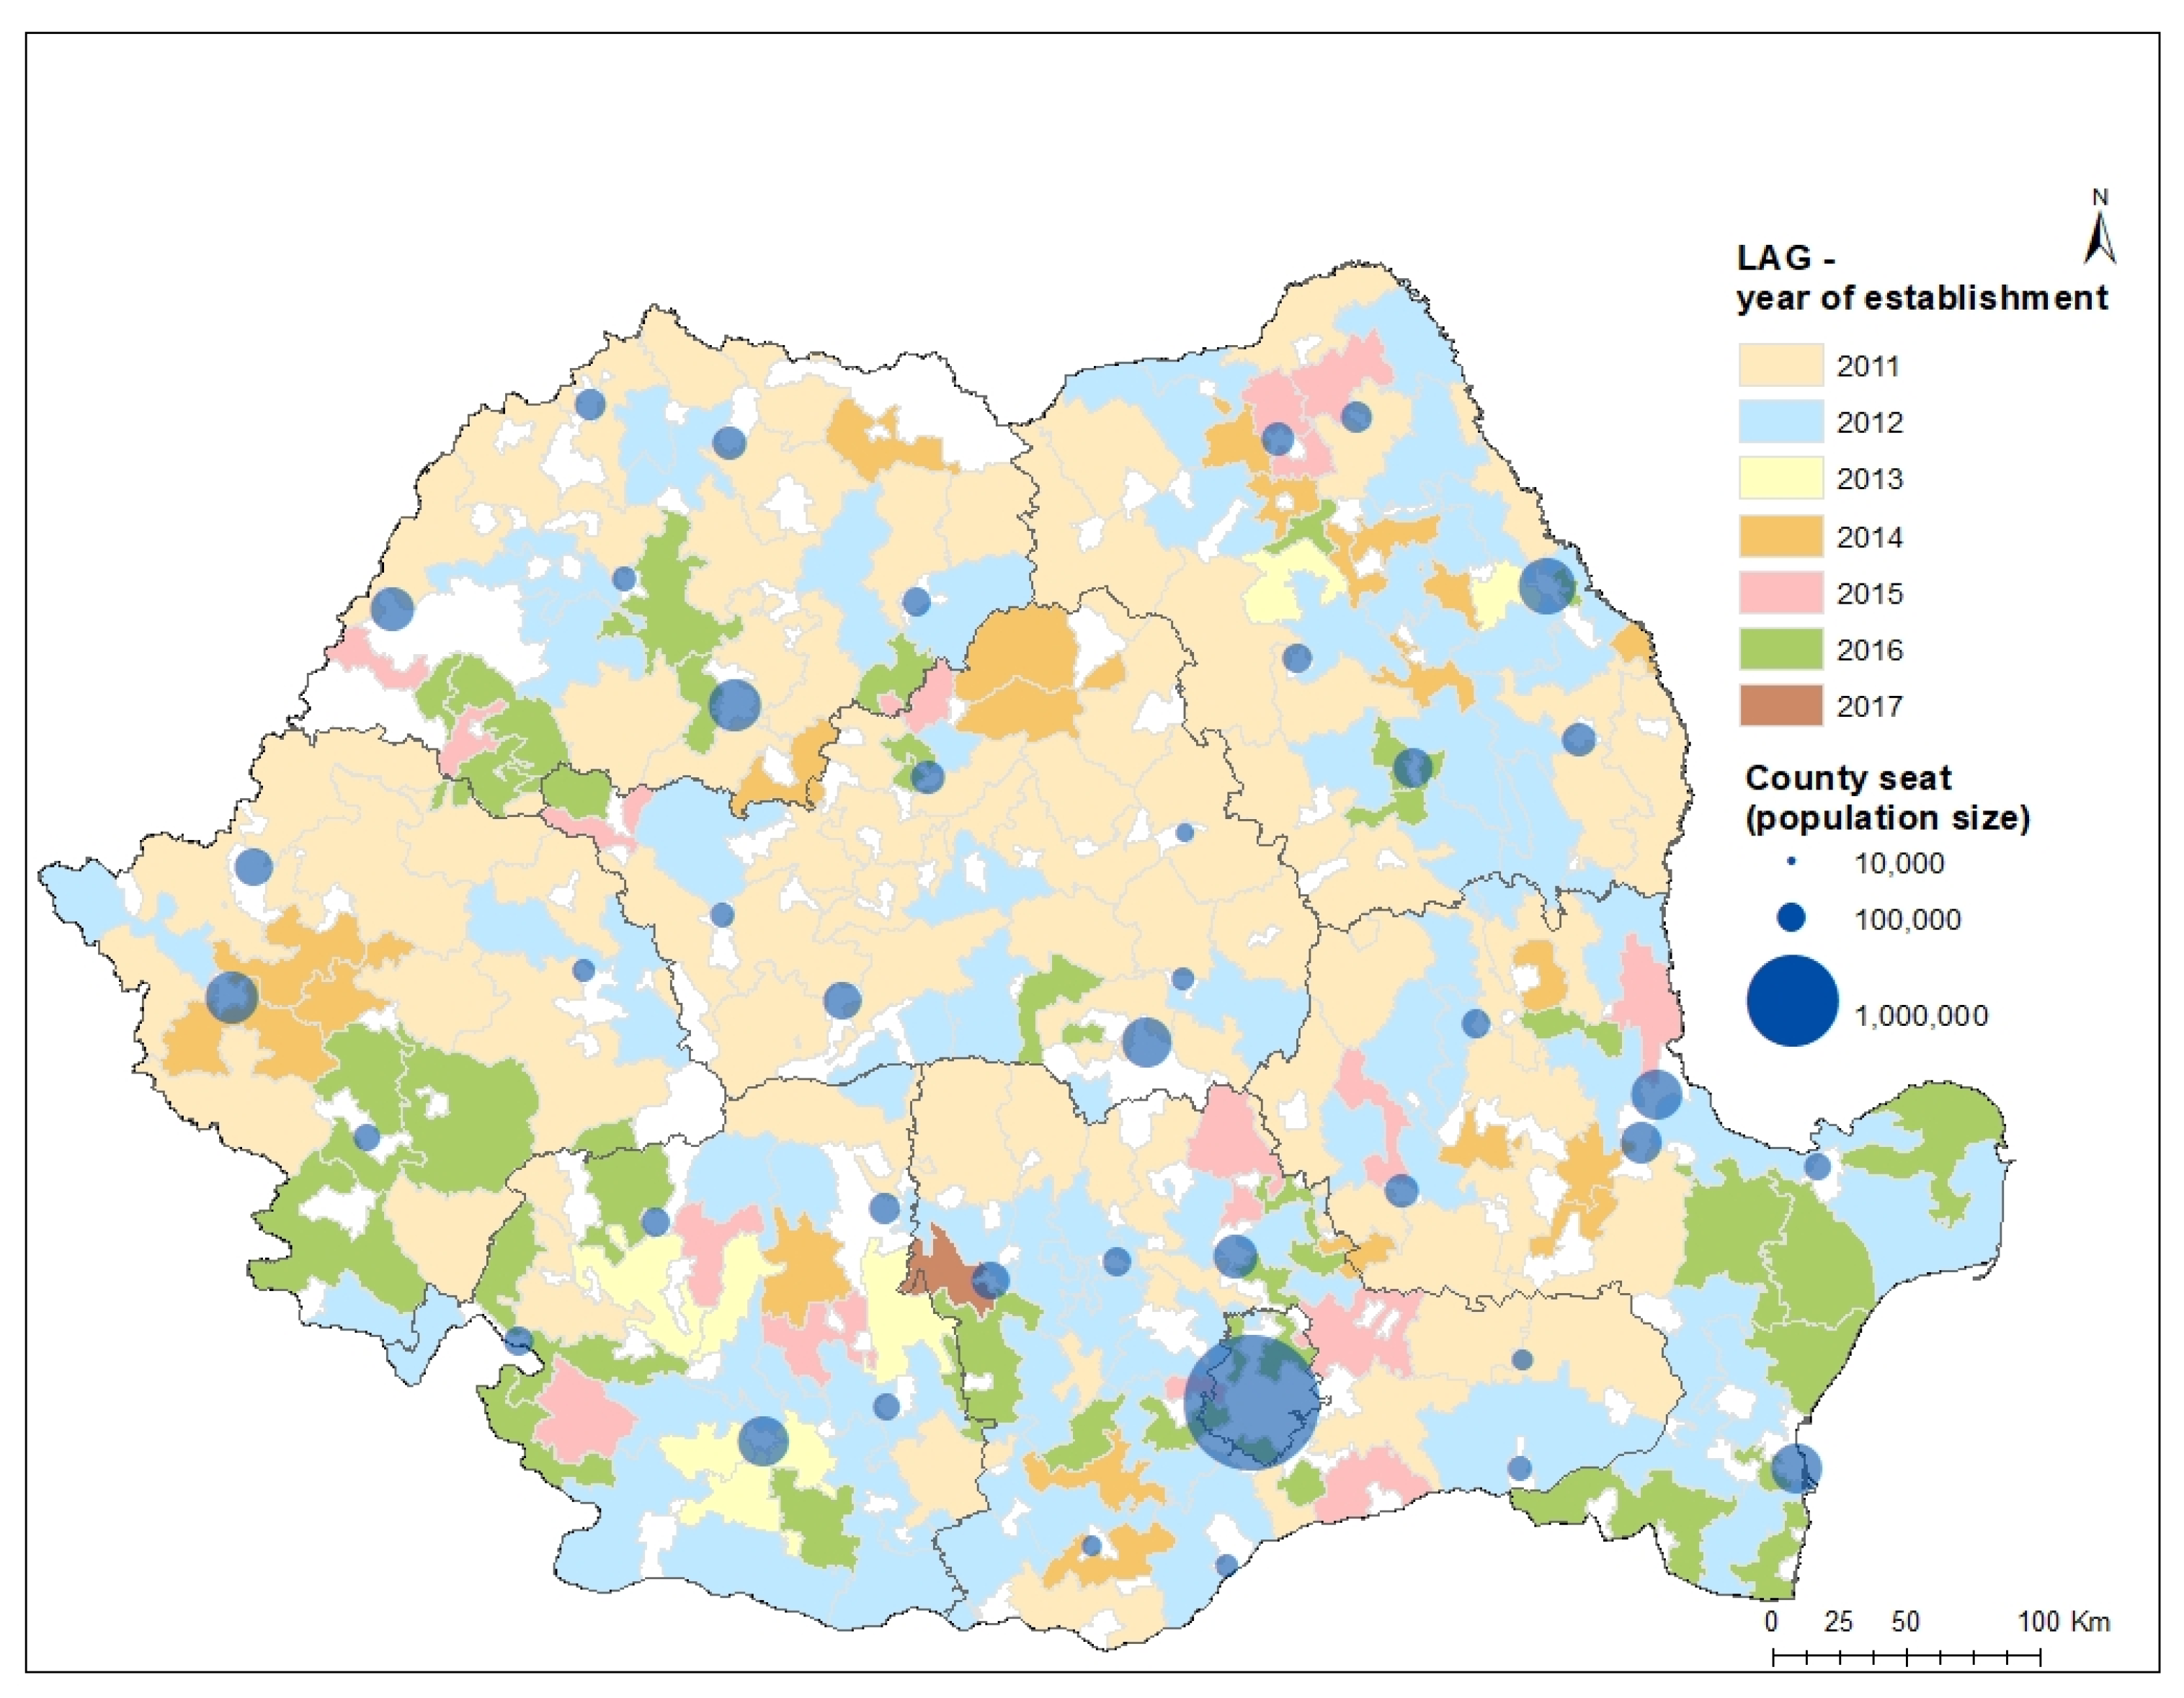
2.1. Study Area

The study focuses on analysing the results of the LEADER program in Romania, a country below the European Union’s average in terms of development level [42]. According to Eurostat, in 2019, Romania was at the bottom of the European Union ranking of GDP values per capita along with Latvia, Greece, Croatia, and Bulgaria. However, Romania has proven to be consistent in its desire to catch up with the rest of the Member States, as evidenced by the positive evolution of the Gross Domestic Product (GDP) per capita in the last decade [42]. The engine of this catch-up energy is due to the major cities of Romania, which deliver most of the economic development [43] while most of the rural areas are left behind, mostly because they are not attractive for investing in the rural economy. The effect of this situation leads to a growing gap between urban and rural areas [31,44].
In Romania, the implementation of the LEADER program became possible starting from 2007, the year that marked the integration in the European Union and the beginning of the fourth LEADER financing period in Europe. The first 82 LAGs at national level were created in 2011, being concentrated in the central and western part of the country and occupying 29.7% of the Romanian rural territory. Later, at the end of 2012, a second selection was initiated, which doubled the number of associations, reaching a total of 163 LAGs at the end of the first financing period (2007–2013). If, in the first selection of LAGs (2011), the newly created territorial formations occupied mainly the central and western part of the country, the year 2012 brought the LEADER program closer to the extra-Carpathian area where most of the poorly developed rural nuclei are concentrated [45,46]. Thus, 30.1% of the LAGs were set up in 2012, these associations mainly covering the disadvantaged eastern and southern rural territories. The first LEADER projects were submitted starting in 2013, the 2007–2013 financing period being rather one of adaptation, dedicated in particular to the management of administrative matters and the establishment of LAGs.
In the current financing period, 2014–2020, the degree of territorial coverage with LEADER associations has increased considerably, reaching in October 2019 a total of 239 LAGs (88.9% of Romania’s territory) and having a uniform spatial distribution (Figure 1). The new LEADER territorial associations created during this period do not present a spatial pattern as well defined as in the case of the formations established in the previous one. This is due to a substantial territorial coverage with LAGs since the first stage of financing in Romania. Thus, the LAGs created between 2014 and 2017 are chaotically positioned but have the role of ensuring a territorial continuity, a connection between the previously formed nuclei. The considerable increase in the number of associations from one financing period to another but especially their territorial extension indicates a particularly high receptivity of the Romanian rural communities to the new bottom-up approach. This can only be auspicious given the low level of development of the Romanian rural area and the main objective of the LEADER program to stimulate development. In addition, the total number of projects of the second LEADER financing period in Romania reaches up to 6996, which supports the idea of an increased interest of the rural population in taking advantage of the opportunities brought by this new financing instrument. The formation of these territorial associations is a good starting point for the development of rural communities. In order to ensure the most efficient functioning of the LAGs, it is necessary to achieve the highest possible degree of homogeneity of the associations as a level of development. This can be achieved by selecting the LAGs communes mainly on the basis of their level of development and less on the political party governing at the local level. However, there are often situations in which the spatial form of Romanian LAGs outlines local political interests, thereby favouring the increase in the degree of political homogeneity to the detriment of spatial homogeneity as a level of development of the partner communes. Although there is not enough conclusive evidence to support this claim, there is a slight tendency of Romanian LAGs to be politically homogeneous (meaning that most of the partner communes belong to the same political party), which could bring advantages in the decision-making process and in the allocation of funds especially for the communes belonging to the dominant political party. This could affect the potential of the LEADER program of reducing the local disparities. However, more research needs to be conducted on this subject in order to appreciate the impact of LAGs’ political homogeneity level on their performance.

2.2. Data and Methods

In order to reach the first objective of the study, namely, the characterisation of the Romanian rural area’s level of development prior to the LEADER funding, the percentage of employees (employed, including employers) in the total population (year 2011) was used as an indicator, the data source being the National Institute of Statistics (INS).The first step was to create the map of the LAGs’ initial level of development (prior to the funding) based on the percentage of employees in the total population (see Figure 2).This indicator has a significant correlation of 0.6 with the human development index (HDI) values and shows similar spatial patterns, therefore being a good substitute for HDI. The reason why the HDI was not used as a benchmark is the lack of data continuity at the LAG level, which is an obstacle in conducting an analysis of the evolution of regions’ level of development. For the second objective of the paper, the analysis of the spatial distribution of LEADER projects and funds at the LAG level, data on the number of initiatives and the funding allocated to them were extracted from the Romanian Agency for Financing Rural Investments (AFIR) database on 12 June 2020. After that, the map fund comprising the Romanian LAGs was built, and the synthesis of projects and LEADER funds was created at the level of each association for each of the two financing periods analysed using the Summarize tool of the ArcMap software. This allowed us to map the number of LEADER projects and the funds absorbed by each LAG during each of the two financing periods and analyse their spatial distribution and the evolution from one financing period to the other. In order to analyse the relationship between the initial level of development and the results of the LEADER program, a new indicator was built, namely, total LEADER funds/per capita. A final step was to build the Ordinary Least Squares (OLS) regression between the percentage of employees in the total population (indicating the initial level of development—independent variable) and the LEADER funds allocated per capita (indicating LAGs performance—dependent variable). Based on the linear regression model constructed by the aforementioned tool, it was appreciated if the LAG’s performance to absorb LEADER funds can be predicted by knowing the level of development. The OLS tool calculates a set of statistical parameters (e.g., the correlation coefficient, the coefficient of determination—R-squared, histogram of residuals, probability) to evaluate if there is a relation between the dependent and the explanatory variable, what is its form, sense, and intensity. The software used for building the regression model and for mapping the results was ArcMap 10.4.1.

3. Results

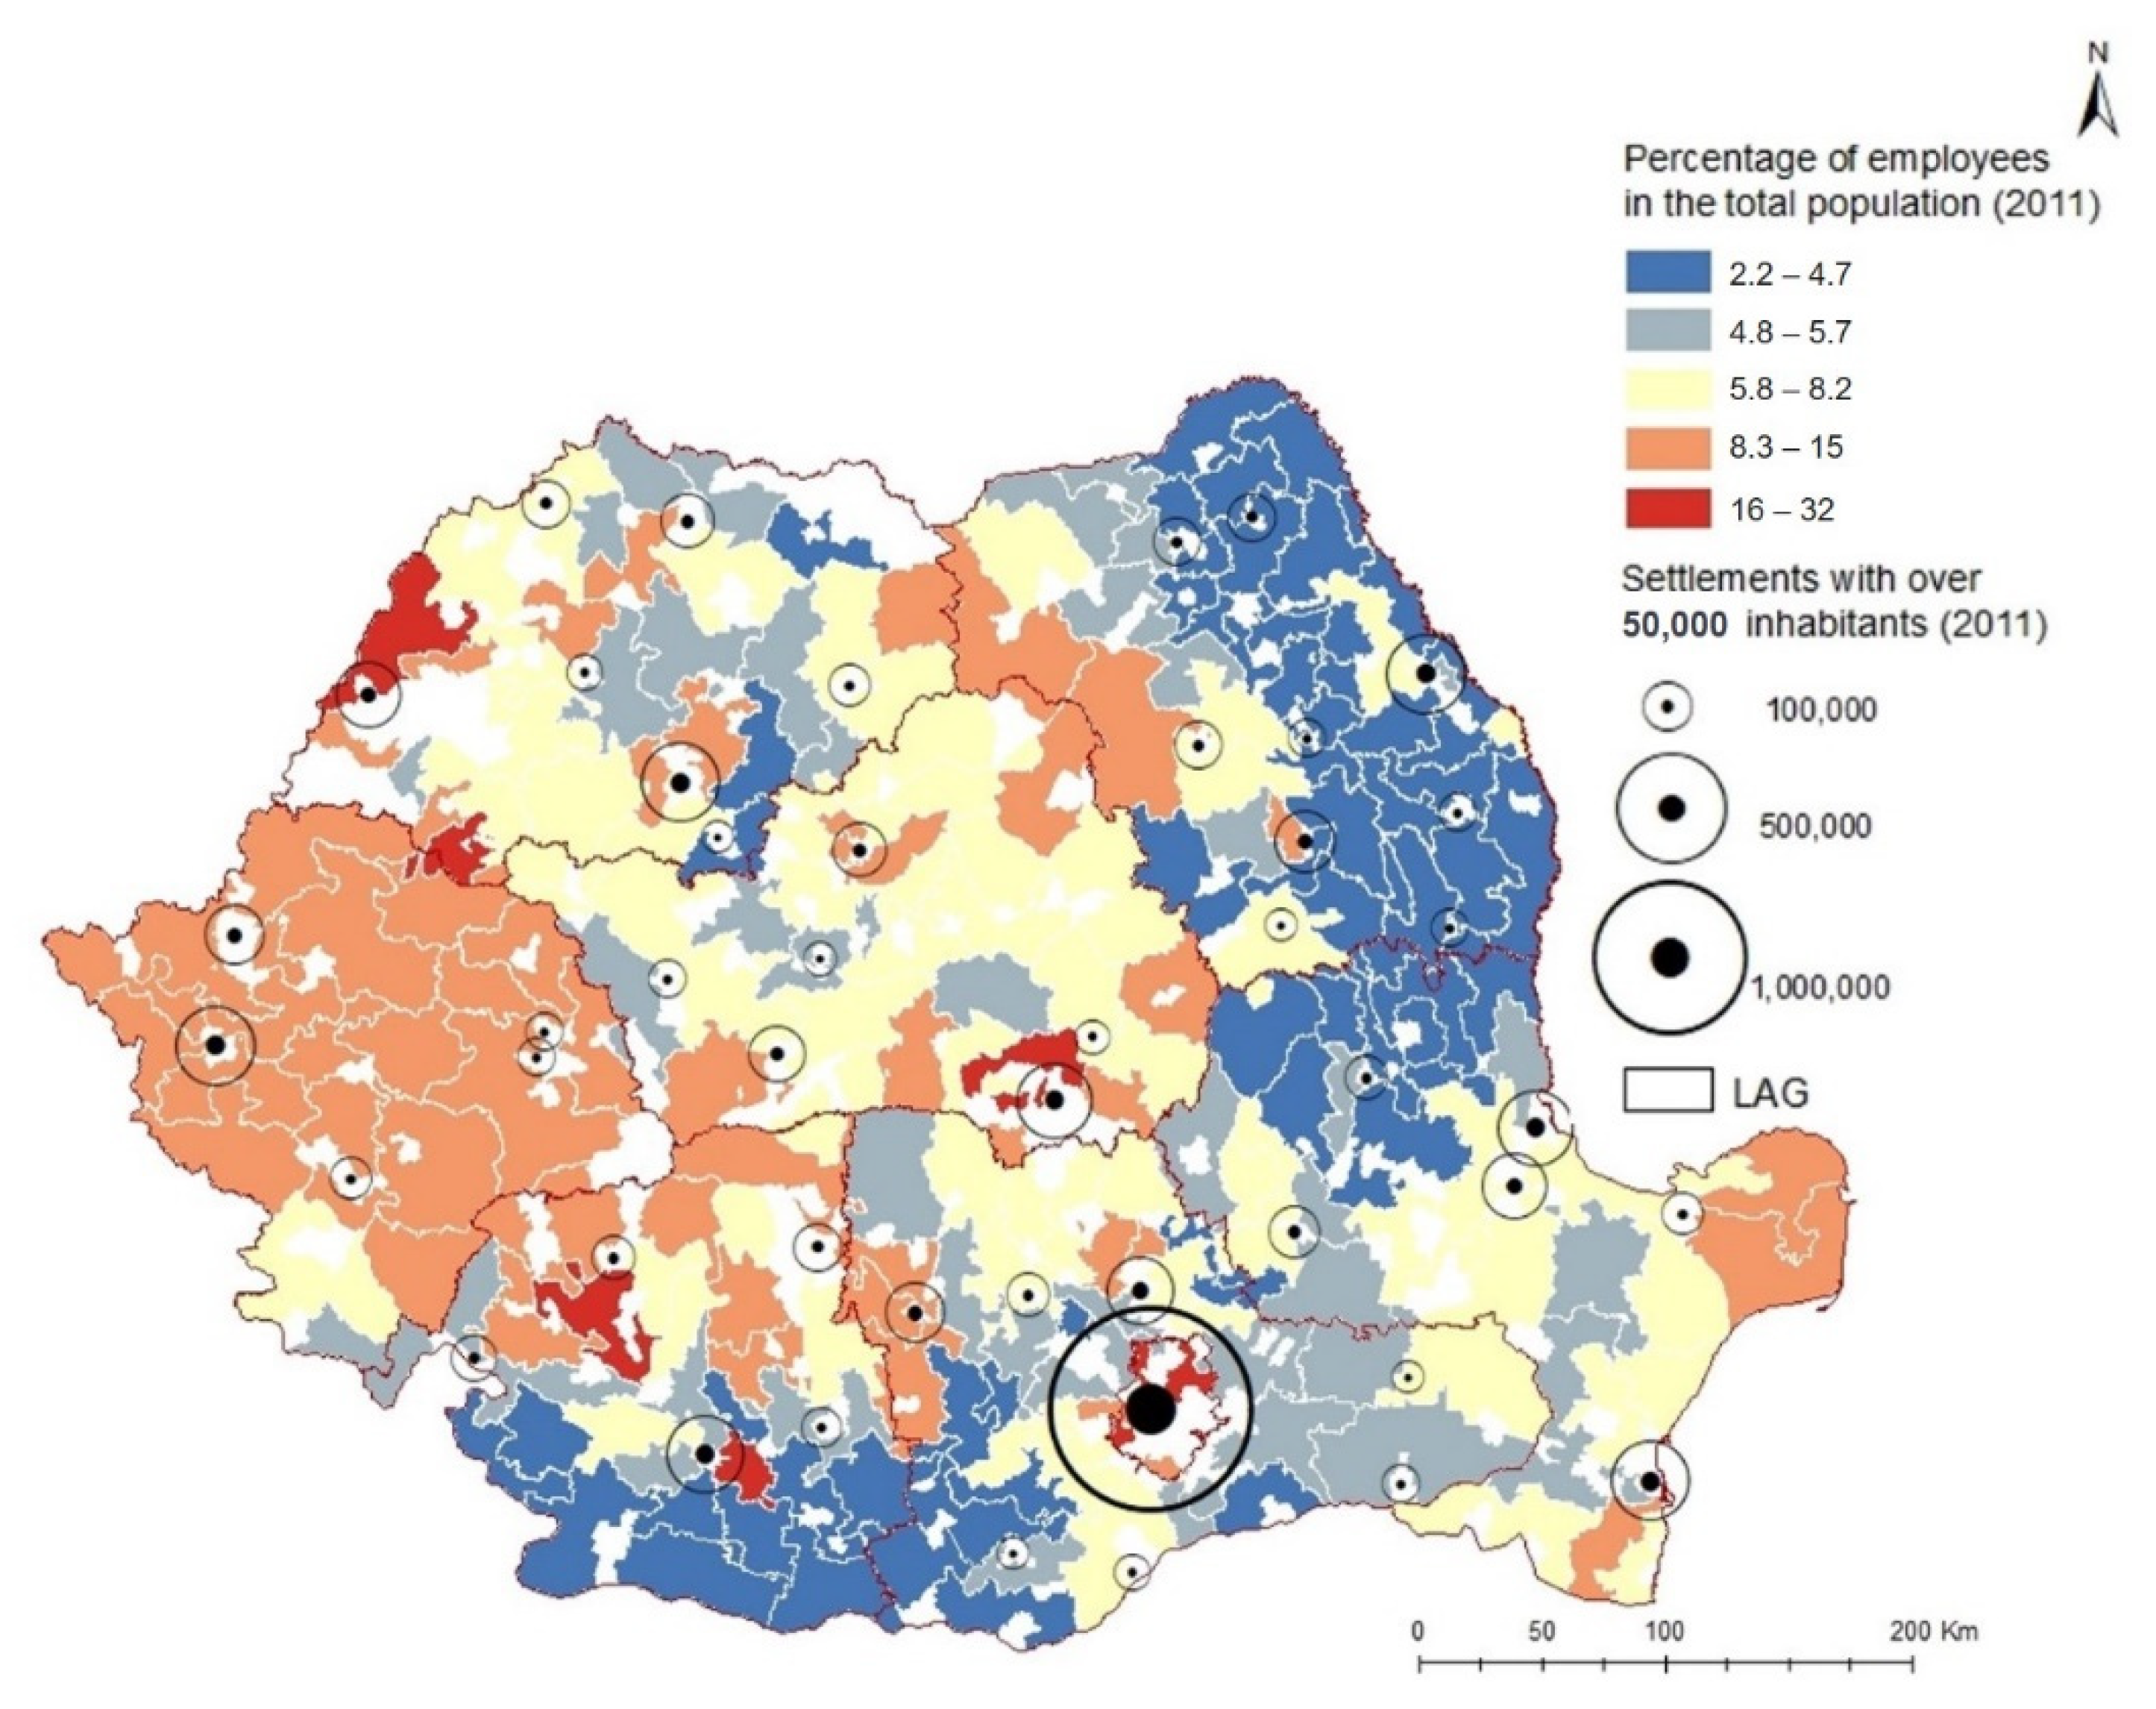
3.1. The Romanian Rural Areas Level of Development before the LEADER Financing

The spatial distribution of the percentage of employees (employed, including employers) from the LAGs’ total population indicates a territorial diversity in terms of the level of development at the beginning of LEADER financing in Romania (2011), a diversity that characterised at that time the Romanian countryside. The east–west contrast is obvious, with most underdeveloped LAGs located outside of the Carpathian arc, while the higher-developed LAGs are concentrated in the western part (see Figure 3). In addition, a second core of less-developed LAGs was concentrated in 2011 to the southern part of the country. The position of LAGs towards the urban centres with over 50,000 inhabitants explains in many cases the associations’ level of development [46,47]. The proximity to urban settlements has brought to the metropolitan area’s communes a series of advantages that contribute to the increase in the general level of development of the LAG to which they belong [46,47]. The amplitude of the values was a significant one with a difference of 21% between the most developed association (LAG Cociovaliștea Ilfov Nord Vest) and the least developed association (LAG Pădurile Dacice, Vrancea) at a national level. The division into classes illustrates five typologies of LAGs with different levels of development, most of the associations being characterised by a very low (type I—27.6%) and medium development level (type III—29.2%). Thus, over 50% of the territorial associations had, at the time of their establishment, a lower level of development than the national average, while only 24.6% of them had a high and very high level of development. This indicates a high favourability of the Romanian rural territory for the implementation of the LEADER program, especially in the northeastern and southwestern parts of the country, where most of the underdeveloped LAGs were concentrated. Overall, the low values of this indicator are mainly explained by the large number of inhabitants that work without a legal form (thus, not being included in the official statistics), the high volume of retirees, the people living on social assistance funds and also the massive emigration to Western countries [48]. In this case, most of the emigrants continue to be officially counted as residents (because they choose not to declare the change of residency), even if, in reality, they are not present in the communes because they are living and working abroad.

3.2. Quantitative Results of the LEADER Program in Romania

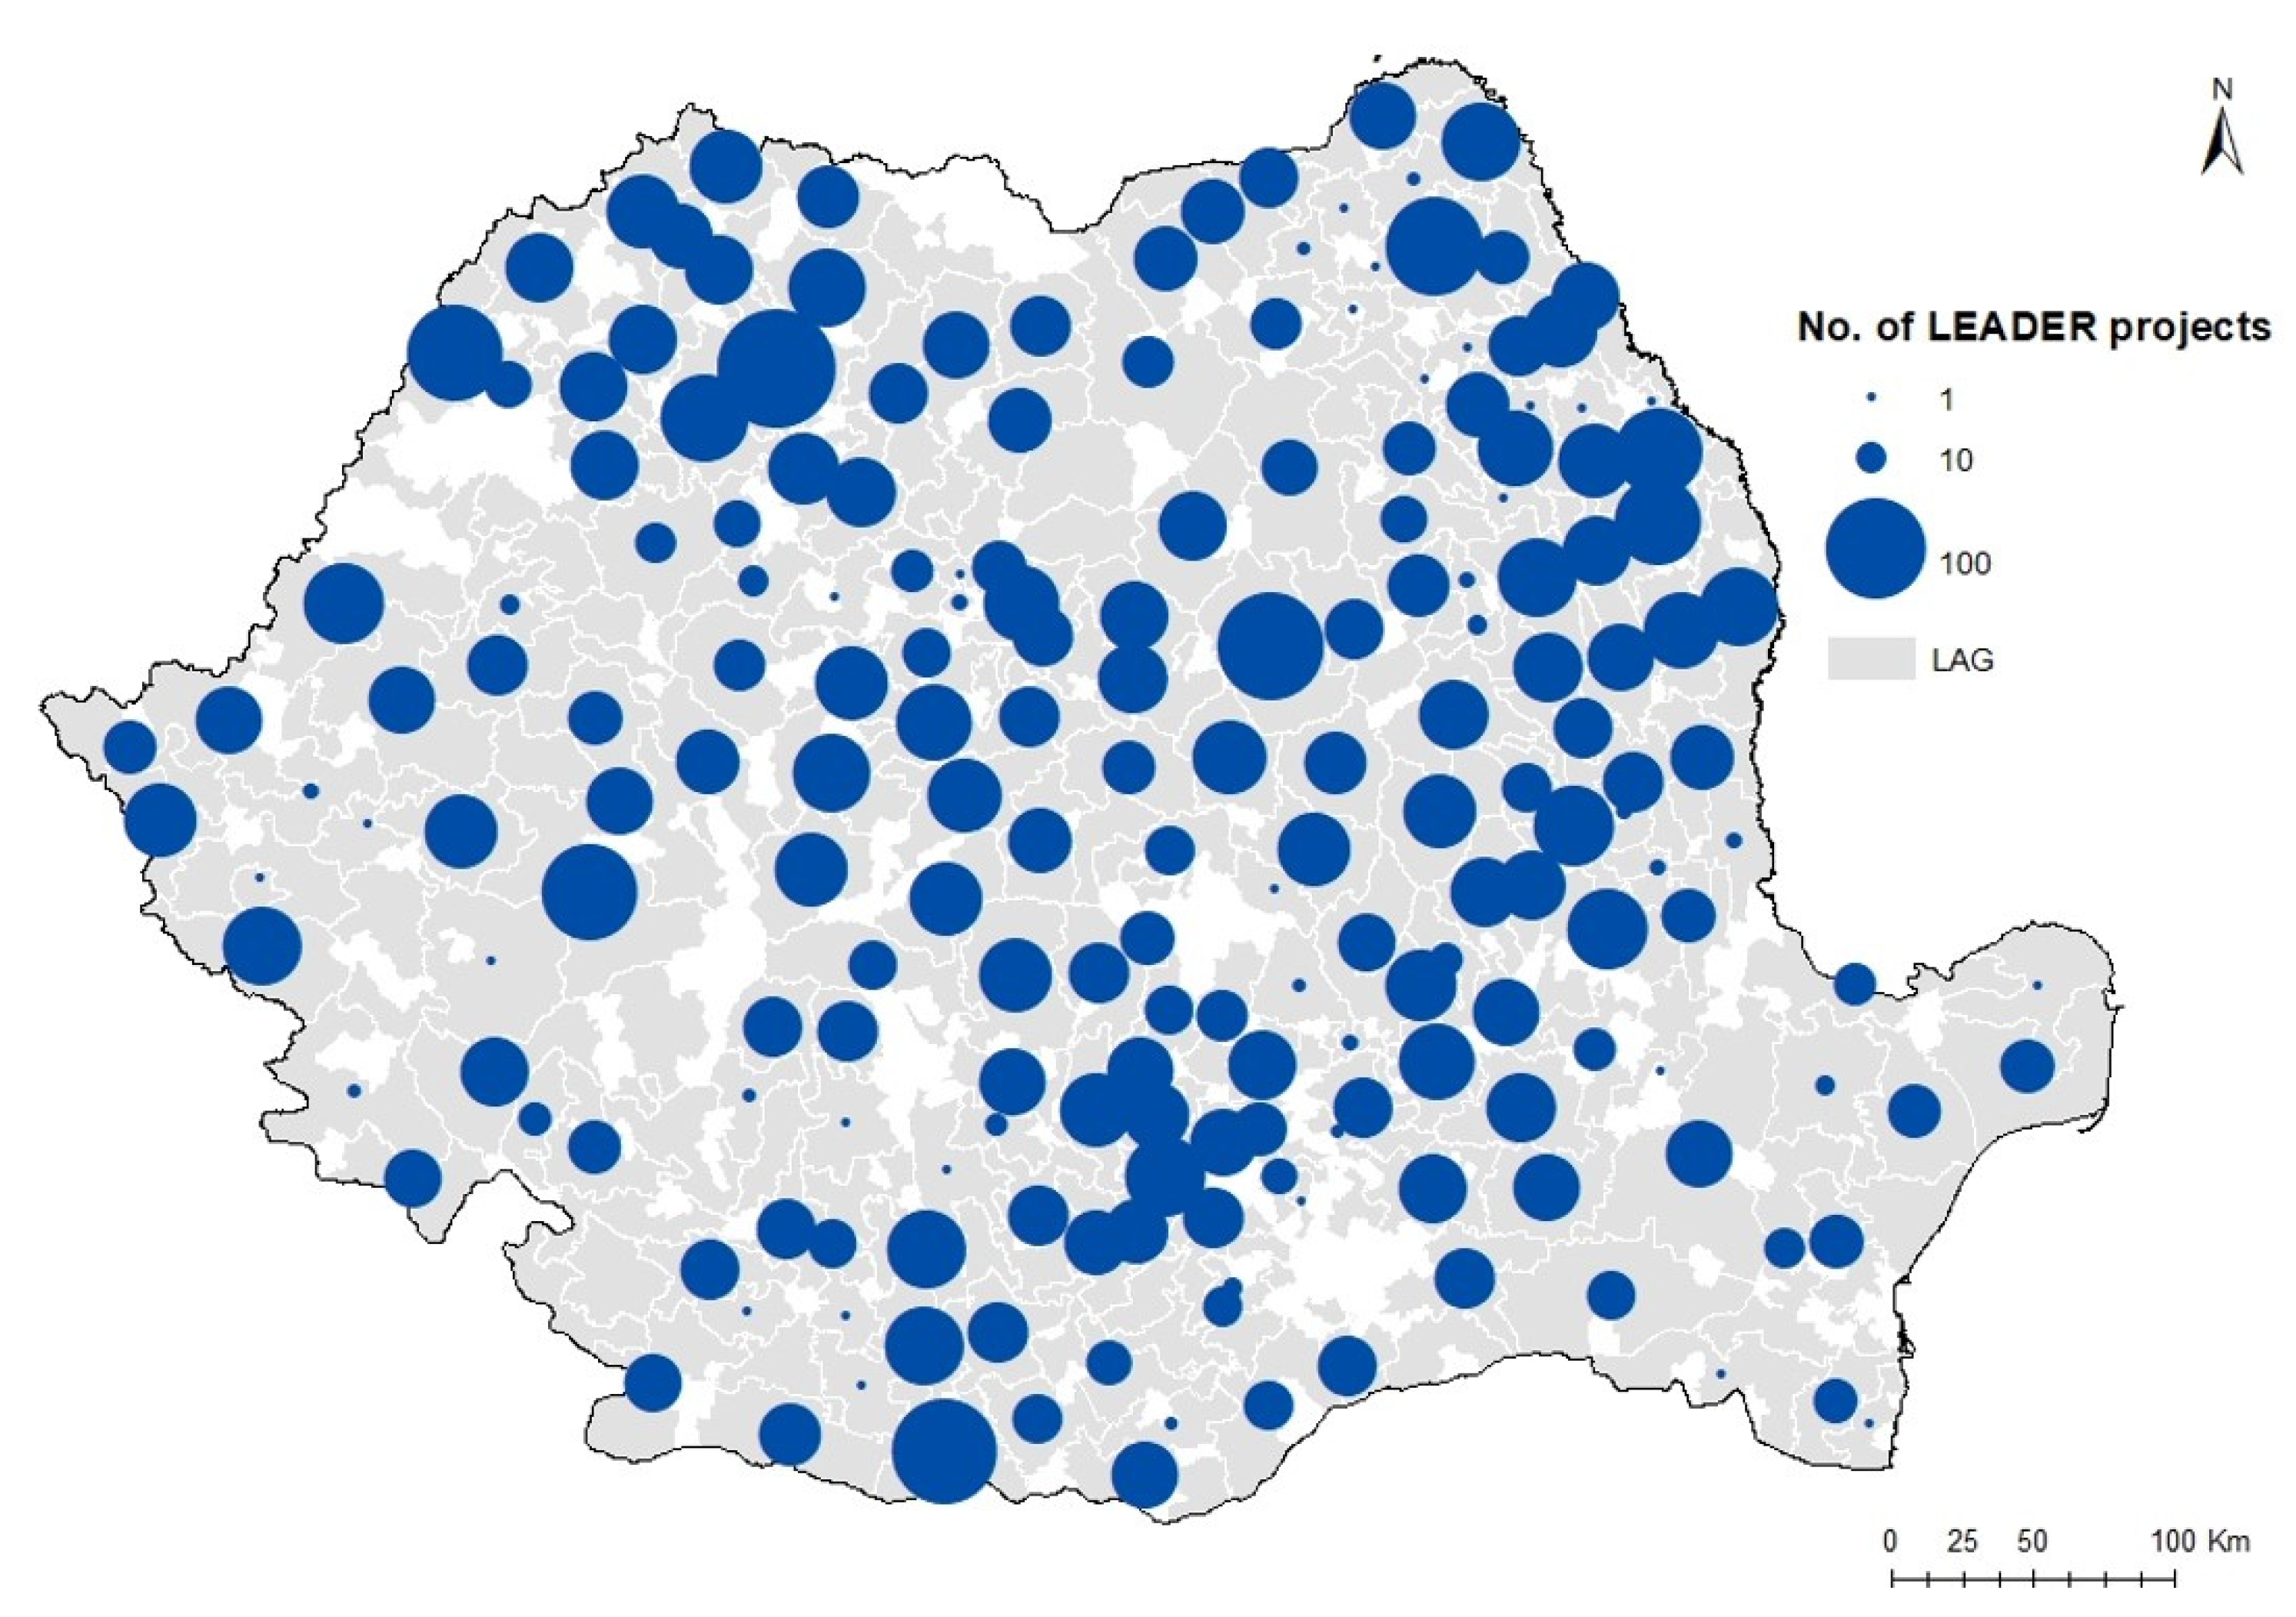
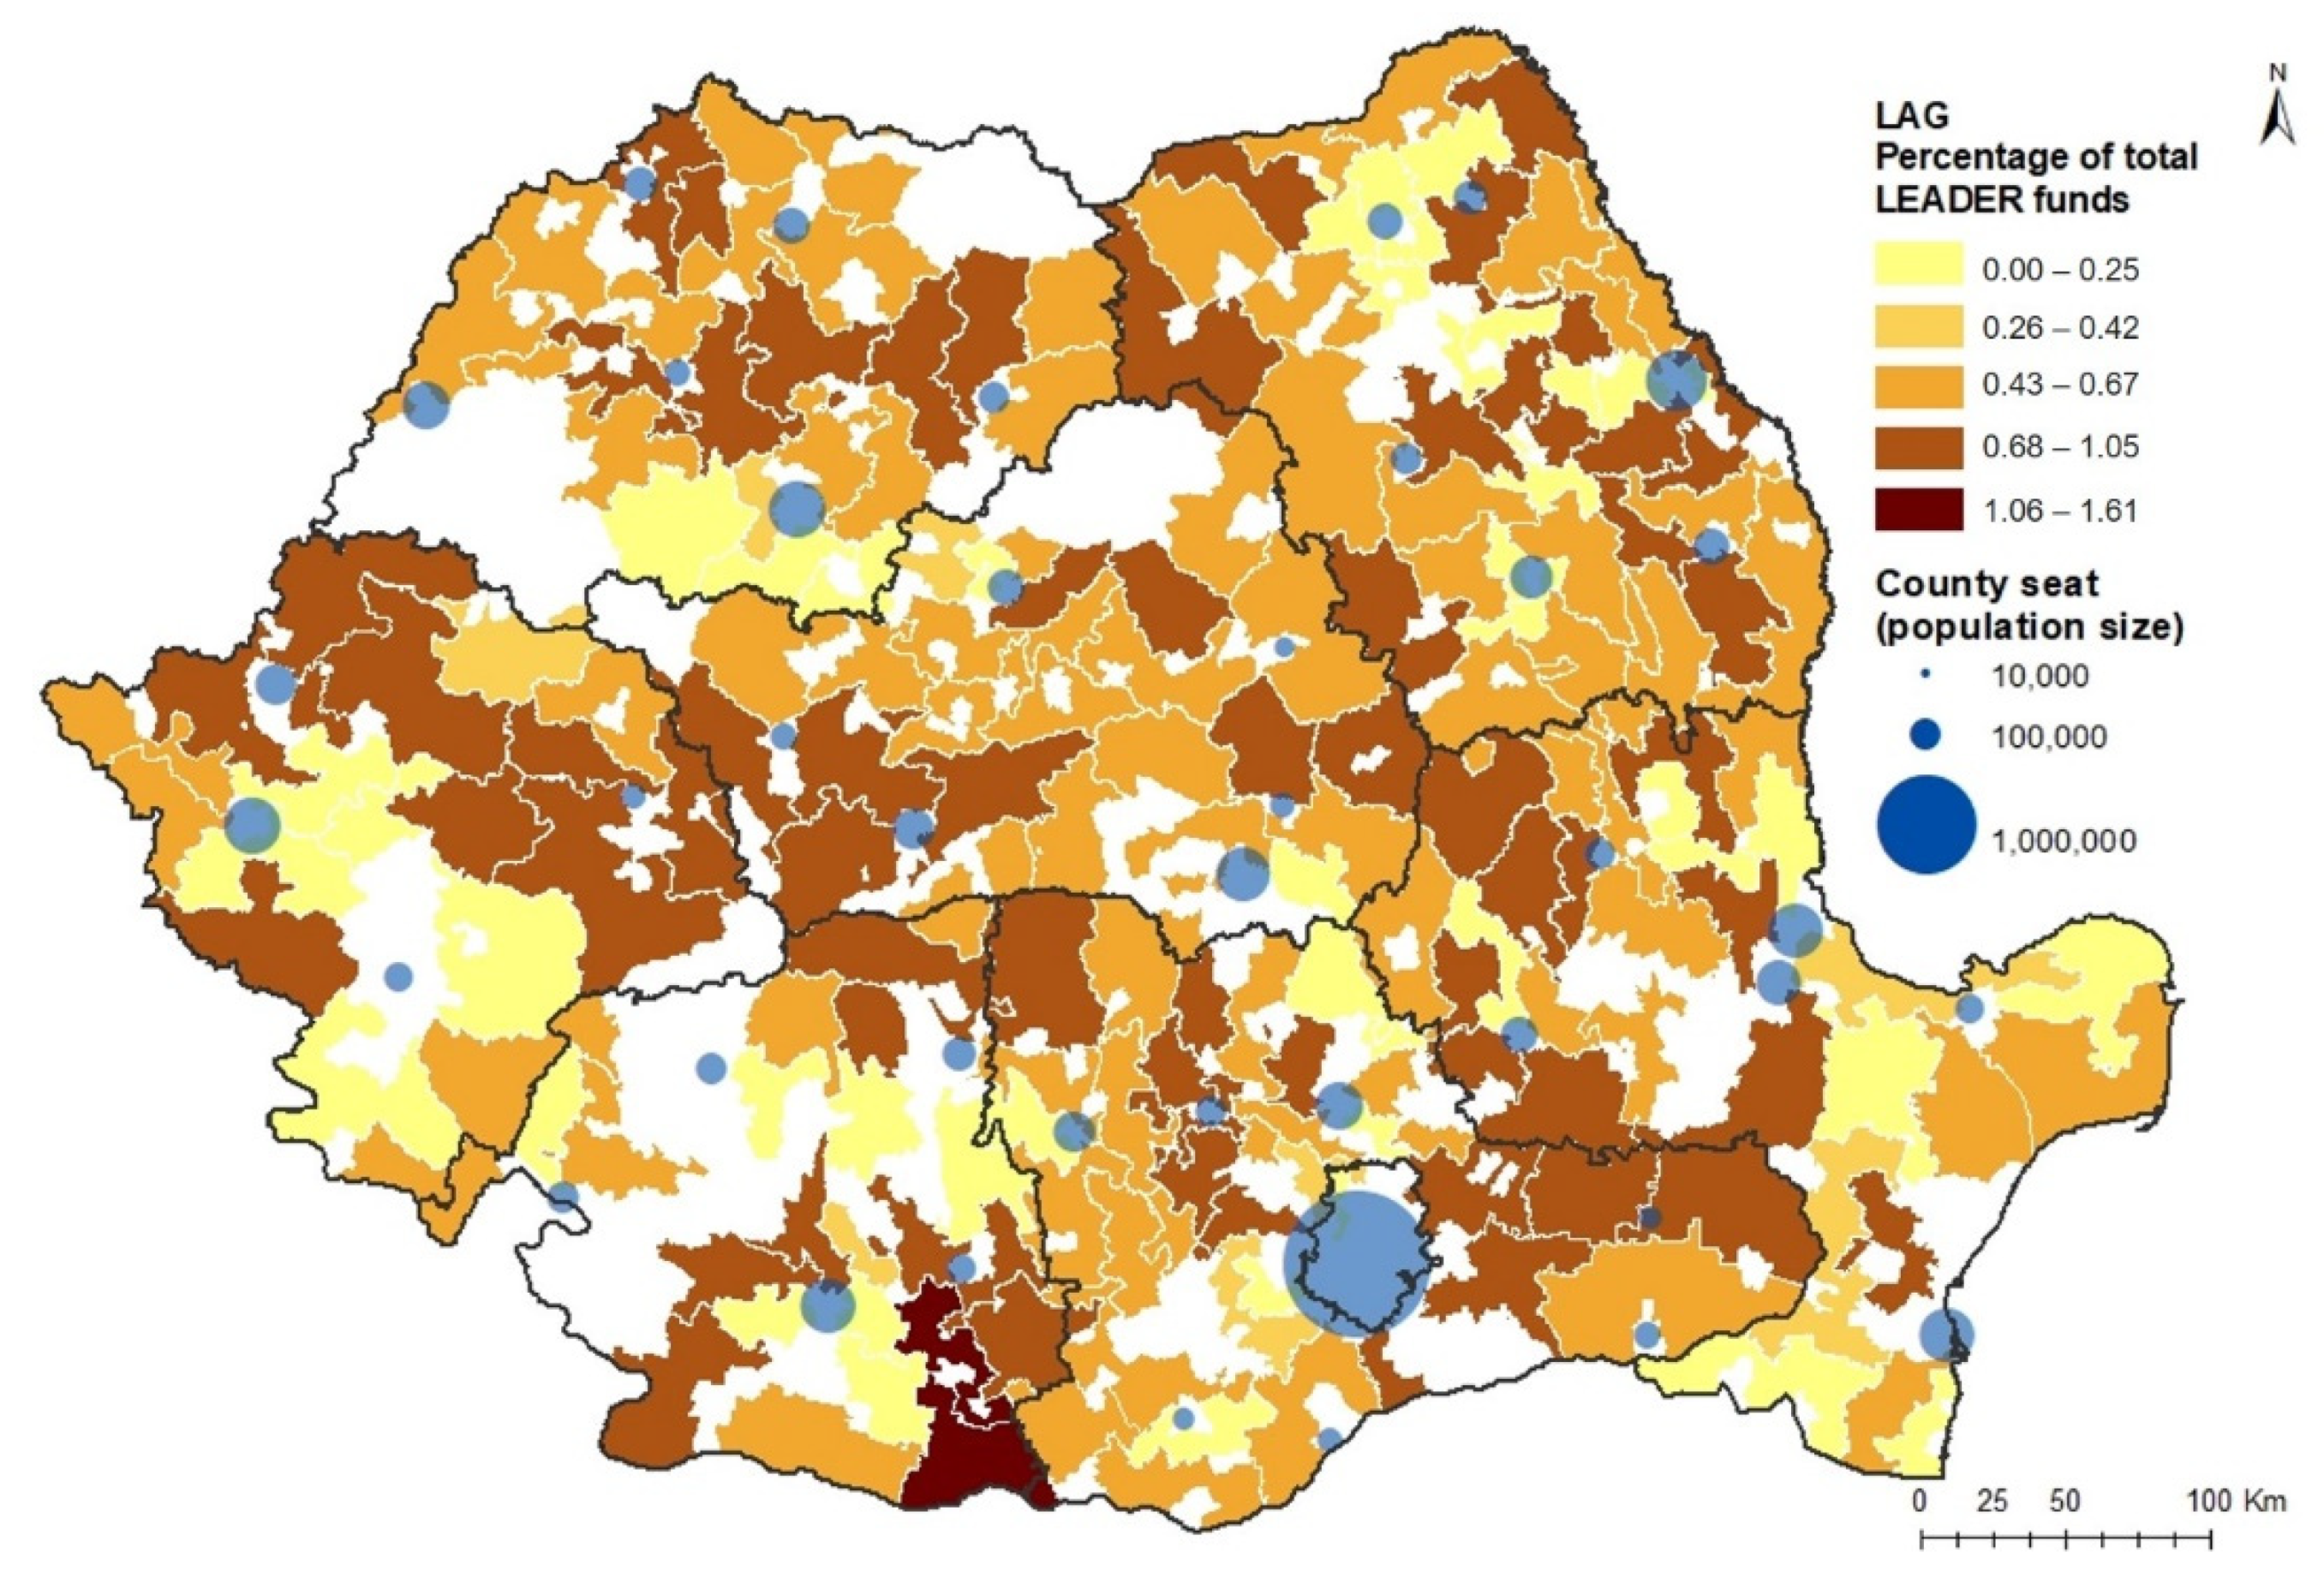
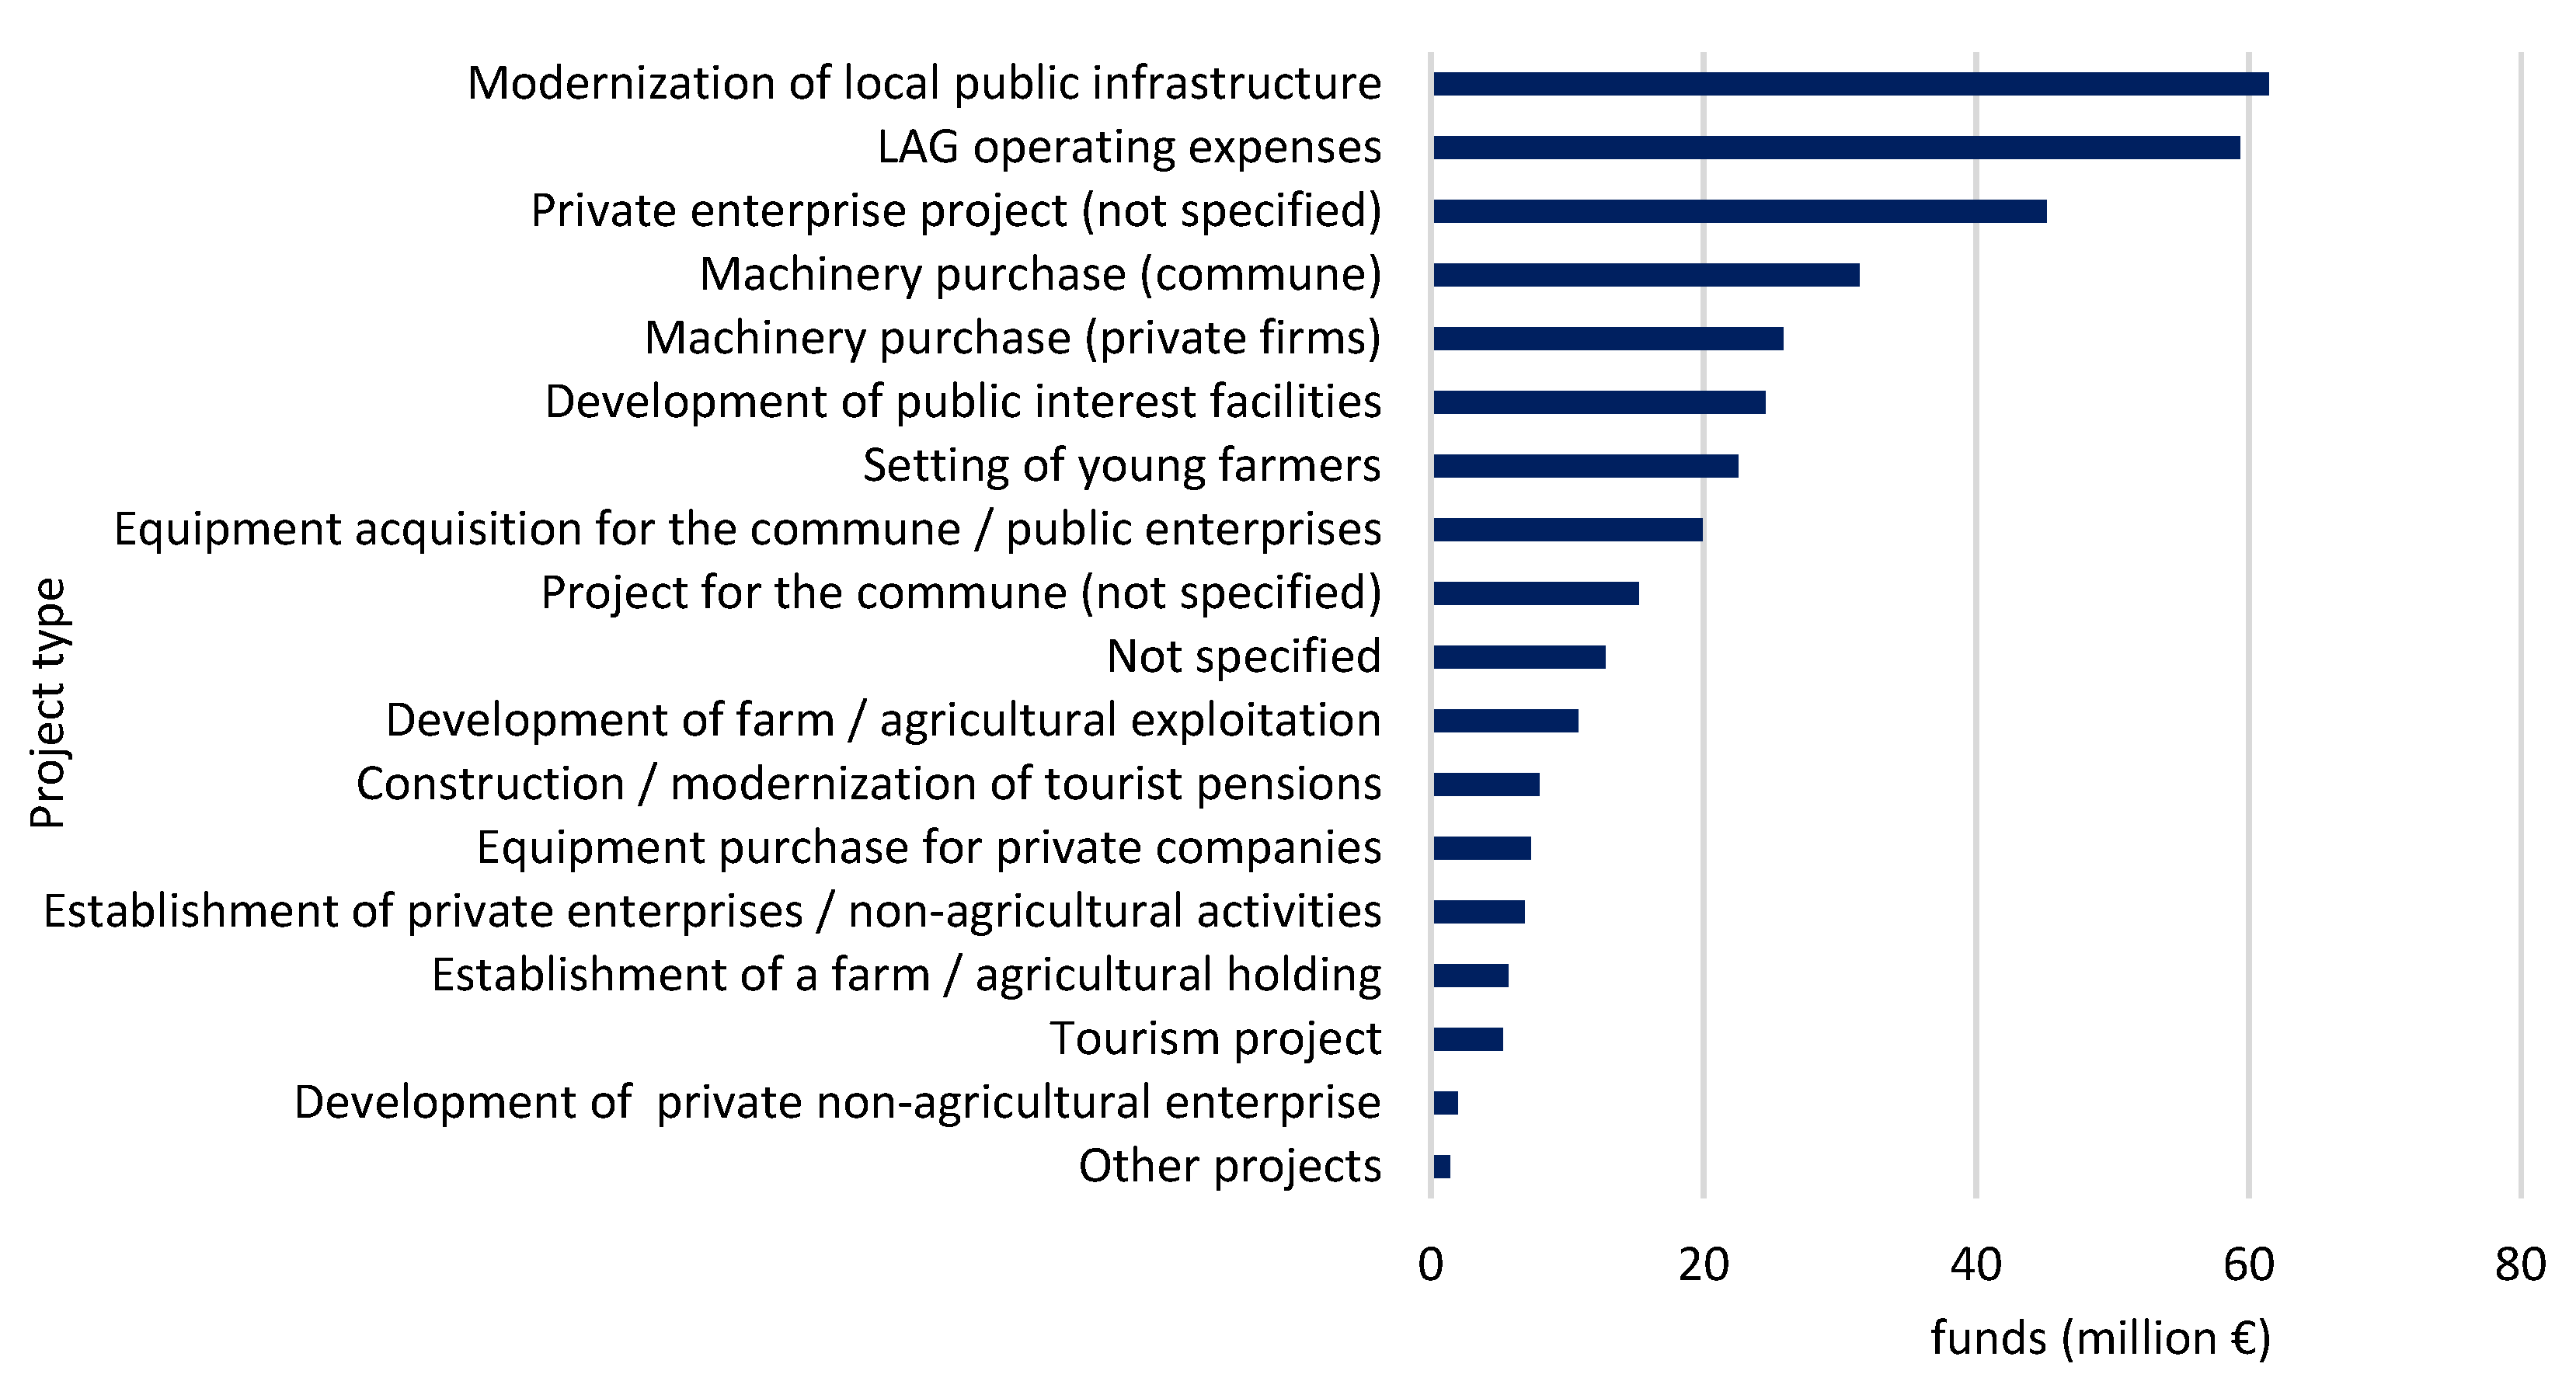
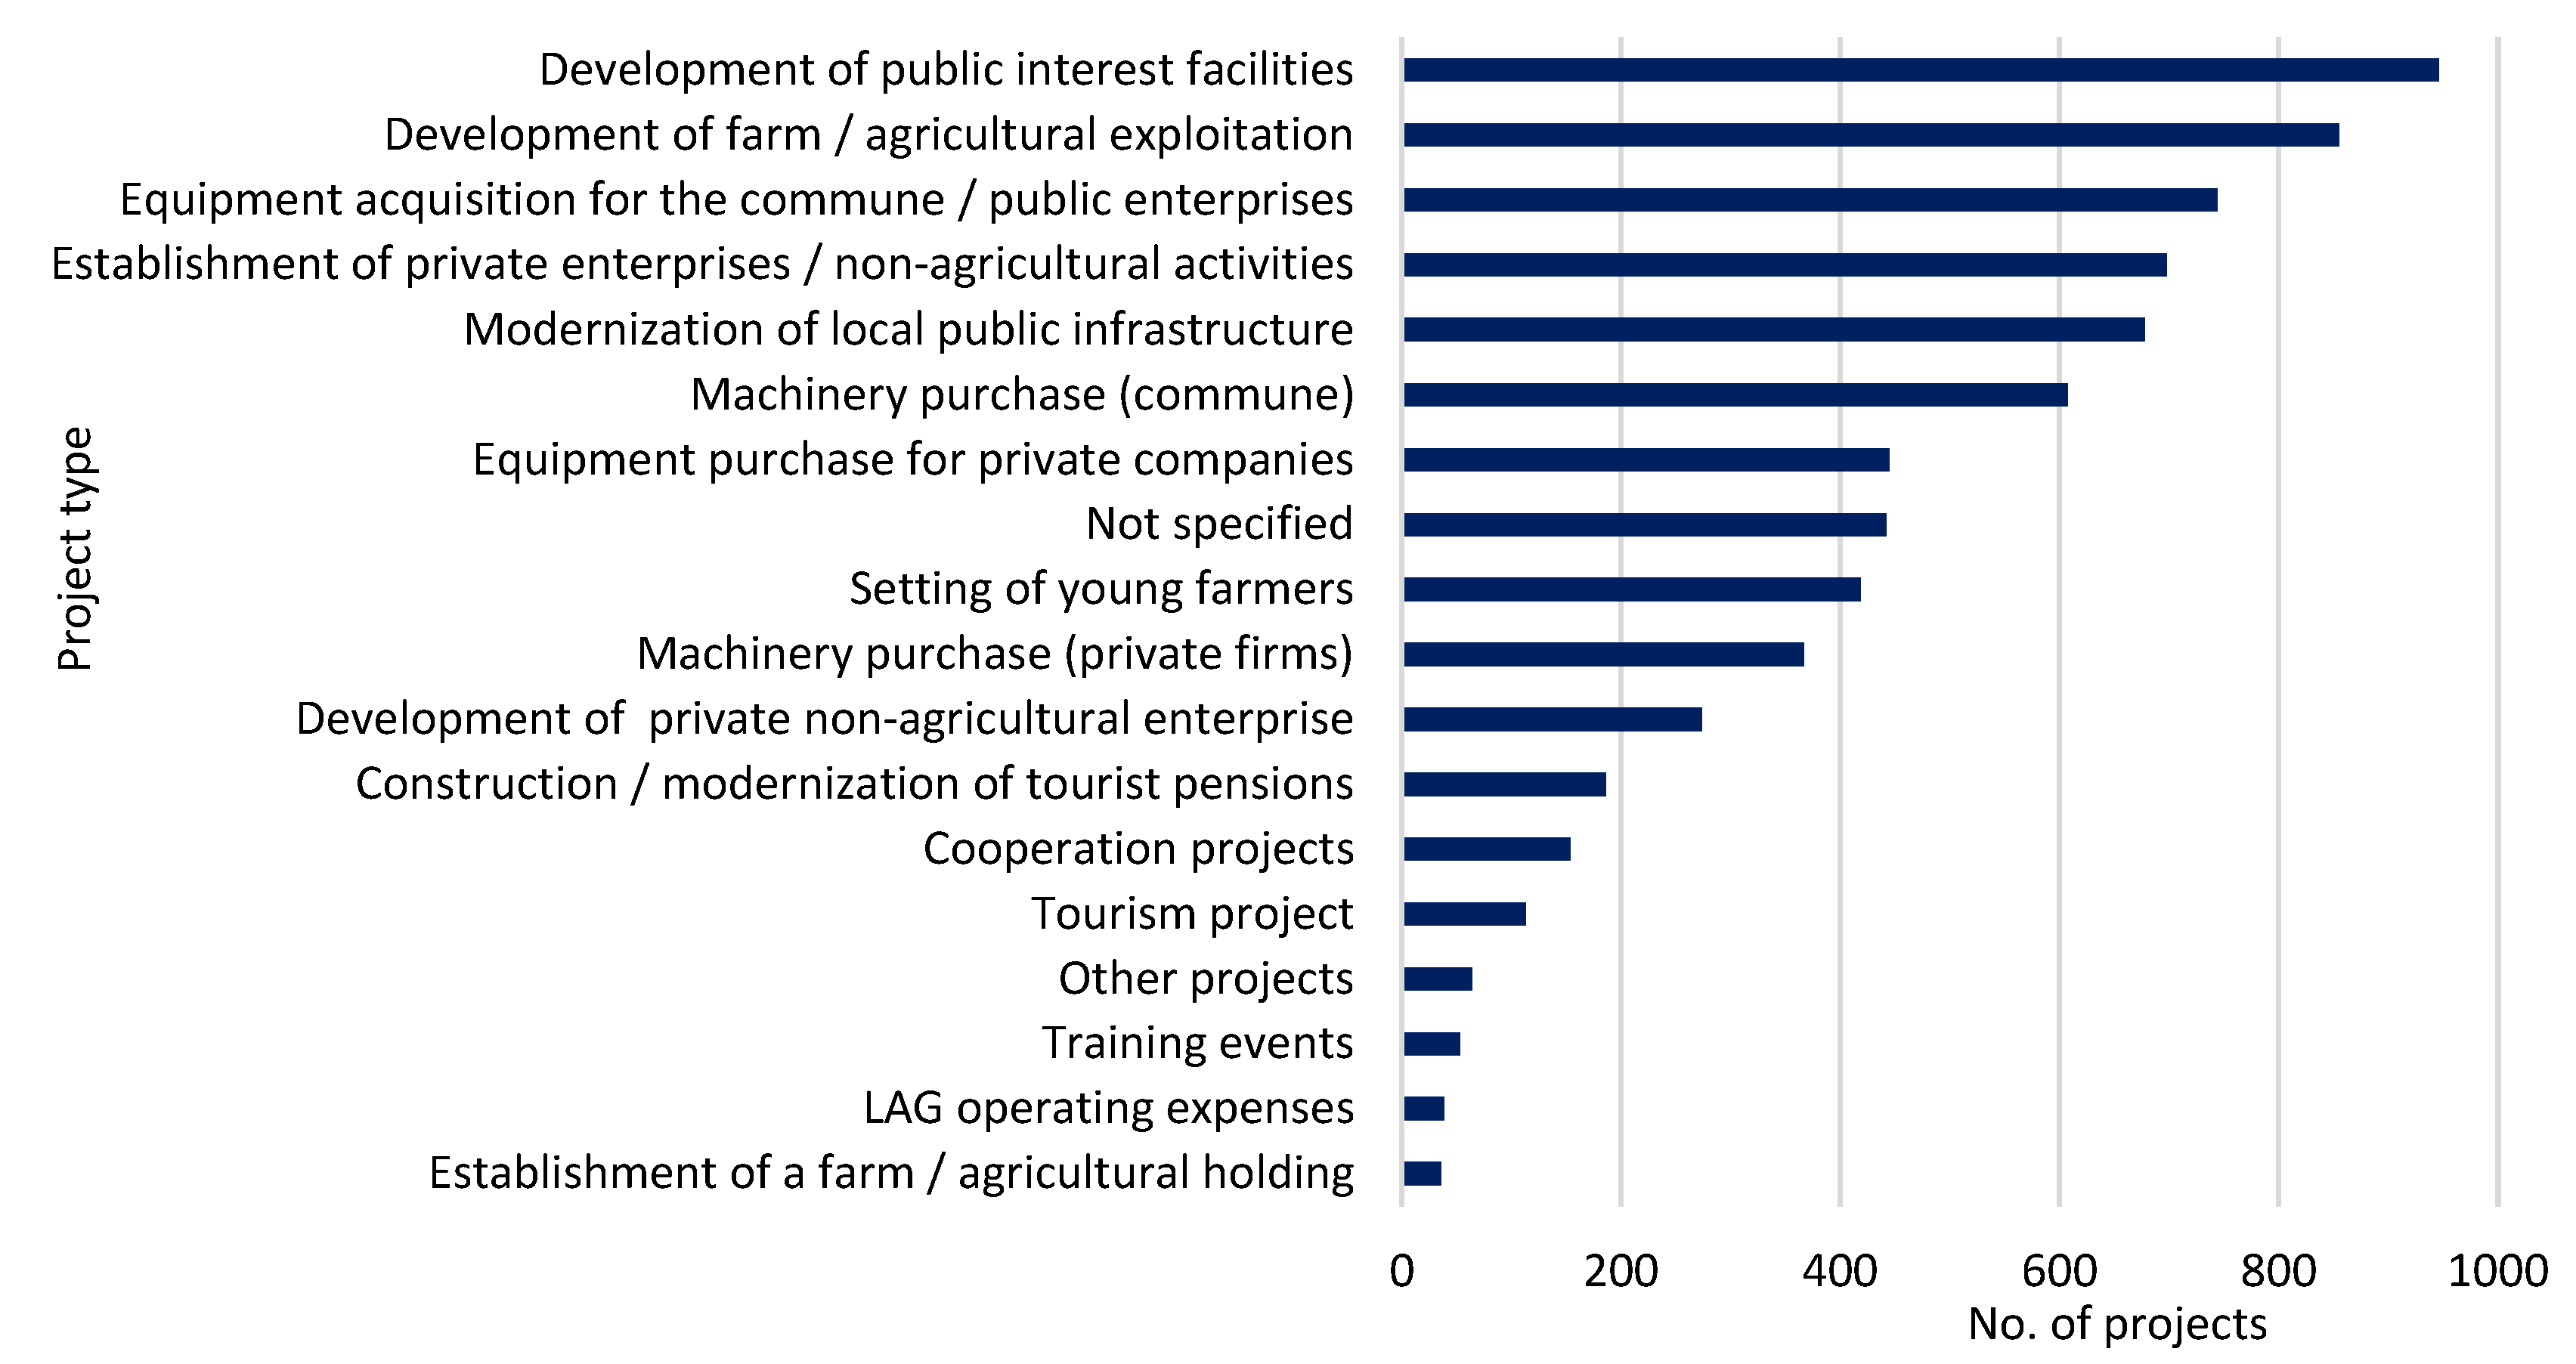
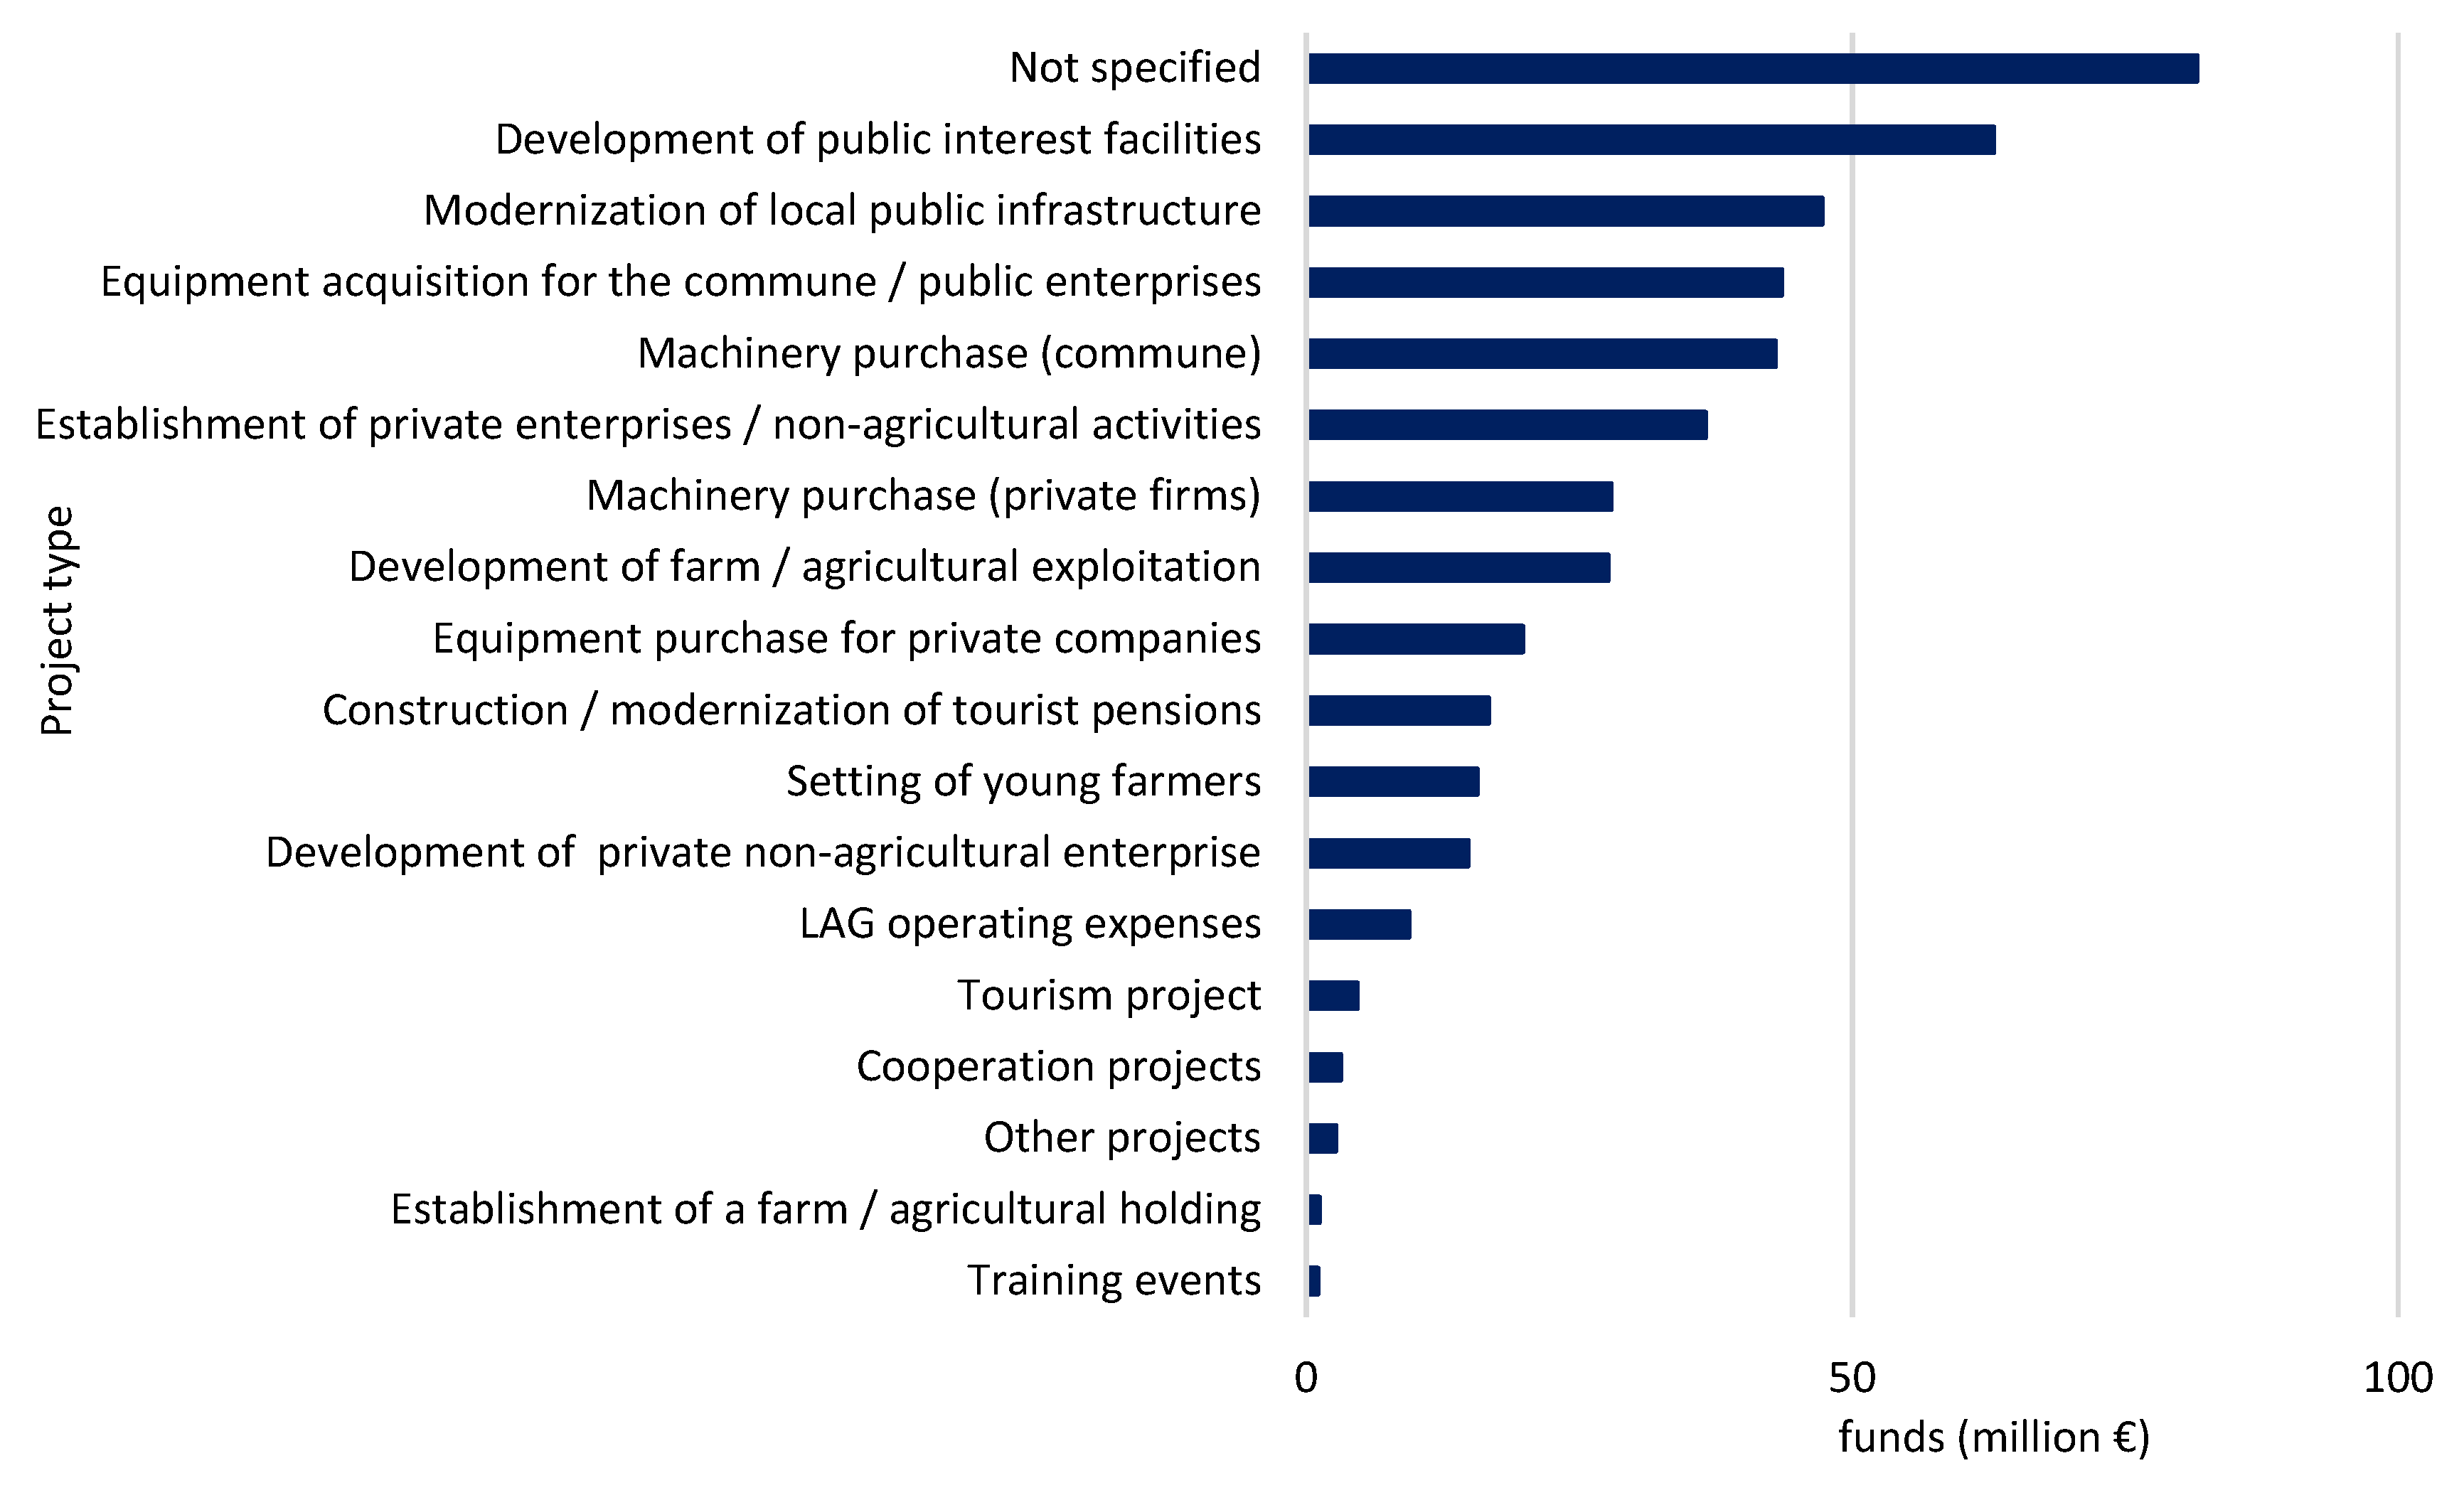
3.2.1. Type and Spatial Distribution of Projects and LEADER Funds Accessed at LAG Level in the 2007–2013 Financing Period

The spatial distribution of LEADER projects in the first financing period indicates different behaviours at the spatial level that overlap to some extent on the territorial configuration of the developed and developing areas in Romania but in reverse (see Figure 4). Thus, those areas more active as a number of LEADER projects correspond to disadvantaged rural territories (especially in the northeast and the south; outside the Carpathian arc), while the lower-performing LAGs as a number of LEADER projects overlap on the more developed territories in Romania (especially the western part of the country). A possible explanation would be the higher diversity of investments that developed areas are benefiting from in comparison to the disadvantaged ones. Therefore, a higher diversity of available funds can determine developed areas to be less interested in the LEADER program and implement less projects, while for the less-developed territories, the situation is in reverse. However, there are also exceptional situations such as the southeastern extremity, where a possible explanatory factor of the reduced number of projects, despite a low level of development, may be the low number of inhabitants of the territory compared to other similar areas of the country. It remains to be seen whether there is indeed a dependence relationship between the two, the level of development and LEADER funds, a relationship that could indicate the type of behaviour of the LEADER program in Romania (inclusive or selective) and the future evolution of the development gaps. This topic will be addressed in more detail in the next section of this paper.
Regarding the types of funded projects, the agricultural initiatives predominated in the first financing period. They total up to 1588 projects, representing 21.6% from the number of implemented projects, while the non-agricultural projects reach only 4.6% (see Figure 5). However, there is also a large number of private projects (1681) for which no details were provided regarding their nature (agricultural/non-agricultural). With regard to the type of agricultural projects, more than half of them fall into the “setting of young farmers” category, an initiative specific to the LEADER program and frequently encountered in rural development programs in Romania. These types of projects lead to the establishment of new private enterprises with agricultural specificity. The establishment of farms/agricultural holdings or the development of existing ones are other projects that fall into the same category of agricultural initiatives. The high number of agricultural projects indicates that the general interest is towards capitalising on the primary sector to the detriment of other economic sectors. This behaviour can be explained through a high natural resources potential for the primary sector, a potential that is being exploited through agricultural projects.
Other type of projects that are very frequent in the first financing period are the public projects. These include initiatives to modernise public infrastructure at the local level (10.6% of the total), to develop facilities of public interest such as parks, sports fields, social centres, etc. (5.3% of the total), or the acquisition of equipment and machinery for the proper functioning of public enterprises (13.2% of the total). All these projects are intended to contribute to the local population’s general well-being by providing the basic conditions for a good living. There are also 283 projects submitted by the local public administration (commune) for which no details were provided on the nature of the project. The comparative analysis of the number of initiatives belonging to private and public actors shows that public enterprise projects are 23% ahead of the private ones. Thus, the LEADER program in its first financing period in Romania seems to have been of great success among private actors who have shown a special interest in accessing these new funds for rural development in the agricultural sector. In addition, if we refer to the public projects, LEADER seems to have been a very good support tool for rural communities in developing the basic public infrastructure, which brings, in the end, a better quality of life.
The absorbed funds have a relatively uniform spatial distribution, being visible towards the central-western part of the country a chain of LAGs characterised by a higher degree of absorption (see Figure 6). The differences between the five resulting classes and, implicitly, between the LAGs are not pronounced, the percentage values varying from 0 to 1.61%. Most of the funds were concentrated to the east, northwest, and the centre, generally in the same areas with a high number of LEADER projects. Thus, as in the case of the spatial distribution of projects, the absorbed funds seem to follow to some extent the territorial configuration as level of development, the relationship between the two apparently being inversely proportional. However, the validity of this statement will be verified in the second part of this study.
The distribution of funds by categories of project is different from that of the number of projects in terms of the place occupied by public and private initiatives. Thus, if in the case of the number of projects the first position was occupied by private enterprises, in the case of LEADER funds, at the top of the ranking are the projects of local public infrastructure modernisation initiated by the local administration (see Figure 7). The operating and animation expenses of the newly created territorial associations were significant, occupying the second position in the ranking and representing 16.2% of the total. The agricultural projects submitted by private actors absorbed approximately EUR 65,000,000, representing 17.7% of the funds, these being above the level of private non-agricultural projects that had a degree of absorption of only 6%. This confirms the idea presented above that the interest of rural communities is mainly focused on exploiting the potential of the agricultural sector to the detriment of other economic activities. Regarding the differences between public and private initiatives in terms of the degree of funds absorption, these differences are in favour of public projects that have exceeded the private ones by 3.6%. Thus, if in terms of the number of projects, private enterprises hold the first position in the ranking, as a degree of absorption, public enterprises are somewhat more better performing. Of course, this situation is also explained by the scale of public projects, which are often much larger and more expensive than the private ones.
To summarize, the main findings about the implemented projects and funds allocated in the first financing period are as follows:
  • the agricultural projects predominated along with public projects for the development of the local infrastructure;
  • most of the funds were absorbed by public projects;
  • agricultural projects managed to absorb a larger amount of funding then non-agricultural projects.

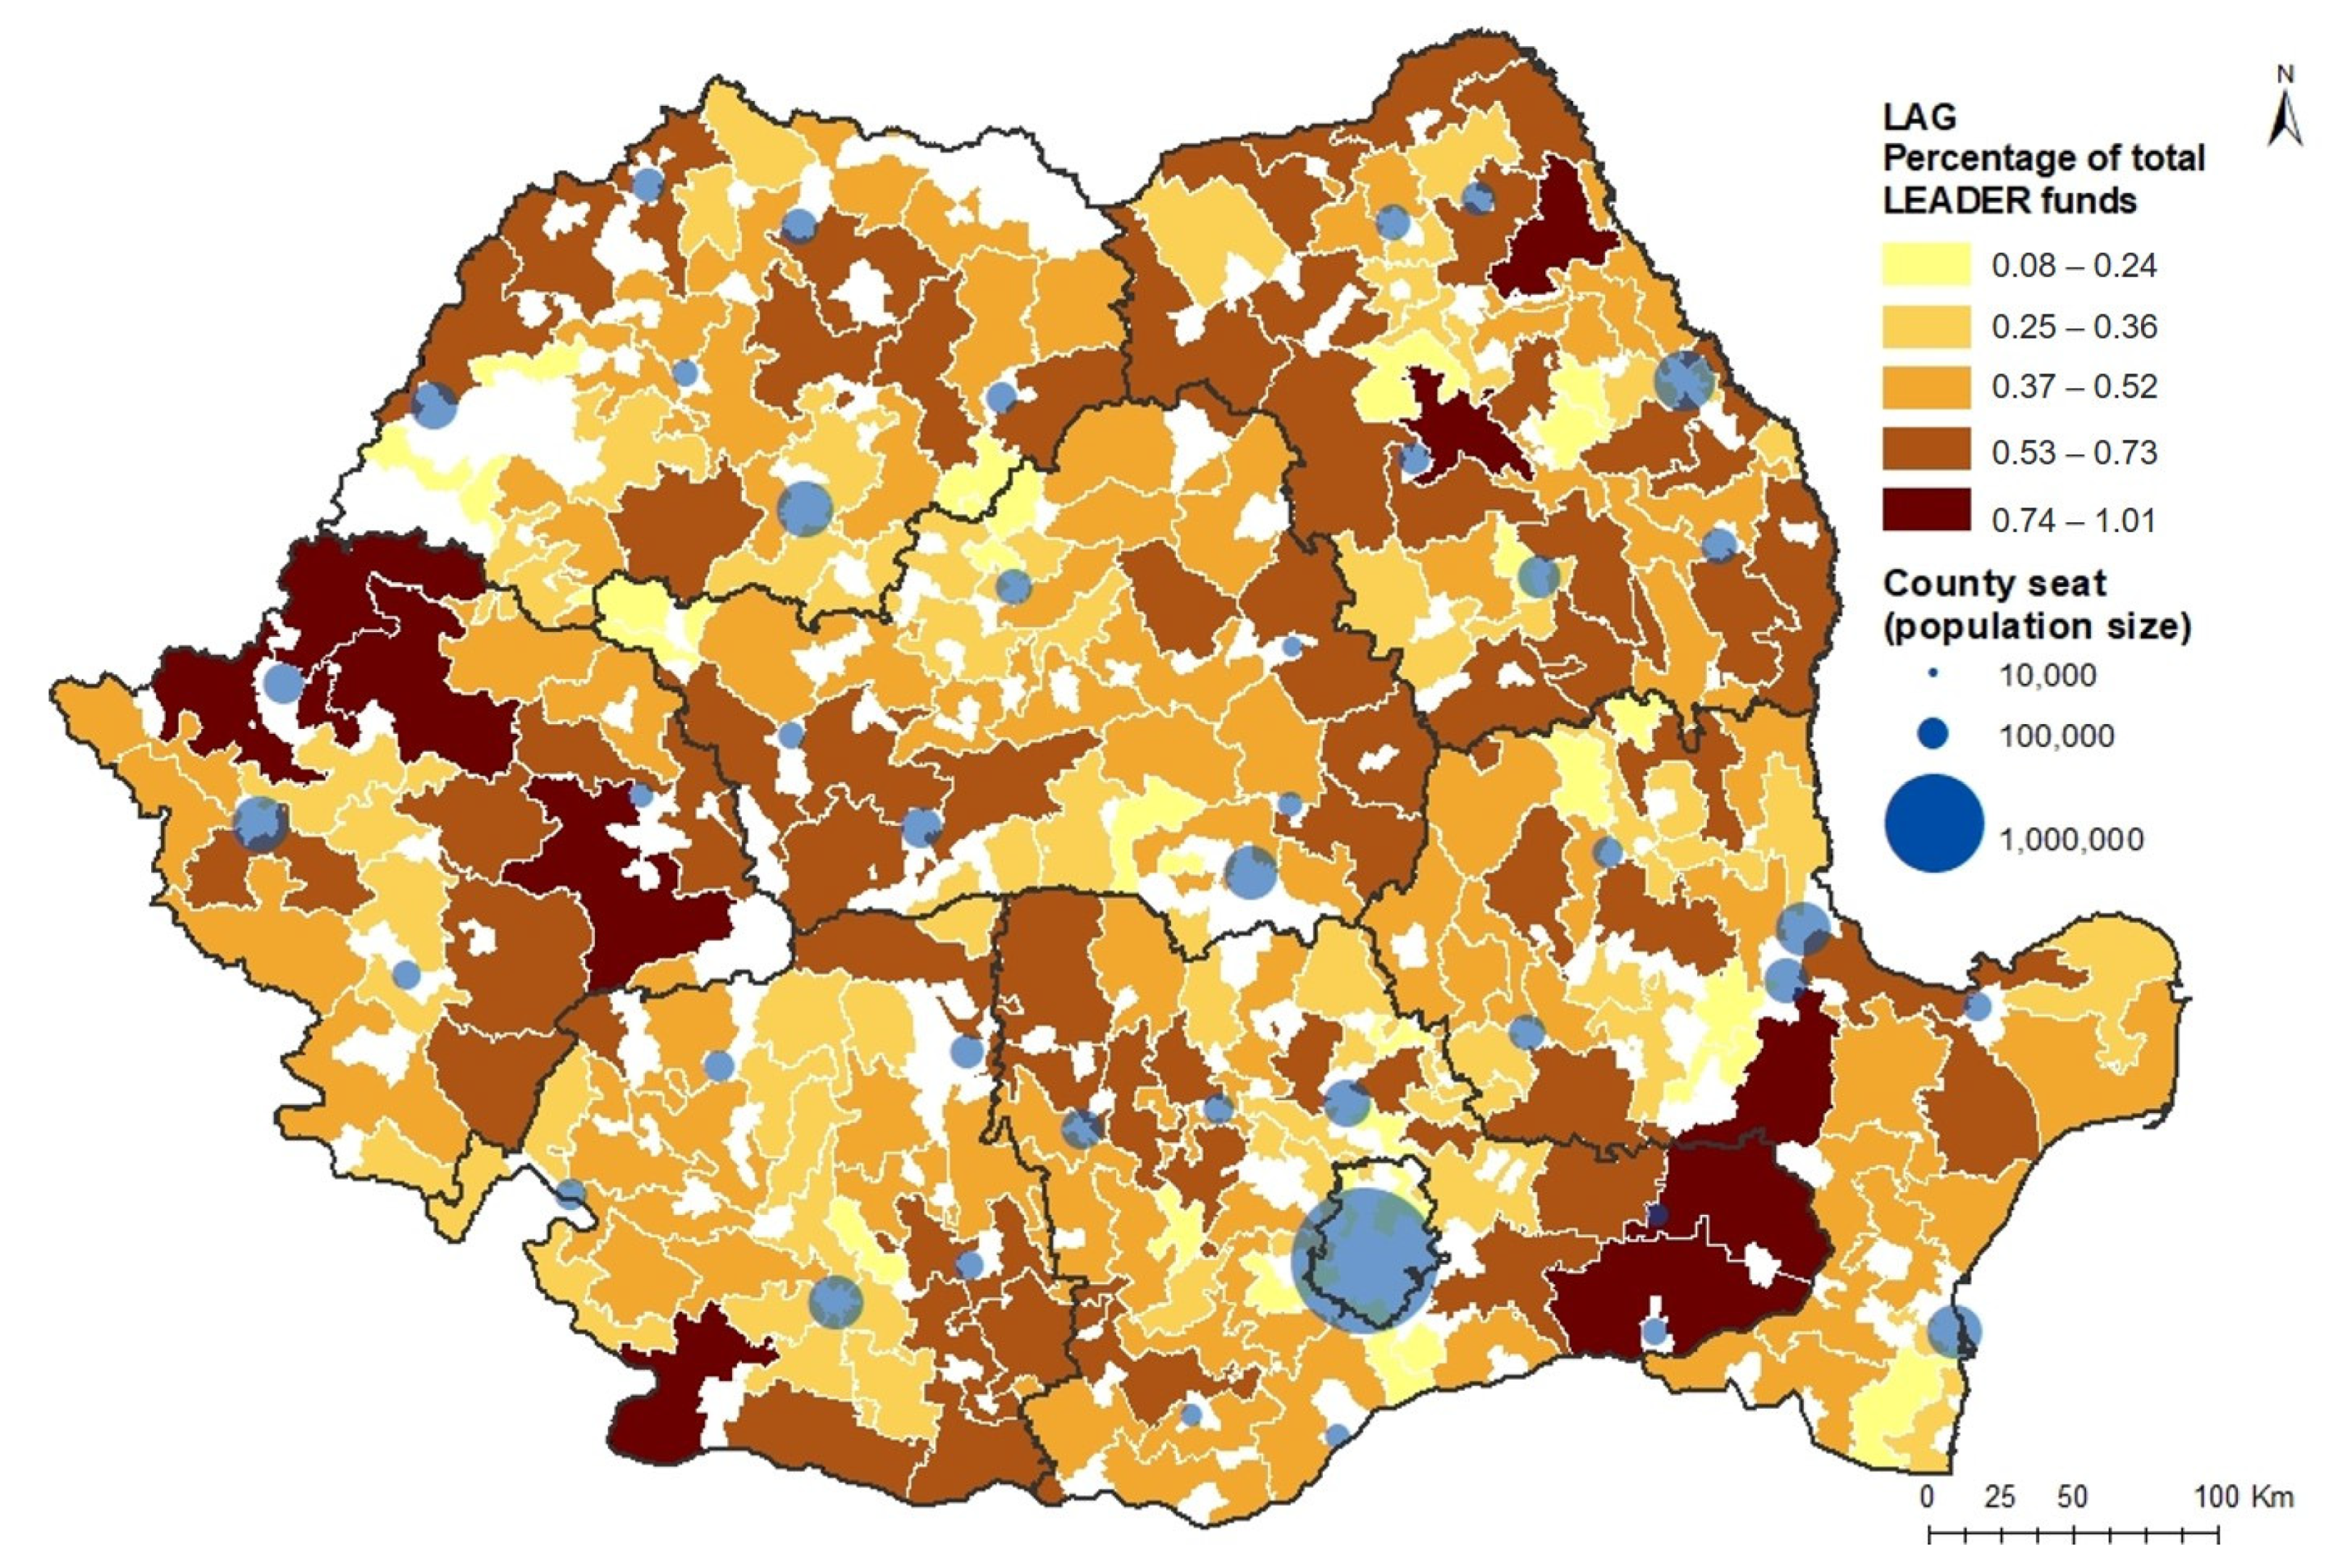
3.2.2. Type and Spatial Distribution of Projects and LEADER Funds Accessed at LAG Level in the 2014–2020 Financing Period

Analysing the results of the first financing period in Romania, 2007–2013, we can say that LEADER was well received by the rural communities, as confirmed by the stakeholder’s willingness to set up new territorial associations and develop LEADER projects. This positive attitude towards the LEADER initiative continued in the second financing period, 2014–2020, when the number of Local Action Groups increased from 163 to 259. Regarding the total number of projects submitted and approved for financing, it remained at a high level, the total value amounting to 7121 projects until 16 June 2020, the financing period being still ongoing at that time. Unlike the 2007–2013 period, the current one is distinguished by a more uniform spatial distribution of projects, new growth poles being developed in regions that had previously performed poorly in this regard (e.g., the west and southwest). If in the first financing period, the spatial distribution of projects seemed to be to a certain extent correlated with the development level, the new LEADER growth poles tend to decrease this relation’s intensity. However, it is necessary to construct a statistical analysis in order to verify the presence or absence of this dependency relation.
Most of the projects of the second financing period were focused on the development of public interest facilities such as parks, social centres, sports facilities, agri-food markets, etc. (see Figure 8). In addition, the projects of modernisation of the local infrastructure or those of acquisition of equipment for the good functioning of the local public administration were registered with a very high frequency. In total, all these reach a value of 2976 projects, meaning 41.7% of the total LEADER initiatives. The trend from one funding period to another has been to supplement the number of projects benefiting the entire local community, so that public initiatives have come to outnumber the private ones. The projects in the “Setting of young farmers” category registered a significant decrease, the value halving compared to the first funding period when they held the leading position in the ranking. The same situation is present in the case of the establishment of new farms/agricultural holdings projects that have decreased dramatically (from 519 to 36).
An opposite evolution is characteristic of the “Development of farms/agricultural holdings” projects that flourished towards the 2014–2020 period. The two categories of projects, “Establishment of farm/agricultural holding” and “Development of farm/agricultural exploitation” tend to complete each other, so that the decrease in the first category appears simultaneously with the progress of the other, indicating that projects initiated with funds from 2007–2013 tend to be consolidated with the financial support of the 2014–2020 period, thus marking the natural evolution of the financing projects. Despite a lower interest in setting up new agricultural enterprises, private actors maintain a high interest in the LEADER initiative, especially in the direction of setting up new non-agricultural activities, with projects in this category reaching almost eight times the initial value. Thus, if the first financing period had, in general, the role of supporting the primary sector by predominantly financing agricultural projects, the second financing period completes it with an orientation towards a new direction. This will help to diversify the activities of the rural economy, one of the main objectives of the LEADER program. In addition, another aspect to note in the 2014–2020 period is the existence of cooperation projects, collaboration being another LEADER objective as important as the diversification of the rural economy that contributes decisively to building and strengthening relations between local actors and, implicitly, to good local governance. Therefore, from the point of view of the typology of projects, the second financing period makes the transition from agricultural specialisation to economic diversification and marks the increase in interest for public projects.
In terms of funds allocated, the second financing period had an increase of 25.5% compared to the previous one, the projects submitted and approved for financing being granted a total of EUR 459,171,412.7. Regarding the distribution of these funds between the 259 LAGs, there is a relatively uniform spatial distribution similar to the first financing period (see Figure 9). In addition, the best performing territorial associations in terms of the degree of funds absorption maintain the same position in the second financing period, this being the case of the LAGs in the central-western part of the country. Another noteworthy aspect is the reduction in the difference in percentage values between LAGs from one financing period to another, from 1.33% in the first period to 0.84% in the second one, which means that the gap between the associations as degree of funds absorption tends to decrease. Thus, regarding the spatial distribution of funds, there are no substantial changes between the two analysed periods, the tendency being to maintain a certain balance between the associations.
The highest amounts of funding in the 2014–2020 period were allocated to public projects, which absorbed 42% of the funds (see Figure 10). Thus, the direction initiated in the first financing period, namely, to allocate most of the funds to public projects, was continued in the second one. However, the first position in the ranking is occupied by projects for which no details were provided regarding their specificity, which makes it difficult to correctly assess the evolution of LEADER initiatives from one financing period to another. Regarding the projects submitted by private actors, most of the funding was directed to the enterprises with non-agricultural activities, which are also the most common types of private projects of the 2014–2020 period. The much lower frequency of projects for setting up new farms/agricultural holdings specific to the 2014–2020 period explains the lower degree of funds absorption by this category, the decrease being of 1.3% between the two financing periods. Thus, taken as a whole, the distribution of funds by project categories in the 2014–2020 period follows the same trends as in the distribution of the total number of projects by categories, reaffirming the existence of a transition from predominantly agricultural initiatives to non-agricultural activities and the increasing interest in public projects between the two periods.
To summarize, the main findings regarding the evolution of implemented projects and funds allocated from the first to the second financing period are as follows:
  • the trend from one funding period to another has been to supplement the number of projects benefiting the entire local community, so that public initiatives have come to outnumber the private ones;
  • if the first financing period had, in general, the role of supporting the primary sector by financing a larger number of agricultural projects, the second financing period completes it with an orientation towards non-agricultural projects;
  • the distribution of funds by project categories in the 2014–2020 period reaffirms the existence of a transition from predominantly agricultural initiatives to non-agricultural activities and the increasing interest in public projects between the two periods

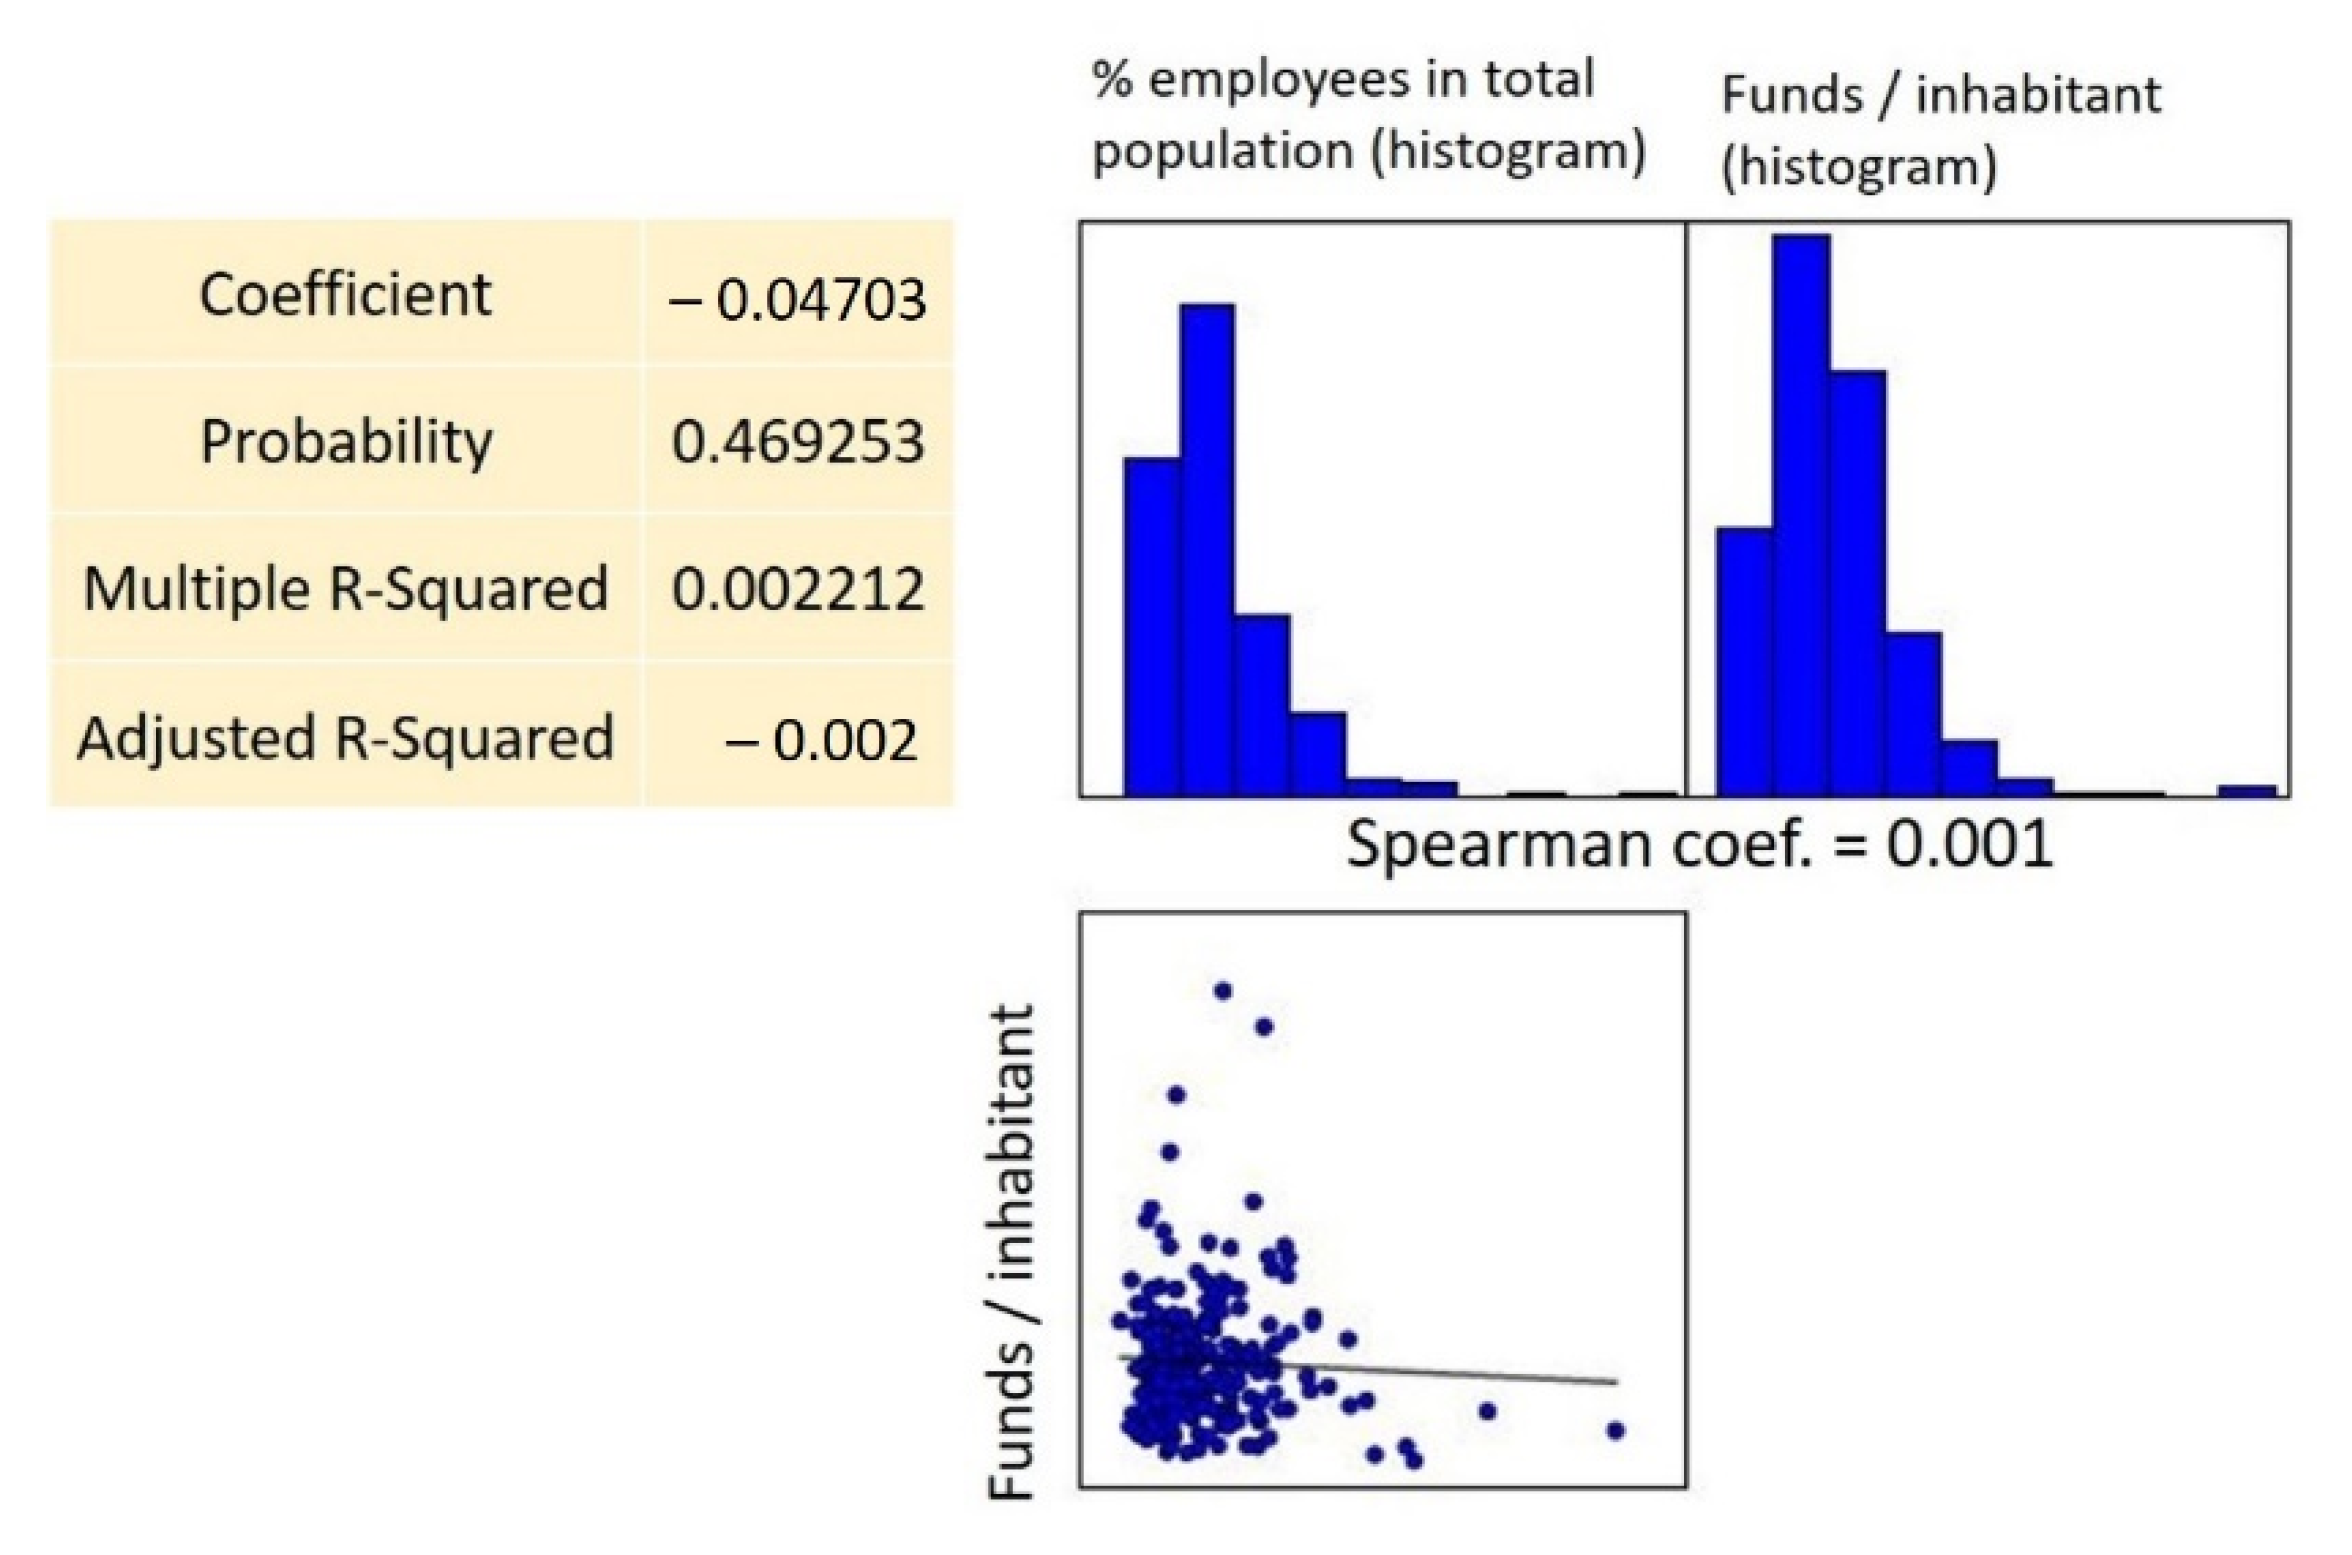
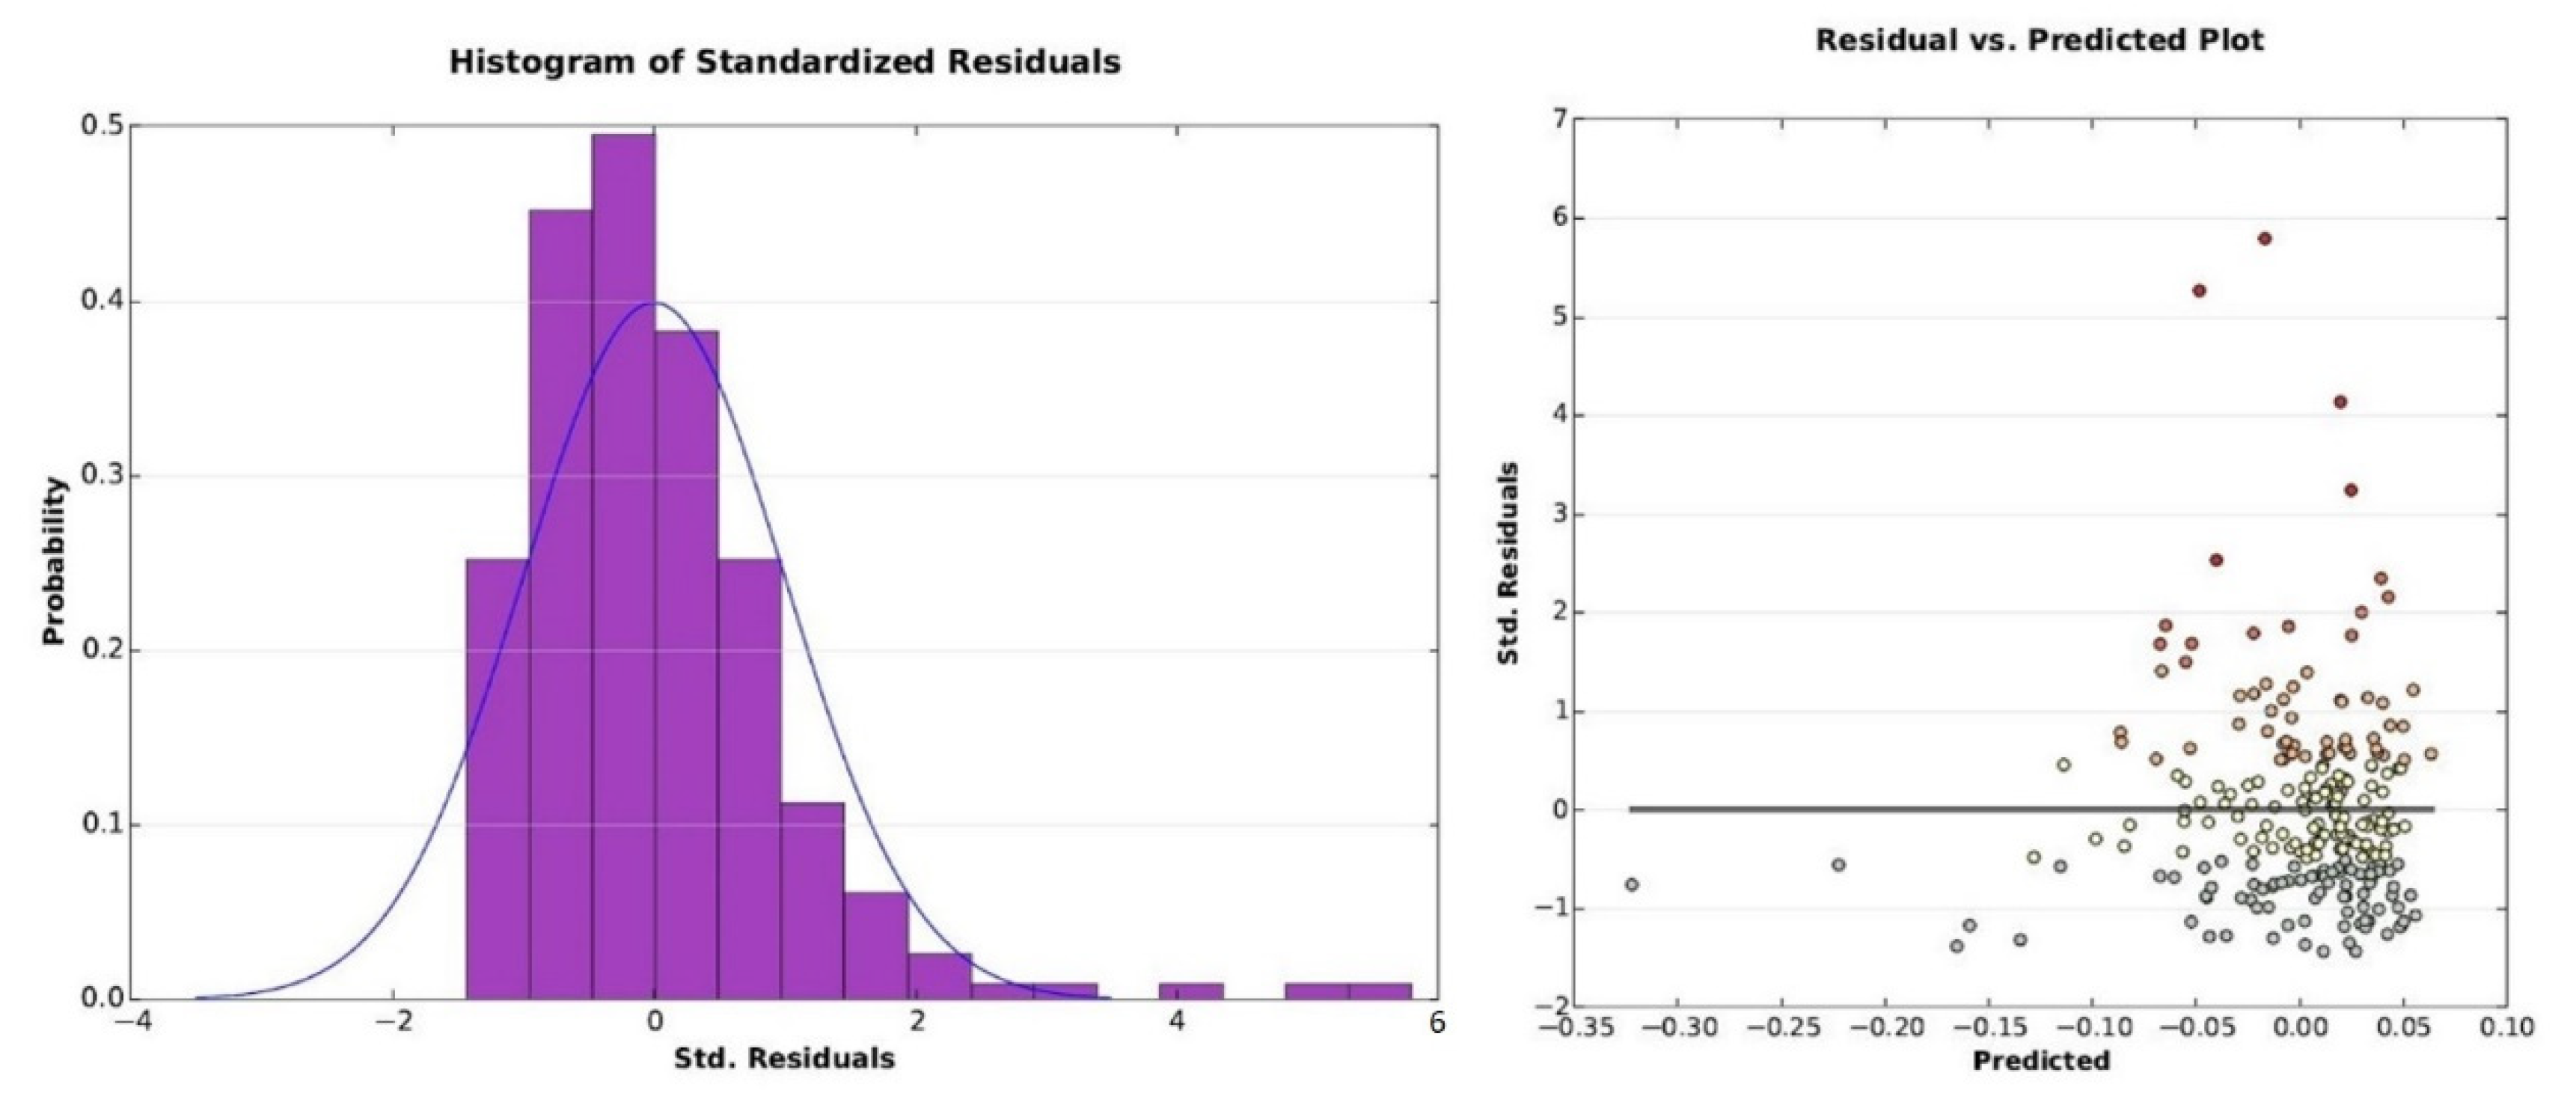
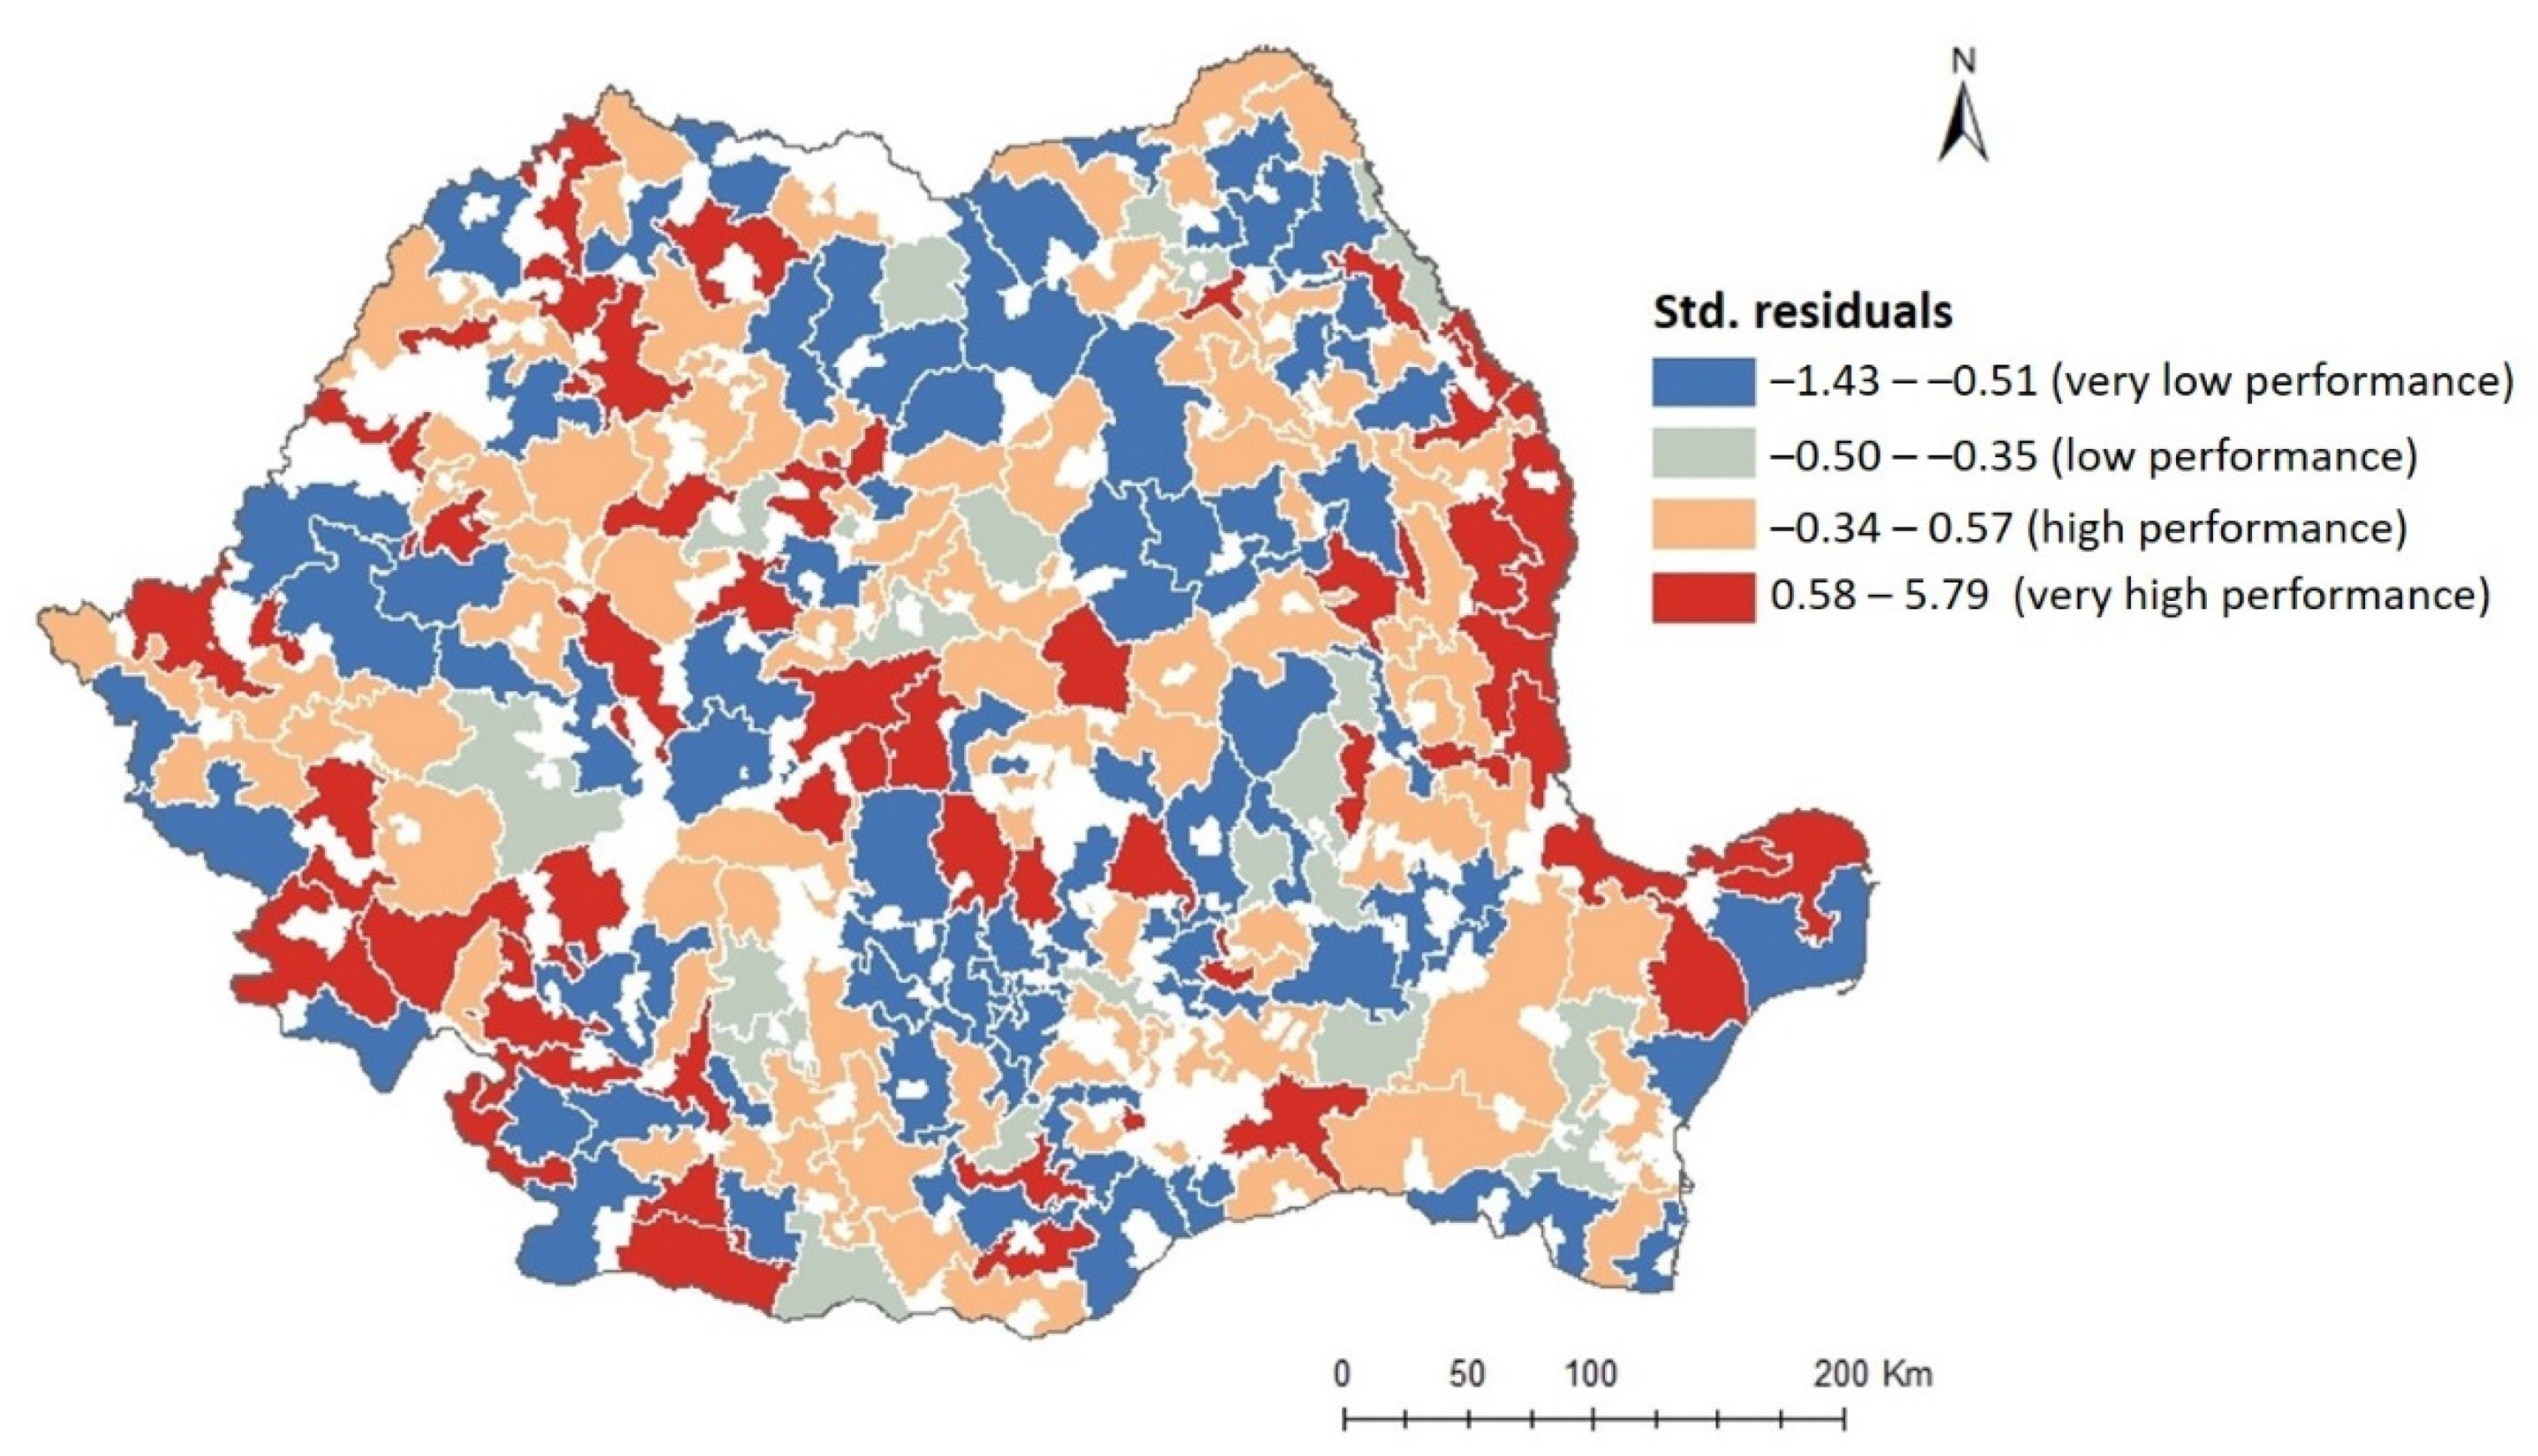
3.3. The Relation between the Development Level Prior to the Implementation of the LEADER Program and the Funds Allocated at LAG Level

The percentage of employees in the total population and LEADER funds per capita were used as indicators in order to assess whether the initial development level of the Romanian rural territory influenced the LAGs performance in implementing projects and absorbing LEADER funds. The LEADER funds per capita were calculated taking into account the total funds allocated to the Romanian LAGs in both funding periods. The values are modest throughout the territory, ranging between a minimum of EUR 14.6/inhabitant and a maximum of EUR 335/inhabitant (see Figure 11). Thus, the differences between the associations as the value of LEADER funds per capita are not profound and do not generate significant gaps between LAGs given that the absolute amplitude of values does not exceed EUR 320. Most of the associations have values between EUR 69 and EUR 105/inhabitant, 33% of them being included in this middle class. Regarding the distribution of values in the territory, there is no spatial pattern, as there are LAGs below average in this respect both in areas with a higher level of development (e.g., the western extremity) and also in those that are more disadvantaged (e.g., east, southwest). However, there is a group of LAGs in the central-western part that has higher values of funds per capita, LAGs that were characterised in 2011 by a medium to high level of development.
The assessment of the relation between the initial development level of LAGs and their performance in absorbing LEADER funds was made based on the results of the OLS regression built between the percentage of employees in the total population (explanatory variable) and LEADER funds per capita (dependent variable). The correlation coefficient between the indicators suggests that there is no dependency relationship, the resulting value being only −0.04, a statistically insignificant value (see Figure 12). The probability of this relationship to be present is also very low, the value resulting from the analysis being only of 0.46. Therefore, the explanatory variable is not a statistically significant one, which suggests that the level of development does not explain or explains very little the distribution of LEADER funds in the territory. The validity of this statement is also confirmed by the values of R, which are also very low and statistically insignificant. Because both variables showed a deviation of values to the left and the point cloud was amorphous, fitting badly to a line, the data were standardised, after which the intensity of the relationship was analysed based on the values of the Spearman coefficient. The coefficient took an insignificant value of 0.001, reaffirming the idea that there is no dependency relationship between the initial development level of LAGs and their performance in absorbing LEADER funds.
The histogram of the standardised residuals largely follows the Gaussian curve, thus confirming that the model on which the estimates were made manages to capture the trends present in the data set (see Figure 13). As for the distribution of residuals, it is an uneven one without showing a spatial pattern. This is highlighted both by the shape of the point cloud resulting from the relationship between the residuals in relation to the predicted values of the dependent variable, the graph not having a clear structure, and by the mapping of standardised residuals.
Thus, LAGs with a much lower performance than estimated in absorbing LEADER funds can be identified both in the eastern part of the country, where disadvantaged rural communities predominate, and in the centre and west, regions characterised by a higher level of development (see Figure 14). The same situation is encountered in the case of LAGs with a performance much higher than the values estimated in the absorption of LEADER funds, these being encountered in both the east and the west, contrasting regions in terms of the level of development. LAGs with predominantly positive residual values outnumber those with predominantly negative residual values. Thus, in 59.4% of the associations, the performance in absorbing LEADER funds was above expectations, and in 40.6% of cases, the performance was below the expected level.

4. Discussions

As Hudečková and Lošťák [25] state, the LEADER program does not bring a new theme in the field of rural development, but it does indicate a new path towards the development of these areas. This path can be a sinuous one if it is not understood and addressed correctly by decision makers and local communities, as demonstrated by the case studies conducted so far on the organisation and functioning of LAGs in various Member States of the European Union. Sufficient examples can be identified in the literature in which LEADER funds have been shown to be directed to more developed rural areas to the detriment of the deeply disadvantaged ones, in this regard the studies conducted by Cañete, Navarro and E. Cejudo [18], Nieto and Cárdenas [24], Medeiros [20], Bakucs, Fertő, Varga and Benedek [21], and Lacquement, Chevalier, Navarro and Cejudo [15] are relevant.
In this context, the present study aimed to analyse the management of LEADER funds in Romania to see if a selective behaviour also predominates in this case, behaviour that favours especially more developed rural territories [49]. The hypothesis underlying the present paper was that the initial development level of the LAGs directly influences their ability to absorb LEADER funds, so that there is a directly proportional relationship between the two. The results confirmed the absence of a dependency relationship, the spatial distribution of funds and the degree of funds absorption by LAGs being somewhat chaotic. It cannot be distinguished a spatial pattern, a link between the performance of funds absorption and the LAGs level of development before the LEADER funding. The values of the statistical parameters resulting from the OLS regression are the main arguments that demonstrate the insignificant relation between the initial development level of LAGs and their performance in absorbing funds. Thus, the obtained results provided the answer to the issue of the present paper, the initial hypothesis being invalidated.
The absence of a directly proportional relationship is certainly a good aspect, as it demonstrates the opposite of the statements of Marquardt et al. [49] and Osti [36], who argue that the LEADER funds are accessible only to elites or that LAGs create the conditions for monopolising the flow of resources to the centre. In addition, another good aspect consists in the predominance of LAGs with a higher performance than expected, 59.4% of the associations having a higher degree of absorption than estimated, LAGs that are located both in the more developed regions but also in the less developed ones. This is proof that the accessibility of LEADER funds is high at the level of the Romanian rural communities, which makes the LEADER program to be considered more of an inclusive tool than a selective one. Thus, the LEADER results in Romania seem to be somehow different from those registered in other European countries that benefited earlier from the European financial support allocated through this program. However, it remains to be seen whether inclusive behaviour is indeed the solution for disadvantaged rural areas to reach a higher level of development. Mack, Fintineru, and Kohler [50] suggest that it might be more useful for European funds to be allocated to a smaller number of territories so that they can receive considerable financial support in order to have visible results in bridging the gaps. Otherwise, a division of funds between several territories with different levels of development could lead to the allocation of insufficient amounts of funds per beneficiary, funds that fail in helping rural communities to truly achieve their goals. Another aspect to be noted is the tendency of less developed LAGs to have more projects than the ones with a high level of development if we consider only the spatial distribution of projects in relation to the developed and less developed regions. This behaviour shows the interest of disadvantaged communities in improving the present level of development by capitalising on the new opportunities offered through the LEADER approach. Although a high activity in the number of implemented LEADER projects is definitely a good aspect, this is not necessarily an assurance that less developed rural communities will succeed in reaching the present level of development specific to the more favoured LAGs. As Bohlin et al. [22] demonstrate in one of their studies, not even by predominantly directing the funds towards less developed regions can we have an assurance of the faster gap reduction. This is because highly developed regions generally benefit from a higher diversity of sources of funding or types of investments, which accelerate their pace of development, even if they do not necessarily have a high number of LEADER projects. However, by implementing LEADER projects predominantly in the highly disadvantaged rural communities, we can have the guarantee of providing the basic conditions for a good living (through different types of public initiatives in the interest of the entire local community) and of diversifying the local economic activities (through private agricultural and non-agricultural projects). In the end, these two objectives contribute to the reduction of both economic and social development disparities.
On the other hand, the bad aspects include the low interest of disadvantaged LAGs to absorb a larger share of LEADER funds compared to the more developed territories, precisely in order to be able to catch up with the latter. These disadvantaged LAGs manage to absorb LEADER funds but without exceeding the performance of the associations with a higher level of development. An explanatory factor could be the human capital specific to the two types of territories. Pinho, Varum and Antunes [51] state that, often, the more developed communities manage to absorb the financial support provided by European programs more efficiently compared to disadvantaged territories due to better prepared human resources. Therefore, the level of development of rural areas expressed by the quality of human resources is likely to manifest a stronger relationship with the degree of LEADER funds absorption than the percentage of employees in the total population used as a benchmark in this study. According to the authors cited above, the degree of funds absorption is dependent on the quality of human resources, which influences the structural, economic, and organisational capacity of the territory. In addition to the quality of human resources, another factor that can lead to an increase in the performance of LAGs to absorb funds is the collaboration with various consulting firms that can make a major contribution in implementing successful projects. According to the authors cited above, not only is the performance in funds absorption different between the developed and least developed territories but so is the impact of European funding itself. Thus, the impact of funds in disadvantaged areas seems to be absent, while in more developed regions, the impact is more visible and is reflected in the economic growth of the territory. Moreover, the same authors state that the effectiveness of European programs in achieving their objectives increases from one financing period to another but especially in the more developed areas that have benefited from this financial support. By contrast, those severely disadvantaged territories that should be the main target of the European development programs, including LEADER, fail to invest the absorbed funds effectively so as to grow, a possible cause being their lower structural and organisational capacity. All this calls into question the ability of the LEADER program to contribute to the well-being of disadvantaged rural areas or the potential of the financial instrument to help them achieve a higher level of development. As Shucksmith et al. [34] state, the very endogenous development specific to the LEADER program can lead to an accentuation of inequalities. This is due to the opportunity to benefit from the LEADER program offered equally to developed and underdeveloped areas, although the latter do not have the same capacity to mobilize resources and form effective external relationships as the previous ones.

5. Conclusions

Coming back to the hypothesis of this paper, we can say that it was invalidated insofar as the LAGs initial level of development did not prove to be a factor influencing the associations’ performance to absorb LEADER funds, as evidenced by the absence of a dependency relationship between the two. This indicates the existence of other factors that have a stronger influence and which act to a greater extent on the spatial distribution of LEADER funds. Mack, Fintineru and Kohler [50] suggest that some of these factors are the proximity of rural settlements to major urban poles, the dominant political parties, the county affiliation of the rural communities or the degree of ethnic homogeneity. Moreover, the quality of human resources and the structural and organisational capacity of territories are other factors that could prove to have a major influence on the performance of LAGs to absorb LEADER funds, especially on their ability to effectively invest this financial support. Thus, the limits of this study consist in having tested only one of the factors that could have influenced the performance of LAGs in supporting disadvantaged rural communities. Future studies could analyse what the other factors are that affect maybe to a greater extent the performance of Romanian LAGs and what is the reason for the absence of a spatial pattern regarding the distribution of LEADER funds.

Author Contributions

Conceptualization, A.-M.O. and L.R.; methodology, A.-M.O. and L.R.; software, A.-M.O. and L.R.; validation, A.-M.O., L.R. and C.I.; formal analysis, A.-M.O., L.R. and C.I.; investigation, A.-M.O. and L.R.; resources, A.-M.O., L.R. and C.I.; data curation, A.-M.O.; writing—original draft preparation, A.-M.O.; writing—review and editing, A.-M.O., L.R. and C.I.; visualization, A.-M.O., L.R. and C.I.; supervision, L.R. and C.I.; project administration, A.-M.O. and L.R. All authors have read and agreed to the published version of the manuscript.

Funding

The Article Processing Charges (APC) was funded by Alexandru Ioan Cuza University of Iasi, Department of Geography.

Institutional Review Board Statement

Not applicable.

Informed Consent Statement

Not applicable.

Data Availability Statement

Publicly available datasets were analysed in this study. This data can be found here: http://opendata.afir.info/ (accessed on 1 April 2020).

Conflicts of Interest

The authors declare no conflict of interest.

References

  1. Mihai, F.C.; Iațu, C. Sustainable Rural Development under Agenda 2030. In Sustainability Assessment at the 21st Century; Bastante-Ceca, M., Fuentes-Bargues, J.L., Hufnagel, L., Mihai, F.C., Iațu, C., Eds.; IntechOpen: London, UK, 2020. [Google Scholar]
  2. United Nationes. Governing Council of the United Nations Development Program, Report on the Twenty-Sixth Session (6 June–16 July 1979); United Nationes: New York, NY, USA, 1979. [Google Scholar]
  3. Erskine, J.M. Rural development: Putting theory into practice. Dev. S. Afr. 1985, 2, 368–382. [Google Scholar] [CrossRef]
  4. European Commision. Fact Sheet—The LEADER Approach (A Basic Guide); European Commision: Brussels, Belgium, 2006. [Google Scholar]
  5. Macken-Walsh, A. Partnership and subsidiarity? A case study of farmers’ participation in contemporary EU governance and rural development initiatives. Rural Soc. 2011, 21, 43–53. [Google Scholar] [CrossRef]
  6. Lopolito, A.; Nardone, G.; Sisto, R. Towards a comprehensive evaluation of local action groups in LEADER programs. New Medit 2011, 1, 43–49. [Google Scholar]
  7. Böcher, M. Regional Governance and Rural Development in Germany: The Implementation of LEADER+. Sociol. Rural. 2008, 48, 372–388. [Google Scholar] [CrossRef]
  8. Müller, O.; Sutter, O.; Wohlgemuth, S. Learning to LEADER. Ritualised Performances of ‘Participation’ in Local Arenas of Participatory Rural Governance. Sociol. Rural. 2020, 60, 222–242. [Google Scholar] [CrossRef]
  9. Menconi, M.A.; Artemi, S.; Borghi, P.; Grohmann, D. Role of Local Action Groups in Improving the Sense of Belonging of Local Communities with Their Territories. Sustainability 2018, 10, 4681. [Google Scholar] [CrossRef] [Green Version]
  10. Esparcia, J.; Escribano, J.; Serrano, J. From development to power relations and territorial governance: Increasing the leadership role of LEADER Local Action Groups in Spain. J. Rural Stud. 2015, 42, 29–42. [Google Scholar] [CrossRef]
  11. Lee, J.; Arnason, A.; Nightingale, A.; Shucksmith, M. Networking: Social capital and identities in european rural development. Sociol. Rural. 2005, 45, 269–283. [Google Scholar] [CrossRef]
  12. Marsden, T. From post-productionism to reflexive governance: Contested transitions in securing more sustainable food futures. J. Rural Stud. 2013, 29, 123–134. [Google Scholar] [CrossRef]
  13. Thuesen, A.A. Is LEADER Elitist or inclusive? composition of Danish LAG boards in the 2007–2013 rural development and fisheries programs. Sociol. Rural. 2010, 50, 31–45. [Google Scholar] [CrossRef]
  14. Ray, C. The EU LEADER program: Rural Development Laboratory. Sociol. Rural. 2000, 40, 163–171. [Google Scholar] [CrossRef]
  15. Lacquement, G.; Chevalier, P.; Navarro, F.; Cejudo, E. Public Action and Territorial Development: The LEADER Approach in the Recomposition of Rural Spaces in Languedoc-Roussillon (France) and Andalusia (Spain). In Neoendogenous Development in European Rural Areas; Cejudo, E., Navarro, F., Eds.; Springer: Cham, Switzerland, 2020; pp. 63–87. [Google Scholar]
  16. Cañete, J.A.; Nieto, A.; Cejudo, E.; Cárdenas, G. Territorial Distribution of Projects Within the LEADER Approach (2007–2013) in Extremadura and Andalusia. In Neoendogenous Development in European Rural Areas; Cejudo, E., Navarro, F., Eds.; Springer: Cham, Switzerland, 2020; pp. 87–109. [Google Scholar]
  17. Maroto-Martos, J.C.; Voth, A.; Pinos-Navarrete, A. The Importance of Tourism in Rural Development in Spain and Germany. In Neoendogenous Development in European Rural Areas; Cejudo, E., Navarro, F., Eds.; Springer: Cham, Switzerland, 2020; pp. 181–205. [Google Scholar]
  18. Cañete, J.A.; Navarro, F.; Cejudo, E. Territorially unequal rural development: The cases of the LEADER Initiative and the PRODER program in Andalusia (Spain). Eur. Plan. Stud. 2018, 26, 726–744. [Google Scholar] [CrossRef]
  19. Christodoulakis, N.; Kalyvitis, S. Achieving convergence within the European Union: The role of structural funds in the case of Greece. Eur. Plan. Stud. 1998, 6, 695–707. [Google Scholar] [CrossRef]
  20. Medeiros, E. Assessing Territorial Impacts of the EU Cohesion Policy: The Portuguese Case. Eur. Plan. Stud. 2014, 22, 1960–1988. [Google Scholar] [CrossRef]
  21. Bakucs, Z.; Fertő, I.; Varga, A.; Benedek, Z. Impact of European Union development subsidies on Hungarian regions. Eur. Plan. Stud. 2018, 26, 1121–1136. [Google Scholar] [CrossRef] [Green Version]
  22. Bohlin, M.; Brandt, D.; Elbe, J. Tourism as a vehicle for regional development in peripheral areas—Myth or reality? A longitudinal case study of Swedish regions. Eur. Plan. Stud. 2016, 24, 1788–1805. [Google Scholar] [CrossRef]
  23. Nieto Masot, A.; Cardenas Alonso, G.; Costa Moreno, L.M. Principal Component Analysis of the LEADER Approach (2007–2013) in South Western Europe (Extremadura and Alentejo). Sustainability 2019, 11, 4034. [Google Scholar] [CrossRef] [Green Version]
  24. Nieto Masot, A.; Cardenas Alonso, G. Método LEADER como política de desarrollo rural en Extremadura en los últimos 20 años (1991–2013). Boletín De La Asoc. De Geógrafos Españoles 2015, 69, 139–162. [Google Scholar]
  25. Hudečková, H.; Lošťák, M. LEADER in the Czech Republic and the farming sector. Agric. Econ.—Czech 2008, 54, 555–565. [Google Scholar] [CrossRef] [Green Version]
  26. Pechrova, M.; Boukalova, K. Differences Among Czech Local Action Groups in Using Selected Principles of LEADER. Sci. Agric. Bohem. 2014, 46, 41–48. [Google Scholar] [CrossRef] [Green Version]
  27. Straka, J.; Tuzova, M. Factors Affecting Development of Rural Areas in the Czech Republic: A Literature Review. Procedia-Soc. Behav. Sci. 2016, 220, 496–505. [Google Scholar] [CrossRef] [Green Version]
  28. Spada, A.; Fiore, M.; Caruso, D.; Conto, F. Explaining Local Action Groups heterogeneity in a South Italy Region within Measure 311 Axis III notice of LDP. Agric. Agric. Sci. Procedia 2016, 8, 680–690. [Google Scholar] [CrossRef] [Green Version]
  29. Olar, A.; Jitea, M.I. Enabling Factors for Better Multiplier Effects of the LEADER Programme: Lessons from Romania. Sustainability 2021, 13, 5184. [Google Scholar] [CrossRef]
  30. Shucksmith, M. Endogenous Development, Social Capital and Social Inclusion: Perspectives from LEADER in the UK. Sociol. Rural. 2000, 40, 208–218. [Google Scholar] [CrossRef]
  31. Marquardt, D.; Möllers, J.; Buchenrieder, G. Social Networks and Rural Development: LEADER in Romania. Sociol. Rural. 2012, 52, 398–431. [Google Scholar] [CrossRef]
  32. Navarro, F.A.; Woods, M.; Cejudo, E. The LEADER Initiative has been a Victim of Its Own Success. The Decline of the Bottom-Up Approach in Rural Development programs. The Cases of Wales and Andalusia. Sociol. Rural. 2016, 56, 270–288. [Google Scholar] [CrossRef]
  33. Capros, P.; Karadeloglou, P. Macroeconomic Impacts of Structural Funds on the Greek Economy; Institute of Economic and Industrial Research: Athens, Greece, 1989. [Google Scholar]
  34. Shucksmith, M.; Brooks, E.; Madanipour, A. LEADER and Spatial Justice. Sociol. Rural. 2021, 61, 322–343. [Google Scholar] [CrossRef]
  35. Nieto Masot, A.; Cárdenas Alonso, G. 25 Years of the Leader Initiative as European Rural Development Policy: The Case of Extremadura (SW Spain). Eur. Countrys. 2017, 9, 302–316. [Google Scholar] [CrossRef] [Green Version]
  36. Osti, G. LEADER and partnerships: The case of Italy. Sociol. Rural. 2000, 40, 172–180. [Google Scholar] [CrossRef]
  37. Chevalier, P.; Maciulyte, J.; Razafimahefa, L.; Dedeire, M. The LEADER programme as a model of institutional transfer: Learning from its local implementation in France and Lithuania. Eur. Countrys. 2017, 2, 317–341. [Google Scholar] [CrossRef] [Green Version]
  38. Chevalier, P.; Maurel, M.; Polá, P. Experiments with the LEADER approach in Hungary and the Czech Republic: Two different political rationales. Rev. d’Etudes Comp. Est-Ouest 2012, 43, 91–143. [Google Scholar] [CrossRef] [Green Version]
  39. Teilmann, K.A.; Thuesen, A.A. Important Types of LAG–Municipality Interaction When Collaborating on Rural Development: Lessons from Danish LEADER LAGs. Int. J. Rural Manag. 2014, 10, 21–45. [Google Scholar] [CrossRef]
  40. Nedelcu, A.; Tătaru, A.; Subić, J.; Kuzman, B. The Local Action Group, Local Sevelopment Model based on Community. Case Study-LGA “Land of Vineyards and Wine” Vrancea. Procedia Econ. 2015, 22, 706–715. [Google Scholar] [CrossRef] [Green Version]
  41. Pocol, C.B.; Moldovan-Teselios, C.; Cavicchioli, D.; Cordea, M.I. Has the LEADER programme been effective in promoting local rural development? An evaluation on two Romanian regions. AgroLife Sci. J. 2017, 6, 201–211. [Google Scholar]
  42. European Commision. Commission Staff Working Document: Country Report Romania 2020; European Commision: Brussels, Belgium, 2020. [Google Scholar]
  43. Cristea, M.; Mare, C.; Moldovan, C.; China, A.M.; Farole, T.; Vințan, A.; Park, J.; Garrett, K.P.; Ionescu-Heroiu, M. Magnet Cities: Migration and Commuting in Romania; World Bank: Bucharest, Romania, 2017. [Google Scholar]
  44. Török, I.; Benedek, J. Spatial patterns of local income inequalities. J. Settl. Spat. Plan. 2018, 2, 77–91. [Google Scholar] [CrossRef]
  45. Jaba, E.; Ionescu, A.M.; Iațu, C.; Balan, C. The evaluation of the regional profile of the economic development in Romania. In Proceedings of the ASDRL Colloque, Dynamiques Territoriales, Clermont-Ferrand, France, 7 June–7 August 2009. [Google Scholar]
  46. Mitrică, B.; Șerban, P.; Mocanu, I.; Grigorescu, I.; Damian, N.; Dumitrașcu, M. Social Development and Regional Disparities in the Rural Areas of Romania: Focus on the Social Disadvantaged Areas. Soc. Indic. Res. 2020, 152, 67–89. [Google Scholar] [CrossRef]
  47. Bański, J. Suburban and peripheral rural areas in Poland: The balance of development in the transformation period. Geogr. Cas. Slov. Akad. Vied. 2005, 57, 117–130. [Google Scholar]
  48. Patache, L.; Chiru, C.; Bebeșelea, M. Rural employment and decent work in Romania. Ann. Spiru Haret Univ. Econ. Ser. 2018, 18, 53–62. [Google Scholar] [CrossRef] [Green Version]
  49. Marquardt, D.; Mőllers, J.; Buchenrieder, G. Why Do We Need Networking for European Rural Development Policies? The implementation of LEADER and the National Network for Rural Development in Romania. EuroChoices 2011, 10, 22–29. [Google Scholar] [CrossRef]
  50. Mack, G.; Fintineru, G.; Kohler, A. Effects of EU rural development funds on newly established enterprises in Romania’s rural areas. Eur. Plan. Stud. 2020, 29, 291–311. [Google Scholar] [CrossRef]
  51. Pinho, C.; Varum, C.; Antunes, M. Structural Funds and European Regional Growth: Comparison of Effects among Different Programming Periods. Eur. Plan. Stud. 2015, 23, 1302–1326. [Google Scholar] [CrossRef] [Green Version]
Figure 1. Territorial expansion of the Local Action Groups (LAGs) network in Romania on 2 October 2019. Data source: Ministry of Agriculture and Rural Development (MADR).
Sustainability 13 12187 g001
Figure 2. Methodological flow chart.
Sustainability 13 12187 g002
Figure 3. The Romanian LAGs’ level of development by the percentage of employees in the total population (year 2011). Data source: National Institute of Statistics (INS).
Sustainability 13 12187 g003
Figure 4. Spatial distribution of LEADER projects funded in the first financing period (2007–2013). Data source: National Payment Agency for Rural Development and Fishing (AFIR).
Sustainability 13 12187 g004
Figure 5. Number of LEADER projects submitted in Romania in the 2007–2013 financing period (main categories). Data source: Romanian Agency for Financing Rural Investments (AFIR).
Sustainability 13 12187 g005
Figure 6. The spatial distribution of LEADER funds in Romania during the 2007–2013 financing period. Data source: AFIR.
Sustainability 13 12187 g006
Figure 7. LEADER funds absorbed in Romania during 2007–2013 financing period by categories of projects. Data source: AFIR.
Sustainability 13 12187 g007
Figure 8. Number of LEADER projects submitted in Romania in the 2014–2020 financing period by main categories. Data source: AFIR.
Sustainability 13 12187 g008
Figure 9. Spatial distribution of LEADER funds in Romania during the 2014–2020 financing period. Data source: AFIR.
Sustainability 13 12187 g009
Figure 10. LEADER funds absorbed in Romania by project categories (2014–2020 financing period). Data source: AFIR.
Sustainability 13 12187 g010
Figure 11. LEADER funds per capita allocated between 2007 and 2020. Data source: AFIR.
Sustainability 13 12187 g011
Figure 12. Ordinary Least Square (OLS) regression—the values of the main statistical parameters.
Sustainability 13 12187 g012
Figure 13. Histogram of standardised residuals and the relation between the residuals and the estimated values.
Sustainability 13 12187 g013
Figure 14. The relation between the development level and the absorbed LEADER funds (OLS regression results).
Sustainability 13 12187 g014
Publisher’s Note: MDPI stays neutral with regard to jurisdictional claims in published maps and institutional affiliations.

