Abstract
Ports form a vital link in the global maritime supply chain, and adherence to the UN sustainable goals in each port development and operation is all-important. Improving the sustainability performance of port infrastructure requires identifying all relevant aspects of sustainability, defining suitable performance measures, applying tools for quantification, and proposing intervention measures if needed. We present a framework for assessing and managing the sustainability performance of port infrastructure incorporating these elements. We apply the framework to quay walls in the Port of Rotterdam (PoR); however, the information to assess only four out of fourteen sustainability themes was available. This fact underlines the need for sustainability monitoring and reporting. We also present a case study of a quay wall in PoR. Based on the vision of PoR and literature, the sustainability theme ‘air pollutants’ was given priority, the selected performance measure being the Greenhouse Gas (GHG) emissions. Dubocalc was chosen as a quantification tool and estimated a total emission of 1.9 kt of CO2eq for a 100-m length of quay wall over a 100-year lifecycle. The measures proposed to achieve climate neutrality in 2050 include using renewable energy for the Impressed Current Cathodic Protection and the temporary drainage systems, electrified transport and machinery, hydrogen as dredging fuel, and steel with hydrogen as a reduction-agent in the future. These could result in a total GHG reduction of 86% by the year 2050.
1. Introduction
1.1. Background
In the current social climate, as the idea of sustainability permeates all scales, how to improve sustainability performance, be it of a business, an organisation, a product, or a process, is an essential question. More and more, project stakeholders, and civil society in general, are demanding and expecting sustainability to be integrated into infrastructure projects, which inevitably result in adverse environmental and social impacts. Therefore, the owners, developers, designers, and planners of infrastructure projects are all interested in facilitating sustainable solutions.
Brundtland Commission defines sustainability as “the development that meets the needs of the present without compromising the ability of future generations to meet their own need” [1]. A commonly used definition for port sustainability is: ”Business strategies and activities that meet the current and future needs of the port and its stakeholders, while protecting and sustaining human and natural resources” [2].
Sustainability, however, remains a concept where stakeholders and experts give different interpretations or set of other priorities related to their background and interests [3]. Therefore, though an essential idea of the 21st century, yet it remains elusive in implementation. The multi-perspective character of sustainability, the variety of goals and stakeholders involved, the lack of appropriate performance indicators and suitable measurement tools present a challenge for integrating sustainability performance into business [4,5,6]. Among those seeking tools that assist in implementing sustainability are the port authorities. As asset owners, they do not only have to meet sustainability targets to comply with regulatory requirements and respond to stakeholder and public pressure to reduce environmental burdens but are required to drive innovation and investment while influencing future practice and regulation [7].
Terms such as Sustainability Performance Management, sustainability accounting, and sustainability reporting emerged only a decade ago. However, the current global trends in sustainability performance indicate that sustainable practices will form a part of an organisation’s core strategy. The practices will move beyond generalized standards to a more precise analysis of the sustainability of specific processes and activities. Finally, there will be a shift from reporting impact to reporting and managing performance [8]. Therefore, the subject is a source of interest for managers as well as academic researchers.
1.2. Literature Review, Problem Statement and Research Objective
Ports play a central role in connecting the water and land domains of the maritime supply chain. Expansion of ports and their operations has adverse environmental and social impacts. Ports, therefore, face many increasing challenges from social, economic, and environmental factors impacting port performance and management [9]. Port development and operations can no longer be only guided by economic considerations but have to follow the environmental and energy regulations for monitoring and reducing the negative effects derived from their activities and operations, especially in terms of climate change and global warming [10].
Keeping in line with UN SDG 13 ‘Climate change’ and SDG 9 ‘Industry, innovation and Infrastructure’, sustainable port development is a subject of avid interest; therefore, many studies are ongoing, and various international standards are being set up or updated [11]. Numerous publications address sustainability in ports [12,13,14,15,16,17,18,19]. Ref. [9] states that though many studies have been conducted on infrastructure maintenance planning and strategy development, also in ports, literature over sustainable issues in infrastructure planning and development is limited. They propose a framework for improving the sustainability of maintenance strategies for port infrastructures based on a proposed randomized structural deterioration model. Ref. [20] analyses renewable energy supply and energy demand management for seaports. Ref. [21] mentions that emission reduction is a direct consequence of the energy efficiency, electrification of equipment, the use of alternative fuels and renewable energy sources. Ref. [22] analyses state-of-the-art related to the implementation of renewable energy devices and energy efficiency measures in port infrastructure. Ref. [23] presents a systematic literature review to analyse operational strategies for renewable energy, alternative fuels and energy management systems for improving the energy efficiency and environmental performance of ports and terminals.
Port-related organisations such as the American Association of Port Authorities (AAPA), US Environmental protection Agency (EPA), European Sea Port Organization (ESO), International Association of Ports and Harbours (IAPH), United Nations Environment Programme (UNEP), United Nations Conference on Sustainable Development (UNCSD), Member World Association for Waterborne Transport Infrastructure (PIANC), US Army Corps of Engineers (USCAE), and World Wide Fund for Nature (WWF), are frequently updating their international guidelines for sustainable port development.
Despite this, there is no universal agreement over an approach to sustainability since the concept of sustainability is context, scale-, place-, and time-related. Therefore, critical elements for including sustainability in the development of infrastructure are defining sustainability, which means identifying its most relevant themes, defining suitable performance measures or indicators, and quantifying these indicators before developing strategies to enhance sustainability. The management of sustainability performance requires a sound framework. In recent times, consistent frameworks for doing so have been presented in the literature but require considerable effort to implement. Though some tools for quantification exist in the GWW sector (which refers to ground, road, and hydraulic engineering), their application for port infrastructure is neither transparent nor frequent.
The objective of this paper is two-fold:
- Identify relevant themes of sustainability for port infrastructure and develop a generic framework to assess and manage the sustainability performance of port infrastructure. The framework should include a quantification tool.
- Apply the framework to a case study to improve the sustainability performance of quay walls in the Port of Rotterdam (PoR). Essential is evaluating the selected quantification tool to examine if all sustainability themes are covered and assessing objectively.
The data for the research has been collected using literature sources, conducting interviews with PoR personnel and dredging firms, and sending out questionnaires to be completed by the port technical consultants. All data is available in [24].
1.3. Structure of the Report
2. Framework for Assessment and Management of Sustainability of Port Infrastructure
2.1. Identifying Key Sustainability Themes
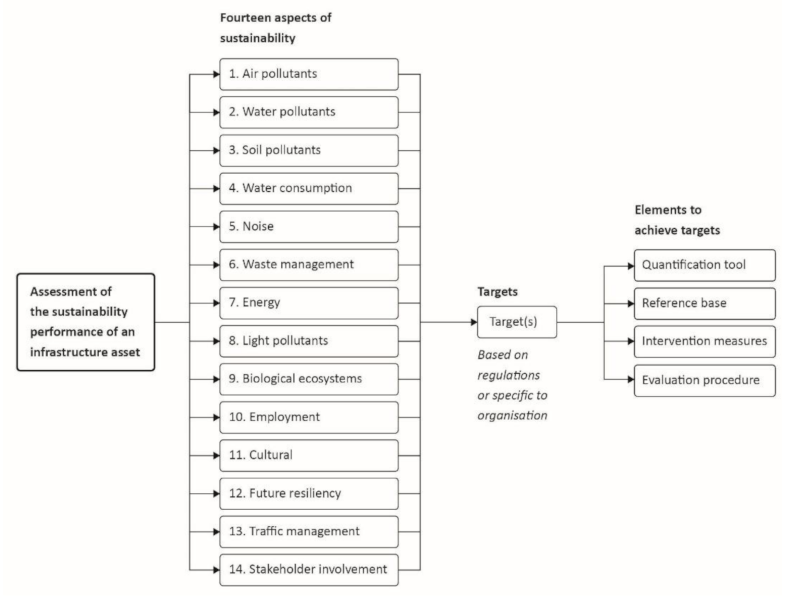
To develop a framework to assess port infrastructure on its sustainability performance, an exhaustive literature review was carried out. It included reports by international institutes such as International Finance Corporation (IFC), International Finance Corporation-Performance Standard (IFC-PS), International Finance Corporation-Environmental, Health and Safety (IFC-EHS), United Nations-Sustainability Development Goals (UN-SDG), Building Research Establishment Environmental Assessment Method (BREEAM), Civil Engineering Environmental Quality Assessment and Award Scheme (CEEQUAL), and Ambitieweb (a collaboration of parties from the Rail and Ground, Road and Hydraulic engineering sector on raising sustainability to a higher level in the sector). The review resulted in a list of fourteen key sustainability themes for port infrastructure assets. It included: water pollutants, soil pollutants, air pollutants, light pollutants, noise, employment, waste management, energy, biological ecosystems, water consumption, culture, future resilience, traffic management, and stakeholder involvement.
2.2. Description of the Framework
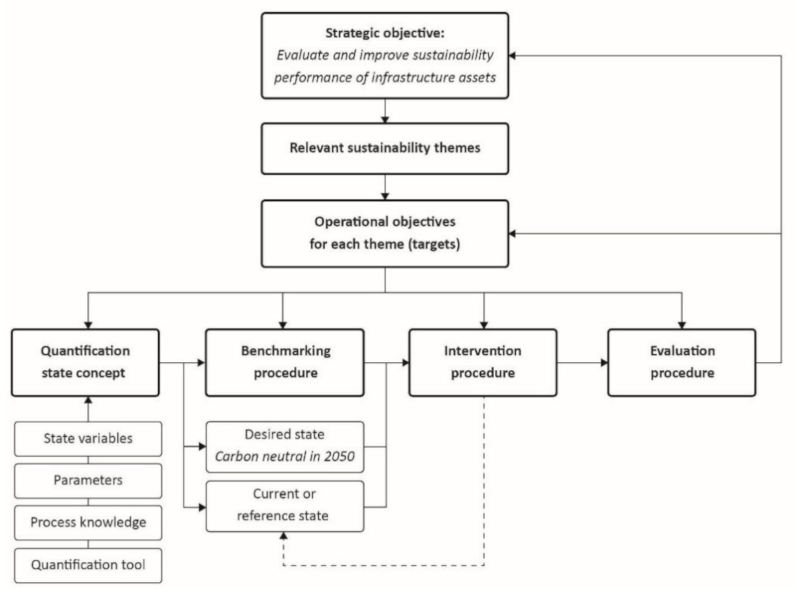
Next, a systematic framework for assessing the sustainability performance of port infrastructure was formulated based on the Frame of Reference (FoR) approach [25]. The FoR approach aims at structuring the interaction between end-users and specialists in application-oriented knowledge development. This approach has been applied to multiple disciplines, such as building with nature, adaptive management, and sustainable coastal policy development, to achieve different objectives. The framework is shown in Figure 1 and briefly described here.

Figure 1.
Framework for managing sustainability performance of a quay wall based on [25].
The initial step requires a definition of objectives at strategic and operational levels. The strategic objective often refers to an overarching larger-scale goal. In the present case, the strategic objective is to evaluate and improve the sustainability performance of the infrastructure assets. The operational objective(s) represent the targets to be reached to achieve the strategic objective. These targets are generally based on the governing regulations or specific requirements of the organisation. The strategic objective has been broken down into multiple operational objectives, (i.e., fourteen themes of sustainability applicable to port infrastructure assets) to help an organisation deal with the numerous dimensions of sustainability systematically. The system is characterised by state variables that describe the current state of the system but can also be given values that reflect the desired state. A quantification tool and a reference base (current state), and the desired state are defined for each theme. After quantifying the variables in the quantitative state concept, the present and desired states are compared. A benchmarking procedure makes it possible to determine if the intervention procedure should be triggered, wherein interventions required to reach the desired state are set up. An evaluation procedure determines if the operational objective is achieved or not. The infrastructure can be considered sustainable if the target(s) in every theme can be met. The final step evaluates if the strategic objective has been achieved.
2.3. Application of the Framework to Port Infrastructure
Next, an initial assessment of the port infrastructure was attempted using the framework. The port authority generates revenue through cargo handling, port usage, and land leases, and its core business is economic growth. However, economic growth must be balanced with the social and environmental impacts. Consequently, in the sustainability assessment framework, only the environmental and social dimensions are considered.
Figure 2 depicts the information required to apply the framework and carry out the assessment. The details can be found in [24], and a summary of the results follows.

Figure 2.
Framework for managing sustainability performance of a quay wall.
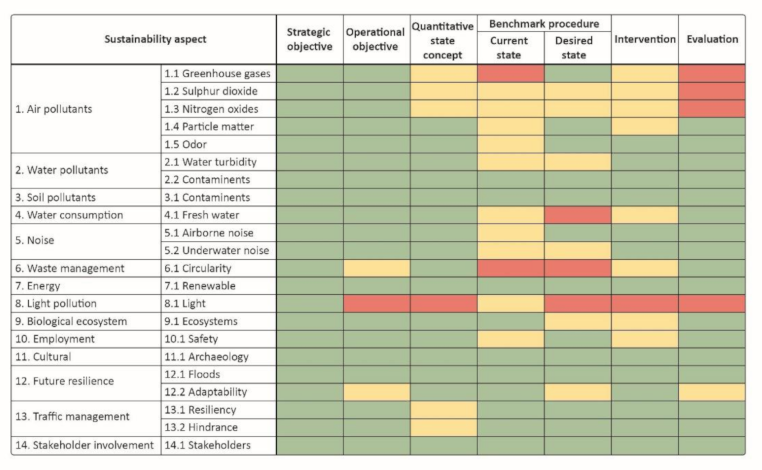
Figure 3 displays the sustainability themes and sub-themes in the first two columns and the elements required within the framework to form an assessment in the remaining columns. The cells have different colours. The colour green signifies that a reliable source of information is available. The yellow colour indicates that the available information is questionable. The colour red means that a reliable source does not specify the element.

Figure 3.
The framework applied to port infrastructure in Rotterdam.
In the past, sustainability monitoring and reporting were not given much attention by port organisations, and it was only recently that guidelines for sustainable ports and sustainability reporting [7] was published. For this reason, information over the quantification tool, current state, intervention measures, and evaluation procedures over the port infrastructure was far from complete. Therefore, eleven of the themes could not be assessed using the framework. This limitation highlights the importance of sustainability reporting in the future.
In the next section, the framework application is illustrated in a case study where air pollutants are the prioritised sustainability theme. A reasonable amount of information is available to assess sustainability performance.
3. Application of the Framework to a Case Study
3.1. Introduction
A landlord port authority such as the Port of Rotterdam Authority (PoRA) in the Netherlands invests in developing the existing port area, new port sites, and infrastructure. Ports are, by their nature, capital intensive operations, and the environmental impact of capital investments needs to be accounted for. How to do this is a crucial challenge for PoRA. Port infrastructure such as quay walls provides an interface between land and water and is a means for reliable and rapid transhipment of goods. Efficient transfer at the quay wall interface is required for the commercial and operational success of any terminal or port. PoR has approximately 80 km of quay wall. They are essential assets for a port authority representing massive capital investment and enhancing the sustainability of quay walls and all other infrastructure is an endeavour of PoR.
3.2. Case Study Description
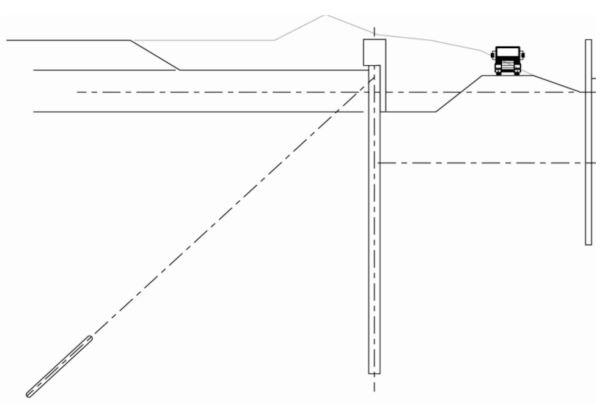
An ongoing project at the Port of Rotterdam was selected as a case study. It consisted of a quay wall and a jetty to accommodate barges (vessels of class between CEMT IV and CEMT VIb). Figure 4 shows the cross-section of the quay wall. It is an anchored wall with a reinforced concrete capping beam on which bollards are mounted. The substructure is a combined steel sheet pile wall system consisting of tubular steel piles at a fixed distance, coupled with standard sheet piles. The anchoring system consists of grout anchors and anchor piles. The quay wall has a rigid fender of recycled High-Density Polyethylene slabs. Quay ladders and the corrosion protection of the steel wall using Impressed Current Cathodic Protection (ICCP) system are a part of the system.

Figure 4.
Cross-section of the quay wall.
3.3. Steps in Application of the Framework
Step 1: Define strategic and operational objectives.
Based on the vision and mission statement of PoR and various sources [26,27,28,29,30], the strategic objective was identified as no air pollution in 2050, the operational objective being the reduction of the GHG emission by 49% in 2030 concerning the 1990 level and becoming climate-neutral in 2050.
Step 2: Prioritise sustainability themes(s) to be addressed for the case study.
This step is carried out in consultation with the port authority that is responsible for the quay wall. Based on internal reports of PoR and personnel interviews, air-, water-, soil-, and noise pollution, the safety of employees, and biodiversity were identified as prioritised sustainability themes. The theme ‘air pollutants’ was given priority for quay walls, and the selected performance measure was GHG emissions. Scientific literature [31] also indicates that air pollution is one of the major environmental impacts of maritime ports.
Step 3: Understand the system and define the current and desired state.
The lifecycle of navigational infrastructure consists of the following phases: design; material extraction, processing, manufacturing, transport; construction; operation and maintenance, disposal or recycling [32]. GHG emissions are primarily in the design phase (due to material production), construction, and end-of-life phase of a quay wall. The emission is the lowest in the maintenance phase.
The carbon footprint of PoR and its cluster is approximately 25 megaton CO2eq in the year 2015–2016 [33,34]. Carbon dioxide equivalent (CO2eq) stands for a unit based on the global warming potential (GWP) of different greenhouse gases. The CO2eq unit measures the environmental impact of one tonne of these greenhouse gases in comparison to the impact of one tonne of CO2. Most of that carbon emission at PoR is due to the industrial cluster’s generation and usage of energy. Though emission data is available for categories such as dredging work during construction and maintenance; soil excavation and backfill; bed, bank, and shore protection; steel and concrete, the values fluctuate considerably. Therefore, it was not possible to establish the current state of the quay wall due to insufficient information. The desired state is the carbon neutrality of all PoR infrastructure projects in 2050.
Step 4: Selection, evaluation, and application of a quantification tool.
A common way to quantify GHG emission during the life cycle of infrastructure projects is to carry out life cycle assessments (LCA) using databases such as Ecoinvent, USLCI, and Nationale Milieu Database (NMD). Various software is available to simplify LCA, such as SimaPro and DuboCalc. SimaPro is a product modelling and assessment software and runs on Ecoinvent data. DuboCalc is developed by Rijkswaterstaat (Directorate-General for Public Works and Water Management in the Netherlands) for infrastructure, construction, and utility projects. It uses data from NMD and calculates the environmental effects of material and energy usage for objects in infrastructure projects over their lifecycle [35]. The result denominated in euros is the Environmental Costs Indicator (MKI), whereby a higher MKI value indicates a higher impact on the environment. From the output, the carbon footprint and related costs can be extracted and used [36].
Before using the tool, it was essential to evaluate the reproducibility of the results. Therefore, four consultants were asked to quantify the CO2eq emitted during the lifetime of a standard quay wall in PoR. After the first round, they were questioned as to the assumptions made during the calculation. A second round with uniform assumptions revealed an application bias of 8.26%, representative enough for quay walls.
The exercise concluded that DuboCalc is not entirely reproducible, but it can be used after a thorough check, discussion, and evaluation with the experts. DuboCalc does not cover all objects for quay walls. Moreover, to use the tool correctly, knowledge over quay walls is a prerequisite. Keeping these in mind, contractors can use DuboCalc results to steer their sustainability strategy, while engineering consultants can advise on sustainability visions and action plans [37].
3.4. Quantification
Estimating GHG emissions by applying DuboCalc required a material inventory in the following phases distinguished in the lifecycle of a quay wall.
- -
- The preparation phase includes earthwork and materials as well as the construction pit with temporary drainage systems;
- -
- construction of combined steel sheet pile wall system, anchorages, capping beam, bed protection, etc.;
- -
- dredging works, and
- -
- maintenance including corrosion protection of the steel sheet piles
All required data were provided by PoR. Estimations of diesel required for generators for temporary drainage and the energy requirements for ICCP and the results of the case study can be found in Appendix E of [24].
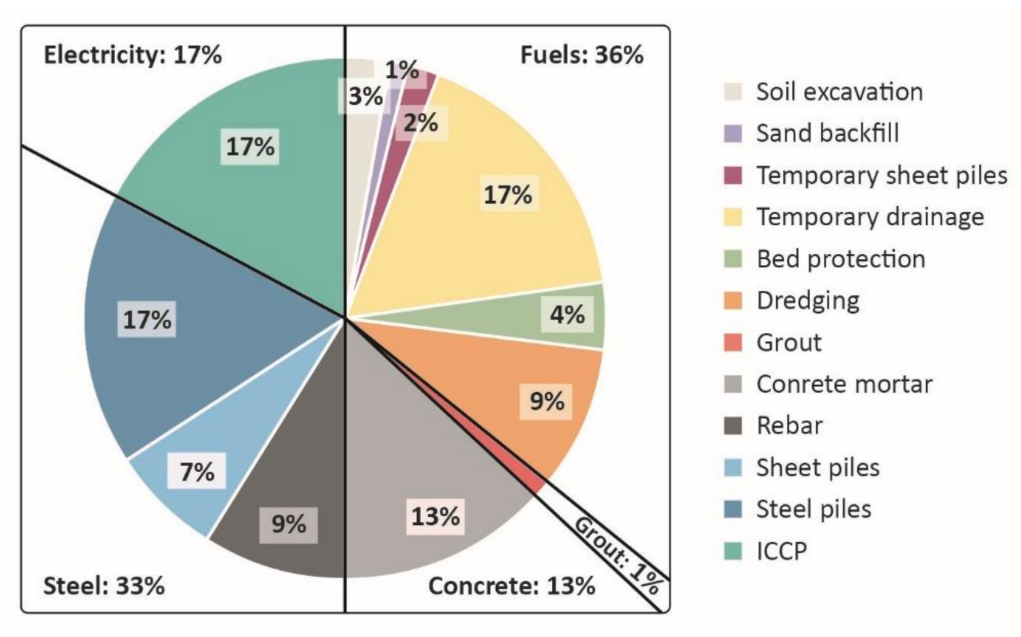
With this input in DuboCalc, an emission of 1.90 kt CO2eq with an application bias of 8.26% is estimated for the quay wall. The most significant contributors to the emission are fuels (approx. 36%), of which temporary drainage of the construction pit and dredging are responsible for the most considerable emission, steel (approximately 33%), electricity (approximately 17%), and concrete (approximately 13%). The carbon emissions per DuboCalc object are displayed in Figure 5. The next step is to research and propose intervention measures to achieve the objectives defined in Step 1. These are described in the next section.

Figure 5.
Carbon emissions expressed as a percentage of the total emission.
4. Intervention Measures
4.1. Intervention Measures
A list of suitable intervention measures to achieve the target of climate neutrality in 2050 was compiled from numerous internal reports of PoR. Technical experts were asked to fill in questionnaires on the subject. Four levels of intervention measures were distinguished depending on their technical readiness level (TRL) and imitations: not ready for implementation (Level 1), prepared for pilot application (Level 2), applicability to be determined per project (Level 3), and the measures that should become standard practice (Level 4). Further, two categories of measures (actions) could be identified: those related to changes in the design and measures related to improvements of materials.
The case study was an anchored combiwall with a length of 479.94 m and a length of 100 m. With this reference base, the change in CO2 emissions resulting from the implementation of intervention measures was quantified using DuboCalc. The quantification would enable PoR to identify and focus on the most significant contributors to GHG emissions. A brief discussion of the design-related intervention follows; details can be found in [24]:
- The carbon emissions of various materials to be used for quay wall construction were investigated. On a weight basis, the emission of steel at 908 kg CO2eq per ton is fifteen times larger than steel, which indicates that the steel use should be optimised, and the use of concrete should be preferred over steel. Moreover, any alternative material must satisfy the strength, serviceability, and durability requirements for the quay wall, while being commercially viable. Steel Fibre-Reinforced Concrete, HDPE, and tropical hardwood did not meet all the requirements. The emissions related to production of Recycled High Density Poly Ethylene (RE-HDPE) are low (1.85 kg CO2eq per ton) and this material can be used for quay walls.
- Possibilities to use a quay wall as a CO2 sink by using minerals like olivine to absorb CO2 or living organisms such as algae that adsorb CO2 to grow need further research and fall under Level 1 category.
- According to the report of Energy Transitions Commission [37], extending the lifetime of a structure can reduce emissions significantly if the function (loading) of a quay wall is not likely to change. According to an internal PoR report, the lifetime can be prolonged from 50 to 100 years, through the use of extra steel (factor 1.016) and concrete (factor 1.032). The peak emission at the end of life is significantly lower in the latter case.
- Shortening transport distances, economical designs employing less material, and an alternative quay wall design type are other possible measures. For the case study, a diaphragm wall design and a combiwall were compared. Results showed that the diaphragm wall has about 50% more emissions compared to a combiwall.
In the category material improvement, the investment in reducing GHG emissions of the following was investigated: steel production, dredging fuel, heavy-duty road transport, concrete production, construction machinery, electricity generation, and temporary drainage of the construction pit. These are discussed here briefly; the calculations can be found in Appendix F in [24].
- The carbon emissions of various alternative materials for quay wall construction were investigated. On a weight basis, the emission of steel at 908 kg CO2eq per ton is fifteen times larger than steel, which indicates that the use of steel should be optimised, and concrete be preferred over steel. Moreover, any alternative material must satisfy the strength, serviceability, and durability requirements for the quay wall, while being commercially viable. Steel Fibre-Reinforced Concrete, HDPE, and tropical hardwood did not meet all the requirements. The emissions related to the production of Recycled High-Density Poly Ethylene (RE-HDPE) are low (1.85 kg CO2eq per ton) and this material can be used for quay walls. Since more research is needed, it can be seen as Level 1.
- Possibilities to use a quay wall as a CO2 sink by using minerals like olivine to absorb CO2 or living organisms such as algae that adsorb CO2 to grow needs further research and fall in Level 1 category.
- According to the report of the Energy Transitions Commission [37], extending the lifetime of a structure can reduce emissions significantly if the function (loading) of a quay wall is not likely to change. According to an internal PoR report, the lifetime can be prolonged from 50 to 100 years, through the use of extra steel (factor 1.016) and concrete (factor 1.032). The peak emission at the end of life is significantly lower in the latter case.
In the category material improvement, the investment in reducing GHG emissions of the following was investigated: steel production, dredging fuel, heavy-duty road transport, concrete production, construction machinery, electricity generation, and temporary drainage of the construction pit. These items are discussed here briefly; the details can be found in Appendix F in [24].
- Steel production: [38] mentions three intervention measures for the decarbonisation of the steel industry: circularity, hydrogen used as a reduction agent, and Carbon Capture and Storage (CCS). Salzgitter in Germany, a leader in the field of steel production, plans to focus on hydrogen-as-a-reduction-agent to reduce their emission by 82% in 2050. This reduction was adopted for the case study.
- Dredging: Alternative fuels (Table 1) were investigated for emission reduction during dredging by comparing the fuels, based on the energy content per weight. As can be seen, LNG has a low reduction potential. Biofuels such as HVO have a smaller footprint allowing emission reduction of about 75%. However, HVO is a transition fuel, not produced on a global scale, therefore, more expensive. Hydrogen is assumed to be produced 50% with renewable electricity and allows approximately 66% reduction. Green hydrogen from 100% renewable energy (green hydrogen) in the future could offer a better solution.
 Table 1. Alternative fuels for dredging.
 - Heavy-duty transport: Many seaports start to install fully electrified equipment and use electricity as the source of energy [20], also for heavy-duty road transport that generates large emissions. According to [38], the use of alternative low-carbon fuels in internal combustion engines, a shift to electric drive trains with energy storage in battery (Battery Electric Vehicles or BEVs) or hydrogen (Fuel Cell Electric Vehicles or FCEVs) is the most likely options for emission reduction. It is expected that BEV trucks using renewable electricity will be fully exploited in 2025 for regional haul trucks and urban trucks. A reduction of 100% in 2025 is assumed, neglecting the emissions during truck production and renewable electricity generation.
- Concrete production: Emission reduction in concrete production was also investigated. A pathway to decarbonize cement production fully is not yet defined. A most likely scenario developed by Material Economics, in which concrete is recycled, suggests that European construction emissions for concrete in 2050 could be reduced up to 45%. With the development of a CCS infrastructure, the reduction would amount to 90%.
- Construction equipment: Well-known brands of construction equipment have started electrifying their urban fleet. The battery technology is advancing fast with reduced costs. According to [39], construction machinery can be fully electrified in 2030, reducing emissions up to 90% using renewable energy.
- Cathodic protection: The ICCP currently runs on fossil electricity. With renewable electricity, emissions can be reduced by 86.6%.
- Temporary drainage of the construction pit: The electricity for the temporary drainage systems is provided by the diesel generators and is responsible for 16.4% of the emissions. An electrical grid for the drainage systems can be provided. The energy required is estimated by converting the diesel (in litres) to energy (kWh). The emissions will increase by 3% with the use of fossil energy and reduce by 14% with renewable energy.
The material-improvement related interventions and the related TRLs are summarized in Table 2.
Table 2.
Material-improvement related interventions and related TRLs.
4.2. Results
The research into the GHG impact of the proposed interventions led to the following recommendations: Firstly, renewable energy used for ICCP could lead to a 15% reduction in GHG emissions over the quay wall’s life cycle. The transition from fossil energy to renewable electricity is without extra investment costs. Secondly, using renewable energy instead of diesel for the temporary drainage systems will reduce the emission by 14%. Thirdly, if PoR will invest approximately 170 euro for every saved CO2eq, Hydrotreated Vegetable Oil (HVO) can be used as an alternative fuel for dredging to reduce emission by 8%. PoR could encourage the constructors to use electrified transport (available on a commercial scale around 2025) and machinery (available on a commercial scale around 2030) to reduce emissions by 3% and 11%, respectively. Including previous actions, a total reduction of 51% can be achieved. Finally, long-term innovations are expected in concrete with Carbon Capture and Storage (CCS), in the use of hydrogen as a dredging fuel and finally, in steel production with hydrogen as a reduction agent. These could reduce emissions by 9%, 10%, and 24%, respectively. The actions discussed above (except the use of HVO) will result in a total reduction of 86%.
Although the calculated reduction of GHG emission in 2050 does not meet the target of being climate neutral, the potential reduction of 86% is a considerable improvement. The evaluation procedure in which the quay wall is monitored every five years should be implemented. It will help monitor the impact of the applied intervention measures and oversee if the targets will be achieved. It will be a part of the strategic planning of the PoR.
It is recommended to further research alternative designs aiming at reduced concrete and steel use (since they contribute significantly to emissions). Alternative designs include quay walls made out of Recycled High-Density PolyEthylene (RE-HDPE), steel piles of smaller dimensions, and prefab concrete quay walls with geo-polymer-based-cements.
5. Conclusions and Discussion
A framework for assessing and managing the sustainability performance of port infrastructure is presented in the paper. Such a framework will help an organisation to deal with the numerous dimensions of sustainability systematically. After identifying the relevant aspects of sustainability pertinent for port infrastructure, performance measures, and targets are selected. By comparing the current state of an infrastructure element with the desired state for pre-specified sustainability themes, sustainability performance can be evaluated. The framework was applied to quay walls in the Port of Rotterdam, but only four out of fourteen sustainability themes could be further assessed due to a lack of information. This finding underlines the need for sustainability monitoring and reporting and further research into standardised quantification tools.
Further, a case study of a quay wall in PoR is presented. Based on the vision of PoR and literature, the sustainability theme ‘air pollutants’ was given priority, the performance measure being the Greenhouse Gas (GHG) emissions. The tool Dubocalc was applied to quantify the quay wall in the case study and resulted in a total emission of 1.9 kt of CO2eq for a 100 m length over a 100-year lifecycle. The proposed measures to achieve climate neutrality in 2050 included the use of renewable energy for the Impressed Current Cathodic Protection (ICCP) and the temporary drainage systems, and the use of electrified transport and machinery, hydrogen as dredging fuel, and steel with hydrogen as reduction-agent (in the future), could result in a total GHG reduction of 86%.
The systematic approach in this research that breaks down the sustainability performance into diverse themes and quantifies it led to improved insight into sustainability quay wall development and resulted in specific recommendations to reduce the GHG emission over the lifecycle of quay walls. It has been applied to quay walls in this paper but applies to all infrastructure assets. This approach offered ease of implementation through the use of available tools and databases.
As highlighted by this research, the practices of the port authority need to include precise analysis of the sustainability of specific processes and activities and to manage sustainability performance The port authority is working on achieving a carbon-neutral port by focussing on efficiency and infrastructure, energy transition, and materials and new systems. They are in a position to lead and influence various actors, such as technical consultants, contractors and suppliers of materials as well as the companies in the port area to align their sustainability goals.
Author Contributions
The MSc research was carried out by G.v.R.v.d.K. under the supervision of M.v.K. and P.T. The methodology is based on the work of M.v.K., P.T. prepared the manuscript, and G.v.R.v.d.K. and M.v.K. contributed to the editing and improving the manuscript. All authors have read and agreed to the published version of the manuscript.
Funding
This research received no external funding.
Institutional Review Board Statement
Not applicable.
Informed Consent Statement
Not applicable.
Data Availability Statement
The data and calculations supporting the reported results can be found in Appendices D–F of the MSc thesis report available on TU Delft repository at https://repository.tudelft.nl/islandora/object/uuid%3A1b8b8008-3487-4bed-9702-691d65c69ce6 (accessed on 30 August 2021).
Acknowledgments
The authors would like to thank the Port of Rotterdam for facilitating the MSc research on which this paper is based and Witteveen + Bos for providing assistance and knowledge throughout the study. The authors thank the three anonymous reviewers for their insightful comments that vastly improved the manuscript.
Conflicts of Interest
The authors declare no conflict of interest.
References
- Brundtland, G.H. Our common future: Call for action. Environ. Conserv. 1987, 14, 291–294. [Google Scholar] [CrossRef]
- AAPA. An Environmental Management System (EMS) Primer for Ports: Advancing Port Sustainability; U.S. Environmental Protection Agency in partnership with American Association of Port Authorities (Tech.Rep.): 2007. Available online: https://archive.epa.gov/sectors/web/pdf/ems_primer.pdf (accessed on 10 March 2021).
- Vos, R.O. Defining sustainability: A conceptual orientation. J. Chem. Technol. Biotechnol. 2007, 82, 334–339. [Google Scholar] [CrossRef]
- Nigri, G.; Del Baldo, M. Sustainability Reporting and Performance Measurement Systems: How do Small- and Medium-Sized Benefit Corporations Manage Integration? Sustainability 2018, 10, 4499. [Google Scholar] [CrossRef] [Green Version]
- Schaltegger, S.; Burritt, R.L. Sustainability accounting for companies: Catchphrase or decision support for business leaders? J. World Bus. 2010, 45, 375–384. [Google Scholar] [CrossRef]
- UNECE. Framework and Suggested Indicators to Measure Sustainable Development. Prepared by The Joint UNECE/Eurostat/OECD Task Force 2013. Available online: http://www.un.org/esa/sustdev/natlinfo/indicators/guidelines.pdf (accessed on 10 March 2021).
- PIANC. EnviCom 188: Carbon Management for Port and Navigation Infrastructure; PIANC: Brussels, Belgium, 2019. [Google Scholar]
- Economist Intelligent Unit. Global Trends in Sustainability Performance Management. Available online: https://www.environmentalleader.com/wp-content/uploads/2011/05/Global-trends-in-sustainability-performance-management.pdf (accessed on 10 March 2021).
- Zhang, Y.; Kim, C.W.; Tee, K.F.; Lam, J.S.L. Optimal sustainable life cycle maintenance strategies for port infrastructures. J. Clean. Prod. 2017, 142, 1693–1709. [Google Scholar] [CrossRef]
- Lam, J.S.L.; Notteboom, T. The greening of ports: A comparison of port management tools used by leading ports in Asia and Europe. Transp. Rev. 2014, 34, 169–189. [Google Scholar] [CrossRef]
- Vellinga, T.; de Kaene, K.; Rijks, D.; Schrerrer, P.; Uelman, F. Sustainable ports: Green growth as an economic driver. In Proceedings of the PIANC MMX Congress, San Francisco, CA, USA, 1–5 June 2014. [Google Scholar]
- Asgari, N.; Hassani, A.; Jones, D.; Nguye, H.H. Sustainability ranking of the UK major ports: Methodology and case study. Transp. Res. Part E Logist. Transp. Rev. 2015, 78, 19–39. [Google Scholar] [CrossRef] [Green Version]
- Kuznetsov, A.; Dinwoodie, J.; Gibbs, D.; Sansom, M.; Knowles, H. Towards a sustainability management system for smaller ports. Mar. Policy 2015, 54, 59–68. [Google Scholar] [CrossRef]
- Di Vaio, A.; Varriale, L.; Alvino, F. Key performance indicators for developing environmentally sustainable and energy efficient ports: Evidence from Italy. Energy Policy 2018, 122, 229–240. [Google Scholar] [CrossRef]
- Hossain, T.; Adams, M.; Walker, T.R. Sustainability initiatives in Canadian ports. Mar. Policy 2019, 16, 103519. [Google Scholar] [CrossRef]
- Lalla-Ruiz, E.; Heilig, L.; Voß, S. Environmental Sustainability in Ports. In Sustainable Transportation and Smart Logistics Decision-Making Models and Solutions; Elsevier: Amsterdam, The Netherlands, 2019; pp. 65–89. [Google Scholar]
- Ashrafi, M.; Acciaro, M.; Walker, T.R.; Magnan, G.M.; Adams, M. Corporate sustainability in Canadian and US maritime ports. J. Clean. Prod. 2019, 220, 386–397. [Google Scholar] [CrossRef]
- Bjerkan, K.Y.; Seter, H. Reviewing tools and technologies for sustainable ports: Does research enable decision making in ports? Transp. Res. Part D Transp. Environ. 2019, 72, 243–260. [Google Scholar] [CrossRef]
- Stanković, J.J.; Marjanović, I.; Papathanasiou, J.; Drezgić, S. Social, Economic and Environmental Sustainability of Port Regions: MCDM Approach in Composite Index Creation. J. Mar. Sci. Eng. 2021, 9, 74. [Google Scholar] [CrossRef]
- Iris, Ç.; Lam, J.S.L. Optimal energy management and operations planning in seaports with smart grid while harnessing renewable energy under uncertainty. Omega 2021, 103, 102445. [Google Scholar] [CrossRef]
- Woo, J.K.; Moon, D.S.H.; Lam, J.S.L. The impact of environmental policy on ports and the associated economic opportunities. Transp. Res. Part A Policy Pract. 2018, 20110, 234–242. [Google Scholar] [CrossRef]
- PIANC. Renewables and Energy Efficiency for Maritime Ports; PIANC: Brussels, Belgium, 2019. [Google Scholar]
- Iris, Ç.; Lam, J.S.L. A review of energy efficiency in ports: Operational strategies, technologies and energy management systems. Renew. Sustain. Energy Rev. 2019, 112, 170–182. [Google Scholar] [CrossRef]
- van Rhede van der Kloot, G. Sustainability Assessment of Quay Wall Development in the Port of Rotterdam. Master’s Thesis, Delft University of Technology, Delft, The Netherlands, 2019. [Google Scholar]
- van Koningsveld, M.; Mulder, J. Sustainable coastal policy developments in the Netherlands. A systematic approach revealed. J. Coast. Res. 2004, 20, 375–385. [Google Scholar] [CrossRef]
- Port of Rotterdam Authority. Duurzame GWW: Visie en Aanpak, Internal Port of Rotterdam report. Unpublished work. 2019.
- Port of Rotterdam Insight. Zero-Emission Port by 2050. Available online: https://www.portofrotterdam.com/en/news-and-press-releases/zero-emission-port-by-2050 (accessed on 10 March 2021).
- Port of Rotterdam Authority. Mission, Vision and Strategy. Available online: https://www.portofrotterdam.com/en/port-authority/about-the-port-authority/organisation/mission-vision-and-strategy (accessed on 10 March 2021).
- Port of Rotterdam Authority. Sustainability. Available online: https://www.portofrotterdam.com/en/our-port/our-themes/a-sustainable-port/sustainability (accessed on 10 March 2021).
- Port of Rotterdam Authority. Progress Report 2014: Port Vision 2030. Available online: https://www.portofrotterdam.com/sites/default/files/Progress-report-port-vision-2030.pdf (accessed on 10 March 2021).
- Lam, J.S.L.; van de Voorde, E. Green Port Strategy for Sustainable Growth and Development. In Proceedings of the Transport Logistics for Sustainable Growth at a New Level, International Forum on Shipping, Ports and Airports (IFSPA), Hong Kong, China, 27–30 May 2012. [Google Scholar]
- PIANC. EnviCom 150: Sustainable Ports—A Guide for Port Authorities; PIANC: Brussels, Belgium, 2014. [Google Scholar]
- Wuppertal Institut. Decarbonisation Pathways for the Industrial Cluster of the Port of Rotterdam, September 2016. Available online: https://www.portofrotterdam.com/sites/default/files/rapport-decarbonization-pathways-for-the-industrial-cluster-of-the-port-of-rotterdam.pdf (accessed on 10 March 2021).
- PoR Transport. Deep Decarbonisation Pathways for Transport and Logistics Related to the Port of Rotterdam Synthesis Report, April 2018. Available online: https://www.portofrotterdam.com/sites/default/files/wuppertal-institut-2018-decarbonization-of-transport-and-logistics-synthesis-report.pdf?token=oA814CU1 (accessed on 10 March 2021).
- Dubocalc. Available online: https://www.dubocalc.nl/en/what-is-dubocalc/ (accessed on 30 March 2021).
- Herrmann, I.; Moltesen, A. Does it matter which Life Cycle Assessment (LCA) tool you choose?—A comparative assessment of SimaPro and GaBi. J. Clean. Prod. 2015, 86, 163–169. [Google Scholar] [CrossRef]
- van Driel, J. Circulair, Circulairder, Circulairst: Een Vergelijking Van Tien Veelgebruikte Tools Voor Circulair Inkopen; Utrecht Sustainability Institute: Utrecht, The Netherlands, 2017. (In Dutch) [Google Scholar]
- Energy Transitions Commission. Mission Possible: Reaching Net-Zero Carbon Emission from Harder-to Abate Sectors by Mid-Century 2018. Available online: https://www.ieta.org/resources/COP24/Misc%20Media%20Files/Dec7/SE16%20(3).pdf (accessed on 10 March 2021).
- Energy Markets & Technology. Perspectives on Zero Emission Construction (Tech. Rep.). City of Oslo: Climate Agency 2019. Available online: https://www.klimaoslo.no/wp-content/uploads/sites/88/2019/06/Perspectives-on-zero-emission-construction.pdf (accessed on 10 March 2021).
Publisher’s Note: MDPI stays neutral with regard to jurisdictional claims in published maps and institutional affiliations. |
© 2021 by the authors. Licensee MDPI, Basel, Switzerland. This article is an open access article distributed under the terms and conditions of the Creative Commons Attribution (CC BY) license (https://creativecommons.org/licenses/by/4.0/).