Abstract
The construction of bridge is a complex process and involves diverse energy emission-intensive materials. The evaluation of environmental impacts on the basis of life cycle assessment (LCA) is a recognised technique to find the scope of impact mitigation and save resources. However, the studies on the LCA of bridges are rare and lack assessment on the impact of public transportation during bridge construction. The purpose of this study was to develop an integrated exergy-based LCA model for assessing the environmental sustainability of bridges by investigating their environmental impacts and exergy footprint. The proposed exergy-based LCA model consists of three principal assessment models, namely, the environmental impact of energy consumption, pollutant discharge, and resource consumption. The proposed model was then exemplified with a highway bridge as a case study. The results found that the environmental impact in the raw material production and processing stage was the largest, followed by the construction stage and the operation and maintenance stage at second and third place, respectively. The findings of this study can contribute to mitigating the environmental impacts of bridge construction, and the assessment approach can be adopted to guide the environmental impact evaluation for other types of civil constructions globally.
1. Introduction
As one of the leading industries contributing to global economic growth, construction has tremendous impacts on resource depletion, greenhouse gas emission, and global warming [1,2]. The average amount of worldwide construction output is projected to increase 85% by 2030, wherein China is expected to be one of the most influential countries in this growth [3]. To fulfil the target of the Paris Agreement, China has announced determined policies to achieve a peak in carbon emissions by 2030 and carbon neutrality by 2060, which aims to mitigate the climate-warming issue. In recent years, China’s infrastructure construction has developed vigorously. As part of it, bridge construction has also experienced remarkably rapid development in China. For example, there were 912,800 highway bridges in China at the end of 2020, including 6444 mega bridges and 119,935 long-span bridges [4]. However, the fast expansion of bridge constructions requires a significant amount of energy and natural resource consumption, leading to the increased risk of climate change [5].
Considering the significant environmental impacts, reducing the resource demand and pollutant emission of bridge constructions is one of the essential targets. The important step of achieving this goal can be to evaluate the environmental impacts of bridge constructions from a life cycle perspective and identify the scope of impact mitigation.
Life cycle assessment (LCA) is a globally recognised method used to evaluate the environmental impact of the life cycle of a product system, from the production of raw materials to the end of the product life [6]. Generally, the LCA process can be divided into the following four stages: definition of objectives and scope, life cycle inventory analysis (e.g., collection of data through bill of quantities (BoQ) method), impact evaluation, and interpretation [7]. At present, the LCA method can found to be widely used to quantify the environmental impact of bridge constructions at different stages, such as the stage of construction, maintenance, and demolition. Moreover, LCA has been applied in aspects of the optimisation of design or renovation schemes [8,9], the selection of raw materials [10,11,12], and the maintenance of bridges [5,13,14].
Although the studies on the LCA of the bridge as a whole system are very rare [15], the present study has summarised existing studies with comprehensive bridge LCA models. Specifically, Du and Karoumi [6] proposed an LCA model for railway bridge structures and compared the environmental performance of two alternative (fixed-slab and ballasted) designs of bridge structures. The results indicated that the largest environmental burden was found in the initial material manufacture stage, while the ease of maintenances of the fixed-slab design resulted in a better environmental performance than the ballasted design. Fifer and Lenart [11] investigated the environmental impacts of geosynthetic-reinforced soil (GSR) bridge system using the LCA and reported that the GSR bridge system had a much lower environmental impact than the traditional reinforced-concrete bridge system. Moreover, Pang et al. [14] conducted an LCA analysis of a highway bridge in China with four different strengthening plans using the Eco-indicator 99 method and found that the maintenance stage and material manufacturing stage account for about 66% and 40% of the total environmental impact, respectively. Zhou et al. [16] used CML (Centrum voor Milieuweten schappen Leiden) 2001 standardised approach through the OpenLCA 1.10.3 software to evaluate the cause and mechanism of the environmental impact contribution of a three-tower cable-stayed bridge and reported that the cable-stayed bridge had a considerable global warming potential value, especially in operation and maintenance phases. Du et al. [15] proposed a comprehensive LCA framework for evaluating the environmental impact of highway bridges, which was then used to compare five proposed design options of a road bridge in Sweden. The results indicated that the LCA outcomes could be largely influenced by multiple factors, such as system boundaries, surrounding environment, and input uncertainties. O’Born [17] modelled the comprehensive environmental impact of the two designs of a bridge in Norway through SimaPro software, and the results showed that the emissions generated from wooden bridges were significantly lower than those of concrete bridges.
Therefore, some existing LCA models for evaluating bridge environmental impacts only place emphasis on one specific life cycle stage [8,9,10,11,12,13,14] but lack considerations on overall environmental impact on the natural environment and overall assessment function in various life cycle stages. Moreover, the current existing LCA frameworks [6,15,16,17] of bridge constructions often overlook the negative environmental impact of public transportation rerouting and traffic congestion during the phase of bridge construction. In contrast, such a road network rerouting potentially increases vehicles’ carbon emission, especially in urban spaces.
The exergy-based LCA was suggested to be more comprehensive and systematic than those traditional LCAs, as exergy has been considered as not only a natural measure of resources invested in a certain system but also a measure of material output [18]. Taking into consideration the thermodynamic performance and the determination of the energy quality disintegration in the process of energy transfer and conversion [19], researchers have proposed the exergy-based LCA method for evaluating the environmental impacts [20,21,22], as it can provide a common metric for comparing different production activities [18].
The exergy-based LCA model has been adopted in the field of construction. Ashouri et al. [23] determined the optimal insulation thickness of the external wall of buildings through the exergy based LCA method. De Meester et al. [24] combined exergy analysis and LCA to evaluate the environmental impacts of different design parameters on the resource consumption of family housing. Liu et al. [25] proposed an exergy assessment model for buildings from a life cycle perspective and evaluated the environmental sustainability of buildings through their exergy footprint and environmental impacts. However, on the basis of the research literature reviewed by the authors in terms of the LCA studies of bridges, very few studies have proposed exergy-based LCA models focusing on evaluating environmental impacts and exergy footprint of bridge constructions.
Therefore, this study aimed to develop an integrated exergy-based LCA model for evaluating the environmental impacts and exergy footprint of highway bridge constructions and exemplify it with a case study. The main research contribution of the present paper includes, firstly, proposing a quantitative exergy-based LCA model that can be adopted to evaluate the overall environmental impact of bridge constructions, and secondly, emphasising the environmental impact of public road network rerouting during the bridge construction phase. The outcomes of this study can contribute to mitigating the environmental impacts of highway bridge construction, while the assessment method of this study could be used to guide the evaluations of the environmental impacts of other types of constructions globally.
The rest of this paper is presented as per the following structure: (1) identifying bridge life cycle; (2) demonstrating three principal assessment models; (3) proposing the exergy-based LCA model for four stages in bridge life cycle; (4) presenting a case study; (5) discussing the features and limitations of the proposed model.
2. Exergy Assessment Model
In this section, the description of the bridge life cycle is presented firstly. Then, the principle of three principal assessment models for the exergy assessment is demonstrated, namely, the model of energy consumption, pollutant emission, and resource consumption. Finally, on the basis of three principal assessment models, we have developed the exergy assessment model of four stages in bridge life cycle.
The ‘cradle-to-gate’ cycles of a bridge construction are commonly subdivided into the following stages: planning and design stage, material manufacturing and transport stage, construction stage, operation and maintenance stage, and waste demolition stage [5,26]. However, in the LCA scope, the planning and design stage commonly has a low environmental impact [16]. For example, Kaewunruen et al. [5] modelled the carbon emission throughout the life cycle of a bridge project and found that the planning and design stage only contributed 0.443 tons (about 0%) of the total carbon emission. Therefore, many previous studies have developed evaluation frameworks that paid less attention to the impact of the planning and design stage [6,16,17,27,28]. Thus, four stages (namely, the raw material production and processing stage (MPP-stage), the construction stage (CON-stage), the operation and maintenance stage (OM-stage), and the waste demolition (WD-stage)) of bridge constructions are considered as the system boundary of this study.
Meanwhile, in the building construction sector, the environmental impact of the building life cycle is mainly determined by its energy and material utilisation. Since buildings and bridges share a similar life cycle process, the exergy assessment model of bridge life cycle in this study was built upon the building exergy assessment model described in the study by Liu et al. [25] and focused on the environmental impacts of three principal assessment factors during bridge life cycle, namely, energy consumption, pollutant discharge, and resource consumption. The framework of bridge life cycle exergy assessment developed in this study is shown in Figure 1.
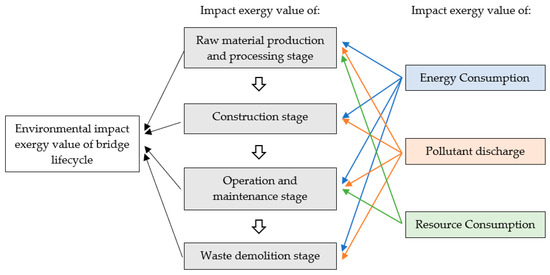
Figure 1.
Framework of exergy assessment of bridge life cycle.
2.1. Principal Assessment Models for Exergy Assessment
2.1.1. The Environmental Impact of Energy Consumption
The environmental impact of energy consumption is considered to include the energy consumption caused by energy utilisation and energy in the embodied process (including development, transportation, processing, and distribution).
Firstly, energy consumption caused by energy utilisation is directly determined by the energy exergy value, which is related to the high calorific value of energy, as shown in Equations (1)–(3). On the basis of National Standard GB/T 2589-2020 [29], we have summarised the energy exergy of different energy sources in Table A4 in Appendix A.
where is the energy exergy value (solid, liquid kJ/kg; gas kJ/m3), and is the high calorific value of energy (solid kJ/kg; liquid kJ/kg; gas kJ/m3).
Secondly, the energy consumption caused by energy in the embodied process can be converted by the concept of embodied coefficient (α). Embodied coefficient (α) identifies the energy consumption in the physicochemical phase while it generates no exergy, as described in Equation (4).
In order to acquire α, we must obtain the environmental impact caused by energy consumption during the energy materialisation process. The calculation of the exergy value consumed in the process of the energy materialisation is regarded as a cyclic iterative process, which could be calculated by using the Leontief inverse matrix to obtain the interdependence coefficient [25].
However, to simplify the calculation process, the energy exergy value is directly used when calculating the energy exergy value consumed in the process of the energy materialisation. The energy consumed in the energy materialisation process includes two components: energy consumed in energy production and energy consumed in energy transportation. Since the transportation energy consumption of basic energy varieties in the upstream stage commonly occurs within the inter-provincial transportation process, small-scale distribution (such as intra-city transportation) is ignored here. The specific methods of calculating the energy consumption exergy value of these two components are illustrated separately below. Here, we used the energy materialisation process of coal as an example to illustrate the calculation method.
- (1)
- Energy consumed in energy production
The amount of energy consumed in various energy production processes can be obtained from the statistical yearbook [30], as shown in Table 1, and the energy exergy value consumed in the coal production process was calculated to be 1729.96 kJ/kg in 2017 by combining the amount of energy consumption and their exergy value (referring to Table A4).

Table 1.
Energy consumption per tonne of the coal mining process in China in 2017 [30].
- (2)
- Energy consumed in energy transportation
Depending on the types of energy, energy is commonly transported by four approaches in China, namely, railway, highway, waterway, and pipeline. For example, coal is mainly transported by railway and road networks, natural gas is mainly transported by pipeline, and oil is mainly transported by pipeline and railway. Thus, the energy consumed in energy transportation can be calculated on the basis of the approach of energy transportation and the distance of transportation.
For coal transportation, according to the statistics published by China statistical yearbook 2018 [30], 62.5% and 37.5% of coal was transported via railways and roads in China in 2017, respectively. The average railway transportation distance was 651 km, and the locomotives used in railway transportation consisted of diesel-driven locomotives (40%) and electricity-driven locomotives (60%), which consumed 27.2 kg diesel/(10,000 tonnes/km) and 130.3 kWh/(10,000 tonnes/km) per unit transportation volume, respectively. Similarly, regarding road transportation, the average transportation distance was 400 km, and 20-tonne diesel trucks were commonly used for coal transportation. The energy consumption per unit of transportation of such diesel trucks is 370 kg diesel/(10,000 tonnes/km) [31]. Therefore, combining the energy consumed by railway and road transportation, we find that the energy consumption exergy value of coal transportation can be obtained as 289.59 kJ/kg.
Therefore, combining the energy consumption of coal production and transportation, we can acquire the energy consumption exergy value during coal production, processing, and transportation. Then, its embodied coefficient can be deduced by Equation (4) (the sum of energy exergy value and energy consumption exergy value during production and transportation is divided by energy exergy value).
Through this mechanism, applying this calculation method to other energy types, we can deduce the embodied coefficient by energy exergy value and energy consumption exergy value during energy production, processing, and transportation, as shown in Table 2.
Table 2.
Embodied coefficient of common energy types (calculated values).
2.1.2. The Environmental Impact of Pollutant Discharge
Pollutants are inevitably discharged during the bridge life cycle. For example, pollutants can be generated in the energy production stage and vehicle transportation stage during the bridge construction stage. Therefore, it is imperative to identify the environmental impact of pollutant discharge in the bridge life cycle.
Since the chemical composition of sewage is difficult to quantify with the exergy assessment method, only pollutants that are discharged into the atmosphere are considered in this study, such as CO2, SO2, and NOx. Meanwhile, to quantify the environmental impact of major pollutants with long-term impacts, this study focused on the pollutants that cause climate warming and acidification issues, including pollutant emissions (CO2, SO2, and NOx) and particulate matter (PM) emissions. The exergy consumed for treating four types of pollutants is shown in Table A5 in Appendix A [32]. On the basis of the emission coefficient of pollutants in the embodied process and the exergy value consumed in the pollutant treatment process, we were able to deduce the environmental impact exergy value of pollutant emissions [32,33,34,35,36], as shown in Table 3.
Table 3.
Exergy value of the treatment process of the pollutants (calculated values).
2.1.3. The Environmental Impact of Resource Consumption
Since the chemical exergy of resources is deterministic and is less affected by the environment and time, the environmental impact exergy value of resource consumption can be quantitatively expressed by the chemical exergy of the resource. The environmental impact exergy value of resource consumption of common mineral resources is shown in Table 4, which can be deduced by combining the tenor of ore of the resource [37].
Table 4.
Environmental impact exergy value of the consumption of common mineral resources [25].
2.2. Exergy Assessment Model for Different Bridge Life Cycle Stages
On the basis of the aforementioned four stages of the bridge life cycle (the raw material production and processing stage (MPP-stage), the construction stage (CON-stage), the operation and maintenance stage (OM-stage), and the waste demolition (WD-stage)), we were able to further divide the exergy evaluation model for environmental impact into four sub-models, namely, the models for the raw material production and processing stage, the construction stage, the operation and maintenance stage, and demolition stage, which are presented as Equation (5).
where is the environmental impact exergy value of bridge life cycle (kJ), is the environmental impact exergy value of the raw material production and processing stage (kJ), is the environmental impact exergy value of the construction stage (kJ), the environmental impact exergy value of the operation and maintenance stage (kJ), and the environmental impact exergy value of the waste demolition stage (kJ).
2.2.1. Exergy Assessment Model for Raw Material Production and Processing Stage
The raw material production and processing stage involves energy consumption, pollutant discharge, and resource consumption. This section uses Portland cement (strength grade 42.5) as an example to describe the calculation method of the exergy value during its production and processing stage.
First of all, the primary data were obtained and prepared for the calculation, including (1) the consumption of the raw material for Portland cement [31]; (2) raw material transportation information [30]; (3) energy consumption in the production process; (4) emission coefficients of non-energy-consuming pollutants [38]; and (5) Portland cement transportation information [39], as shown in Table A6 in Appendix A. On the basis of the basic information, we were able to calculate the environmental impact exergy value of energy consumption, pollutant emission, and resource consumption of the three processes (raw material transportation, production process, and transportation process) separately, as shown in Table A7 in Appendix A. Gathering the calculation results in Table A7, we were able to sum up the environmental impact exergy value of cement production and processing stage, as shown in Table 5. The total exergy value of Portland cement at the production and processing stage was 13,279.39 kJ/kg.
Table 5.
Environmental impact exergy value of Portland cement production and processing stage.
Similarly, the environmental impact exergy value of other common raw materials in the production and processing stage can be deduced with the same calculation method, and the results are found in Table A1 in Appendix A. The exergy value for the production and processing of all involved raw materials can be deduced by the bill of quantities (BoQ) method. Therefore, the total environmental impact exergy value in the raw material production and processing stage of bridge construction () can be calculated as the sum of the exergy value of each raw material in the production and processing (MPP) stage, as shown in Equation (6).
where is the environmental impact exergy value of the energy consumption in the MPP-stage (kJ), is the environmental impact exergy value of the pollutant emissions in the MPP-stage (kJ), is the environmental impact exergy value of resource consumption in the MPP-stage (kJ), is the amount of i-th raw material consumption in the MPP-stage (kg), is the environmental impact exergy value of the energy consumption of the i-th raw material in the MPP-stage (kJ/kg), is the environmental impact exergy value of pollutant emission of the i-th raw material in the MPP-stage (kJ/kg), and is the environmental impact exergy value of resource consumption of the i-th raw material in the MPP-stage (kJ/kg).
2.2.2. Exergy Assessment Model for Construction Stage
The environmental impact of the construction stage mainly includes the use of construction machinery and the bypassing of motor vehicles due to traffic control during the construction stage. These two components involve the environmental impact of energy consumption and pollutant emissions.
The environmental impact caused by the use of construction machinery mainly results from energy consumption and pollutant discharge. The exergy value of the environmental impact of construction machinery (energy consumption and pollutant discharge) can be deduced by examining the energy consumption of various types of construction machinery in each working shift [40].
The environmental impact exergy value (energy consumption and pollutant discharge) caused by the bypassing of motor vehicles is calculated on the basis of the proportion of the ownership of various vehicle types [30] and the energy consumption value of various vehicle types [31,39,41]. The calculating results of the environmental impact exergy value of fuel vehicles are shown in Table A2, while the exergy value caused by the bypassing of motor vehicles is shown in Table A3 in Appendix A.
Therefore, the environmental impact exergy value during the construction stage (EXc) can be calculated by Equation (7).
where is the environmental impact exergy value of the energy consumption of the construction stage (kJ), is the environmental impact exergy value of pollutant emissions during the construction stage (kJ), is the amount of i-th fuel consumption in the construction stage (kg), is the environmental impact exergy value of the energy consumption of the i-th fuel (kJ/kg), and is the environmental impact exergy value of the pollutant emission of the i-th fuel (kJ/kg).
2.2.3. Exergy Assessment Model for Operation and Maintenance Stage
The environmental impact generated during the operation and maintenance stage consists of three parts: (1) the production and processing of raw materials required for the operation and maintenance process (raw material consumption), (2) the use of construction machinery during the operation and maintenance (fuel consumption), and (3) the bypassing of motor vehicles restricted by traffic controls during the operation and maintenance stage (fuel consumption). The environmental impact generated during the operation and maintenance stage involves energy consumption, pollutant discharge, and resource consumption. The environmental impact exergy value in the operation and maintenance (OM-stage) stage is calculated by Equation (8).
where is the environmental impact exergy value of energy consumption of the OM-stage (kJ), is the environmental impact exergy value of pollutant discharge in the OM-stage (kJ), is the environmental impact exergy value of resource consumption in the OM-stage (kJ), is the amount of i-th raw material consumption in the OM-stage (kg), is the environmental impact exergy value of the energy consumption of the i-th raw material in OM-stage (kJ/kg), is the environmental impact exergy value of pollutant emission of the i-th raw material in OM-stage (kJ/kg), is the environmental impact exergy value of resource consumption of the i-th raw material in OM-stage (kJ/kg), is the amount of i-th fuel consumption in the OM-stage (kg), is the environmental impact exergy value of energy consumption of the i-th fuel in the OM-stage (kJ/kg), and is the environmental impact exergy value of energy consumption of the i-th fuel in the OM-stage (kJ/kg).
2.2.4. Exergy Assessment Model for Waste Demolition Stage
The environmental impact generated during the waste demolition stage mainly includes two parts: the use of construction machinery and the bypassing of motor vehicles caused by traffic control at the demolition stage, which involves energy consumption and pollutant emissions. The exergy value of the demolition stage is calculated according to Equation (9).
where is the environmental impact exergy value of energy consumption of the waste demolition stage (kJ), is the environmental impact exergy value of pollutant emission of the waste demolition stage (kJ), is the amount of i-th fuel consumption in the waste demolition stage (kg), is the environmental impact exergy value of energy consumption of the i-th fuel in the waste demolition stage (kJ/kg), and is he environment impact exergy value of pollutant emission of the i-th fuel in the waste demolition stage (kJ/kg).
3. Case Study
3.1. The Description of the Case Bridge
The bridge selected as the case study is located in the Renhua-Boluo section of highway G0422 in Guangdong Province, China. The case bridge is a three-lane dual carriageway (405.6 m long and 34.5 m wide). The whole bridge consists of four joints, and the span layout is (4 × 25 + 4 × 25 + 4 × 25 + 4 × 25 m). The upper structure of the bridge is made of prestressed concrete with the technique of simple supported to continuous girder. The bridge pier is in column form, with a pile foundation. D80 expansion joints are used at the joints and abutments. The bridge deck pavement is covered with 11 cm asphalt concrete, a waterproof layer, and a cast-in-place layer of 10 cm C40 integral concrete. The superstructure of the bridge adopts the precast method of the straight beam. To assess the environmental impact from a life cycle perspective, we summarised this bridge’s project information by the BoQ method (bill of quantities) for its whole life cycle, including the material production and processing stage, the construction stage, the operation and maintenance stage, and the waste demolition stage, as shown in Table A8 in Appendix A.
3.2. The Exergy Assessment of the Environmental Impact—The Bridge Case
According to the exergy assessment model, we calculated the exergy values of the different stages in the life cycle (shown in Table 6). The exergy value in the raw material production and processing stage was the largest, accounting for 79% of the total environmental impact exergy. The exergy values in the construction stage and the operation and maintenance stage were similar, being 11% and 10%, respectively. The environmental impact exergy value in the waste demolition stage was the lowest among all life cycle stages (less than 0.5%). In particular, since only petroleum asphalt is used in the operation and maintenance stage, which is commonly regarded as one form of energy consumption, there was no environmental impact of resource consumption at this stage.
Table 6.
The exergy value of the case bridge in different life cycle stages.
Figure 2 illustrates the environmental impact exergy value of the case bridge at each life cycle stage. To demonstrate the exergy value in WD-stage (waste demolition stage) clearly, we have shown an embedded figure with a relatively small scale (in the unit of TJ) in Figure 2.
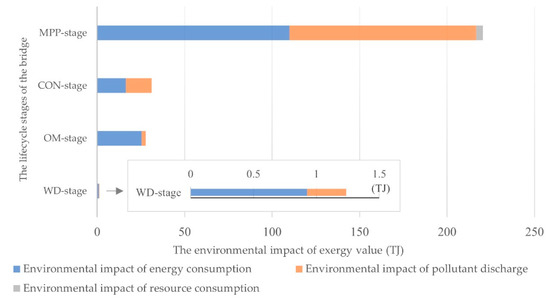
Figure 2.
Environmental impact exergy value of the bridge at each lifecycle stage.
Breaking down environmental impact to each assessment factor, we show the composition of the environmental impact exergy value of the whole life cycle of the bridge in Figure 3. From the whole life cycle perspective, the energy consumption (54%) and pollutant discharge (45%) contributed major negative impacts on the environment, while the resource consumption of the case bridge only accounted for 1% of the total environmental impact. Among the category of pollutant discharge, climate warming emission presented the highest impact on the environment (accounting for 51% of the environmental impact exergy of pollutant discharge), and acidification and particulate matter emissions had the same extent of impact (both accounted for 24%) on the environment.
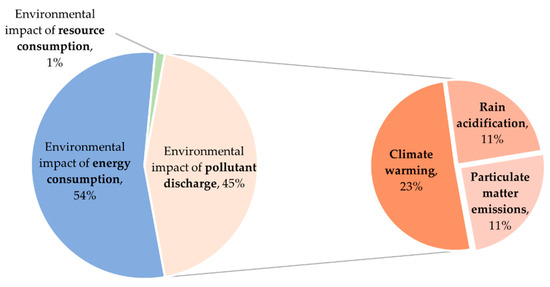
Figure 3.
Contribution analysis of the environmental impact of the case bridge (whole life cycle).
Figure 4 illustrates the composition of the environmental impact exergy value of the case bridge in different stages. In each stage, the environmental impact of energy consumption showed the largest contribution to the total environmental impact, exceeding 50% of total environmental impact exergy. The pollutant discharge process also resulted in a significant impact on the environment, especially in the raw material production and processing stage (48%) and the construction stage (47%). The emission of particulate matter in the construction stage shared a higher proportion of the environmental impact than that in the raw material production and processing stage, which implies that particulate matter may be less controlled on-site in the construction stage. In the operation and maintenance stage and the waste demolition stage, energy consumption accounted for the largest proportion of the total environmental impact, followed by climate warming (CO2 emission) in second place. This implies the potential of adopting clean energy applications to reduce the environmental impact in these stages [42].
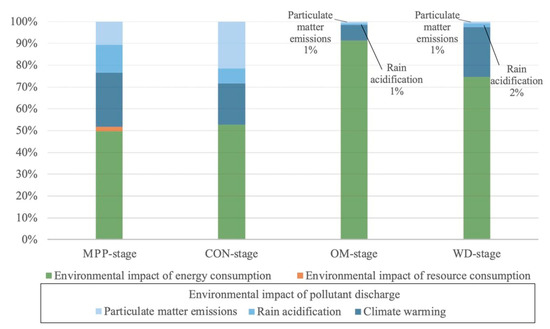
Figure 4.
The composition of environmental impact exergy by factors in each life cycle stage.
4. Discussion
The construction industry plays a significant role in contributing to the global warming issue. By using the multiregional input–output model and structural decomposition analysis model, Chen et al. [43] found that China is one of the largest construction CO2 emitters and also emphasised the efficiency of the production chain in the construction industry. The construction of a bridge is a complex process and also involves diverse energy emission-intensive materials, but only a few studies have focused on the environmental impacts of bridge constructions. The goal of this study was to develop an integrated exergy-based LCA model for assessing the environmental impacts of bridges in order to provide guidance for energy conservation and emission reduction.
ISO 14044 [44] presents the elements required for a general life cycle impact assessment (LCIA), including the selection of categories, indicators and models, impact categories assignment, and indicator results calculation. This study used the existing life cycle inventory results and proposed an integrated exergy-based LCA model for the environmental impact of bridge constructions, which mainly included the exergy assessment of the environmental impact (impact category) of (1) energy consumption, (2) pollutant discharge, and (3) resource consumption. Furthermore, this study also presents the detailed methods (characterisation model) of calculating the environmental impact exergy at four stages of bridge construction. Therefore, this proposed LCA model satisfies the mandatory requirements by ISO 14044 and can be considered as a valid model to quantify the environmental impacts of bridge constructions.
The case study results emphasise that the raw material production and processing stage contributed the most significant environmental impact in the whole life cycle of bridge constructions in comparison with other life cycle stages. Previous studies also highlighted the significant impact of the production stage on the environment. Jonsson et al. [45] reported that the building production stage had a higher contribution to the total environmental loads than the demolition and final disposal stages. Zhang and Wang [46] assessed the embodied carbon emission for building constructions and found that material manufacturing accounted for 80–90% of the total embodied carbon emission. Similar results were reported by Zhang et al. [47], who found that more than 80% of energy was consumed by the building material manufacturing process in the building construction life cycle. As a result, Rebitzer et al. [48] pointed out that the production stage is imperative from the view of sustainability. To reduce the environmental impact in the material production and processing stage, we may need to further emphasise several potential solutions, including the use of alternative pro-environmental materials, the improvement of manufacturing technologies, the use of recycled waste, and the implementation of better construction planning [49,50].
However, considering the study boundaries, this study only focused on three types of pollutant discharges, namely, climate-warming emissions, rain acidification emissions, and particulate matter emissions. The other types of pollutant discharges, such as the impact of the eutrophication of water bodies [15,16], the impact of solid waste [15,16], and the impact of ecological toxicity [28], were neglected in this study. It is difficult to accurately assess the local and temporary effects of these pollutant discharges on the environment. In addition, the positive environmental impact of recycling wastes generated in the waste demolition stage (e.g., steel [17,26] and concrete [15]) was also neglected in this study. Moreover, the proposed exergy-based LCA model neglected the labour consumption value during the bridge life cycle. The authors recommend the proposed exergy-based LCA model to be further developed and include the impact of labour workers in the whole-life analysis [16].
5. Conclusions
Applying the LCA model in the bridge construction field is believed to be an effective approach to achieve construction sustainability. However, due to the limited guidelines and criteria, the number of LCA models for bridge constructions were less than that of other industrial sectors [6]. This study considered energy availability during the life cycle of bridges, resulting in a comprehensive method to capture and quantify the material output and invested resources. The present study proposed an integrated exergy-based LCA model for evaluating the overall environmental impact of bridge constructions, which mainly focused on the exergy assessment of the environmental impact of (1) energy consumption, (2) pollutant discharge, and (3) resource consumption at four stages of bridge constructions. Moreover, the proposed exergy-based LCA model highlighted the overall environmental impact in the whole-life bridge constructions and emphasised the environmental impact of public road network rerouting during bridge construction phases. On the basis of the case study analysis, this study found that the environmental impacts in the raw material production and processing stage of the bridge was the largest, followed by the construction stage and the operation and maintenance stage at second and third place, respectively. The findings of this study can contribute to mitigating the environmental impacts of bridge construction, and the assessment approach can be adopted to guide the environmental impact evaluation for other types of civil constructions globally. It is recommended that the proposed model be developed further to include considerations on diverse pollutant discharges, waste recycling, and labour workers’ impact contribution.
Author Contributions
Conceptualisation, M.M. and M.L.; methodology, M.M. and M.L.; formal analysis, M.M. and Z.L.; resources, M.M. and K.X.; writing—original draft preparation, M.M.; writing—review and editing, Z.L., K.X. and M.L.; supervision, M.L.; funding acquisition, M.L. All authors have read and agreed to the published version of the manuscript.
Funding
This research was funded by the National Key R&D Program of China of the 13th Five-Year (No. 2018YFD1100704).
Institutional Review Board Statement
Not applicable.
Informed Consent Statement
Not applicable.
Data Availability Statement
Not applicable.
Acknowledgments
The authors acknowledge the support by National Centre for International Research of Low-carbon and Green Buildings.
Conflicts of Interest
The authors declare no conflict of interest.
Appendix A
Table A1.
Environmental impact exergy value of the consumption of common mineral resources.
Table A1.
Environmental impact exergy value of the consumption of common mineral resources.
| Raw Material | Environmental Impact Exergy Value (kJ/kg or kJ/m3) | |||||
|---|---|---|---|---|---|---|
| Environmental Impact of Energy Consumption | Environmental Impact of Pollutant Discharge | Environmental Impact of Resource Consumption | Total | |||
| Climate Warming | Rain Acidification | Particulate Matter Emissions | ||||
| Portland cement -42.5 | 6287.20 | 4664.93 | 2138.51 | 2048.38 | 197.44 | 15,336.46 |
| Portland cement -52.5 | 6509.76 | 4748.96 | 2217.54 | 2130.27 | 197.44 | 15,803.98 |
| Portland cement -62.5 | 6732.32 | 4832.99 | 2296.56 | 2212.17 | 197.44 | 16,271.49 |
| Ordinary Portland cement -42.5 | 5307.95 | 4295.19 | 1790.79 | 1688.02 | 197.44 | 13,279.39 |
| Ordinary Portland cement -52.5 | 6287.20 | 4664.93 | 2138.51 | 2048.38 | 197.44 | 15,336.46 |
| Portland slag cement -32.5 | 3661.02 | 3673.36 | 1205.99 | 1081.97 | 197.44 | 9819.77 |
| Portland slag cement -42.5 | 4284.18 | 3908.64 | 1427.27 | 1311.28 | 197.44 | 11,128.82 |
| Portland slag cement -52.5 | 5307.95 | 4295.19 | 1790.79 | 1688.02 | 197.44 | 13,279.39 |
| Pozzolanic Portland cement -32.5 | 4462.23 | 3975.87 | 1490.49 | 1376.80 | 197.44 | 11,502.83 |
| Pozzolanic Portland cement -42.5 | 4818.32 | 4110.32 | 1616.93 | 1507.84 | 197.44 | 12,250.86 |
| Pozzolanic Portland cement -52.5 | 5307.95 | 4295.19 | 1790.79 | 1688.02 | 197.44 | 13,279.39 |
| Fly ash Portland cement -32.5 | 4462.23 | 3975.87 | 1490.49 | 1376.80 | 197.44 | 11,502.83 |
| Fly ash Portland cement -42.5 | 4818.32 | 4110.32 | 1616.93 | 1507.84 | 197.44 | 12,250.86 |
| Fly ash Portland cement -52.5 | 5307.95 | 4295.19 | 1790.79 | 1688.02 | 197.44 | 13,279.39 |
| Composite Portland cement -42.5 | 4640.28 | 4043.09 | 1553.71 | 1442.32 | 197.44 | 11,876.84 |
| Composite Portland cement -52.5 | 5307.95 | 4295.19 | 1790.79 | 1688.02 | 197.44 | 13,279.39 |
| Asphalt | 45,257.76 | —— | —— | —— | —— | 45,257.76 |
| Asphalt concrete | 5014.62 | 288.53 | 23 | 9.89 | 77.98 | 5414.02 |
| Concrete C20 | 2616.84 | 1456.04 | 621.05 | 593.84 | 124.84 | 5412.61 |
| Concrete C25 | 2942.52 | 1709.52 | 738.6 | 706.46 | 134.44 | 6231.54 |
| Concrete C30 | 3152.52 | 1871.19 | 813.4 | 778.13 | 140.74 | 6755.98 |
| Concrete C35 | 3453.00 | 2102.21 | 920.27 | 880.51 | 149.78 | 7505.77 |
| Concrete C40 | 3631.42 | 2240.58 | 984.38 | 941.94 | 155.06 | 7953.38 |
| Concrete C45 | 3749.66 | 2332.72 | 1027.13 | 982.9 | 158.53 | 8250.94 |
| Concrete C50 | 3928.08 | 2471.09 | 1091.24 | 1044.33 | 163.82 | 8698.56 |
| Rebar | 21,548.72 | 9638.69 | 6040.93 | 4368.38 | 698.25 | 42,294.97 |
| Steel plate | 21,872.47 | 9806.35 | 6137.44 | 4434.14 | 698.25 | 42,948.64 |
| Steel pipe | 22,994.61 | 10,387.47 | 6471.94 | 4662.07 | 698.25 | 45,214.33 |
| Steel strand | 21,578.32 | 9654.01 | 6049.75 | 4374.39 | 698.25 | 42,354.73 |
| Rubber and plastic products | 17,391.82 | 6401.82 | 2996.87 | 7952.21 | 0.26 | 34,742.99 |
| Coating | 11,992.92 | 4389.99 | 2032.50 | 5228.90 | 0.17 | 23,644.47 |
Table A2.
The environmental impact exergy value of fuel vehicles.
Table A2.
The environmental impact exergy value of fuel vehicles.
| Item | Gasoline Car | Diesel Car | Fuel Vehicle | |
|---|---|---|---|---|
| Proportion | 90% | 10% | 100% | |
| Fuel consumption (kg/km) | 0.0734 | 0.0847 | 0.0745 | |
| Environmental impact of energy consumption (kJ/km) | 3781.90 | 4325.24 | 3836.23 | |
| Environmental impact of pollutant discharge (kJ/km) | Climate warming | 1167.16 | 1309.89 | 1181.43 |
| Rain acidification | 140.57 | 93.54 | 135.87 | |
| Particulate matter emissions | 18.89 | 21.80 | 19.18 | |
| Environmental impact of resource consumption (kJ/km) | 0 | 0 | 0 | |
| Total (kJ/km) | 5108.52 | 5750.48 | 5172.72 | |
Table A3.
Environmental impact exergy value caused by the bypassing of motor vehicles.
Table A3.
Environmental impact exergy value caused by the bypassing of motor vehicles.
| Type | Percentage | Environmental Impact Exergy Value (kJ/(vehicle/km)) | |||||
|---|---|---|---|---|---|---|---|
| Environmental Impact of Energy Consumption | Environmental Impact of Pollutant Discharge | Environmental Impact of Resource Consumption | Total | ||||
| Climate Warming | Rain Acidification | Particulate Matter Emissions | |||||
| Fuel vehicle | 97% | 3836.23 | 1181.43 | 135.87 | 19.18 | 0 | 5172.72 |
| Gas vehicle | 2% | 4026.81 | 840.35 | 15.99 | 0.09 | 0 | 4883.24 |
| Electric vehicle | 1% | 1397.00 | 525.21 | 223.20 | 726.84 | 0 | 2872.25 |
| Total | 100% | 3815.65 | 1168.05 | 134.35 | 25.88 | 0 | 5143.92 |
Table A4.
Energy exergy of different energy sources [29].
Table A4.
Energy exergy of different energy sources [29].
| Type of Energy | Energy Exergy Value (kJ/kg) | Type of Energy | Energy Exergy Value (kJ/kg) |
|---|---|---|---|
| Raw coal | 21,966 | kerosene | 44,119 |
| Coke | 29,874 | diesel | 43,691 |
| Standard coal | 30,769 | gasoline | 44,119 |
| Crude oil | 42,834 | LPG | 52,437 |
| Fuel oil | 42,834 | nuclear power generation | 3600 |
| Gas (ρ = 0.84 kg/m3) | 21,148 | natural gas (ρ = 0.72 kg/m3) | 56,536 |
| Hydro, wind, and solar power generation | 3600 | electricity | 8728 (kJ/kWh) |
Table A5.
Exergy value of pollutant treatment process.
Table A5.
Exergy value of pollutant treatment process.
| Exergy Consumption Type | Substance | |||
|---|---|---|---|---|
| CO2 | SO2 | NOX | PM | |
| Exergy consumption of abatement cost (kJ/kg) | 4400 | 17,500 | 26,000 | 500 |
| Exergy consumption of thermogeological cost (kJ/kg) | — | 97,820 | 71,880 | 53,420 |
| Total exergy consumption (kJ/kg) | 4400 | 115,320 | 97,880 | 53,920 |
Table A6.
Basic data used for the calculation of environmental impact exergy value (Portland cement).
Table A6.
Basic data used for the calculation of environmental impact exergy value (Portland cement).
| Raw material | Type | Consumption (kg/kg) | Transportation Method | Average Transportation Distance (km) | Energy Consumption | |
| Diesel (kg/kg) | Electricity (kWh/kg) | |||||
| Limestone | 1.099 | 8% railway, 14% waterway, 78% road | railway: 731, waterway: 1477, road: 181 | 0.00766 | 0.00050 | |
| Sandstone | 0.112 | 0.00078 | 0.00005 | |||
| Clay | 0.091 | 0.00063 | 0.00004 | |||
| Dihydrate Gypsum | 0.05 | 0.00035 | 0.00002 | |||
| Steel slag | 0.078 | 100% road | road: 50 | 0.00014 | 0.00000 | |
| Production process | Energy Consumption | Emission Coefficients of Non-Energy-Consuming Pollutants (kg/kg) | ||||
| Electricity (kWh/kg) | Coal (kg/kg) | CO2 | SO2 | NOx | PM | |
| 0.0855 | 0.1512 | 0.532 | 0.00016 | 0.00175 | 0.00077 | |
| Cement transportation | Transportation Method | Average Transportation Distance (km) [40] | Energy Consumption | |||
| Electricity (kWh/kg) | Diesel (kg/kg) | |||||
| 8% railway, 14% waterway, 78% road | 300 | 0.00019 | 0.00903 | |||
Table A7.
Environmental impact exergy value of energy consumption, pollutant discharge, and resource consumption in Portland cement’s production and processing stage.
Table A7.
Environmental impact exergy value of energy consumption, pollutant discharge, and resource consumption in Portland cement’s production and processing stage.
| Process | Environmental Impact Exergy Value of Energy Consumption (kJ/kg) | |||||
| Diesel | Electricity | Coal | Total | |||
| Raw material transportation | 488.61 | 5.72 | — | 494.33 | ||
| Production process | — | 791.02 | 3626.62 | 4417.63 | ||
| Cement transportation | 394.35 | 1.64 | — | 395.99 | ||
| Process | Environmental Impact Exergy Value of Pollutant Discharge (kJ/kg) | |||||
| CO2 | SO2 | NOX | PM | Total | ||
| Raw material transportation | 150.13 | 0.8 | 10.68 | 5.44 | 167.05 | |
| Production process | Energy utilisation part | 1664.02 | 1399.54 | 180.54 | 1637.89 | 4881.99 |
| Non-energy-consuming part | 2340.8 | 18.22 | 170.76 | 41.46 | 2571.24 | |
| Total | 4004.82 | 1417.76 | 351.3 | 1679.35 | 7453.23 | |
| Cement transportation | 140.24 | 0.26 | 9.99 | 3.23 | 153.71 | |
| Process | Environmental Impact Exergy Value of Resource Consumption (kJ/kg) | |||||
| Production process | 197.44 | |||||
Table A8.
Summary of the bill of quantities of the bridge life cycle.
Table A8.
Summary of the bill of quantities of the bridge life cycle.
| Stage | Item | Quantities | Unit |
|---|---|---|---|
| Raw material production and processing | cement | 0 | t |
| asphalt | 167 | t | |
| C20 | 210.5 | m3 | |
| C25 | 0 | m3 | |
| C30 | 5078.4 | m3 | |
| C35 | 3465.1 | m3 | |
| C40 | 1310.4 | m3 | |
| C45 | 0 | m3 | |
| C50 | 5295.2 | m3 | |
| rebar | 2023.1 | t | |
| steel plate | 1.75 | t | |
| steel pipe | 13.76 | t | |
| steel strand | 204.6 | t | |
| PVC | 0.295 | t | |
| coating | 0.6805 | t | |
| Construction | gasoline | 2272.752 | kg |
| diesel | 67,052.131 | kg | |
| electricity | 1,389,781 | kWh | |
| Operation and maintenance | gasoline | 10,255 | kg |
| diesel | 54,514.815 | kg | |
| electricity | 33,047.2 | kWh | |
| asphalt | 417.5 | t | |
| the bypassing of motor vehicles | 720,000 | vehicle/km | |
| Waste demolition | gasoline | 2627.82 | kg |
| diesel | 15341 | kg | |
| electricity | 840.42 | kWh |
References
- Wu, Y.; Chau, K.W.; Lu, W.; Shen, L.; Shuai, C.; Chen, J. Decoupling relationship between economic output and carbon emission in the Chinese construction industry. Environ. Impact Assess. Rev. 2018, 71, 60–69. [Google Scholar] [CrossRef]
- Onat, N.C.; Kucukvar, M. Carbon footprint of construction industry: A global review and supply chain analysis. Renew. Sustain. Energy Rev. 2020, 124, 109783. [Google Scholar] [CrossRef]
- Robinson, G. Global Construction 2030: A Global Forecast for the Construction Industry to 2030; Global Construction Perspectives and Oxford Economics: London, UK, 2015. [Google Scholar]
- 2020 Statistical Bulletin on the Development of the Transport Industry in China. Available online: https://xxgk.mot.gov.cn/2020/jigou/zhghs/202105/t20210517_3593412.html (accessed on 6 September 2021). (In Chinese)
- Kaewunruen, S.; Sresakoolchai, J.; Zhou, Z. Sustainability-Based Lifecycle Management for Bridge Infrastructure Using 6D BIM. Sustainability 2020, 12, 2436. [Google Scholar] [CrossRef] [Green Version]
- Du, G.; Karoumi, R. Life cycle assessment framework for railway bridges: Literature survey and critical issues. Struct. Infrastruct. Eng. 2014, 10, 277–294. [Google Scholar] [CrossRef]
- BS Institution. BS EN ISO 14044:2006 Environmental Management-Life Cycle Assessment-Requirements and Guidelines. Available online: https://www.iso.org/standard/38498.html (accessed on 26 October 2021).
- Du, G.; Karoumi, R. Life cycle assessment of a railway bridge: Comparison of two superstructure designs. Struct. Infrastruct. Eng. 2013, 9, 1149–1160. [Google Scholar] [CrossRef]
- Padgett, J.E.; Dennemann, K.; Ghosh, J. Risk-based seismic life-cycle cost–benefit (LCC-B) analysis for bridge retrofit assessment. Struct. Saf. 2010, 32, 165–173. [Google Scholar] [CrossRef]
- Cadenazzi, T.; Dotelli, G.; Rossini, M.; Nolan, S.; Nanni, A. Life-Cycle Cost and Life-Cycle Assessment Analysis at the Design Stage of a Fiber-Reinforced Polymer-Reinforced Concrete Bridge in Florida. Adv. Civ. Eng. Mater. 2019, 8, 128–151. [Google Scholar] [CrossRef]
- Bizjak, K.F.; Lenart, S. Life cycle assessment of a geosynthetic-reinforced soil bridge system—A case study. Geotext. Geomembr. 2018, 46, 543–558. [Google Scholar] [CrossRef]
- Habert, G.; Denarié, E.; Šajna, A.; Rossi, P. Lowering the global warming impact of bridge rehabilitations by using Ultra High Performance Fibre Reinforced Concretes. Cem. Concr. Compos. 2013, 38, 1–11. [Google Scholar] [CrossRef] [Green Version]
- Hammad, A.; Zhang, C.; Hu, Y.; Mozaffari, E. Mobile Model-Based Bridge Lifecycle Management System. Comput. Civ. Infrastruct. Eng. 2006, 21, 530–547. [Google Scholar] [CrossRef]
- Pang, B.; Yang, P.; Wang, Y.; Kendall, A.; Xie, H.; Zhang, Y. Life cycle environmental impact assessment of a bridge with different strengthening schemes. Int. J. Life Cycle Assess. 2015, 20, 1300–1311. [Google Scholar] [CrossRef]
- Du, G.; Safi, M.; Pettersson, L.J.; Karoumi, R. Life cycle assessment as a decision support tool for bridge procurement: Environmental impact comparison among five bridge designs. Int. J. Life Cycle Assess. 2014, 19, 1948–1964. [Google Scholar] [CrossRef]
- Zhou, Z.; Alcalá, J.; Yepes, V. Bridge Carbon Emissions and Driving Factors Based on a Life-Cycle Assessment Case Study: Cable-Stayed Bridge over Hun He River in Liaoning, China. Int. J. Environ. Res. Public Health 2020, 17, 5953. [Google Scholar] [CrossRef] [PubMed]
- O’Born, R. Life cycle assessment of large scale timber bridges: A case study from the world’s longest timber bridge design in Norway. Transp. Res. Part D Transp. Environ. 2018, 59, 301–312. [Google Scholar] [CrossRef]
- Ayres, R.U.; Ayres, L.W.; Martinás, K. Exergy, waste accounting, and life-cycle analysis. Energy 1998, 23, 355–363. [Google Scholar] [CrossRef]
- Ehtiwesh, I.A.; Coelho, M.; Sousa, A.C. Exergetic and environmental life cycle assessment analysis of concentrated solar power plants. Renew. Sustain. Energy Rev. 2016, 56, 145–155. [Google Scholar] [CrossRef]
- Lombardi, L. Life cycle assessment comparison of technical solutions for CO2 emissions reduction in power generation. Energy Convers. Manag. 2003, 44, 93–108. [Google Scholar] [CrossRef]
- Cornelissen, R.L.; Hirs, G.G. The value of the exergetic life cycle assessment besides the LCA. Energy Convers. Manag. 2002, 43, 1417–1424. [Google Scholar] [CrossRef]
- Beccali, G.; Cellura, M.; Mistretta, M. New exergy criterion in the “multi-criteria” context: A life cycle assessment of two plaster products. Energy Convers. Manag. 2003, 44, 2821–2838. [Google Scholar] [CrossRef]
- Ashouri, M.; Astaraei, F.R.; Ghasempour, R.; Ahmadi, M.H.; Feidt, M. Optimum insulation thickness determination of a building wall using exergetic life cycle assessment. Appl. Therm. Eng. 2016, 106, 307–315. [Google Scholar] [CrossRef]
- De Meester, B.; Dewulf, J.; Verbeke, S.; Janssens, A.; Van Langenhove, H. Exergetic life-cycle assessment (ELCA) for resource consumption evaluation in the built environment. Build. Environ. 2009, 44, 11–17. [Google Scholar] [CrossRef]
- Liu, M.; Li, B.; Yao, R. A generic model of Exergy Assessment for the Environmental Impact of Building Lifecycle. Energy Build. 2010, 42, 1482–1490. [Google Scholar] [CrossRef]
- Gervásio, H.; Da Silva, L.S. Comparative life-cycle analysis of steel-concrete composite bridges. Struct. Infrastruct. Eng. 2008, 4, 251–269. [Google Scholar] [CrossRef]
- Hammervold, J.; Reenaas, M.; Brattebø, H. Environmental Life Cycle Assessment of Bridges. J. Bridge Eng. 2013, 18, 153–161. [Google Scholar] [CrossRef]
- Navarro, I.; Yepes, V.; Martí, J.V.; González-Vidosa, F. Life cycle impact assessment of corrosion preventive designs applied to prestressed concrete bridge decks. J. Clean. Prod. 2018, 196, 698–713. [Google Scholar] [CrossRef]
- National Standard. General Rules for Calculation of the Comprehensive Energy Consumption; GB/T 2589-2020; National Standard: Beijing, China, 2020. (In Chinese) [Google Scholar]
- NBS. China Statistical Yearbook 2018; English Version; China Statistics Press: Beijing, China, 2018. [Google Scholar]
- Wang, Y. The Analysis of Environmental Impact Assessment in the Highway Bridge Life Cycle—A Case Study of the Expressway Bridge in Guangdong. Master’s Thesis, South China University of Technology, Guangzhou, China, 2017. Available online: https://oversea.cnki.net/kcms/detail/frame/list.aspx?dbcode=CMFD&filename=1017733312.nh&dbname=CMFD201802&RefType=1&vl= (accessed on 1 February 2021).
- Stanek, W. (Ed.) Thermodynamics for Sustainable Management of Natural Resources; Springer: Cham, Switzerland, 2017. [Google Scholar] [CrossRef]
- Liu, M. Study on Life Cycle Exergy Assessment of Building Environmental Impacts; Chongqing University: Chongqing, China, 2008. [Google Scholar]
- China National Petroleum Corporation. CNPC Oil Quality Upgrade Report; China National Petroleum Corporation: Beijing, China, 2015. [Google Scholar]
- China Standard Press. General Administration of Quality Supervision, Inspection and Quarantine of the People’s Republic of China, Natural Gas; GB17820-2012; China Standard Press: Beijing, China, 2012. (In Chinese) [Google Scholar]
- Emission Factors for Greenhouse Gas Inventories. Available online: https://www.epa.gov/sites/production/files/2018-03/documents/emission-factors_mar_2018_0.pdf (accessed on 26 October 2021).
- Szargut, J. Chemical exergies of the elements. Appl. Energy 1989, 32, 269–286. [Google Scholar] [CrossRef]
- Office of the Leading Group for the First National Pollution Source Survey of the State Council. Handbook of the First National Pollution Source Survey on the Pollution Emission Coefficient of Urban Domestic Sources; Office of the Leading Group for the First National Pollution Source Survey of the State Council: Beijing, China, 2008. [Google Scholar]
- General Administration of Quality Supervision. Inspection and Quarantine of China, Standardization Administration of China, Fuel Consumption Evaluation Methods and Targets for Passenger Cars; GB 27999-2014; General Administration of Quality Supervision: Beijing, China, 2014. (In Chinese) [Google Scholar]
- Ministry of Transport of the People’s Republic of China. Highway Engineering Machinery Class Fee Quota; JTG/T3833-2018; Ministry of Transport of the People’s Republic of China: Beijing, China, 2018. (In Chinese) [Google Scholar]
- Ministry of Transport of the People’s Republic of China. Limits and Measurement Methods of Fuel Consumption for Commercial Vehicle for Cargos Transportation; JTT719-2016; Ministry of Transport of the People’s Republic of China: Beijing, China, 2016. (In Chinese) [Google Scholar]
- Xu, J.-K.; Deng, Y.-W. Research on Application of Renewable and Clean Energy in Beijing New Airport. DEStech Trans. Environ. Energy Earth Sci. 2018, 22–25. [Google Scholar] [CrossRef] [Green Version]
- Chen, J.; Wang, Y.; Shi, Q.; Peng, X.; Zheng, J. An international comparison analysis of CO2 emissions in the construction industry. Sustain. Dev. 2021, 29, 754–767. [Google Scholar] [CrossRef]
- International Organization for Standardization. Environmental Management—Life Cycle Assessment—Requirements and Guidelines; International Organization for Standardization: Geneva, Switzerland, 2006. [Google Scholar]
- Jonsson, A.; Bjorklund, T.; Tillman, A.-M. LCA of concrete and steel building frames. Int. J. Life Cycle Assess. 1998, 3, 216–224. [Google Scholar] [CrossRef] [Green Version]
- Zhang, X.; Wang, F. Assessment of embodied carbon emissions for building construction in China: Comparative case studies using alternative methods. Energy Build. 2016, 130, 330–340. [Google Scholar] [CrossRef]
- Zhang, Y.; Yan, D.; Hu, S.; Guo, S. Modelling of energy consumption and carbon emission from the building construction sector in China, a process-based LCA approach. Energy Policy 2019, 134, 110949. [Google Scholar] [CrossRef]
- Rebitzer, G.; Ekvall, T.; Frischknecht, R.; Pennington, D.W. Life cycle assessment part 1: Framework, goal and scope definition, inventory analysis, and applications. Environ. Int. 2004, 30, 701–720. [Google Scholar] [CrossRef]
- Chen, J.; Shi, Q.; Zhang, W. Structural path and sensitivity analysis of the CO2 emissions in the construction industry. Environ. Impact Assess. Rev. 2022, 92, 106679. [Google Scholar] [CrossRef]
- Vieira, D.R.; Calmon, J.L.; Coelho, F.Z. Life cycle assessment (LCA) applied to the manufacturing of common and ecological concrete: A review. Constr. Build. Mater. 2016, 124, 656–666. [Google Scholar] [CrossRef]
Publisher’s Note: MDPI stays neutral with regard to jurisdictional claims in published maps and institutional affiliations. |
© 2021 by the authors. Licensee MDPI, Basel, Switzerland. This article is an open access article distributed under the terms and conditions of the Creative Commons Attribution (CC BY) license (https://creativecommons.org/licenses/by/4.0/).