
Exergy-Based Life Cycle Assessment Model for Evaluating the Environmental Impact of Bridge: Principle and Case Study


Abstract
:1. Introduction
2. Exergy Assessment Model
2.1. Principal Assessment Models for Exergy Assessment
2.1.1. The Environmental Impact of Energy Consumption
- (1)
- Energy consumed in energy production
- (2)
- Energy consumed in energy transportation
2.1.2. The Environmental Impact of Pollutant Discharge
2.1.3. The Environmental Impact of Resource Consumption
2.2. Exergy Assessment Model for Different Bridge Life Cycle Stages
2.2.1. Exergy Assessment Model for Raw Material Production and Processing Stage
2.2.2. Exergy Assessment Model for Construction Stage
2.2.3. Exergy Assessment Model for Operation and Maintenance Stage
2.2.4. Exergy Assessment Model for Waste Demolition Stage
3. Case Study
3.1. The Description of the Case Bridge
3.2. The Exergy Assessment of the Environmental Impact—The Bridge Case
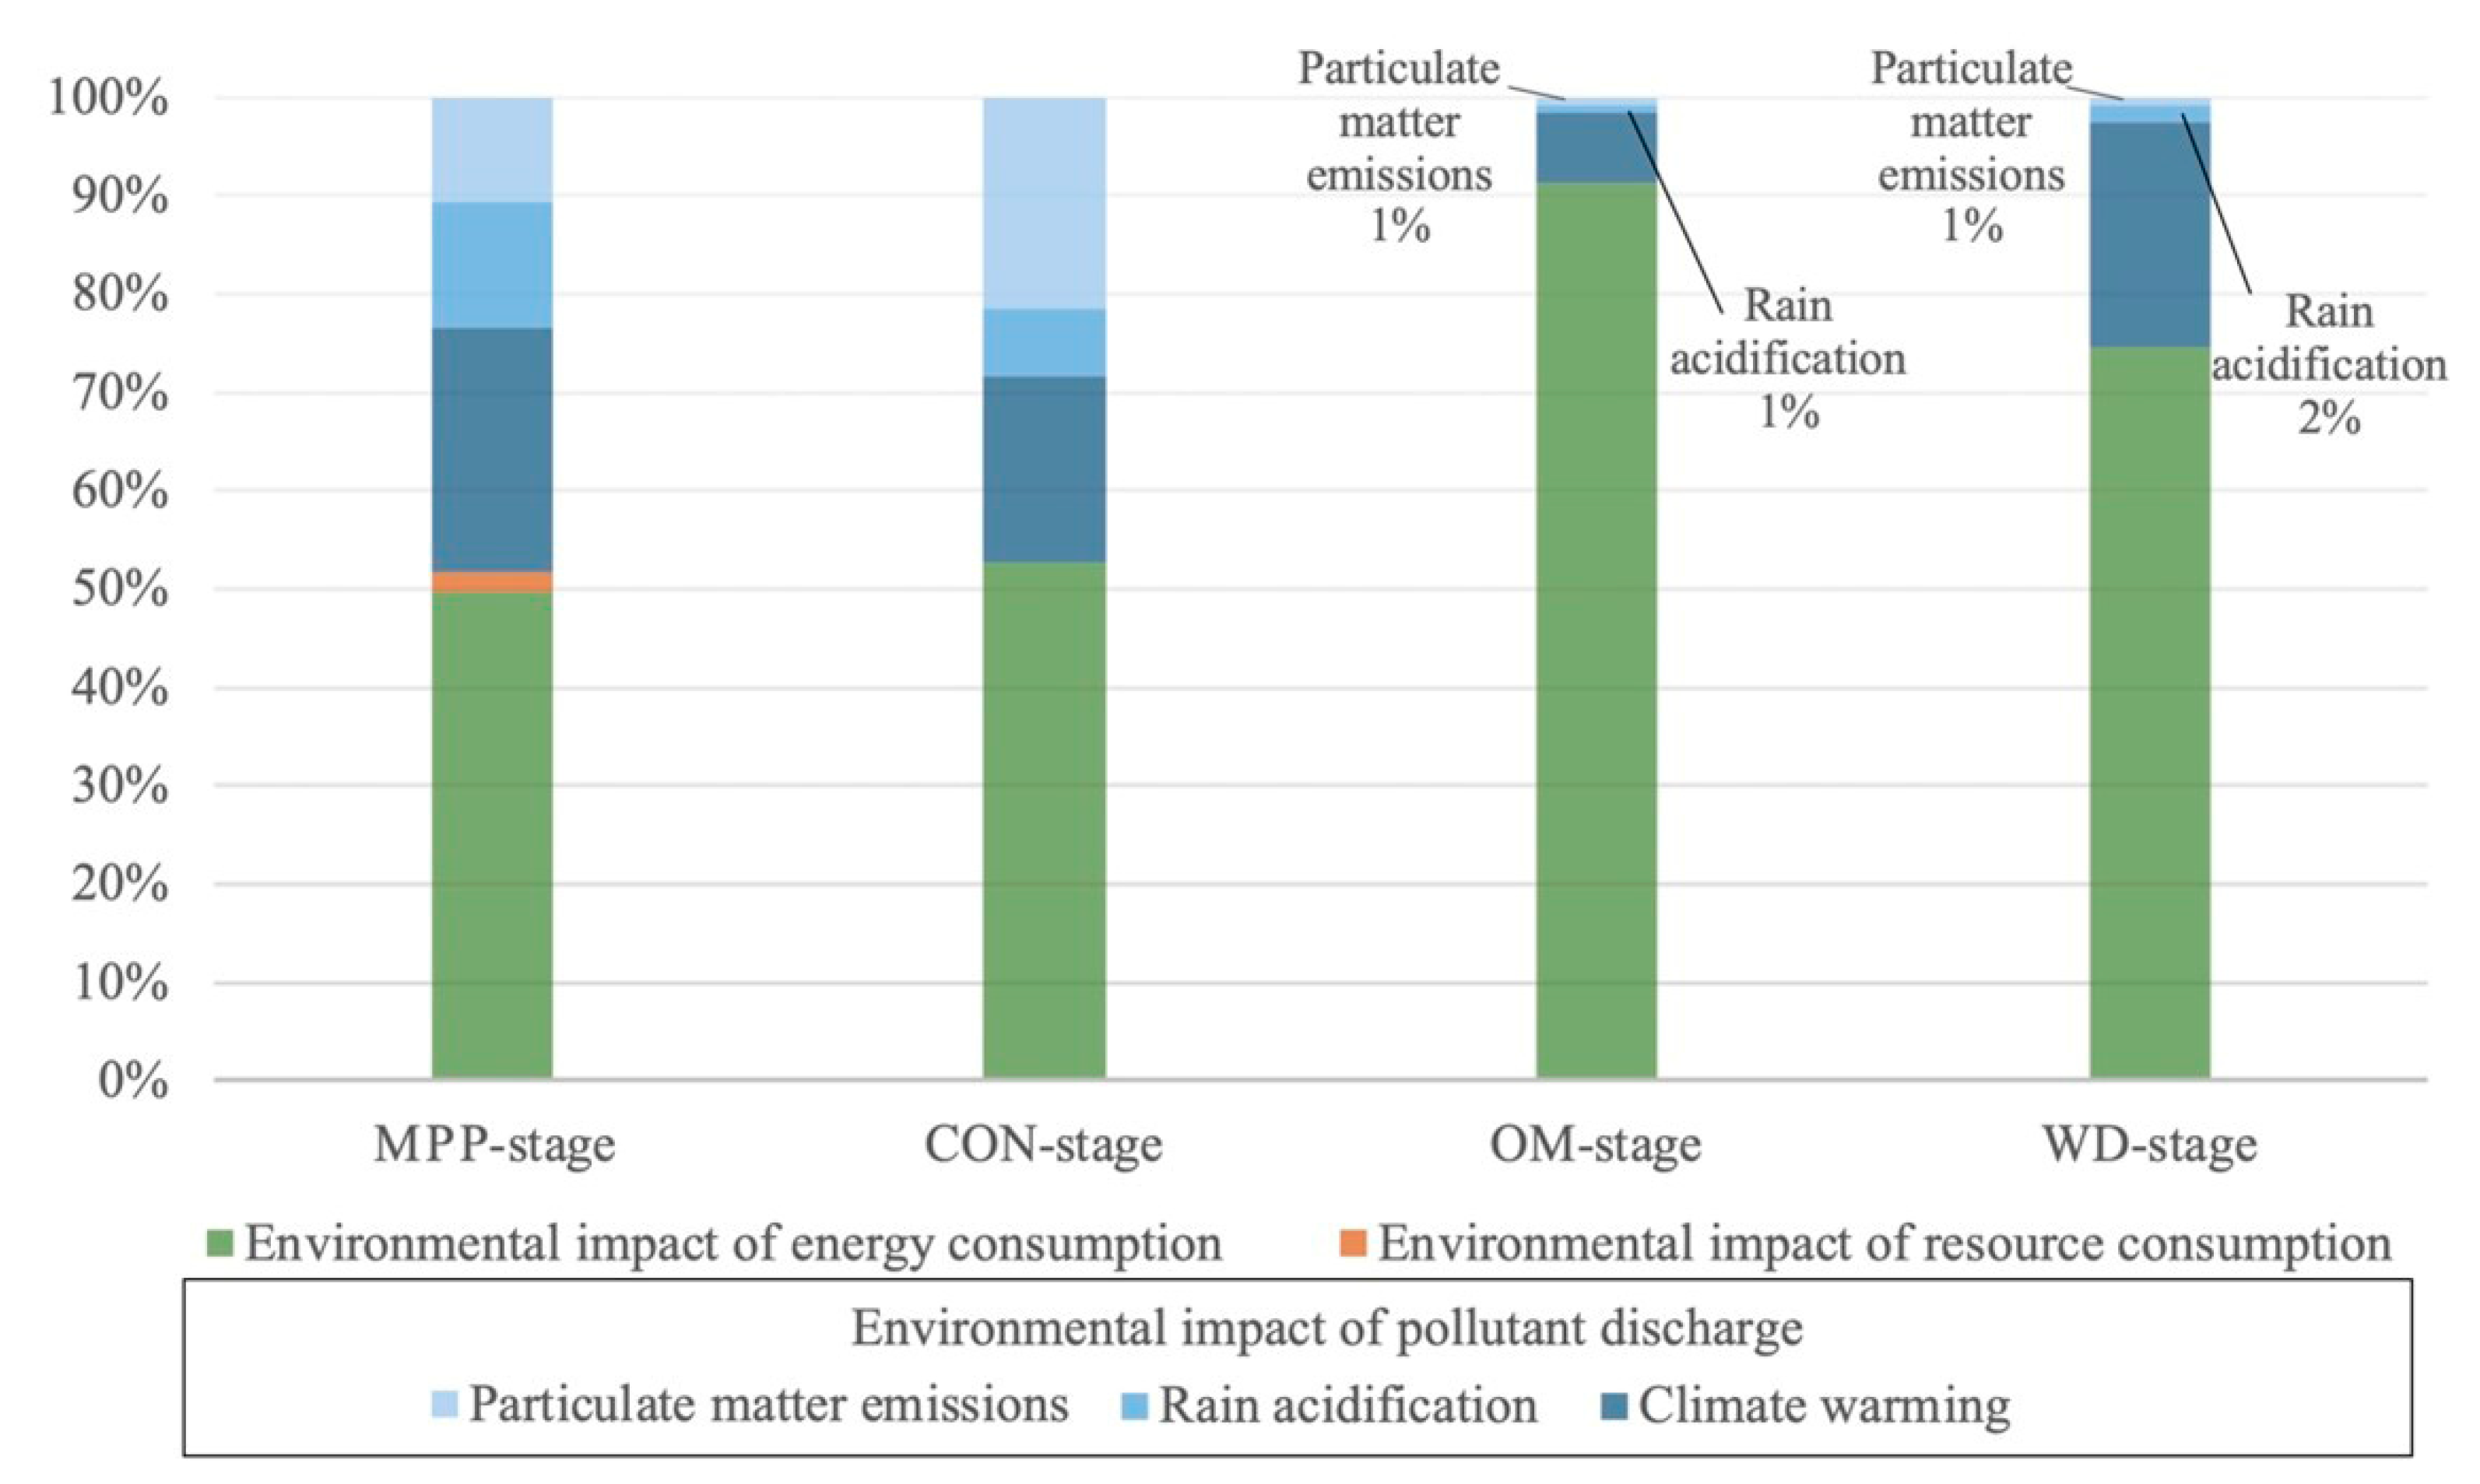
4. Discussion
5. Conclusions
Author Contributions
Funding
Institutional Review Board Statement
Informed Consent Statement
Data Availability Statement
Acknowledgments
Conflicts of Interest
Appendix A

| Raw Material | Environmental Impact Exergy Value (kJ/kg or kJ/m3) | |||||
|---|---|---|---|---|---|---|
| Environmental Impact of Energy Consumption | Environmental Impact of Pollutant Discharge | Environmental Impact of Resource Consumption | Total | |||
| Climate Warming | Rain Acidification | Particulate Matter Emissions | ||||
| Portland cement -42.5 | 6287.20 | 4664.93 | 2138.51 | 2048.38 | 197.44 | 15,336.46 |
| Portland cement -52.5 | 6509.76 | 4748.96 | 2217.54 | 2130.27 | 197.44 | 15,803.98 |
| Portland cement -62.5 | 6732.32 | 4832.99 | 2296.56 | 2212.17 | 197.44 | 16,271.49 |
| Ordinary Portland cement -42.5 | 5307.95 | 4295.19 | 1790.79 | 1688.02 | 197.44 | 13,279.39 |
| Ordinary Portland cement -52.5 | 6287.20 | 4664.93 | 2138.51 | 2048.38 | 197.44 | 15,336.46 |
| Portland slag cement -32.5 | 3661.02 | 3673.36 | 1205.99 | 1081.97 | 197.44 | 9819.77 |
| Portland slag cement -42.5 | 4284.18 | 3908.64 | 1427.27 | 1311.28 | 197.44 | 11,128.82 |
| Portland slag cement -52.5 | 5307.95 | 4295.19 | 1790.79 | 1688.02 | 197.44 | 13,279.39 |
| Pozzolanic Portland cement -32.5 | 4462.23 | 3975.87 | 1490.49 | 1376.80 | 197.44 | 11,502.83 |
| Pozzolanic Portland cement -42.5 | 4818.32 | 4110.32 | 1616.93 | 1507.84 | 197.44 | 12,250.86 |
| Pozzolanic Portland cement -52.5 | 5307.95 | 4295.19 | 1790.79 | 1688.02 | 197.44 | 13,279.39 |
| Fly ash Portland cement -32.5 | 4462.23 | 3975.87 | 1490.49 | 1376.80 | 197.44 | 11,502.83 |
| Fly ash Portland cement -42.5 | 4818.32 | 4110.32 | 1616.93 | 1507.84 | 197.44 | 12,250.86 |
| Fly ash Portland cement -52.5 | 5307.95 | 4295.19 | 1790.79 | 1688.02 | 197.44 | 13,279.39 |
| Composite Portland cement -42.5 | 4640.28 | 4043.09 | 1553.71 | 1442.32 | 197.44 | 11,876.84 |
| Composite Portland cement -52.5 | 5307.95 | 4295.19 | 1790.79 | 1688.02 | 197.44 | 13,279.39 |
| Asphalt | 45,257.76 | —— | —— | —— | —— | 45,257.76 |
| Asphalt concrete | 5014.62 | 288.53 | 23 | 9.89 | 77.98 | 5414.02 |
| Concrete C20 | 2616.84 | 1456.04 | 621.05 | 593.84 | 124.84 | 5412.61 |
| Concrete C25 | 2942.52 | 1709.52 | 738.6 | 706.46 | 134.44 | 6231.54 |
| Concrete C30 | 3152.52 | 1871.19 | 813.4 | 778.13 | 140.74 | 6755.98 |
| Concrete C35 | 3453.00 | 2102.21 | 920.27 | 880.51 | 149.78 | 7505.77 |
| Concrete C40 | 3631.42 | 2240.58 | 984.38 | 941.94 | 155.06 | 7953.38 |
| Concrete C45 | 3749.66 | 2332.72 | 1027.13 | 982.9 | 158.53 | 8250.94 |
| Concrete C50 | 3928.08 | 2471.09 | 1091.24 | 1044.33 | 163.82 | 8698.56 |
| Rebar | 21,548.72 | 9638.69 | 6040.93 | 4368.38 | 698.25 | 42,294.97 |
| Steel plate | 21,872.47 | 9806.35 | 6137.44 | 4434.14 | 698.25 | 42,948.64 |
| Steel pipe | 22,994.61 | 10,387.47 | 6471.94 | 4662.07 | 698.25 | 45,214.33 |
| Steel strand | 21,578.32 | 9654.01 | 6049.75 | 4374.39 | 698.25 | 42,354.73 |
| Rubber and plastic products | 17,391.82 | 6401.82 | 2996.87 | 7952.21 | 0.26 | 34,742.99 |
| Coating | 11,992.92 | 4389.99 | 2032.50 | 5228.90 | 0.17 | 23,644.47 |
| Item | Gasoline Car | Diesel Car | Fuel Vehicle | |
|---|---|---|---|---|
| Proportion | 90% | 10% | 100% | |
| Fuel consumption (kg/km) | 0.0734 | 0.0847 | 0.0745 | |
| Environmental impact of energy consumption (kJ/km) | 3781.90 | 4325.24 | 3836.23 | |
| Environmental impact of pollutant discharge (kJ/km) | Climate warming | 1167.16 | 1309.89 | 1181.43 |
| Rain acidification | 140.57 | 93.54 | 135.87 | |
| Particulate matter emissions | 18.89 | 21.80 | 19.18 | |
| Environmental impact of resource consumption (kJ/km) | 0 | 0 | 0 | |
| Total (kJ/km) | 5108.52 | 5750.48 | 5172.72 | |
| Type | Percentage | Environmental Impact Exergy Value (kJ/(vehicle/km)) | |||||
|---|---|---|---|---|---|---|---|
| Environmental Impact of Energy Consumption | Environmental Impact of Pollutant Discharge | Environmental Impact of Resource Consumption | Total | ||||
| Climate Warming | Rain Acidification | Particulate Matter Emissions | |||||
| Fuel vehicle | 97% | 3836.23 | 1181.43 | 135.87 | 19.18 | 0 | 5172.72 |
| Gas vehicle | 2% | 4026.81 | 840.35 | 15.99 | 0.09 | 0 | 4883.24 |
| Electric vehicle | 1% | 1397.00 | 525.21 | 223.20 | 726.84 | 0 | 2872.25 |
| Total | 100% | 3815.65 | 1168.05 | 134.35 | 25.88 | 0 | 5143.92 |
| Type of Energy | Energy Exergy Value (kJ/kg) | Type of Energy | Energy Exergy Value (kJ/kg) |
|---|---|---|---|
| Raw coal | 21,966 | kerosene | 44,119 |
| Coke | 29,874 | diesel | 43,691 |
| Standard coal | 30,769 | gasoline | 44,119 |
| Crude oil | 42,834 | LPG | 52,437 |
| Fuel oil | 42,834 | nuclear power generation | 3600 |
| Gas (ρ = 0.84 kg/m3) | 21,148 | natural gas (ρ = 0.72 kg/m3) | 56,536 |
| Hydro, wind, and solar power generation | 3600 | electricity | 8728 (kJ/kWh) |
| Exergy Consumption Type | Substance | |||
|---|---|---|---|---|
| CO2 | SO2 | NOX | PM | |
| Exergy consumption of abatement cost (kJ/kg) | 4400 | 17,500 | 26,000 | 500 |
| Exergy consumption of thermogeological cost (kJ/kg) | — | 97,820 | 71,880 | 53,420 |
| Total exergy consumption (kJ/kg) | 4400 | 115,320 | 97,880 | 53,920 |
| Raw material | Type | Consumption (kg/kg) | Transportation Method | Average Transportation Distance (km) | Energy Consumption | |
| Diesel (kg/kg) | Electricity (kWh/kg) | |||||
| Limestone | 1.099 | 8% railway, 14% waterway, 78% road | railway: 731, waterway: 1477, road: 181 | 0.00766 | 0.00050 | |
| Sandstone | 0.112 | 0.00078 | 0.00005 | |||
| Clay | 0.091 | 0.00063 | 0.00004 | |||
| Dihydrate Gypsum | 0.05 | 0.00035 | 0.00002 | |||
| Steel slag | 0.078 | 100% road | road: 50 | 0.00014 | 0.00000 | |
| Production process | Energy Consumption | Emission Coefficients of Non-Energy-Consuming Pollutants (kg/kg) | ||||
| Electricity (kWh/kg) | Coal (kg/kg) | CO2 | SO2 | NOx | PM | |
| 0.0855 | 0.1512 | 0.532 | 0.00016 | 0.00175 | 0.00077 | |
| Cement transportation | Transportation Method | Average Transportation Distance (km) [40] | Energy Consumption | |||
| Electricity (kWh/kg) | Diesel (kg/kg) | |||||
| 8% railway, 14% waterway, 78% road | 300 | 0.00019 | 0.00903 | |||
| Process | Environmental Impact Exergy Value of Energy Consumption (kJ/kg) | |||||
| Diesel | Electricity | Coal | Total | |||
| Raw material transportation | 488.61 | 5.72 | — | 494.33 | ||
| Production process | — | 791.02 | 3626.62 | 4417.63 | ||
| Cement transportation | 394.35 | 1.64 | — | 395.99 | ||
| Process | Environmental Impact Exergy Value of Pollutant Discharge (kJ/kg) | |||||
| CO2 | SO2 | NOX | PM | Total | ||
| Raw material transportation | 150.13 | 0.8 | 10.68 | 5.44 | 167.05 | |
| Production process | Energy utilisation part | 1664.02 | 1399.54 | 180.54 | 1637.89 | 4881.99 |
| Non-energy-consuming part | 2340.8 | 18.22 | 170.76 | 41.46 | 2571.24 | |
| Total | 4004.82 | 1417.76 | 351.3 | 1679.35 | 7453.23 | |
| Cement transportation | 140.24 | 0.26 | 9.99 | 3.23 | 153.71 | |
| Process | Environmental Impact Exergy Value of Resource Consumption (kJ/kg) | |||||
| Production process | 197.44 | |||||
| Stage | Item | Quantities | Unit |
|---|---|---|---|
| Raw material production and processing | cement | 0 | t |
| asphalt | 167 | t | |
| C20 | 210.5 | m3 | |
| C25 | 0 | m3 | |
| C30 | 5078.4 | m3 | |
| C35 | 3465.1 | m3 | |
| C40 | 1310.4 | m3 | |
| C45 | 0 | m3 | |
| C50 | 5295.2 | m3 | |
| rebar | 2023.1 | t | |
| steel plate | 1.75 | t | |
| steel pipe | 13.76 | t | |
| steel strand | 204.6 | t | |
| PVC | 0.295 | t | |
| coating | 0.6805 | t | |
| Construction | gasoline | 2272.752 | kg |
| diesel | 67,052.131 | kg | |
| electricity | 1,389,781 | kWh | |
| Operation and maintenance | gasoline | 10,255 | kg |
| diesel | 54,514.815 | kg | |
| electricity | 33,047.2 | kWh | |
| asphalt | 417.5 | t | |
| the bypassing of motor vehicles | 720,000 | vehicle/km | |
| Waste demolition | gasoline | 2627.82 | kg |
| diesel | 15341 | kg | |
| electricity | 840.42 | kWh |
References
- Wu, Y.; Chau, K.W.; Lu, W.; Shen, L.; Shuai, C.; Chen, J. Decoupling relationship between economic output and carbon emission in the Chinese construction industry. Environ. Impact Assess. Rev. 2018, 71, 60–69. [Google Scholar] [CrossRef]
- Onat, N.C.; Kucukvar, M. Carbon footprint of construction industry: A global review and supply chain analysis. Renew. Sustain. Energy Rev. 2020, 124, 109783. [Google Scholar] [CrossRef]
- Robinson, G. Global Construction 2030: A Global Forecast for the Construction Industry to 2030; Global Construction Perspectives and Oxford Economics: London, UK, 2015. [Google Scholar]
- 2020 Statistical Bulletin on the Development of the Transport Industry in China. Available online: https://xxgk.mot.gov.cn/2020/jigou/zhghs/202105/t20210517_3593412.html (accessed on 6 September 2021). (In Chinese)
- Kaewunruen, S.; Sresakoolchai, J.; Zhou, Z. Sustainability-Based Lifecycle Management for Bridge Infrastructure Using 6D BIM. Sustainability 2020, 12, 2436. [Google Scholar] [CrossRef] [Green Version]
- Du, G.; Karoumi, R. Life cycle assessment framework for railway bridges: Literature survey and critical issues. Struct. Infrastruct. Eng. 2014, 10, 277–294. [Google Scholar] [CrossRef]
- BS Institution. BS EN ISO 14044:2006 Environmental Management-Life Cycle Assessment-Requirements and Guidelines. Available online: https://www.iso.org/standard/38498.html (accessed on 26 October 2021).
- Du, G.; Karoumi, R. Life cycle assessment of a railway bridge: Comparison of two superstructure designs. Struct. Infrastruct. Eng. 2013, 9, 1149–1160. [Google Scholar] [CrossRef]
- Padgett, J.E.; Dennemann, K.; Ghosh, J. Risk-based seismic life-cycle cost–benefit (LCC-B) analysis for bridge retrofit assessment. Struct. Saf. 2010, 32, 165–173. [Google Scholar] [CrossRef]
- Cadenazzi, T.; Dotelli, G.; Rossini, M.; Nolan, S.; Nanni, A. Life-Cycle Cost and Life-Cycle Assessment Analysis at the Design Stage of a Fiber-Reinforced Polymer-Reinforced Concrete Bridge in Florida. Adv. Civ. Eng. Mater. 2019, 8, 128–151. [Google Scholar] [CrossRef]
- Bizjak, K.F.; Lenart, S. Life cycle assessment of a geosynthetic-reinforced soil bridge system—A case study. Geotext. Geomembr. 2018, 46, 543–558. [Google Scholar] [CrossRef]
- Habert, G.; Denarié, E.; Šajna, A.; Rossi, P. Lowering the global warming impact of bridge rehabilitations by using Ultra High Performance Fibre Reinforced Concretes. Cem. Concr. Compos. 2013, 38, 1–11. [Google Scholar] [CrossRef] [Green Version]
- Hammad, A.; Zhang, C.; Hu, Y.; Mozaffari, E. Mobile Model-Based Bridge Lifecycle Management System. Comput. Civ. Infrastruct. Eng. 2006, 21, 530–547. [Google Scholar] [CrossRef]
- Pang, B.; Yang, P.; Wang, Y.; Kendall, A.; Xie, H.; Zhang, Y. Life cycle environmental impact assessment of a bridge with different strengthening schemes. Int. J. Life Cycle Assess. 2015, 20, 1300–1311. [Google Scholar] [CrossRef]
- Du, G.; Safi, M.; Pettersson, L.J.; Karoumi, R. Life cycle assessment as a decision support tool for bridge procurement: Environmental impact comparison among five bridge designs. Int. J. Life Cycle Assess. 2014, 19, 1948–1964. [Google Scholar] [CrossRef]
- Zhou, Z.; Alcalá, J.; Yepes, V. Bridge Carbon Emissions and Driving Factors Based on a Life-Cycle Assessment Case Study: Cable-Stayed Bridge over Hun He River in Liaoning, China. Int. J. Environ. Res. Public Health 2020, 17, 5953. [Google Scholar] [CrossRef] [PubMed]
- O’Born, R. Life cycle assessment of large scale timber bridges: A case study from the world’s longest timber bridge design in Norway. Transp. Res. Part D Transp. Environ. 2018, 59, 301–312. [Google Scholar] [CrossRef]
- Ayres, R.U.; Ayres, L.W.; Martinás, K. Exergy, waste accounting, and life-cycle analysis. Energy 1998, 23, 355–363. [Google Scholar] [CrossRef]
- Ehtiwesh, I.A.; Coelho, M.; Sousa, A.C. Exergetic and environmental life cycle assessment analysis of concentrated solar power plants. Renew. Sustain. Energy Rev. 2016, 56, 145–155. [Google Scholar] [CrossRef]
- Lombardi, L. Life cycle assessment comparison of technical solutions for CO2 emissions reduction in power generation. Energy Convers. Manag. 2003, 44, 93–108. [Google Scholar] [CrossRef]
- Cornelissen, R.L.; Hirs, G.G. The value of the exergetic life cycle assessment besides the LCA. Energy Convers. Manag. 2002, 43, 1417–1424. [Google Scholar] [CrossRef]
- Beccali, G.; Cellura, M.; Mistretta, M. New exergy criterion in the “multi-criteria” context: A life cycle assessment of two plaster products. Energy Convers. Manag. 2003, 44, 2821–2838. [Google Scholar] [CrossRef]
- Ashouri, M.; Astaraei, F.R.; Ghasempour, R.; Ahmadi, M.H.; Feidt, M. Optimum insulation thickness determination of a building wall using exergetic life cycle assessment. Appl. Therm. Eng. 2016, 106, 307–315. [Google Scholar] [CrossRef]
- De Meester, B.; Dewulf, J.; Verbeke, S.; Janssens, A.; Van Langenhove, H. Exergetic life-cycle assessment (ELCA) for resource consumption evaluation in the built environment. Build. Environ. 2009, 44, 11–17. [Google Scholar] [CrossRef]
- Liu, M.; Li, B.; Yao, R. A generic model of Exergy Assessment for the Environmental Impact of Building Lifecycle. Energy Build. 2010, 42, 1482–1490. [Google Scholar] [CrossRef]
- Gervásio, H.; Da Silva, L.S. Comparative life-cycle analysis of steel-concrete composite bridges. Struct. Infrastruct. Eng. 2008, 4, 251–269. [Google Scholar] [CrossRef]
- Hammervold, J.; Reenaas, M.; Brattebø, H. Environmental Life Cycle Assessment of Bridges. J. Bridge Eng. 2013, 18, 153–161. [Google Scholar] [CrossRef]
- Navarro, I.; Yepes, V.; Martí, J.V.; González-Vidosa, F. Life cycle impact assessment of corrosion preventive designs applied to prestressed concrete bridge decks. J. Clean. Prod. 2018, 196, 698–713. [Google Scholar] [CrossRef]
- National Standard. General Rules for Calculation of the Comprehensive Energy Consumption; GB/T 2589-2020; National Standard: Beijing, China, 2020. (In Chinese) [Google Scholar]
- NBS. China Statistical Yearbook 2018; English Version; China Statistics Press: Beijing, China, 2018. [Google Scholar]
- Wang, Y. The Analysis of Environmental Impact Assessment in the Highway Bridge Life Cycle—A Case Study of the Expressway Bridge in Guangdong. Master’s Thesis, South China University of Technology, Guangzhou, China, 2017. Available online: https://oversea.cnki.net/kcms/detail/frame/list.aspx?dbcode=CMFD&filename=1017733312.nh&dbname=CMFD201802&RefType=1&vl= (accessed on 1 February 2021).
- Stanek, W. (Ed.) Thermodynamics for Sustainable Management of Natural Resources; Springer: Cham, Switzerland, 2017. [Google Scholar] [CrossRef]
- Liu, M. Study on Life Cycle Exergy Assessment of Building Environmental Impacts; Chongqing University: Chongqing, China, 2008. [Google Scholar]
- China National Petroleum Corporation. CNPC Oil Quality Upgrade Report; China National Petroleum Corporation: Beijing, China, 2015. [Google Scholar]
- China Standard Press. General Administration of Quality Supervision, Inspection and Quarantine of the People’s Republic of China, Natural Gas; GB17820-2012; China Standard Press: Beijing, China, 2012. (In Chinese) [Google Scholar]
- Emission Factors for Greenhouse Gas Inventories. Available online: https://www.epa.gov/sites/production/files/2018-03/documents/emission-factors_mar_2018_0.pdf (accessed on 26 October 2021).
- Szargut, J. Chemical exergies of the elements. Appl. Energy 1989, 32, 269–286. [Google Scholar] [CrossRef]
- Office of the Leading Group for the First National Pollution Source Survey of the State Council. Handbook of the First National Pollution Source Survey on the Pollution Emission Coefficient of Urban Domestic Sources; Office of the Leading Group for the First National Pollution Source Survey of the State Council: Beijing, China, 2008. [Google Scholar]
- General Administration of Quality Supervision. Inspection and Quarantine of China, Standardization Administration of China, Fuel Consumption Evaluation Methods and Targets for Passenger Cars; GB 27999-2014; General Administration of Quality Supervision: Beijing, China, 2014. (In Chinese) [Google Scholar]
- Ministry of Transport of the People’s Republic of China. Highway Engineering Machinery Class Fee Quota; JTG/T3833-2018; Ministry of Transport of the People’s Republic of China: Beijing, China, 2018. (In Chinese) [Google Scholar]
- Ministry of Transport of the People’s Republic of China. Limits and Measurement Methods of Fuel Consumption for Commercial Vehicle for Cargos Transportation; JTT719-2016; Ministry of Transport of the People’s Republic of China: Beijing, China, 2016. (In Chinese) [Google Scholar]
- Xu, J.-K.; Deng, Y.-W. Research on Application of Renewable and Clean Energy in Beijing New Airport. DEStech Trans. Environ. Energy Earth Sci. 2018, 22–25. [Google Scholar] [CrossRef] [Green Version]
- Chen, J.; Wang, Y.; Shi, Q.; Peng, X.; Zheng, J. An international comparison analysis of CO2 emissions in the construction industry. Sustain. Dev. 2021, 29, 754–767. [Google Scholar] [CrossRef]
- International Organization for Standardization. Environmental Management—Life Cycle Assessment—Requirements and Guidelines; International Organization for Standardization: Geneva, Switzerland, 2006. [Google Scholar]
- Jonsson, A.; Bjorklund, T.; Tillman, A.-M. LCA of concrete and steel building frames. Int. J. Life Cycle Assess. 1998, 3, 216–224. [Google Scholar] [CrossRef] [Green Version]
- Zhang, X.; Wang, F. Assessment of embodied carbon emissions for building construction in China: Comparative case studies using alternative methods. Energy Build. 2016, 130, 330–340. [Google Scholar] [CrossRef]
- Zhang, Y.; Yan, D.; Hu, S.; Guo, S. Modelling of energy consumption and carbon emission from the building construction sector in China, a process-based LCA approach. Energy Policy 2019, 134, 110949. [Google Scholar] [CrossRef]
- Rebitzer, G.; Ekvall, T.; Frischknecht, R.; Pennington, D.W. Life cycle assessment part 1: Framework, goal and scope definition, inventory analysis, and applications. Environ. Int. 2004, 30, 701–720. [Google Scholar] [CrossRef]
- Chen, J.; Shi, Q.; Zhang, W. Structural path and sensitivity analysis of the CO2 emissions in the construction industry. Environ. Impact Assess. Rev. 2022, 92, 106679. [Google Scholar] [CrossRef]
- Vieira, D.R.; Calmon, J.L.; Coelho, F.Z. Life cycle assessment (LCA) applied to the manufacturing of common and ecological concrete: A review. Constr. Build. Mater. 2016, 124, 656–666. [Google Scholar] [CrossRef]


| Coal (kg) | Coke (kg) | Crude Oil (kg) | Gasoline (kg) | Kerosene (kg) | Diesel (kg) | Fuel Oil (kg) | Natural Gas (m3) | Electricity (kWh) |
|---|---|---|---|---|---|---|---|---|
| 66.449 | 0.581 | 0.000 | 0.021 | 0.002 | 0.446 | 0.001 | 0.577 | 25.237 |
| Energy Type | Energy Exergy Value [29] (kJ/kg) | Energy Consumption Exergy Value during Energy Production, Processing, and Transportation (kJ/kg) | Embodied Coefficient | |||
|---|---|---|---|---|---|---|
| Mining | Processing and Production | Transportation | Total | |||
| Raw coal | 21,966 | 1729.96 | 0.00 | 289.59 | 2019.55 | 1.09 |
| Coke | 29,874 | 1729.96 | 2171.84 | 289.59 | 4191.39 | 1.14 |
| Crude oil | 42,834 | 4032.40 | 3114.01 | 165.70 | 7312.11 | 1.17 |
| Fuel oil | 42,834 | 4032.40 | 3114.01 | 165.70 | 7312.11 | 1.17 |
| Gasoline | 44,119 | 4032.40 | 3207.43 | 165.70 | 7405.53 | 1.17 |
| Kerosene | 44,119 | 4032.40 | 3207.43 | 165.70 | 7405.53 | 1.17 |
| Diesel | 43,691 | 4032.40 | 3176.32 | 165.70 | 7374.42 | 1.17 |
| Natural gas | 56,536 | 5322.22 | 0.00 | 669.86 | 5992.08 | 1.11 |
| Electricity | 8728 | —— | 1.06 | |||
| Energy Type | Climate Warming (kJ/kg) | Rain Acidification (kJ/kg) | Particulate Matter Emissions (kJ/kg) | Environmental Impact Exergy Value of Pollutant Emissions (kJ/kg) | ||
|---|---|---|---|---|---|---|
| CO2 | SO2 | NOx | Subtotal | PM | ||
| Raw coal | 9038.59 | 8547.52 | 1066.89 | 9614.41 | 8110.65 | 26,764 |
| Coke | 14,140.18 | 8939.61 | 1004.25 | 9943.86 | 491.75 | 24,576 |
| Crude oil | 16,438.00 | 4317.58 | 572.60 | 4890.18 | 257.39 | 21,586 |
| Fuel oil | 16,050.62 | 1349.24 | 668.79 | 2018.04 | 257.39 | 18,326 |
| Gasoline | 15,901.30 | 2.70 | 1912.48 | 1915.18 | 257.39 | 18,074 |
| Kerosene | 17,233.58 | 94.45 | 854.32 | 948.76 | 257.39 | 18,440 |
| Diesel | 15,465.11 | 2.70 | 1101.68 | 1104.38 | 257.39 | 16,827 |
| Natural gas | 13,048.93 | 21.76 | 226.53 | 248.29 | 1.44 | 13,299 |
| Electricity | 3478.19 | 1253.22 | 224.91 | 1478.13 | 4813.54 | 9796.86 |
| Resource Type | Environmental Impact Exergy Value of Resource Consumption (kJ/kg) | Resource Type | Environmental Impact Exergy Value of Resource Consumption (kJ/kg) |
|---|---|---|---|
| Manganese ore | 94 | Bauxite ore | 300 |
| Limestone | 163 | Dolomite | 113 |
| Gypsum | 141 | Fluorite | 307 |
| Magnetite | 460 | Sandstone | 33 |
| Tin | 465 | Iron powder | 6800 |
| Sodium carbonate | 297 | Crushed stone (silica) | 37 |
| Feldspar | 52 | Clay (kaolinite) | 83 |
| Environmental Impact Type | Environmental Impact Exergy Value (kJ/kg) | Percentage | |
|---|---|---|---|
| Environmental Impact of Energy Consumption | 5307.95 | 39.97% | |
| Environmental impact of pollutant discharge | Climate warming | 4295.19 | 32.34% |
| Acidification | 1790.79 | 13.49% | |
| Particulate matter emissions | 1688.02 | 12.71% | |
| Environmental impact of resource consumption | 197.44 | 1.49% | |
| Total | 13,279.39 | 100% | |
| Stage | MPP-Stage | CON-Stage | OM-Stage | WD-Stage | ||
|---|---|---|---|---|---|---|
| Environmental impact exergy value (TJ) | Environmental impact of energy consumption | 110 | 16.4 | 25.4 | 0.927 | |
| Environmental impact of pollutant discharge | Climate warming | 54.8 | 5.91 | 1.96 | 0.282 | |
| Rain acidification | 28.1 | 2.13 | 0.225 | 0.0232 | ||
| Particulate matter emissions | 23.7 | 6.71 | 0.194 | 0.00867 | ||
| Environmental impact of resource consumption | 3.90 | 0 | 0 | 0 | ||
| Total | 220 | 31.1 | 27.6 | 1.24 | ||
Publisher’s Note: MDPI stays neutral with regard to jurisdictional claims in published maps and institutional affiliations. |
© 2021 by the authors. Licensee MDPI, Basel, Switzerland. This article is an open access article distributed under the terms and conditions of the Creative Commons Attribution (CC BY) license (https://creativecommons.org/licenses/by/4.0/).
Share and Cite
Ma, M.; Li, Z.; Xue, K.; Liu, M. Exergy-Based Life Cycle Assessment Model for Evaluating the Environmental Impact of Bridge: Principle and Case Study. Sustainability 2021, 13, 11804. https://doi.org/10.3390/su132111804
Ma M, Li Z, Xue K, Liu M. Exergy-Based Life Cycle Assessment Model for Evaluating the Environmental Impact of Bridge: Principle and Case Study. Sustainability. 2021; 13(21):11804. https://doi.org/10.3390/su132111804
Chicago/Turabian StyleMa, Mingjun, Ziqiao Li, Kai Xue, and Meng Liu. 2021. "Exergy-Based Life Cycle Assessment Model for Evaluating the Environmental Impact of Bridge: Principle and Case Study" Sustainability 13, no. 21: 11804. https://doi.org/10.3390/su132111804
APA StyleMa, M., Li, Z., Xue, K., & Liu, M. (2021). Exergy-Based Life Cycle Assessment Model for Evaluating the Environmental Impact of Bridge: Principle and Case Study. Sustainability, 13(21), 11804. https://doi.org/10.3390/su132111804