Abstract
Identifying the policy effect of Energy-Consuming Right Trading (ECRT), clarifying its mechanism of energy conservation and consumption reduction, is beneficial to realize the win–win situation of economic growth and emission reduction in China. This study first builds a Propensity Score Matching–Difference-in-Differences (PSM-DID) model and empirically tests the impact of Energy-Consuming Right Trading policy on energy intensity in pilot areas based on inter-provincial panel data from 2010 to 2019. Then the policy mechanism was analyzed by further regression, and the spatial effects of the policy were explored by the Spatial Difference-in-Differences (SDID) model. The results show that: (1) The policy can reduce energy intensity by 6.4% to 10.2% in the pilot area. (2) The policy mainly achieves energy consumption reduction by optimizing the industrial structure and promoting scientific and technological input, while the resource tax intensity and the proportion of coal consumption also have synergistic and hindering effects on the policy. (3) There is a significant spatial spillover effect of the policy; it can reduce the energy intensity of the adjacent areas of the pilot by 5.3% and the areas with a high economic association with the pilot by 12%. The conclusion is that China’s Energy-Consuming Right Trading policy can effectively control energy consumption, and the policy shows an excellent positive external effect, worth nationwide implementation. Finally, some policy suggestions are put forward according to the results of the empirical analysis.
1. Introduction
With the development of economies, the consumption of energy in human society has increased rapidly, leading to an unprecedented “energy crisis”. As a non-renewable energy source, high-intensity consumption of fossil energy will reduce social and economic welfare and threaten national energy security [1,2]. More serious is the carbon dioxide emitted by the large-scale burning of fossil fuels exacerbates global warming and environmental pollution. According to the latest report from the Intergovernmental Panel on Climate Change (IPCC), the earth’s average temperature is now 1.1 °C warmer than it was before the industrial revolution. This is mainly due to greenhouse gas emissions caused by human activities burning fossil fuels, and the frequent occurrence of extreme weather and climate accident in recent years is a direct consequence of global warming [3]. In order to solve these problems, many countries are trying to regulate fossil energy consumption through policy guidance and promote the transformation of the energy system to a renewable energy leading mode so as to achieve energy conservation and carbon emission reduction targets [4,5].
As the largest energy producer and consumer in the world, China’s total energy consumption has increased by 28.7% in the past 10 years, and its energy consumption per unit GDP is high, 1.5 times the world average and 2 to 3 times that of developed countries [6]. The energy structure is relatively backward. Although the proportion of coal has decreased in recent years, it is still as high as 56.9% in 2020 [7,8]. China’s industrial production has long been characterized by “high energy consumption and high pollution” due to the predominant use of fossil fuels. As a result, the Chinese government pays great attention to the issue of energy carbon emissions. In December 2020, the Chinese President, Xi Jinping, set a target at the UN Climate Ambition Summit: by 2030, Renewable energy will account for about 25% of China’s primary energy consumption and strive to peak CO2 emissions by 2030 and achieve carbon neutrality by 2060. In 2021, China’s 14th five-year plan was proposed to improve the “dual control” system of energy consumption and intensity, focusing on controlling fossil energy consumption, promoting clean, low-carbon, safe and efficient use of energy and deepening the low-carbon transformation of multiple industries. These strategies set the pathway for China to achieve its emission reduction work [9].
Establishing how to regulate the utilization of traditional fossil energy reasonably to control energy consumption effectively is a problem to be solved urgently. As with other big emitters, China also implemented a number of regulatory policies to promote energy conservation and emission reduction. During the 13th five-year plan period, China rolled out the Energy-Consuming Right Trading (ECRT) policy to accelerate the establishment of a long-term mechanism in the field of energy governance. In July 2016, the National Development and Reform Commission (NDRC) issued the Pilot Scheme of Paid Use and Trading System for Energy-Consuming Right, taking Zhejiang province, Fujian Province, Henan Province and Sichuan Province as the pilot to carry out the confirmation, paid use and trading of initial energy-consuming right. The policy clearly stipulates that the pilot project was expected to achieve initial results by 2019. The pilot effect evaluation is expected to be carried out in 2020, and the experience will be summarized and gradually promoted depending on the situation [10].
As of now, it has been over 5 years since the pilot project of ECRT was implemented in four provinces in China. Has the pilot project achieved its goal? How can ECRT drive the region to reduce energy consumption? Is the policy worth a nationwide implementation? Such questions need to be further explored. Therefore, it is necessary to test the policy effect of ECRT policy empirically.
2. Literature Review
2.1. Mechanism of Environmental Regulation Policy to Reduce Energy Consumption
In the research on energy governance, the mainstream view is that the control of energy consumption and the development of clean energy need the guidance of government departments [11,12,13]. According to the market failure theory, the market mechanism cannot eliminate environmental externalities, while the government has more complete information, and its mandatory policies are effective in solving environmental externalities [14,15]. Porter’s hypothesis points out that strict environmental regulations will induce enterprises’ technological innovation to reduce pollutant emissions and improve economic level [16]. The emission of industrial pollutants mainly comes from the burning of fossil energy. Therefore, strict environmental regulation policies may achieve energy consumption control and economic development at the same time, which was tested by many scholars. Empirical studies show that the environmental regulation policies made by the Chinese government can not only directly reduce energy consumption but also promote economic development by incenting technological innovation [17]. Other studies based on transnational data also reached a result consistent with Porter’s hypothesis. They believe that carbon tax policies first implemented by developed countries reduce energy intensity year by year and, at the same time, not only promoted the technological level of the energy sector but also enabled them to obtain additional economic benefits from the export of clean technologies [18,19]. The different conclusion is that although environmental regulation can reduce energy consumption in the long run, it does not produce good economic benefits in this process, and even reduces the productivity of enterprises and hinders technological innovation [20,21].
The research conclusions of some scholars confirm the effect of environmental regulation policy to some extent and emphasize the heterogeneity of its effect [22]. The first is the difference in the time dimension. It seems that environmental regulation cannot play its due role in the short term. However, when the intensity of environmental regulation increases to a certain extent, that is, it crosses the “inflection point”, its energy-saving effect becomes prominent [23]. The reason is that environmental regulation policies have a certain lag and are prone to impact relevant economic industries in the short term. Secondly, the effect of spatial dimension is different, and the impact of environmental regulation on energy structure is different in different regions. It was found that the positive effect of the Porter hypothesis does not appear in western China [24,25]. In terms of spatial dimension, there is a significant gap in energy consumption between provinces in China, and energy production and demand are different, so the effects of environmental regulation policies are different [26,27]. In addition, the market state also has a certain influence on the effect of environmental regulation. In a perfectly competitive market, strict energy regulation policy will cause the loss of social net welfare; otherwise, it will improve social welfare [28].
2.2. International Energy Consumption Control Policy and China’s ECRT
Today’s energy policy tools range from mandatory decrees to taxes, subsidies, and cap-and-trade [29,30,31]. The former is usually achieved through regulation of energy consumption standards and administrative supervision, while the latter is generally market-oriented policy tools with both fixed standards and variable market mechanisms. In a nutshell, it is a “both carrots and sticks” mode. Table 1 shows the strategic policy planning and main policy tools of some energy countries or regions. It can be seen that market-oriented policy means are the more commonly used regulation mode at present.

Table 1.
Examples of international energy consumption control policies.
From the practical experience of China’s energy policy and even public policy, it is obvious that administration is superior to marketization [42,43]. However, dictatorial environmental policies tend to set uniform quantitative or technical standards for industrial enterprises, which violates the principle of equal margin and is not efficient and conducive to technological innovation [44]. Since the end of the last century, environmental regulation of many countries has shifted from administrative means to the effective combination of administration and market. Environmental quota trading, a market-oriented policy tool, was gradually adopted by many countries [45,46]. China’s ECRT policy is formed on the basis of carbon emission trading and emission trading policies.
The core content of ECRT is that the government sets the total amount of energy-consuming right indicators and allocates them to energy users (mainly for large industrial enterprises) according to the rules. Energy users can freely transfer their warrants in the market with compensation according to the law. The essence of ECRT is to give play to the decisive role of the market in the process of allocating resources. The transmission mechanism of ECRT policy to reduce energy consumption is that the external cost can be internalized by rational allocation of energy-consuming rights. Energy users must undertake the obligation to control the energy consumption within the prescribed range while obtaining the right to consume energy so that enterprises can weigh the direct cost of purchasing warrants and the opportunity cost of reducing energy consumption [47]. On the premise that the warrant trading market is sufficiently perfect, enterprises can spontaneously adjust energy consumption according to the law of market supply and demand to maximize their own cost and income [48].
Some scholars discussed the effect of the ECRT policy. Wang simulated the change of China’s energy intensity during “13th five-year plans” and found that compared with the actual energy intensity, the energy intensity under the ECRT policy decreased by about 14.02%, and the total energy consumption decreased by 7.07%. The principle is that through ECRT policy, energy can carry out intertemporal circulation between provinces and within industries so as to achieve optimal resource allocation [49]. Zhang concluded through scenario simulation that ECRT can improve regional energy conservation potential, but due to the profit-seeking nature of market players, policy benefits between industries are not balanced, so market transactions and government regulation should be carried out in parallel [50]. Shen believes that the system of ECRT can induce enterprises in pilot areas to carry out green invention patent innovation [51]. Yang predicts that under the condition of reasonable allocation of energy-consuming rights, most of China’s manufacturing industries will achieve high energy efficiency in 2025 [52].
2.3. Summary
To sum up, the market-oriented regulation of ECRT seems to play an incentive role in the Porter hypothesis. Enterprises are more willing to invest the funds purchased from energy-consuming indicators in green innovation, thus reducing the energy consumption per unit of production and ultimately creating new income from their own energy-consuming right amount. However, there are relatively few studies on mechanism discussion and effect test of the policy. Even if there are empirical studies, they are all in the form of numerical simulation. The main reason lies in the late implementation of the policy and the small number of data cross sections. Nevertheless, so far, the ECRT policy has been tested for five years, and the data have been relatively sufficient. Therefore, this paper conducted an empirical study based on the propensity score matching–difference-in-differences (PSM-DID) method and provincial level panel data from 2010 to 2019, aiming to answer the following questions:
(1) Whether China’s ECRT policy can effectively reduce regional energy intensity; (2) What is the transmission mechanism of China’s ECRT policy to achieve energy consumption reduction? (3) Whether China’s ECRT policy has a spatial spillover effect and whether it can promote energy consumption reduction in non-policy pilot areas. The innovation and contribution of this paper is the first empirical test of the effectiveness of Chinese ECRT policy based on statistics, and also the first time the PSM-DID model was applied to ECRT policy research. The research conclusion can not only further improve the research content and system of market policy tools in the field of energy resources but also provides some reference for the gradual promotion of ECRT policy in the future.
3. Research Methods
3.1. Model
The Difference-in-Differences model (DID) is primarily used for policy effect assessment in the social sciences. The principle is based on a counterfactual framework to evaluate changes in the observed factors in both cases where the policy occurs and does not occur. This paper regards the establishment of the pilot project of ECRT as a “quasi-natural experiment” and constructs the following regression model to test whether the policy achieved excellent results. Formula (1) is the baseline differential difference model. “ECit” represents the energy consumption intensity of “i” provincial unit “t” years and is the explained variable of the model. “Time” is a time dummy variable used to determine the policy intervention node. Although the ECRT system was officially implemented in 2017, the pilot policy was already established in the government document of the previous year, so 2016 was used as the starting year of the policy. “Treated” was the indicator variable of policy pilot; it was 1 in Zhejiang, Fujian, Henan and Sichuan Province, and 0 in other provinces. The core explanatory variable is the interaction term of the policy dummy variable and time dummy variable. Its coefficient is the net effect of policy intervention. “Xit” is the additional control variable. Formula (2) is the difference-in-differences model considering the bidirectional fixed effect, “λt” is the time fixed effect, “ui” is the individual fixed effect, and “εit” is a random error term.
Under the basic research setting, there is a significant difference in energy intensity between the treatment group and the control group, which is difficult to meet the parallel trend hypothesis, and data processing is required by Propensity Score Matching (PSM) method. The pilot regions in China’s ECRT policy are not randomly selected but take into account the energy situation, energy regulations and economic development level of each province and city [53]. Therefore, five control variables with theoretical influence on energy intensity were taken as characteristic values to define sample similarity, and the logit model was used to calculate propensity matching score. Then the nearest neighbor matching method was adopted; that is, each individual in the treatment group was matched with the nearest individual in the control group. Finally, the unmatched samples were removed to reduce the difference between the treatment group and the control group.
3.2. Data
In terms of variable selection, the energy consumption intensity of explained variable in the model is expressed by energy consumption per unit GDP. Referring to existing studies [54,55,56], other factors that may influence energy intensity is controlled in this paper, including:
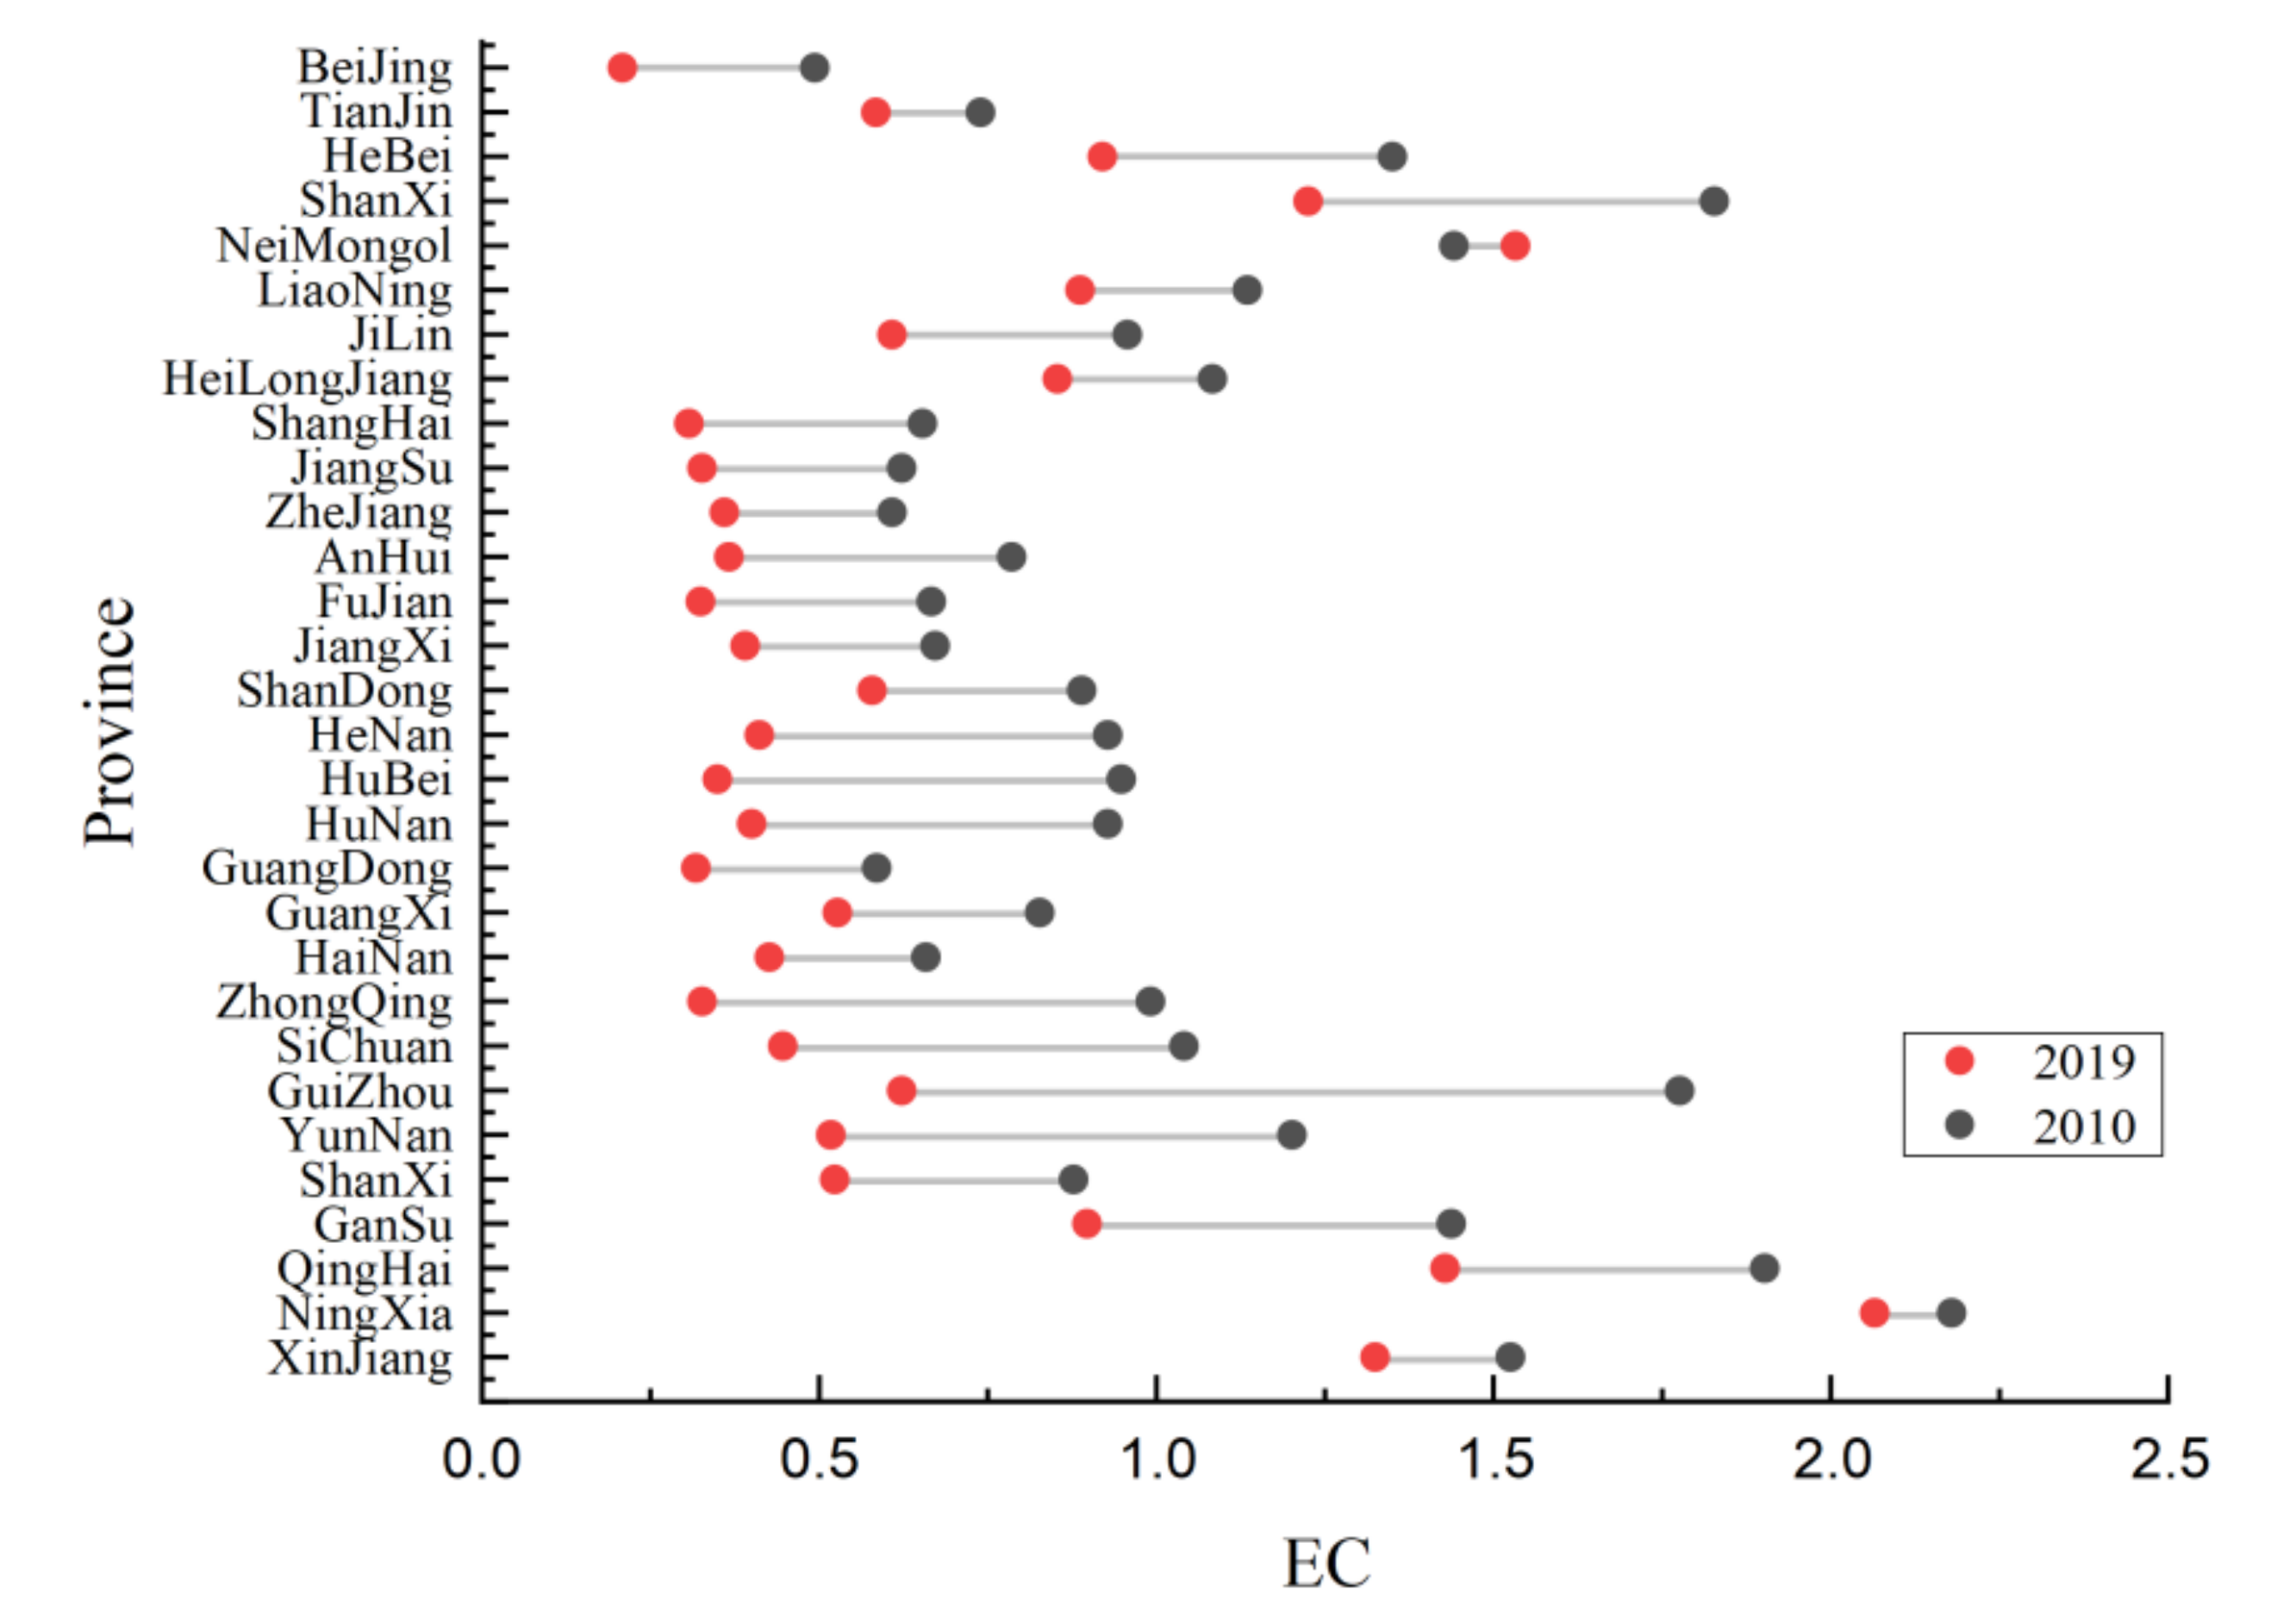
(1) Industrial structure: The demand for energy in the secondary industry is much higher than in other industries. It consumes 68% of China’s energy and generates only 38% of its economic output. Therefore, the higher the proportion of the secondary industry is, the higher the energy intensity is. (2) Energy structure: Different energy sources have different scaling coefficients, while the traditional fossil energy represented by coal consumes more after conversion, so the proportion of coal consumption is positively correlated with energy intensity. (3) Energy prices: Price is an important factor affecting consumption. The increase in energy price will restrain the energy demand of energy-consuming enterprises and thus reduce the total energy consumption and energy intensity of the region. (4) Energy regulation: The way to control energy consumption also includes other policy tools, such as green tax. Therefore, it is assumed that the intensity of China’s resource tax will also have a certain degree of impact on energy consumption. (5) Scientific research and development: Research and development investment is the main factor affecting technological innovation, and technological innovation will decrease the energy required for the production unit of the enterprise. The specific variable setting and descriptive statistics are shown in Table 2, and the measured value and the basic trend of the explained variable are shown in Figure 1.
Table 2.
Variable setting and descriptive statistics.
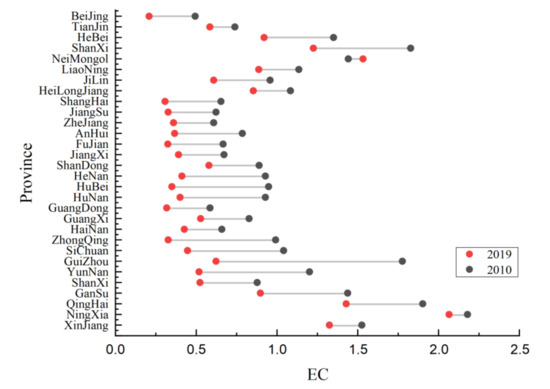
Figure 1.
Changes in energy consumption intensity.
In terms of data acquisition, this paper comprehensively considers the availability and integrity of data and selects panel data of 30 provincial administrative units in China from 2010 to 2019, excluding Tibet Autonomous Region, Hong Kong, Macao and Taiwan, to test the impact of ECRT policy on energy intensity. The main data sources include “China Statistical Yearbooks”, “China Energy Statistical Yearbooks”, “China Science and Technology Statistical Yearbooks” and local statistical yearbooks and statistical bulletin. Some missing data are supplemented by interpolation and extrapolation.
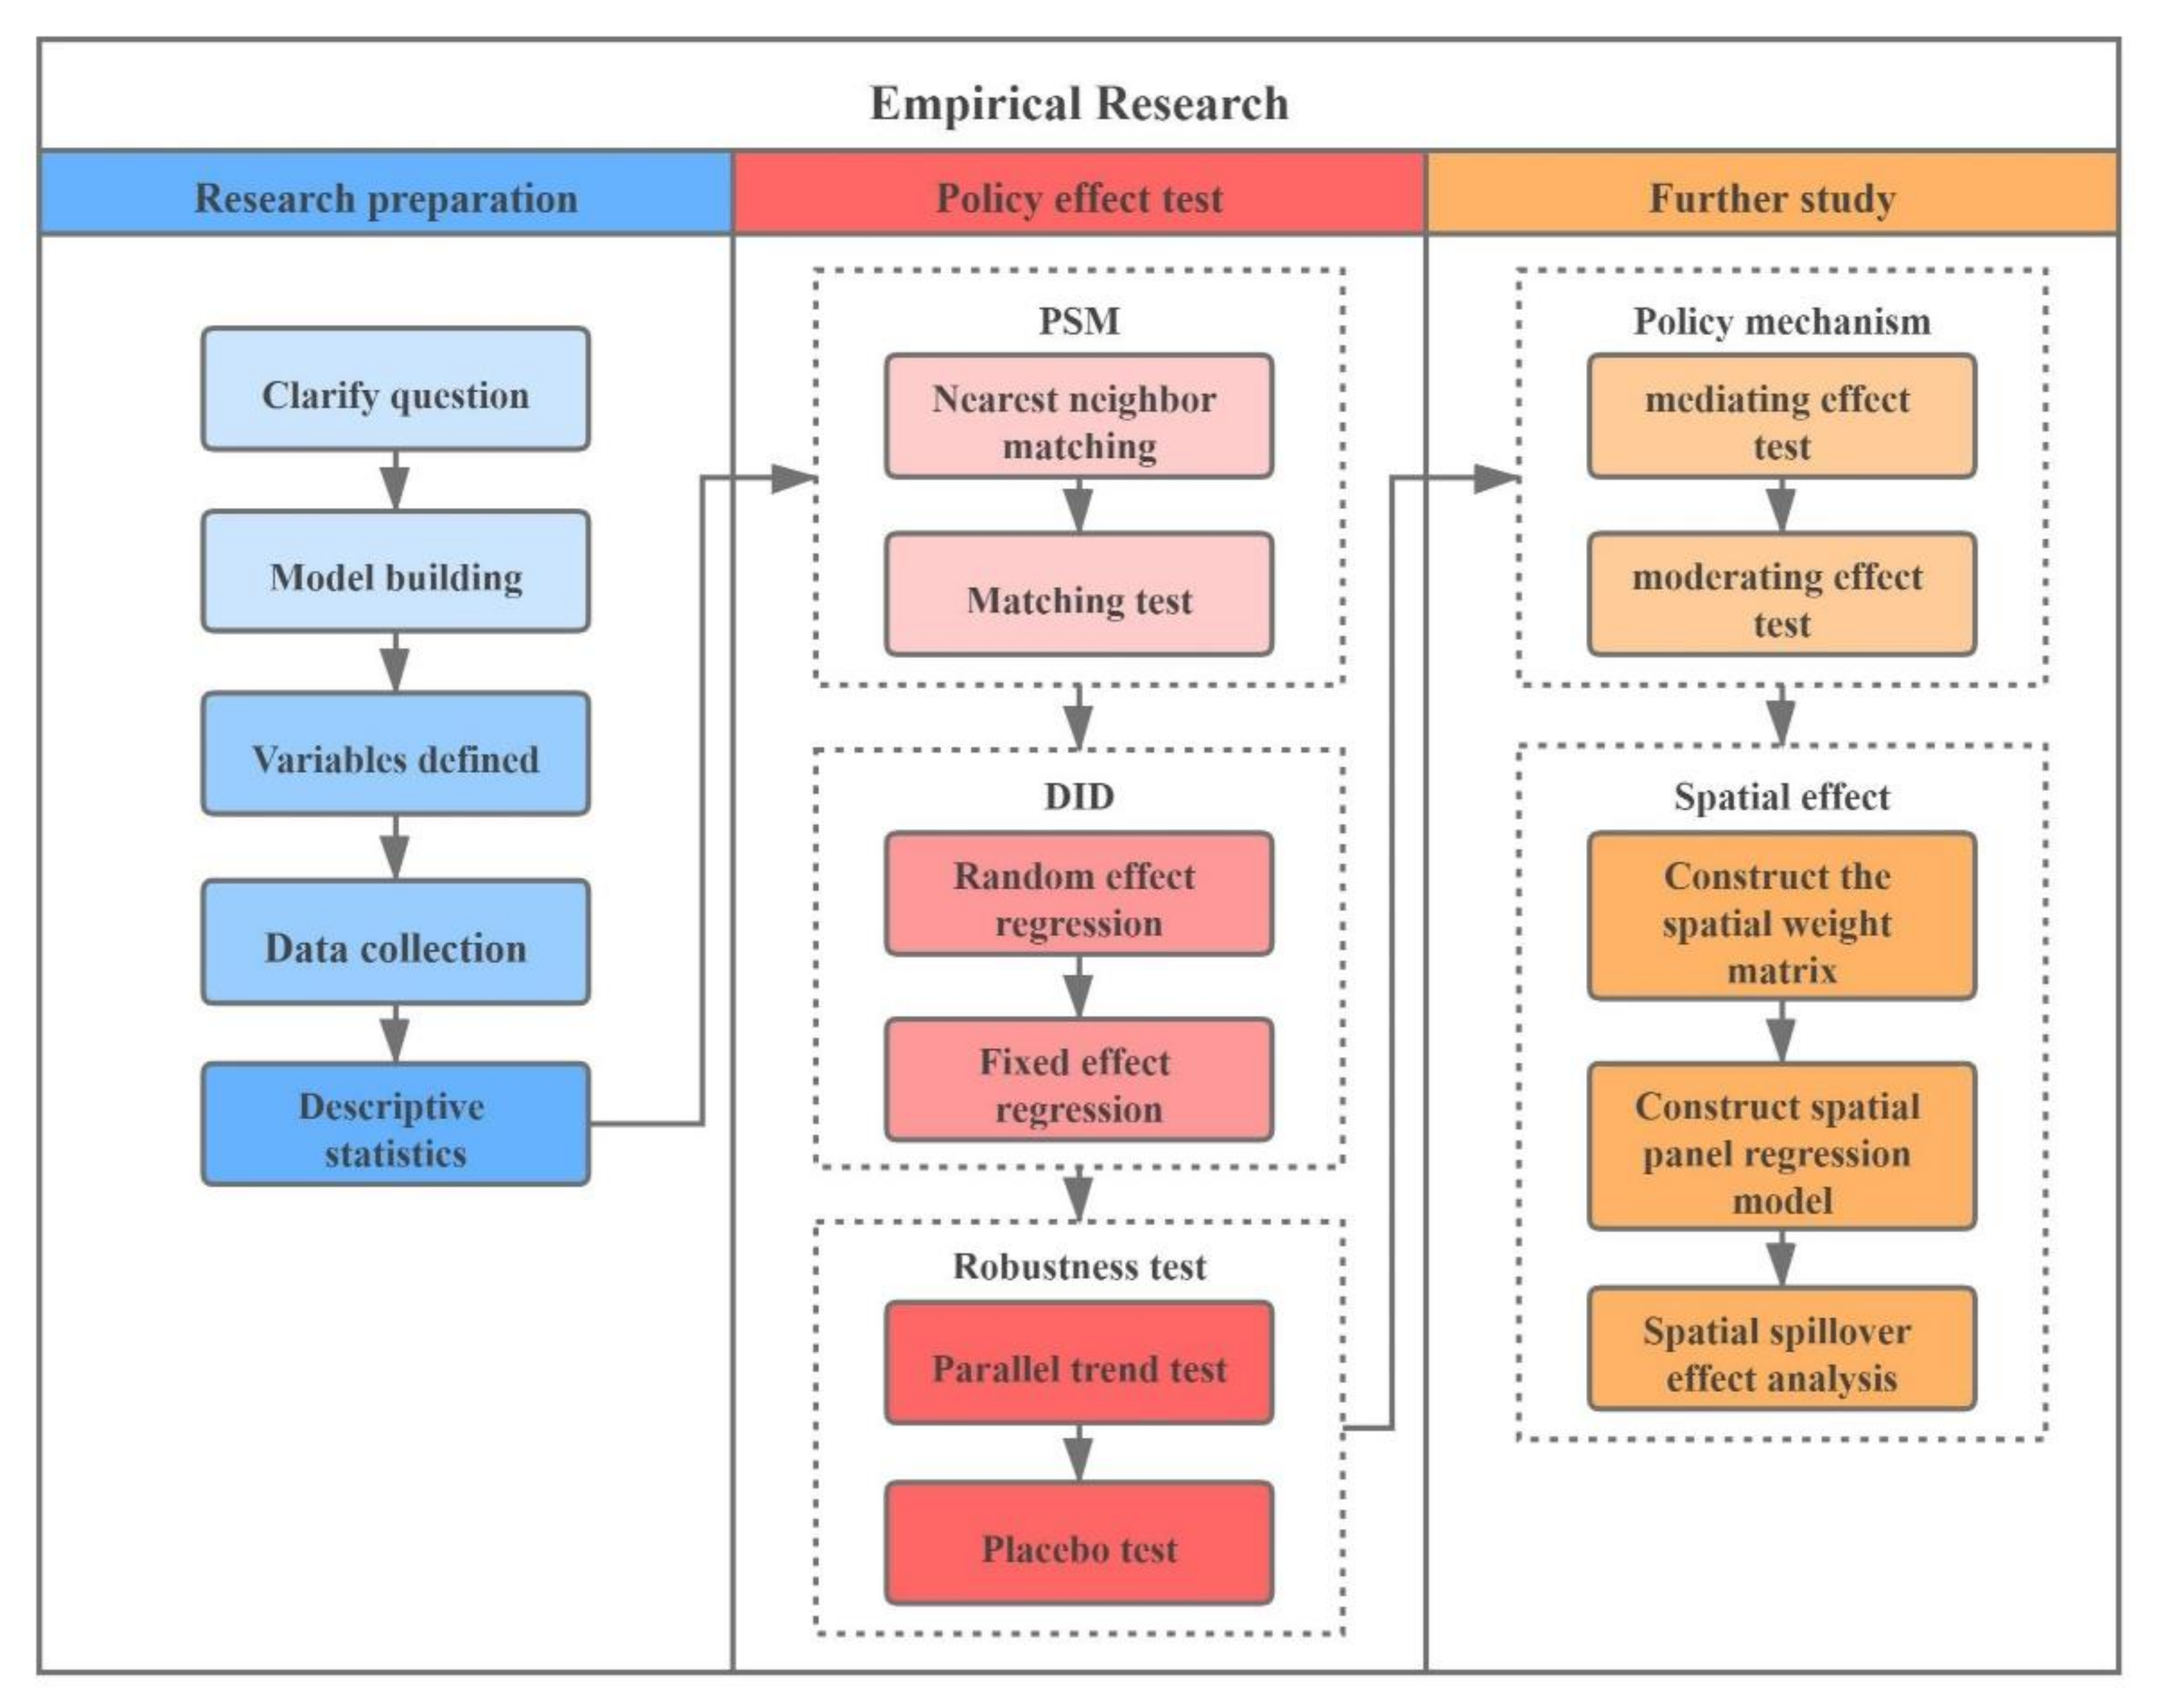
Based on the above model and data, we conducted an empirical analysis of the ECRT policy effect. Figure 2 is an experimental flow chart, which shows all the links and concrete practices of the empirical research part of this paper. In the next part, we first evaluated the results of Chinese ECRT policy in the pilot areas and then further studied the mechanism of action of policy and the well as the potential spatial effects.

Figure 2.
Empirical research flow chart.
4. Results
4.1. Regression
In order to overcome the selection bias caused by inter-sample heterogeneity and reduce the bias of the results of the DID regression, we first constructed the control group through the PSM method. Figure 3 shows the matching effect. After propensity score matching, there are more common support areas in the treatment group and control group, and the overall difference between control variables decreases and approaches 0. Only the standardization bias of energy price increased slightly, but the p-value of the mean t-test was 0.656, so the difference between groups of this variable was not significant after matching, and the matching was still valid. In addition, the kernel density curve of propensity score after matching is closer, indicating that the matching effect is good and can further perform the DID regression.
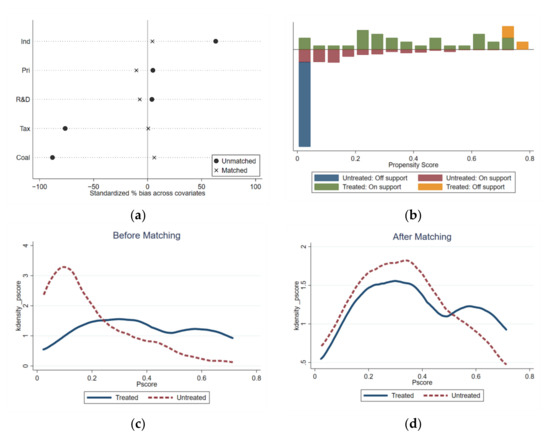
Figure 3.
(a) Covariate standardization bias test; (b) common support area; (c) nuclear density map of pre-treatment group and control group; (d) matched nuclear density map of post-treatment group and control group.
Table 3 shows the DID results. Models 1–4 represent the regression of baseline random effects, random effects with control variables, fixed individual effects and bidirectional fixed effects, respectively. The regression results show that DID coefficients of interaction terms are significantly negative under the four regression models. The regression results indicate that whether control variables are added or not, ECRT has a certain effect on energy consumption reduction, and the policy effect is around a 6.4–10.2% reduction of energy intensity. At the same time, the interaction coefficient in models 2–4 decreases slightly, but the R-square increases significantly, indicating that control variables have a certain influence on energy intensity. After considering the influence of these variables, the overall explanatory power of the model is improved, and the net effect of the ECRT policy is also revised.
Table 3.
Difference-in-differences regression.
In terms of control variables, the proportion of the secondary industry is positively correlated with energy intensity at the significance level of 1% after considering individual fixed effects. There is a strong positive correlation between the proportion of raw coal consumption and energy consumption intensity in all models. Energy price and energy intensity change in a reverse direction but are highly significant only in the random effect model. The reason may be that the price index can only reflect the relative changes within the region and does not support the horizontal comparison between regions. Therefore, the influence is no longer significant after controlling the time effect. Resource tax intensity and R&D investment intensity are both negatively correlated with energy consumption intensity, but the latter has a more significant effect. The empirical results show that the effects of other explanatory variables except for energy price on energy consumption intensity are consistent with the theoretical situation.
4.2. Robustness Test
First, a parallel trend test was performed. The parallel trend test is an important step of the DID method and a necessary condition to prove the robustness of the model. The connotation is that, prior to policy intervention, energy intensity change trends in the treatment and control groups should be as parallel as possible. In this paper, a parallel trend test was carried out by setting a time dummy variable. New time dummy variables were set, respectively: from 5 years before the policy intervention to 3 years after the intervention, multiply the new time dummy variable by “treated”, then it was incorporated into the DID regression model, and the regression results were plotted. According to Figure 4, there was no significant difference in energy intensity between the treatment group and the control group before the implementation of the ECRT policy, and the policy effect was significant year by year from the intervention year. Therefore, the parallel trend hypothesis holds, which proves the validity of the difference-in-differences result.
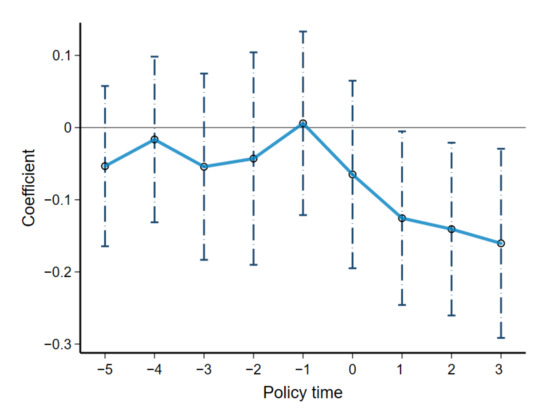
Figure 4.
Parallel trend test.
The placebo test was followed. The uniqueness of policy implementation is an essential assumption of the DID model; that is, it is necessary to prove that the policy is the main influencing factor. The placebo inspection core idea is a fictional treatment group or fictional policy time estimate; if the different fiction of the estimator of the regression results is still significant, it shows that the original estimate of the result is likely to see the errors. Changes in the explained variables are likely to be influenced by other policy changes or random factors. The methods of placebo tests are varied, mainly centering on the idea of “falsification”.
Therefore, the policy intervention points are unified 2 and 3 years in advance, and other variables remain unchanged, two-way fixed effect regression is conducted again, and the final results are shown in Table 4. Model 1 and Model 2 are the regression results of taking the starting year of ECRT as 2013 and 2014, respectively. It can be seen that the fictitious policy intervention coefficients are not significant, while the influence of control variables is basically consistent with the regression results in Table 2. This result further proves that under the setting of this model, the sudden drop in energy intensity after 2016 is indeed due to the establishment of the ECRT system rather than other policies, so DID results are robust.
Table 4.
Placebo test.
4.3. Mechanism Analysis
Through the above analysis, we can think that ECRT policy indeed has obtained an excellent effect. However, how the policy will reduce energy consumption remains to be clarified. Thus, we explored the mechanism of action by referring to the existing research methods, establishing the regression model as Formulas (3) and (4) [57,58]. Where, Mit represents the potential intermediary variable of ECRT affecting energy intensity and is a column vector in Model (1) Xit. Therefore, α1 in Formula (3) represents the influence effect of policy intervention on the intermediary variable. β1 in Formula (4) is the interaction term between policy implementation and intermediary variables, and the action mechanism of ECRT policy is determined through the final result of this coefficient.
First, the changes in the mediation variables were investigated. The regression results of Equation (3) are shown in Table 5. Models 1–5 are the difference-in-differences regression of five potential mediation variables, respectively. The results show that the proportion of the secondary industry in the pilot area decreases by 2.9% and is significant at the level of 5%, indicating that the ECRT has a certain function of optimizing the industrial structure. The policy can increase the energy consumption constraint on the consumption side to promote the overall supply-side reform of the society and adjust the economic structure. At the same time, the energy price increased by 5.4%, and the proportion of R&D investment in economic output increased by 0.179%. In fact, there is a certain connection between the two changes. The rise of energy prices increases the operating costs of industrial enterprises, thus strengthening their motivation for technological innovation [59]. However, in the baseline regression, we find that energy price has a positive impact on energy intensity. Therefore, even if the ECRT policy can promote energy price increase, it cannot reduce energy consumption through this path. In addition, even if the policy stipulates that renewable energy is not included in the comprehensive energy consumption in the market transaction process, ECRT does not significantly weaken the dominant position of coal in energy consumption. This suggests to some extent that even though ECRT has a good effect in reducing energy consumption, it has not directly promoted the development of the renewable energy industry.
Table 5.
ECRT policy mechanism test 1.
Secondly, the mechanism of action was analyzed by setting the interaction terms of the policy effect variable and each control variable. The results in Table 6 show that the first, the interaction coefficient of the variable “DID × Ind” and variable “DID × Coal” are both significantly negative at 1% level, and the original impact of the two variables on energy intensity is positive. This suggests that ECRT will work better as regions reduce their share of secondary industries and reduce fossil energy consumption. The main reason is that the premise of ECRT is that the government controls the total amount of regional energy use, and the trading index has a fixed upper limit. However, the regions highly dependent on industrial production and fossil energy have significant obstacles in reducing the total amount of energy consumption, so the energy use right is too “scarce”, and the trading process is difficult to smooth. Second, variables “DID × Pri” and “DID × Tax” are both significantly negative at the 1% level. The two variables originally have a negative effect on energy intensity, so the energy-saving effect of the ECRT system will play a good interaction with the increase in energy price and the strict resource tax. This result reflects the response mechanism of energy intensity to market-oriented policy tools and highlights the policy synergy of different types of energy regulations [60]. Third, there is a significant interaction between R&D investment and ECRT. In the case of a high level of scientific and technological R&D, energy regulation can promote technological innovation more effectively and directly contribute to a better energy-saving effect.
Table 6.
ECRT policy mechanism test 2.
Based on the regression results in Table 3, Table 5 and Table 6, it can be concluded that industrial structure, scientific and technological research and development are the main influencing mechanisms of ECRT policy on energy intensity, constituting a mediating effect. Although the energy structure and resource tax have no significant change with the implementation of ECRT, they can also interact with the ECRT to affect energy intensity, so they have a certain moderating effect on the policy effect.
4.4. Spatial Effect
According to the above research and analysis, the policy of ECRT achieved good results in the pilot provinces. In the context of this policy, whether the pilot provinces can affect the non-pilot areas and then achieve consumption reduction together still needs to be considered. Therefore, drawing on the existing research method, this paper constructed a Spatial Difference-in-Differences (SDID) model to estimate the spatial spillover effects of ECRT policy establishment [61,62].
In Formula (5), ρ represents the spatial autocorrelation coefficient, the significance of which determines whether there is a spatial correlation between the energy intensity of each province. β1 and β2 represent the direct and indirect effects (spatial effects) of the ECRT policy, respectively. W is the spatial weight matrix. In this paper, the geographical distance weight matrix is constructed by calculating the reciprocal of the distance between provinces based on the longitude and latitude data, and the economic distance weight matrix is constructed by calculating the reciprocal of the difference of per capita GDP between provinces. The two matrices are used to carry out SDID regression, respectively, and the results are shown in Table 7. Model 1 and model 2 used the geographic distance matrix and economic distance matrix, respectively, for regression analysis.
Table 7.
Spatial effects of ECRT policy.
According to the last two columns in Table 7, the spatial autocorrelation coefficient ρ is significant at the level of 1% for both of the two matrices. Therefore, there is a spatial correlation of energy intensity between regions. In Table 7, the first and two columns are the direct effects of the ECRT policy, namely the impact of policy intervention on the energy consumption intensity in the pilot areas. The results showed that, after taking into account spatial associations, the effect of ECRT policy is slightly increased, reducing energy intensity by about 13.3% to 15.6% in pilot areas. At the same time, the third and fourth columns are the indirect effect of the ECRT policy, which represents the impact of the policy intervention on the energy consumption intensity in non-pilot areas. Obviously, the spatial spillover effect of the policy is 5.3% in the geographical distance matrix and 12% in the economic distance matrix, and all the results are significant at the significance level of 1%, which means that ECRT can indeed reduce the energy intensity of surrounding areas and areas with a high degree of economic association with the policy pilot. Therefore, it is considered that the policy has certain positive external benefits, which further confirm the feasibility of promoting the policy in more regions.
5. Conclusions and Policy Recommendations
5.1. Conclusions
In the face of the global climate issue, every country should shoulder its due responsibilities. In recent years, China has been trying to accelerate the realization of carbon peaks in a variety of ways, and the ECRT policy with “Chinese characteristics” is a new attempt to achieve this goal. At present, it is in the pilot effect evaluation stage of this policy. In order to identify the impact of ECRT policy on energy intensity, this paper conducted an empirical study. Using the PSM-DID method and based on the 2010–2018 provincial panel data, we examined the impact of ECRT on regional energy intensity and analyzed the potential mechanism and spatial effect. The results show that: (1) The ECRT system can effectively reduce the regional energy intensity, and the effect coefficient is about 6.4% to 10.2% under the baseline regression. The robustness of the results was demonstrated by a placebo test at the change in policy time points. (2) Industrial structure and R&D are the main influencing mechanisms of ECRT policy on energy intensity, which constitutes the mediating role. Although the energy structure and resource taxation did not change significantly with the implementation of energy-full trading, they had a moderating effect on the policy effect. (3) After considering the spatial correlation, the direct effect of ECRT policy is improved, which is a 13.3%–15.6% reduction in energy consumption. At the same time, the ECRT has a significant spatial spillover effect. The implementation of the policy can reduce the energy intensity of the adjacent areas of the pilot by 5.3% and the energy intensity of the areas with high economic association with the pilot by 12%.
5.2. Policy Recommendations
Based on the above empirical results, the following suggestions are put forward:
- (1)
- The ECRT system should be gradually established and improved in more provinces and regions. The excellent policy effects and positive externalities obtained in the ECRT pilot project determine the feasibility of promoting the policy to the whole country. Further establish the important position of market-based policy tools in resource and environmental governance [63]. In the future, the Chinese government should adhere to the market-oriented reform in the field of energy governance, stimulate the vitality of the ECRT market and improve the ECRT system by strengthening the connection between regional markets [64];
- (2)
- The implementation of this policy should be supplemented with relevant supporting policies to promote the upgrading of regional industrial structure and accelerate the transformation of energy structure so that the ECRT policy can play a more positive role. For example, industrial enterprises should be encouraged to use renewable energy, energy conservation and environmental protection industries should be developed, and more job opportunities should be created to accelerate the transition of the regional economy to tertiary industry [65];
- (3)
- Timely market regulation to promote energy users to achieve energy conservation and consumption reduction through the form of scientific and technological innovation. Reasonable allocation of initial amount and effective adjustment of warrant price are particularly important in playing an incentive role. The costs for users to participate in transactions should be reduced, and enterprises should be encouraged to make innovations in energy conservation.
Author Contributions
Conceptualization, Z.W. and S.L.; methodology, Z.W. and M.W.; data curation, M.W.; project administration, Z.W., S.L. and C.W.; writing—original draft preparation, M.W.; writing—review and editing, Z.W., S.L. and C.W. All authors have read and agreed to the published version of the manuscript.
Funding
This research was funded by the National Social Science Foundation of China “Research on New Energy Development and Poverty Alleviation Policies in Poor Areas from the Perspective of Environmental Effects” (16BJY049); National Social Science Foundation of China “Risk transmission and Regulation Optimization of Mining Right Reestablishment in Resource-rich Areas of China” (13CGL116); Hubei Province Major Research Project Fund project “Hubei Province to build a ‘Joint efforts to protect the Yangtze River’ system and mechanism” (LX201839); The Construction project of Graduate Joint Training Practice Base of China University of Geosciences (Wuhan) (YJC2021543, YJC2021544)’ Ministry of Education of China “Theoretical Research of New Liberal Arts and Application of Artificial Intelligence Technology” (2020ITA05001).
Institutional Review Board Statement
Not applicable.
Informed Consent Statement
Not applicable.
Data Availability Statement
The data used in this study can be obtained by contacting the corresponding author.
Conflicts of Interest
The authors declare no conflict of interest.
References
- Hotelling, H. The economics of exhaustible resources (reprinted from journal of political-economy, vol 39, PG 137-175, 1931). Bull. Math. Biol. 1991, 53, 281–312. [Google Scholar] [CrossRef]
- Barreto, R.A. Fossil fuels, alternative energy and economic growth. Econ. Model. 2018, 75, 196–220. [Google Scholar] [CrossRef] [Green Version]
- Intergovernmental Panel on Climate Change (IPCC). Climate Change 2021: The Physical Science Basis. In Contribution of Working Group I to the Sixth Assessment Report of the Intergovernmental Panel on Climate Change; Masson-Delmotte, V., Zhai, A.P., Pirani, S.L., Connors, C., Péan, S., Berger, N., Eds.; Cambridge University Press: Cambridge, UK, 2021. [Google Scholar]
- Martins, F.; Felgueiras, C.; Smitková, M. Fossil fuel energy consumption in European countries. Energy Procedia 2018, 153, 107–111. [Google Scholar] [CrossRef]
- Lott, M.C.; Pye, S.; Dodds, P.E. Quantifying the co-impacts of energy sector decarbonisation on outdoor air pollution in the United Kingdom. Energ Policy 2017, 101, 42–51. [Google Scholar] [CrossRef] [Green Version]
- BP. Statistical Review of World Energy. 2021. Available online: https://www.bp.com/en/global/corporate/energy-economics/statistical-review-of-world-energy.html (accessed on 10 October 2021).
- National Bureau Of Statistics. China Statistical Yearbook 2011–2020. 2020. Available online: http://www.stats.gov.cn/tjsj/ndsj (accessed on 6 September 2021).
- Project Comprehensive Report Writing Group. A comprehensive report on China’s Long-term Low-carbon Development Strategy and Transformation Path. China Popul. Resour. Environ. 2020, 30, 1–25. [Google Scholar]
- The 14th five-year Plan for National Economic and Social Development of the people’s Republic of China and the outline of the long-term objectives for 2035. People’s Dly. 2021, 1, 3–13.
- NDAR. Pilot Scheme for Paid Use and Trading of Energy-Consuming Right. 2016. Available online: http://www.gov.cn/xinwen/2016-09/21/content_5110262.htm (accessed on 13 July 2021).
- Guerra-Santin, O.; Itard, L. The effect of energy performance regulations on energy consumption. Energy Effic. 2012, 5, 269–282. [Google Scholar] [CrossRef] [Green Version]
- Gayer, T.; Viscusi, W.K. Overriding consumer preferences with energy regulations. J. Regul. Econ. 2013, 43, 248–264. [Google Scholar] [CrossRef]
- Lee, C.; Huh, S. Forecasting the diffusion of renewable electricity considering the impact of policy and oil prices: The case of South Korea. Appl. Energy 2017, 197, 29–39. [Google Scholar] [CrossRef]
- Perez-Arriaga, I.J.; Linares, P. Markets vs. Regulation: A Role for Indicative Energy Planning. Energy J. 2008, 29, 149–164. [Google Scholar] [CrossRef] [Green Version]
- Rodilla, P.; Garcia-Gonzalez, J.; Baillo, A.; Cerisola, S.; Batlle, C. Hydro resource management, risk aversion and equilibrium in an incomplete electricity market setting. Energy Econ. 2015, 51, 365–382. [Google Scholar] [CrossRef]
- Porter, M.E.; Linde, C.V.D. Toward a New Conception of the Environment-Competitiveness Relationship. J. Econ. Perspect. 1995, 9, 97–118. [Google Scholar] [CrossRef]
- Sun, Z.; Qu, W. Direct and Indirect Effects of Environmental Regulation on Energy Consumption. Mod. Financ. Econ. J. Tianjin Univ. Financ. Econ. 2019, 39, 41–51. [Google Scholar]
- Costantini, V.; Crespi, F. Environmental regulation and the export dynamics of energy technologies. Ecol. Econ. 2008, 66, 447–460. [Google Scholar] [CrossRef] [Green Version]
- Ajayi, V.; Reiner, D. European Industrial Energy Intensity: Innovation, Environmental Regulation, and Price Effects. Energy J. 2020, 41, 105–128. [Google Scholar] [CrossRef]
- Zhang, Y.; Xiong, Y.; Li, F.; Cheng, J.; Yue, X. Environmental regulation, capital output and energy efficiency in China: An empirical research based on integrated energy prices. Energy Policy 2020, 146, 111826. [Google Scholar] [CrossRef]
- Ai, H.; Hu, Y.; Li, K. Impacts of environmental regulation on firm productivity: Evidence from China’s Top 1000 Energy-Consuming Enterprises Program. Appl. Econ. 2021, 53, 830–844. [Google Scholar] [CrossRef]
- Dong, H.; Xin, J.; Han, Y. Interactive Effect of Environmental Regulation, Technological Innovation, and Industrial Coal Consumption Intensity. East China Econ. Manag. 2021, 35, 37–45. [Google Scholar]
- Li, Y.; Xu, X.; Zheng, Y. An Empirical Study of Environmental Regulation Impact on China’s Industrial Total Factor Energy Efficiency: Based on the Data of 30 Provinces from 2003 to 2016. Manag. Rev. 2019, 31, 40–48. [Google Scholar]
- Zhou, H.; Qu, S.; Wu, Z.; Ji, Y. A study of environmental regulation, technological innovation, and energy consumption in China based on spatial econometric models and panel threshold models. Environ. Sci. Pollut. R. 2020, 27, 37894–37910. [Google Scholar] [CrossRef] [PubMed]
- Xie, L.; Li, Z.; Ye, X.; Jiang, Y. Environmental regulation and energy investment structure: Empirical evidence from China’s power industry. Technol. Forecast. Soc. 2021, 167, 120690. [Google Scholar] [CrossRef]
- Jiang, L.; Folmer, H.; Ji, M.; Zhou, P. Revisiting cross-province energy intensity convergence in China: A spatial panel analysis. Energy Policy 2018, 121, 252–263. [Google Scholar] [CrossRef]
- Zhao, Y.; Kong, G.; Chong, C.H.; Ma, L.; Li, Z.; Ni, W. How to Effectively Control Energy Consumption Growth in China’s 29 Provinces: A Paradigm of Multi-Regional Analysis Based on EAALMDI Method. Sustainability 2021, 13, 1093. [Google Scholar] [CrossRef]
- Matsumura, T.; Yamagishi, A. Long-run welfare effect of energy conservation regulation. Econ. Lett. 2017, 154, 64–68. [Google Scholar] [CrossRef] [Green Version]
- Richter, P.M.; Mendelevitch, R.; Jotzo, F. Coal taxes as supply-side climate policy: A rationale for major exporters? Clim. Chang. 2018, 150, 43–56. [Google Scholar] [CrossRef]
- Jenn, A.; Springel, K.; Gopal, A.R. Effectiveness of electric vehicle incentives in the United States. Energy Policy 2018, 119, 349–356. [Google Scholar] [CrossRef]
- Jevnaker, T.; Wettestad, J. Ratcheting Up Carbon Trade: The Politics of Reforming EU Emissions Trading. Glob. Environ. Politics 2017, 17, 105–124. [Google Scholar] [CrossRef] [Green Version]
- Bertoldi, P.; Mosconi, R. Do energy efficiency policies save energy? A new approach based on energy policy indicators (in the EU Member States). Energy Policy 2020, 139, 111320. [Google Scholar] [CrossRef]
- Malinauskaite, J.; Jouhara, H.; Ahmad, L.; Milani, M.; Montorsi, L.; Venturelli, M. Energy efficiency in industry: EU and national policies in Italy and the UK. Energy 2019, 172, 255–269. [Google Scholar] [CrossRef]
- Metcalf, G.E. The distributional impacts of U.S. energy policy. Energy Policy 2019, 129, 926–929. [Google Scholar] [CrossRef]
- Barbose, G.; Wiser, R.; Heeter, J.; Mai, T.; Bird, L.; Bolinger, M.; Carpenter, A.; Heath, G.; Keyser, D.; Macknick, J.; et al. A retrospective analysis of benefits and impacts of US renewable portfolio standards. Energy Policy 2016, 96, 645–660. [Google Scholar] [CrossRef] [Green Version]
- Kucharski, J.B.; Unesaki, H. An institutional analysis of the Japanese energy transition. Environ. Innov. Soc. Transit. 2018, 29, 126–143. [Google Scholar] [CrossRef]
- Kanada, M.; Fujita, T.; Fujii, M.; Ohnishi, S. The long-term impacts of air pollution control policy: Historical links between municipal actions and industrial energy efficiency in Kawasaki City, Japan. J. Clean. Prod. 2013, 58, 92–101. [Google Scholar] [CrossRef]
- Geller, H.; Schaeffer, R.; Szklo, A.; Tolmasquim, M. Policies for advancing energy efficiency and renewable energy use in Brazil. Energy Policy 2004, 32, 1437–1450. [Google Scholar] [CrossRef]
- Aquila, G.; Pamplona, E.D.O.; de Queiroz, A.R.; Rotela Junior, P.; Fonseca, M.N. An overview of incentive policies for the expansion of renewable energy generation in electricity power systems and the Brazilian experience. Renew. Sustain. Energy Rev. 2017, 70, 1090–1098. [Google Scholar] [CrossRef]
- Lin, B.; Du, Z. Promoting energy conservation in China’s metallurgy industry. Energy Policy 2017, 104, 285–294. [Google Scholar] [CrossRef]
- Pan, J. Construction, challenges and market expansion of emissions trading system. China Popul. Resour. Environ. 2016, 26, 1–5. [Google Scholar]
- Li, H.; Xu, M.; Zhang, Q. Review of energy policies in the 40 years of reform and opening in China: From structure to logic. China Popul. Resour. Environ. 2019, 29, 167–176. [Google Scholar]
- Muhammed, G.; Tekbiyik-Ersoy, N. Development of Renewable Energy in China, USA, and Brazil: A Comparative Study on Renewable Energy Policies. Sustainability 2020, 12, 9136. [Google Scholar] [CrossRef]
- Stavins, R.N. Experience with Market-Based Environmental Policy Instruments. Handb. Environ. Econ. 2003, 1, 356–435. [Google Scholar]
- Wurzel, R.; Jordan, A.; Zito, A.R.; Bruckner, L. From high regulatory state to social and ecological market economy? ’New’ environmental policy instruments in Germany. Environ. Politics 2003, 12, 115. [Google Scholar] [CrossRef]
- Schaffrin, A.; Sewerin, S.; Seubert, S. Toward a Comparative Measure of Climate Policy Output. Policy Stud J 2015, 43, 257–282. [Google Scholar] [CrossRef]
- Liu, M. China’s energy-consuming right trading scheme: From the dimension of institutional linkage. China Popul. Resour. Environ. 2017, 27, 217–224. [Google Scholar]
- Dewees, D.N. Emissions trading: ERCs or allowances? Land Econ. 2001, 77, 513–526. [Google Scholar] [CrossRef] [Green Version]
- Wang, B.; Lai, P.; Du, M. Whether the energy-consuming right transaction system can achieve the dual control of both energy consumption and intensity? China Popul. Resour. Environ. 2019, 29, 107–117. [Google Scholar]
- Zhang, N.; Zhang, W. Can Energy Quota Trading Achieve Win-Win Development for Economic Growth and Energy Savings in China? Econ. Res. J. 2019, 54, 165–181. [Google Scholar]
- Shen, L.; Chen, S. The Use-Energy-Right Transaction System and Green Innovation: Evidence from Chinese Industrial Enterprises. J. Technol. Econ. 2020, 39, 1–8. [Google Scholar]
- Yang, M.; Hou, Y.; Fang, C.; Duan, H. Constructing energy-consuming right trading system for China’s manufacturing industry in 2025. Energy Policy 2020, 144, 111602. [Google Scholar] [CrossRef]
- Wang, H.; Chen, Z.; Wu, X.; Niea, X. Can a carbon trading system promote the transformation of a low-carbon economy under the framework of the porter hypothesis? -Empirical analysis based on the PSM-DID method. Energy Policy 2019, 129, 930–938. [Google Scholar] [CrossRef]
- Li, G.; Liu, J.; Wang, X. Research on Influencing Factors of Complete Energy Intensity of Manufacturing Industry based on Input-Output Methodology and SVAR Model. Chin. J. Manag. Sci. 2018, 26, 99–112. [Google Scholar]
- Yue, Y.; Tian, L.; Yue, Q.; Wang, Z. Spatiotemporal Variations in Energy Consumption and Their Influencing Factors in China Based on the Integration of the DMSP-OLS and NPP-VIIRS Nighttime Light Datasets. Remote Sens. 2020, 12, 1151. [Google Scholar] [CrossRef] [Green Version]
- Adetutu, M.O.; Odusanya, K.A.; Weyman-Jones, T.G. Carbon Tax and Energy Intensity: Assessing the Channels of Impact using UK Microdata. Energy J. 2020, 41, 143–166. [Google Scholar] [CrossRef] [Green Version]
- Song, H.; Sun, Y.; Chen, D. Assessment for the Effect of Government Air Pollution Control Policy: Empirical Evidence from”Low-carbon City”Construction in China. Manag. World 2019, 35, 95–108. [Google Scholar]
- Luo, Z.; Li, H. The Impact of ”Atmosphere Ten Articles” Policy on Air Quality in China. China Ind. Econ. 2018, 9, 136–154. [Google Scholar]
- Kong, D.; Yang, X.; Xu, J. Energy price and cost induced innovation: Evidence from China. Energy 2020, 192, 116586. [Google Scholar] [CrossRef]
- Chen, Z. Institutional coordination and application of energy consumption taxation for environmental considerations and energy-consuming right trading system. Resour. Sci. 2019, 41, 2205–2215. [Google Scholar] [CrossRef]
- Li, L.; Zheng, Y.; Zheng, S.; Ke, H. The new smart city programme: Evaluating the effect of the internet of energy on air quality in China. Sci. Total Environ. 2020, 714, 136380. [Google Scholar] [CrossRef] [PubMed]
- Heckert, M.; Mennis, J. The economic impact of greening urban vacant land: A spatial difference-in-differences analysis. Environ. Plan. Econ. Space 2012, 44, 3010–3027. [Google Scholar] [CrossRef]
- Berndt, C. Ruling markets: The marketization of social and economic policy. Environ. Plan. A 2015, 47, 1866–1872. [Google Scholar] [CrossRef]
- Li, X.; Ma, J.; Chen, Z.; Zheng, H. Linkage Analysis among China’s Seven Emissions Trading Scheme Pilots. Sustainability 2018, 10, 3389. [Google Scholar] [CrossRef] [Green Version]
- Gielen, D.; Boshell, F.; Saygin, D.; Bazilian, M.D.; Wagner, N.; Gorini, R. The role of renewable energy in the global energy transformation. Energy Strategy Rev. 2019, 24, 38–50. [Google Scholar] [CrossRef]


Publisher’s Note: MDPI stays neutral with regard to jurisdictional claims in published maps and institutional affiliations. |
© 2021 by the authors. Licensee MDPI, Basel, Switzerland. This article is an open access article distributed under the terms and conditions of the Creative Commons Attribution (CC BY) license (https://creativecommons.org/licenses/by/4.0/).