1. Introduction
There are abundant wind resources on the earth, and offshore wind power generation is now a hot topic. At present, offshore wind turbines are divided into two categories according to the installation position and structural characteristics of their rotating shafts: Horizontal Axis offshore wind turbine (HAWT) and Vertical Axis offshore wind turbine (VAWT). The horizontal axis offshore wind turbine is named because the axis of rotation is parallel to the sea level, which is the horizontal direction. Because horizontal axis offshore wind turbines have high power and more comprehensive technology, scholars have done more research on horizontal axis offshore wind turbines before, and they are currently the mainstream models used in wind farms [
1,
2]. Actually, large wind turbines, or larger clusters of wind turbines in wind farms, impose a greater socio-economic cost on lower value properties [
3]. Wind power hydrogen production converts the electricity generated by wind power directly into hydrogen through water electrolysis hydrogen production equipment, and produces hydrogen that is convenient for long-term storage through water electrolysis [
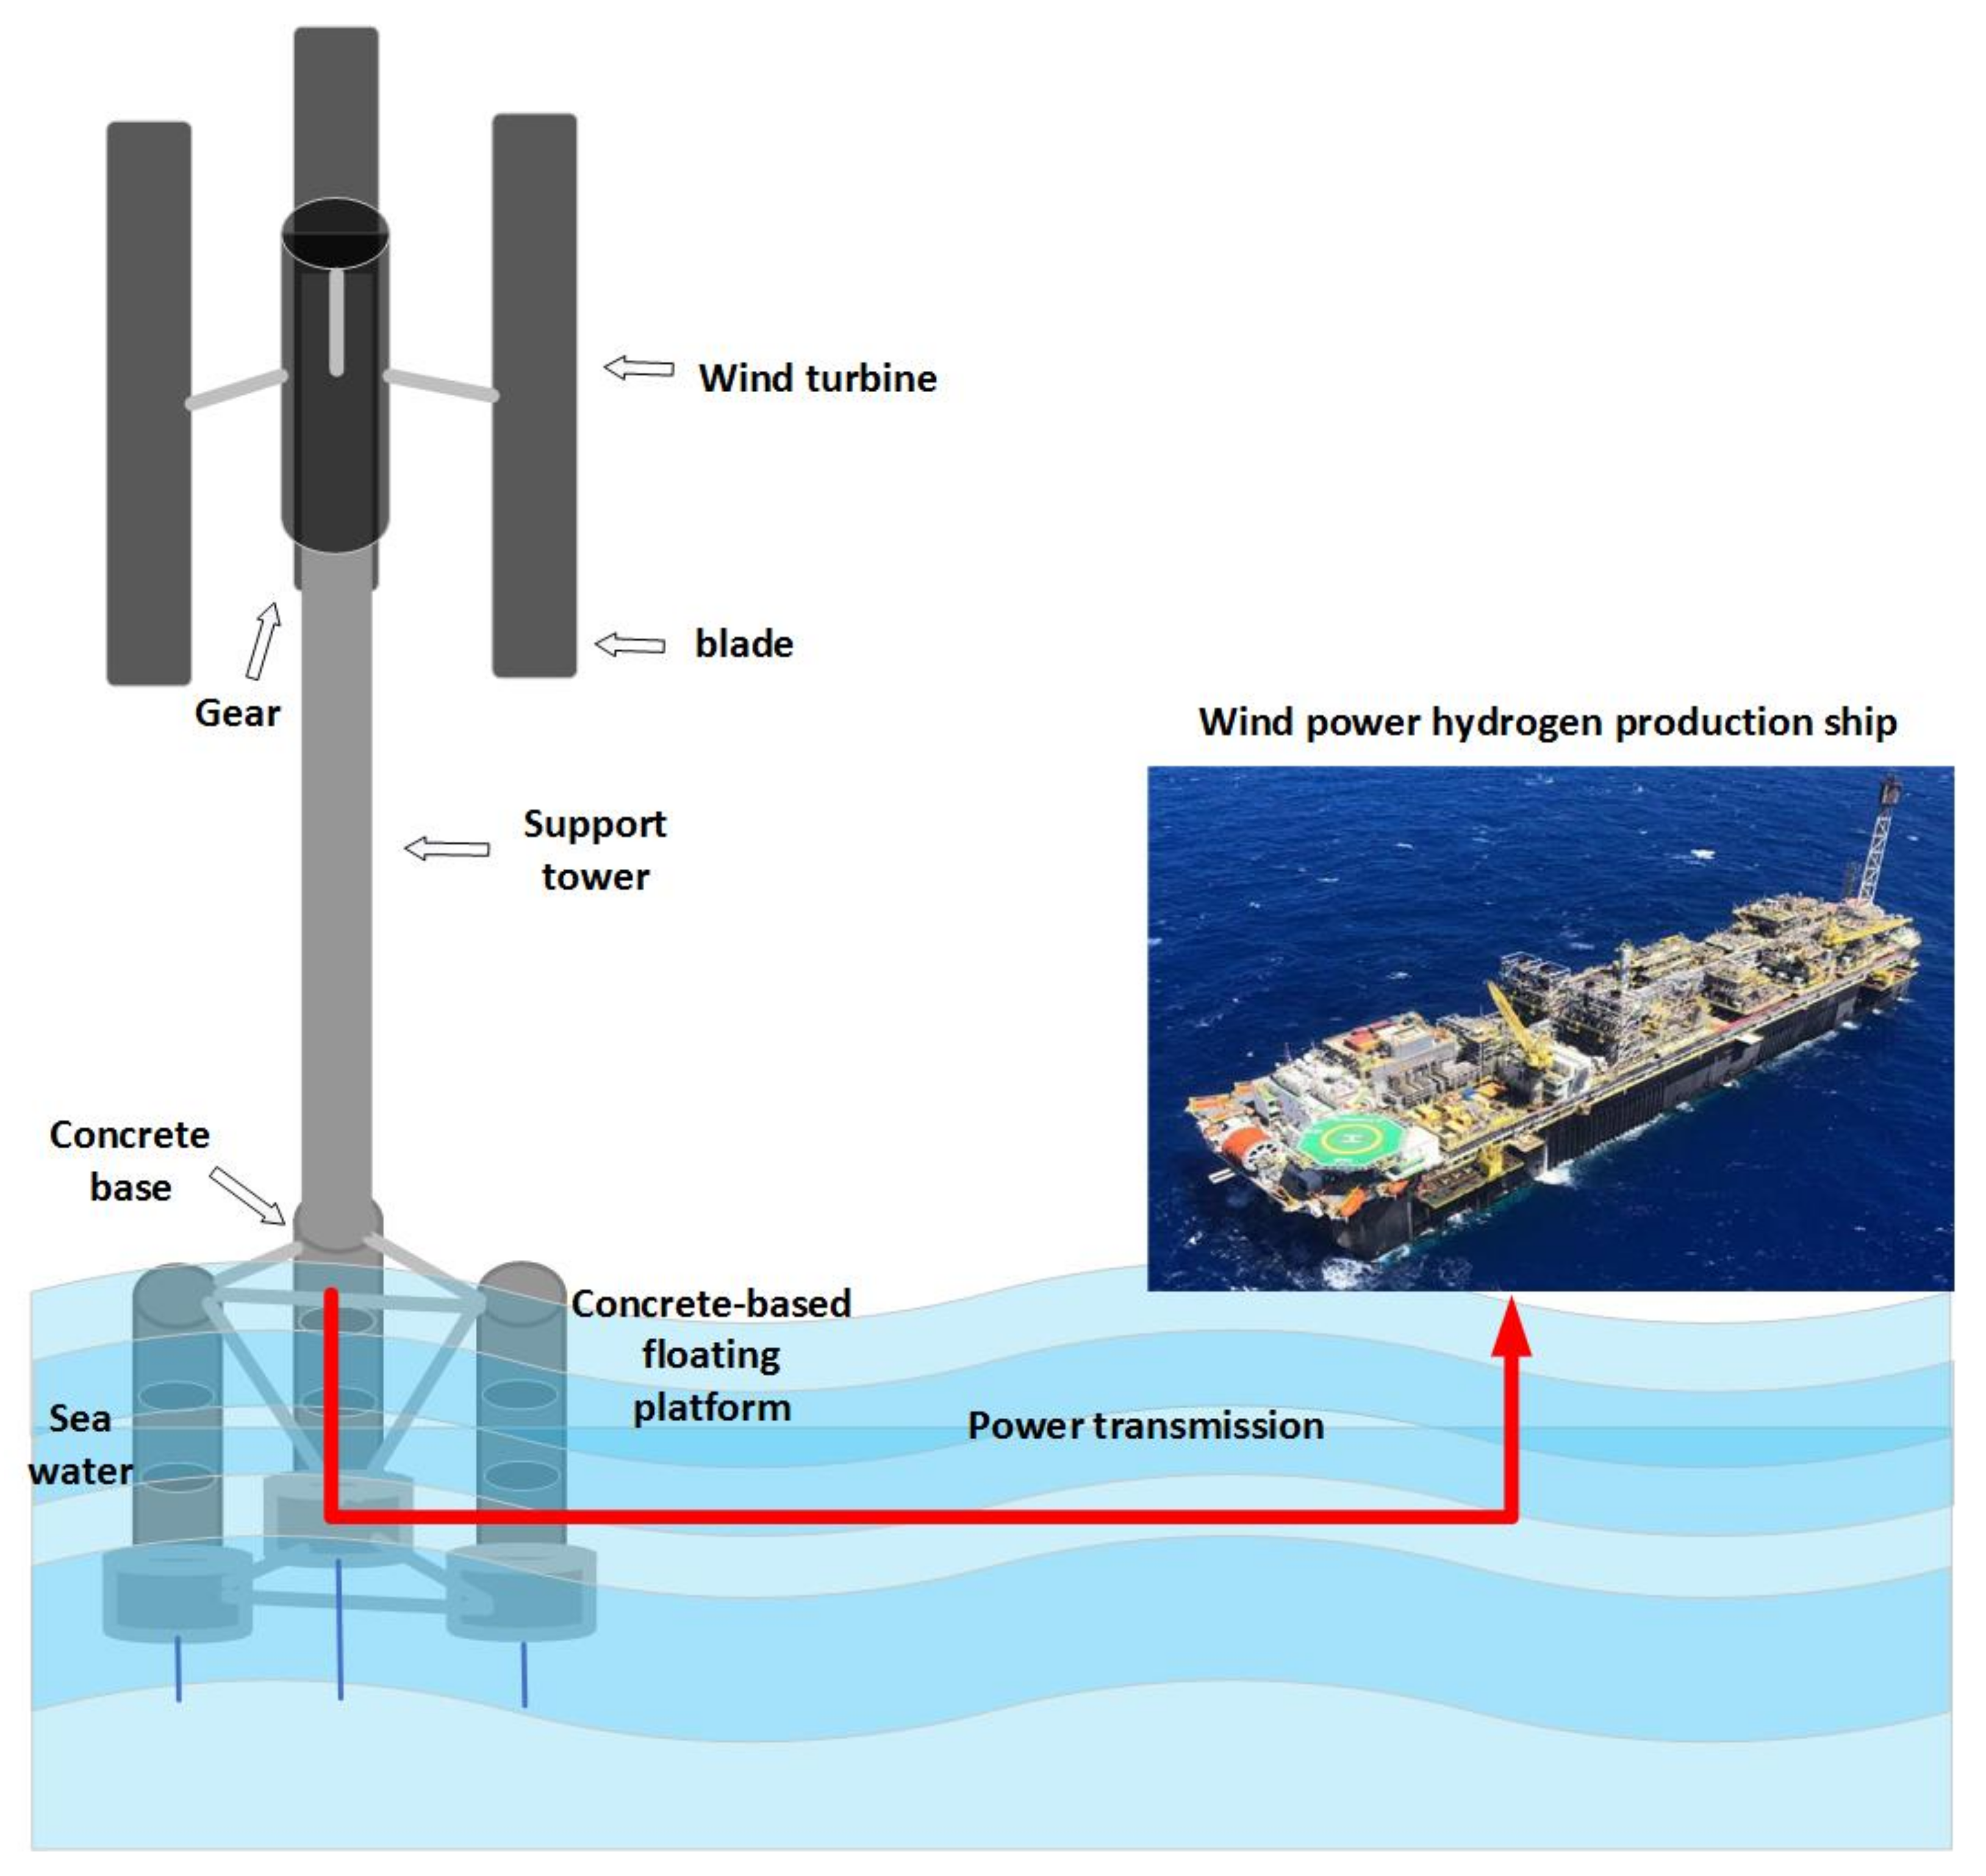
4]. Hydrogen production from wind power is expected to accelerate offshore wind power to further reduce costs and enter the era of parity. Usually, the floating offshore wind turbines are located in the deep sea and have the advantages of abundant offshore wind resources [
5].
Figure 1 is a schematic diagram of hydrogen production using a horizontal axis offshore floating wind turbine.
Compared with the horizontal axis offshore wind turbine commonly used in wind farms, VAWT has its own unique advantages and has great research significance [
6,
7]:
- (1)
When the wind blows to a single vertical axis offshore wind turbine come from all directions, the effect is the same, so the vertical axis offshore wind turbine does not need a yaw system.
- (2)
The vertical axis offshore wind turbine has a simple structure, a small footprint, convenient installation, simple maintenance, and easier control of the offshore wind turbine.
- (3)
The vertical axis offshore wind turbine uses fewer parts, the internal structure is simple, the probability of failure during operation is much smaller than that of the horizontal axis offshore wind turbine, and the service life is long.
- (4)
The noise generated by the vertical axis offshore wind turbine is relatively small.
Vertical axis offshore wind turbines are divided into two categories according to the nature of their wind energy acquisition: lift-type offshore wind turbines and drag-type offshore wind turbines [
8]. The lift-type offshore wind turbine obtains low torque when starting, and does not have a good self-starting ability, but the tip speed ratio can be very high. Under the same manufacturing cost and weight of the offshore wind turbine, there is a higher power output [
9]. Resistance offshore wind turbines are mainly Savonius vertical axis offshore wind turbines. Compared with the Darrieus type vertical axis offshore wind turbine, the Savonius type offshore wind turbine’s start-up wind speed and start-up speed can be very small. However, due to the characteristics of its wind wheel structure, the maximum wind energy utilization rate of Savonius offshore wind turbines is low, generally less than 25%, and cannot be used for large-scale wind power generation. The H-type offshore wind turbines used in the simulation calculation in this study are Darrieus type offshore floating wind turbines.
With increasingly more researches on vertical axis offshore wind turbines, many scholars are committed to improve the performance of VAWT. As we know, there are two directions: one is to improve the aerodynamic performance of the offshore wind turbine by optimizing the structure of the vertical axis offshore wind turbine, and the other is to make the vertical axis offshore wind turbine wait for better control through advanced algorithms. The tip speed ratio of the vertical axis offshore wind turbine, the number of blades, the chord length of the blade, the height-to-diameter ratio of the offshore wind turbine, the shape of the blade, etc., will affect the force of the blade during rotation, and thus affect the performance of the vertical axis offshore wind turbine to obtain torque. Many scholars have also conducted research in this field. Ferroudji F et al. designed an adaptive drag-to-lift conversion combined offshore wind turbine and simulated them in terms of aerodynamic performance [
10]. Mahdi Zamani et al. verified the pros and cons of the J-blade vertical axis offshore wind turbine through experiments and analysis of the three-dimensional model [
11]. Goude A et al. studied the force on the blades of a vertical-axis offshore wind turbine when it is stopped [
12]. Losita et al. studied the influence of the leading edge of the airfoil nodule on the performance of the offshore wind turbine, found that the leading edge of the nodule would reduce the performance of the offshore wind turbine, and analyzed the reasons for this situation [
13]. Rezaeiha A et al. analyzed the influence of the central axis on the vertical axis offshore wind turbine through experiments and found that the central axis has little effect on the vertical axis offshore wind turbine [
14]. Liu Q et al. installed Gurney flaps on the trailing edge of the airfoil and found that the performance of the offshore wind turbine has been effectively improved after the addition of the flaps [
15]. Ostos I and Zheng M et al. improved the performance of the offshore wind turbine by optimizing the design of the blades of the Savonius offshore wind turbine [
16,
17]. Some scholars have designed some special blades, such as telescopic blades to improve the performance of offshore wind turbines [
18]. The application of some diversion structures will further improve the performance of the offshore wind turbine. Dessoky A et al. studied the changes in the performance of the H-shaped vertical axis offshore wind turbine after installing a wind lens [
19]. In addition, based on the inspiration of studying horizontal-axis offshore wind turbines, some scholars have discovered that the use of pitch technology can also increase the effective lift of vertical axis offshore wind turbines while greatly reducing drag. Abdalrahman G et al. used advanced control algorithms and neural network algorithms to control the pitch angle of the vertical axis offshore wind turbine, so that the vertical axis offshore wind turbine has a suitable pitch angle at different azimuth angles [
20]. The structure of the trailing edge of the blade can affect the wind speed and flow direction before and after the wind flows through the blade, and it has a great impact on the vertical axis offshore wind turbine to obtain wind power [
21]. J. Sun et al. have studied the aerodynamics of vertical-axis wind turbine with boundary layer suction effects of suction momentum in literature [
22]. The control effect evaluation for the NACA0021 airfoil was mainly focused on the relative values compared with the simulation cases without boundary layer suction. But for angles of attack larger than
, suction at 30%c from the leading edge of the airfoil cannot remove the large flow separation using all the values of suction momentum examined in this paper.
In view of the rich characteristics of vertical axis offshore wind turbines, this study focuses on modeling and investigation of blade trailing edge of vertical axis offshore wind turbine. Based on the above studies, different parameters of the blade structure are modified based on the original NACA0021 airfoil in this study. First, the thickness of the airfoil is modified, and the thickness of the airfoil is changed to 110%, 105%, 95%, 90%, 85%, and 80% of the original airfoil through a parameterized method. Second, add flaps to the trailing edge of the NACA0021 airfoil, and add the lengths of 0.5%c, 1%c, 2%c, 3%c, and 4%c to the trailing edge of the airfoil and the angles are 0°, 22.5°, 45°, 67.5°, 90° flaps, respectively. Finally, the camber of the airfoil is optimized, and the camber of the airfoil is modified from 1% to 6%. We re-establish the simulation model of the modified airfoil and compare it with the original model to analyze the changes in the performance of the vertical axis offshore wind turbine when the blade structure changes. Through the optimization and analysis of the blade structure, this study obtains the best parameters of airfoil thickness, trailing edge flaps, and camber. The optimization of the blade structure changes the flow field around the blade, which significantly improves the maximum wind energy capture rate and self-starting ability of the vertical axis offshore wind turbine.
Despite the extensive literature on the importance of uncertainties in CFD-based optimization of airfoils, there remain multiple sources of uncertainties, such as using two-dimensional (2-D) CFD simulations for a three-dimensional (3-D) system, uncertainties from the turbulence model, the errors due to numerical meshes, etc. [
23,
24].
The structure of the article is as follows.
Section 1 describes the background of offshore wind turbines and related research done by some scholars, and
Section 2 proposes the design parameters and grids of offshore wind turbines.
Section 3 is to improve the airfoil trailing edge. Finally,
Section 4 summarizes the conclusions and deficiencies in the article as well as prospects for future research.
2. Offshore Wind Turbine Design Parameters and Meshing
2.1. Geometric Model of Offshore Wind Turbine
The geometric parameters of the vertical axis offshore wind turbine selected in this study are based on the experimental research conducted by Marco Raciti Castelli et al. [
25,
26]. This study shows that when the center of rotation of the wind wheel is one-quarter of the chord length of the blade, the aerodynamic performance of the wind wheel shows a higher level. The geometric parameters of the vertical axis offshore wind turbine used in this study are shown in
Table 1.
The solidity
of the wind wheel represents the density of the offshore wind turbine blades. This parameter has a great influence on the aerodynamic performance of the offshore wind turbine. The definition of the solidity is given by Equation (
1).
The trailing edge of the airfoil refers to the last end of the airfoil. A section of the airfoil with a certain length installed at the trailing edge is called the trailing edge flap. As shown in
Figure 2, the NACA0021 airfoil is equipped with a trailing edge flap. The flaps have a certain influence on the wind energy obtained by the blades. The airfoil with the trailing edge flaps can moderately increase the lift of the wing compared to the original airfoil. This has also been verified on the wing of the aircraft. This article studies the effect of adding trailing edge flaps of different lengths and angles on the aerodynamic performance of vertical-axis offshore wind turbines.
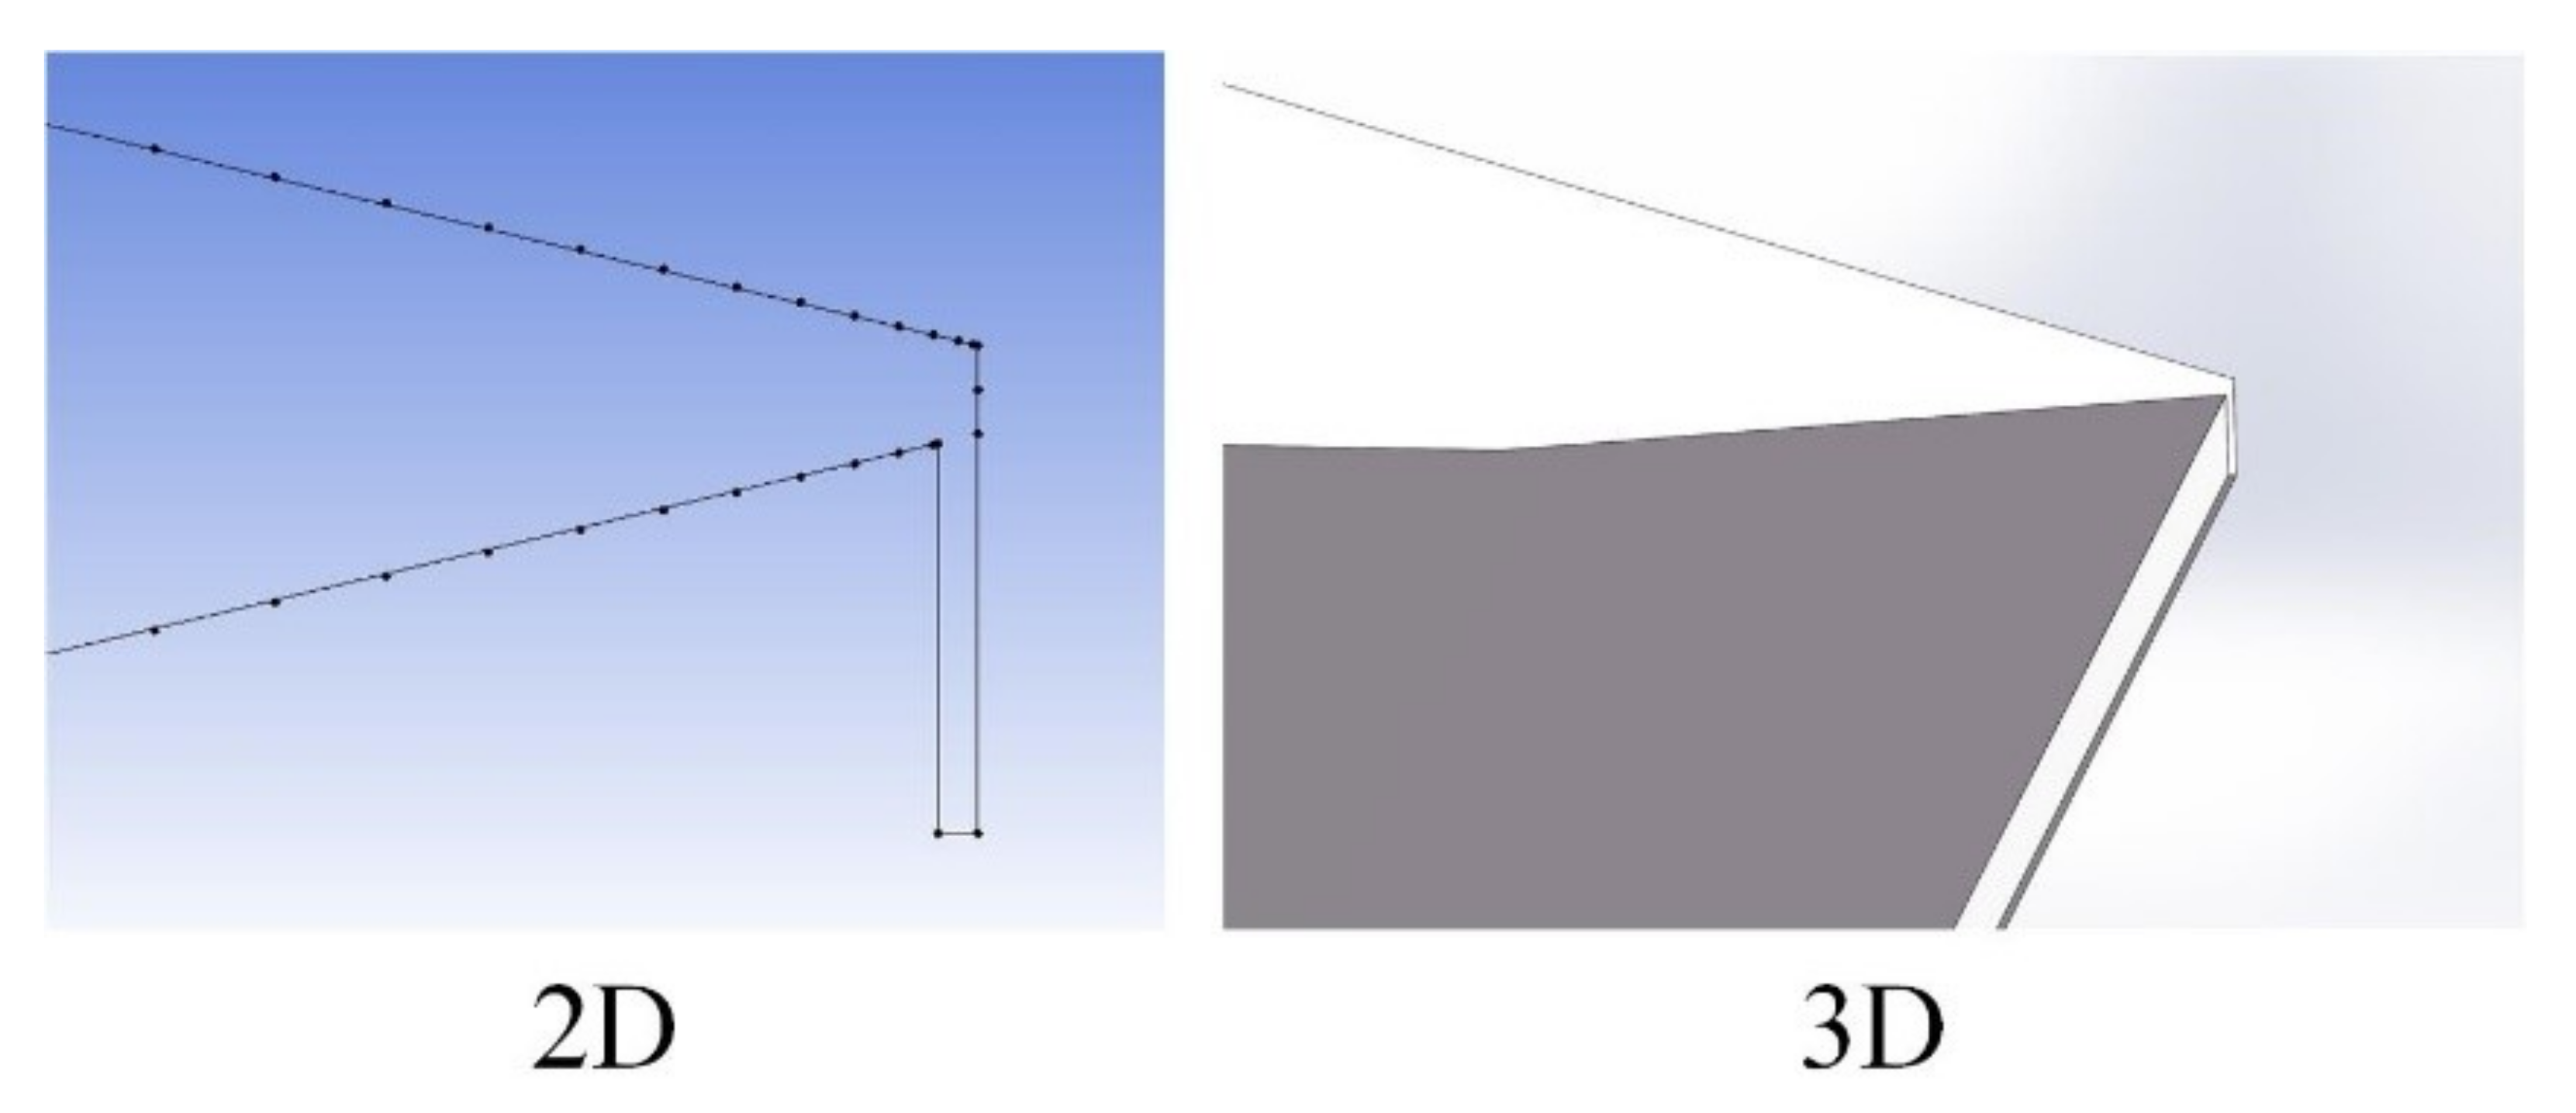
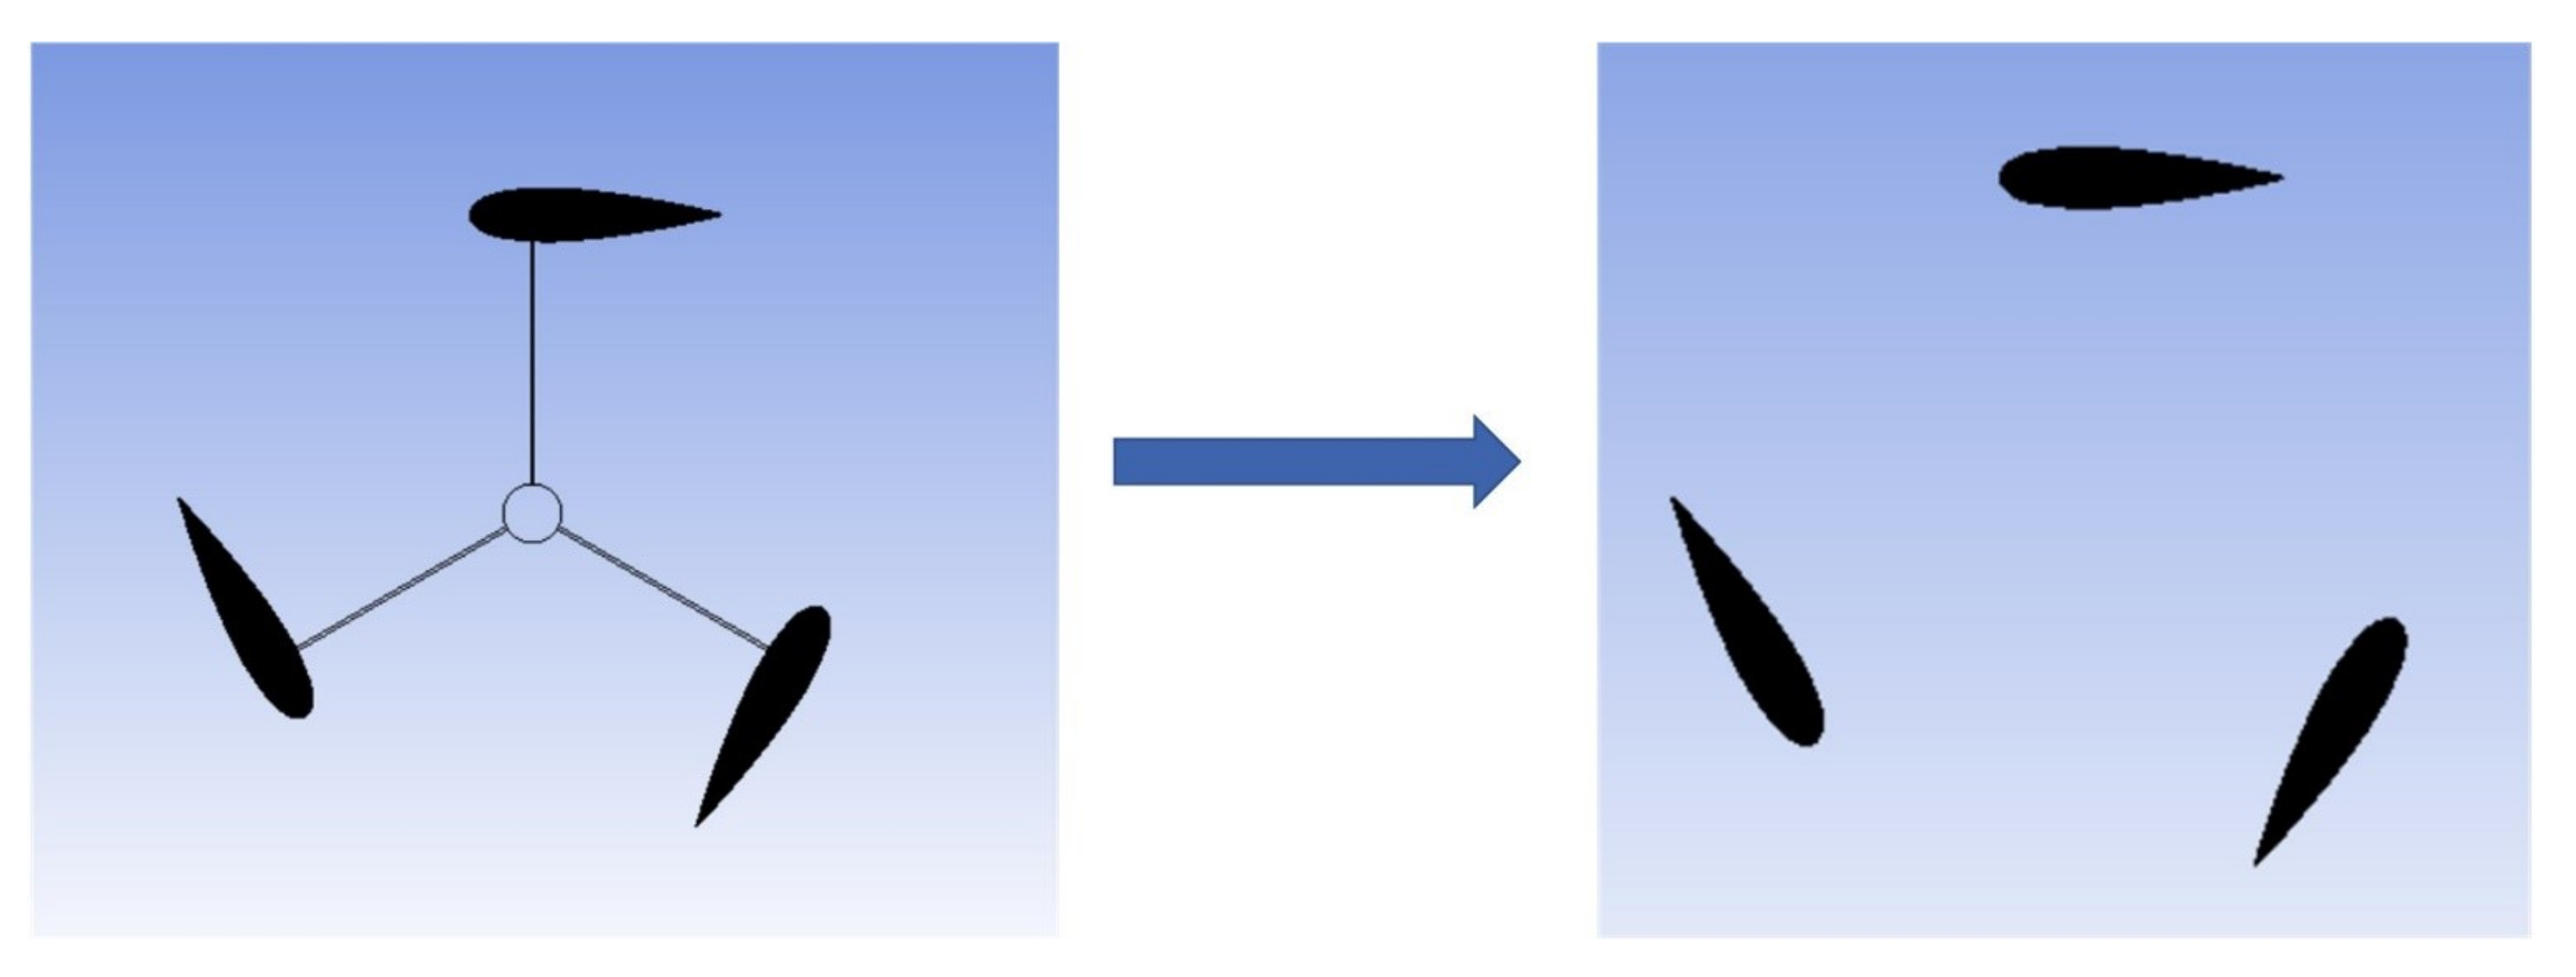
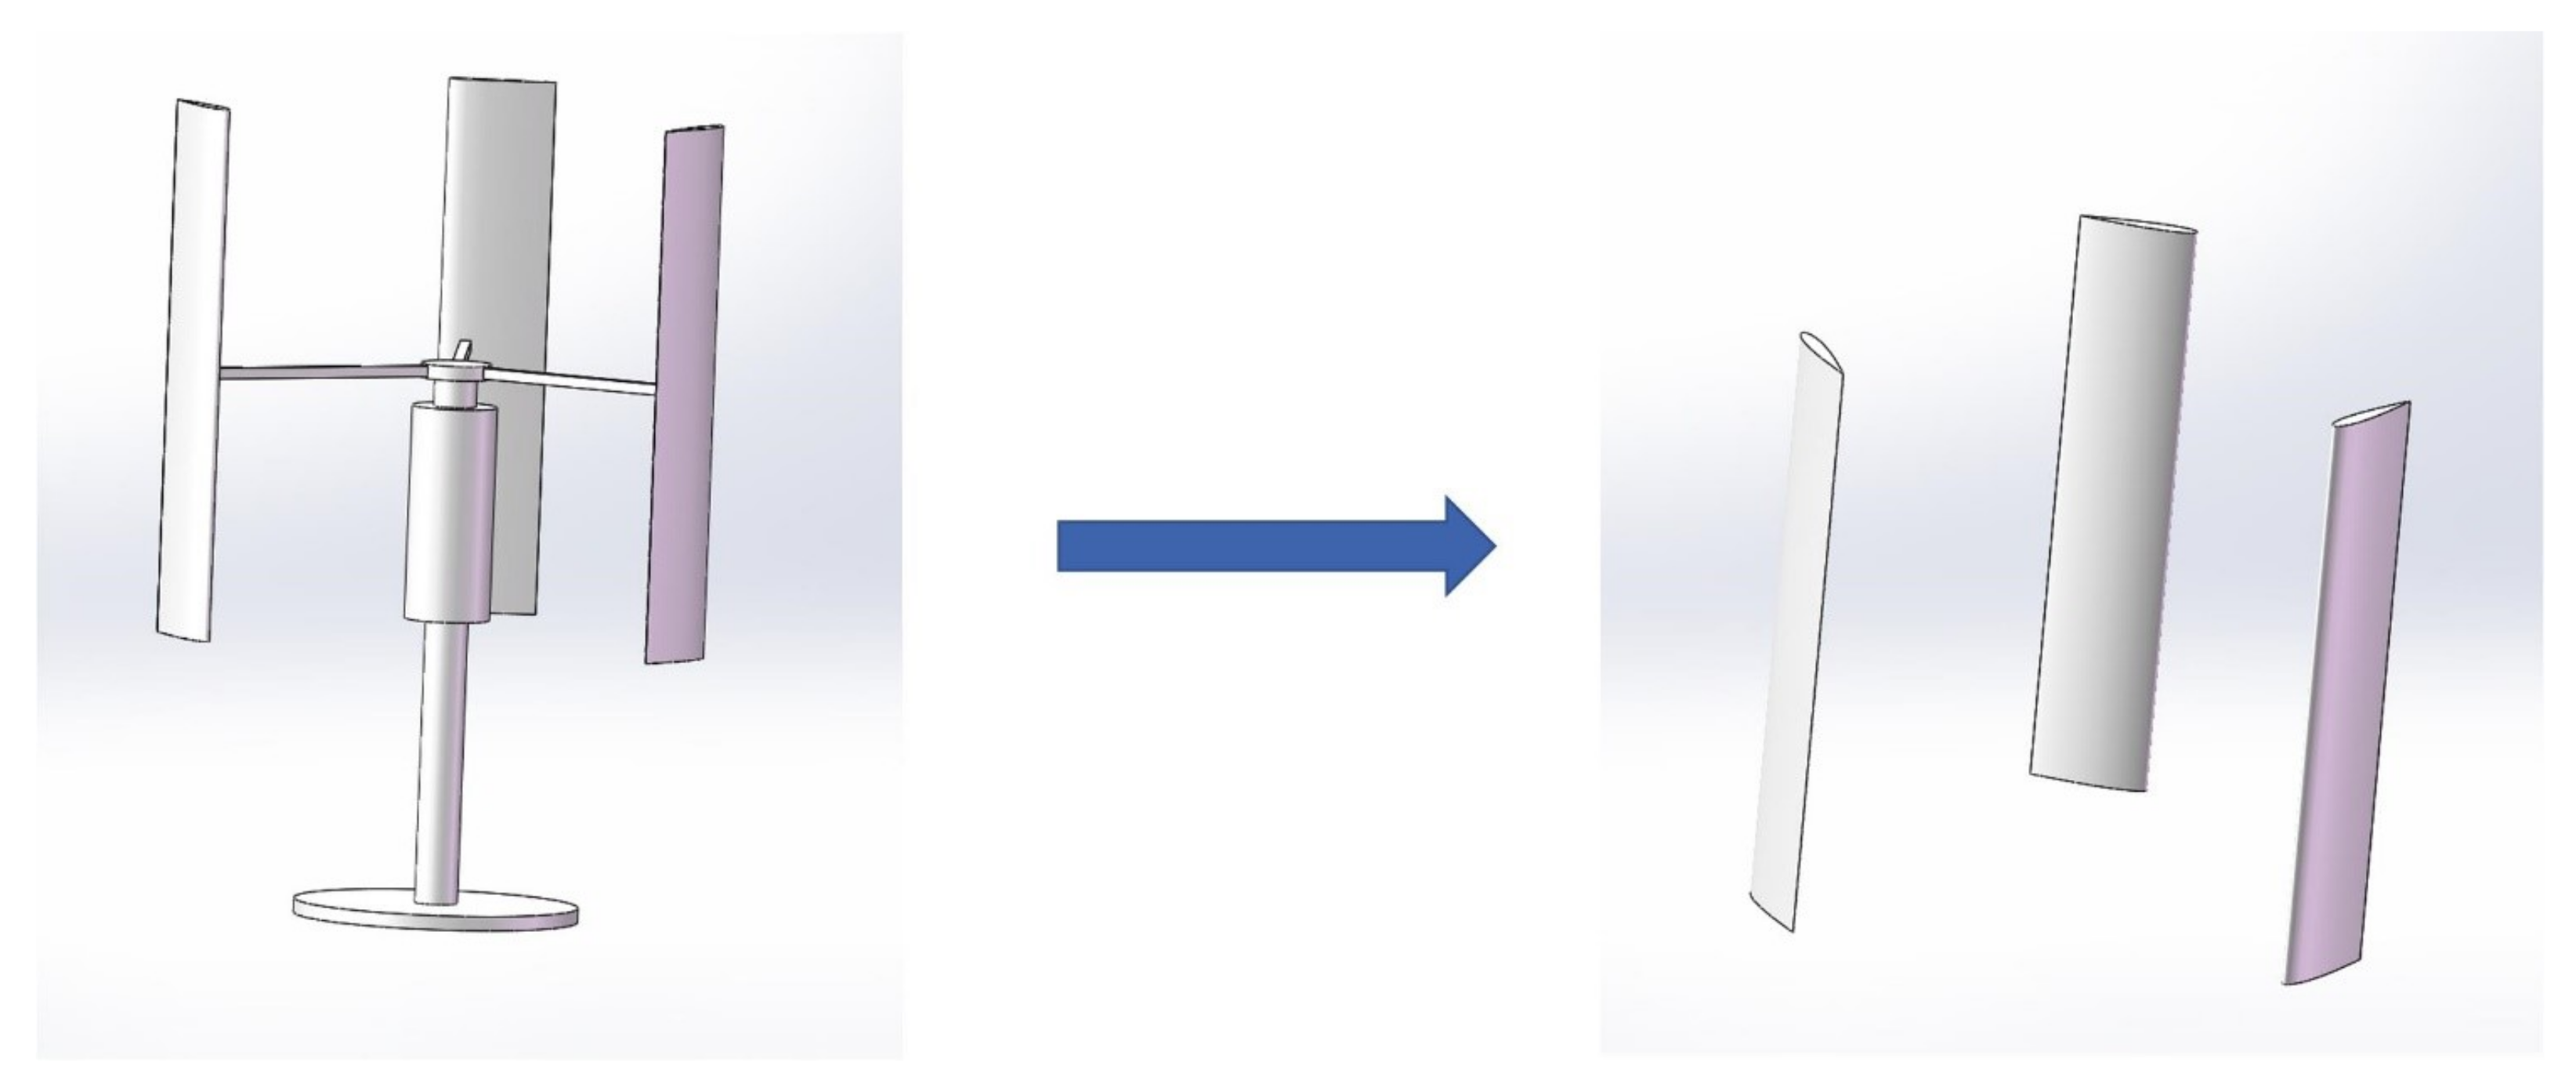
The structure of a vertical axis offshore wind turbine mainly includes blades, a vertical central shaft, a tower, a base, a motor, and a pole connecting the blades and the rotating shaft. When the offshore wind turbine is running, the blades mainly obtain kinetic energy, and the rod connecting the blades drives the central shaft to rotate. The blades undertake all the tasks of obtaining torque, and it is not necessary to model all the parts of the vertical axis offshore wind turbine. In the meshing tool ICEM, too many complex and unnecessary parts will increase the difficulty of modeling, and the quality of the divided mesh is also very poor. Many irregular calculation meshes will be generated at the connection of some parts. It is difficult to meet the conditions required for numerical simulation calculations. These unnecessary parts and components will also occupy a lot of unnecessary computer hardware resources in the numerical simulation process, and affect the calculation results and calculation speed. Therefore, the geometric model of the vertical axis offshore wind turbine can be simplified into a wind wheel model containing only three blades. The simplified 2-D offshore wind turbine model before and after the simplification is shown in
Figure 3, and the 3-D model schematic diagram is shown in
Figure 4.
After simplifying the model, in the calculation process, the convergence iteration is faster, and the calculation accuracy and calculation speed are also guaranteed.
The calculation results of the 2-D model and the 3-D model are in good agreement, but the three-dimensional calculation consumes a lot of time and computer resources, which is not conducive to a large number of simulations and studies. Therefore, this study is mainly used the calculation results of the two-dimensional grid as a reference.
2.2. Meshing
When the offshore wind turbine is running, there should be an infinite space around it. In the actual simulation experiment of the vertical axis offshore wind turbine, it is impossible to establish an infinite space for calculation. Therefore, a suitable size area should be selected for calculation, and this area is called the computational domain. The selection of the computational domain has a great influence on the accuracy of the simulation. If the calculation domain is too small, the flow field around the offshore wind turbine is easily affected and the calculation error is too large, and if the calculation domain is set too large, too many grids need to be divided, which greatly increases the calculation time and makes the simulation efficiency greatly discounted.
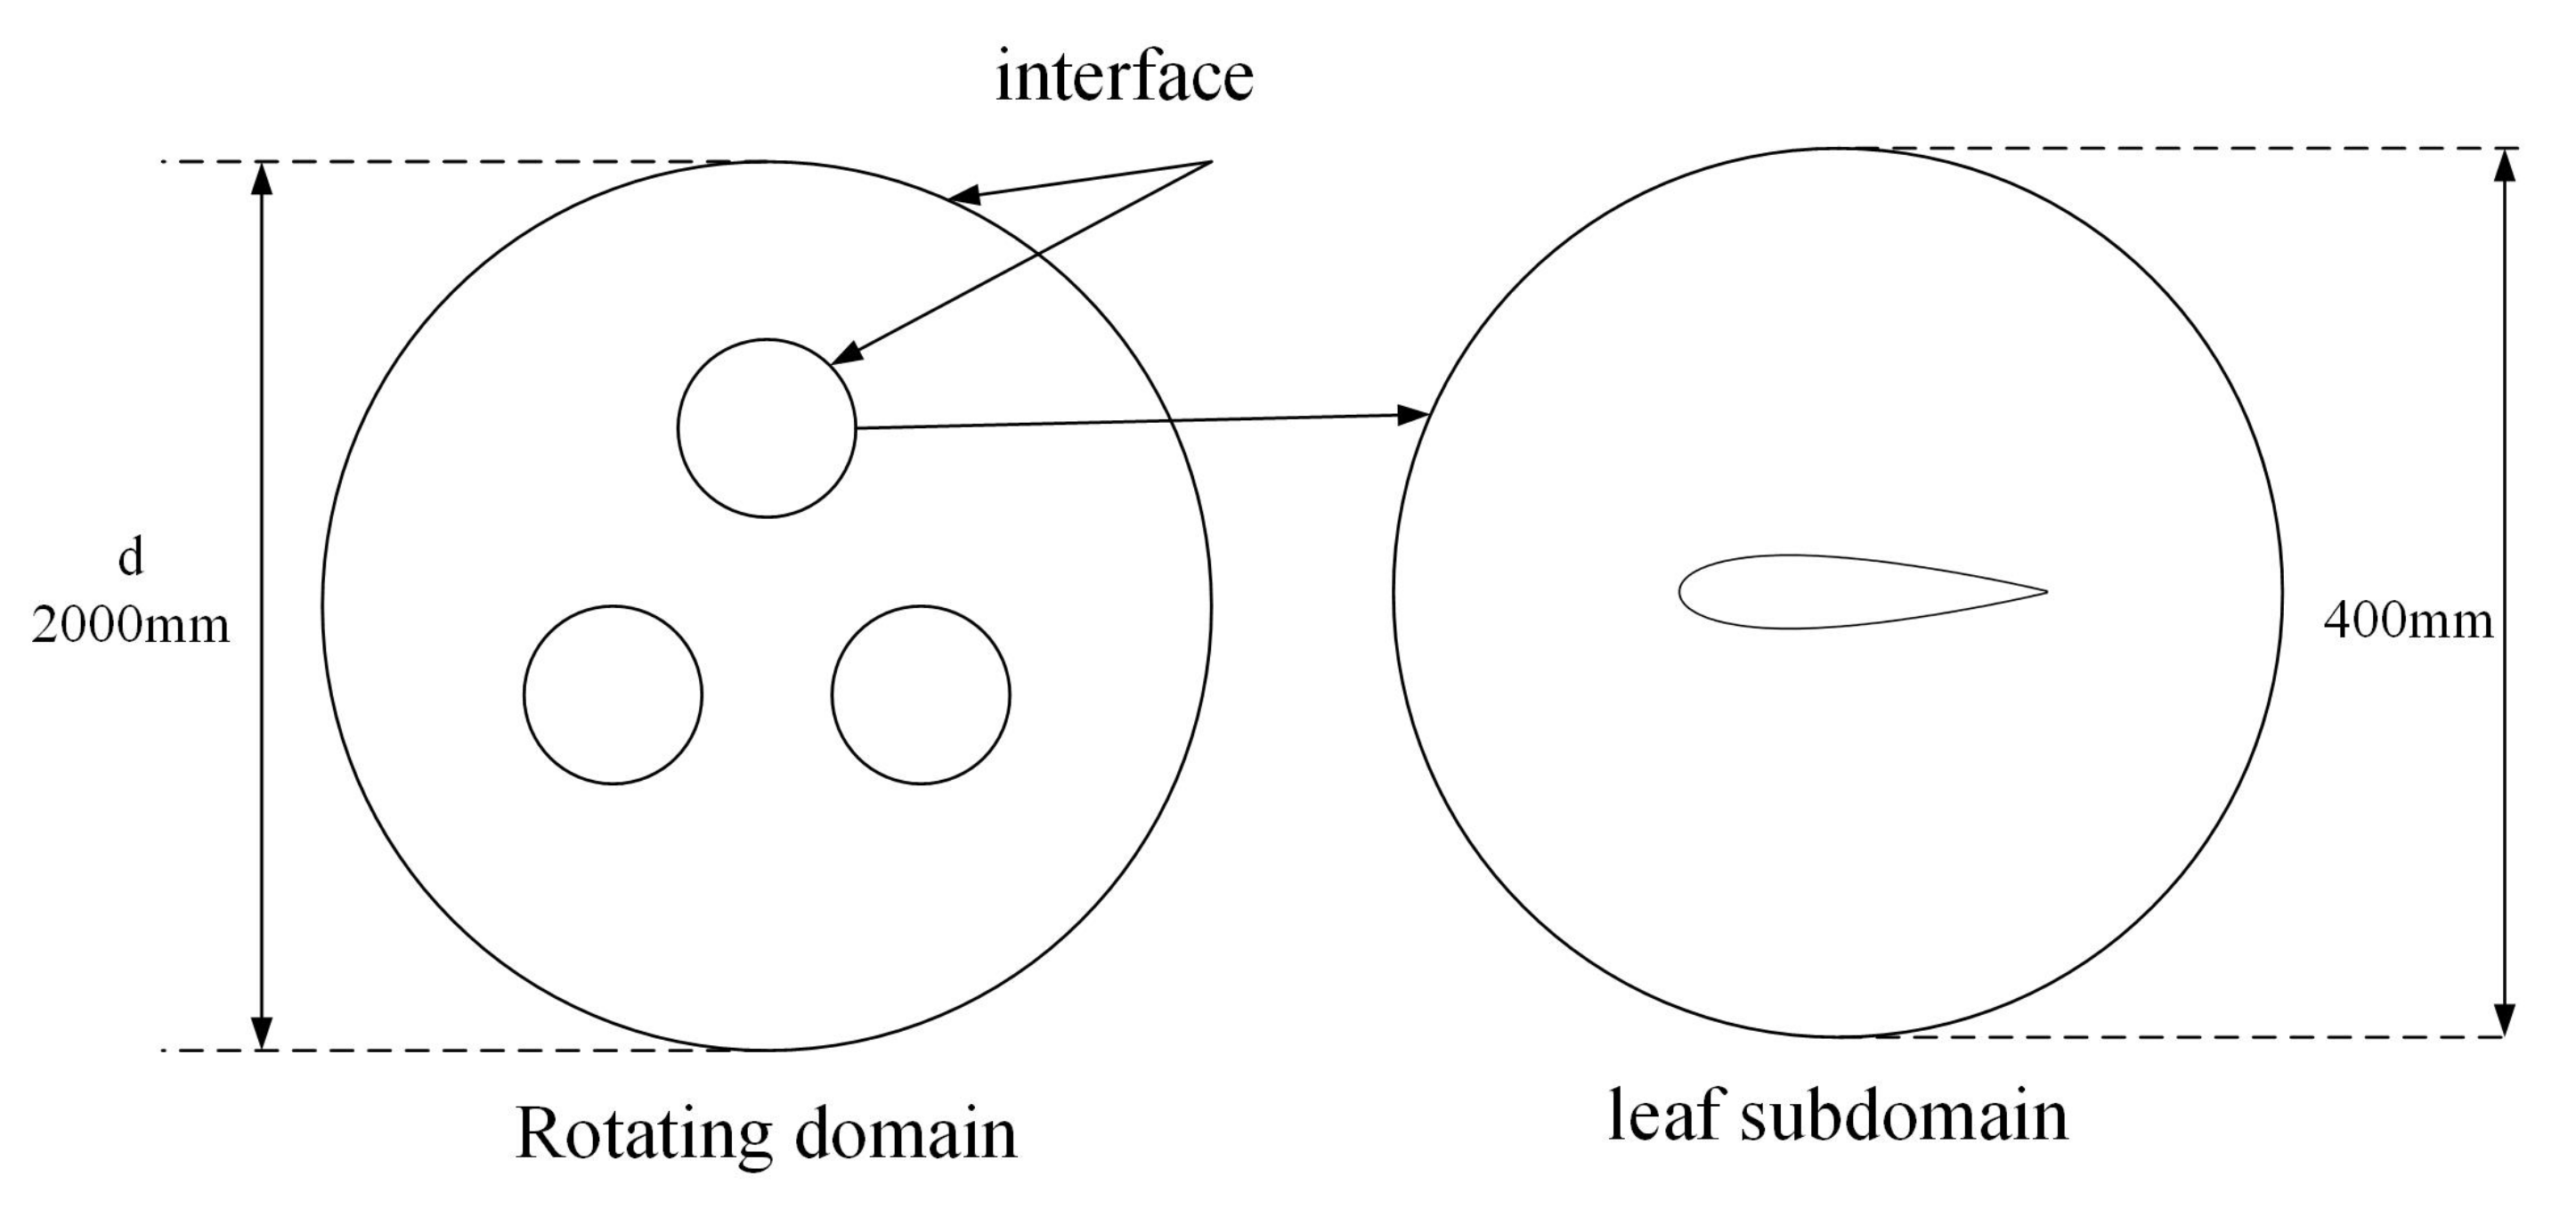
The size of the rotating domain is shown in
Figure 5, and the static domain is shown in
Figure 6. The chord length of the blade is 85.8 mm, and a blade domain is divided slightly larger than the circumference of the blade, and the diameter of the blade domain is 400 mm. In the vicinity of slightly larger than three blade domains, a rotation domain is divided, which is a circular area with a diameter of 2000 mm. The blade domain and the rotation domain rotate around the center of the wind wheel to simulate the state of the internal flow field when the wind wheel rotates. The remaining area is called the static domain, which simulates the state of the external flow field near the wind wheel. The boundary condition on the left side of the static domain is the velocity inlet, which is 5d from the center of the wind wheel. The entire set wind speed is 9 m/s in the positive x-axis direction, and the rightmost boundary is the pressure outlet, which is 10d from the center of the wind wheel in order to ensure that the wake of the wind after passing the wind wheel is fully developed. The upper and lower boundary forms are symmetrical, and the distance between the upper and lower sides of the static domain is 5d. The interface between the stationary domain and the rotating domain, and the rotating domain and the blade domain are all set as an exchange surface (interface) for data exchange between flow fields. The entire computational domain is a rectangular area with a length of 30 m and a width of 10 m.
When we perform 3-D meshing, the calculation domain of the x-y plane adopts the parameters of the 2-D calculation domain, and the height in the z-axis direction is selected as 2000 mm, which is slightly larger than the height of the blade.
After determining the size of each part of the computational domain, meshing is required. As the air flow near the wall of the blade is more complicated, it is necessary to set the height of the first layer of the grid near the wall of the airfoil when performing CFD simulation to ensure the accuracy of the simulation results. The grid height of the first layer can be estimated by Equation (
2):
where
is the wall friction coefficient,
is the wall shear stress,
is the fluid density,
v is the fluid velocity,
is the fluid velocity on the blade surface,
is the dimensional wall distance, and
is the dynamic viscosity of the fluid.
y is the calculated height of the first layer of grid, after calculation, the height of the grid of the first layer is 0.0378 mm.
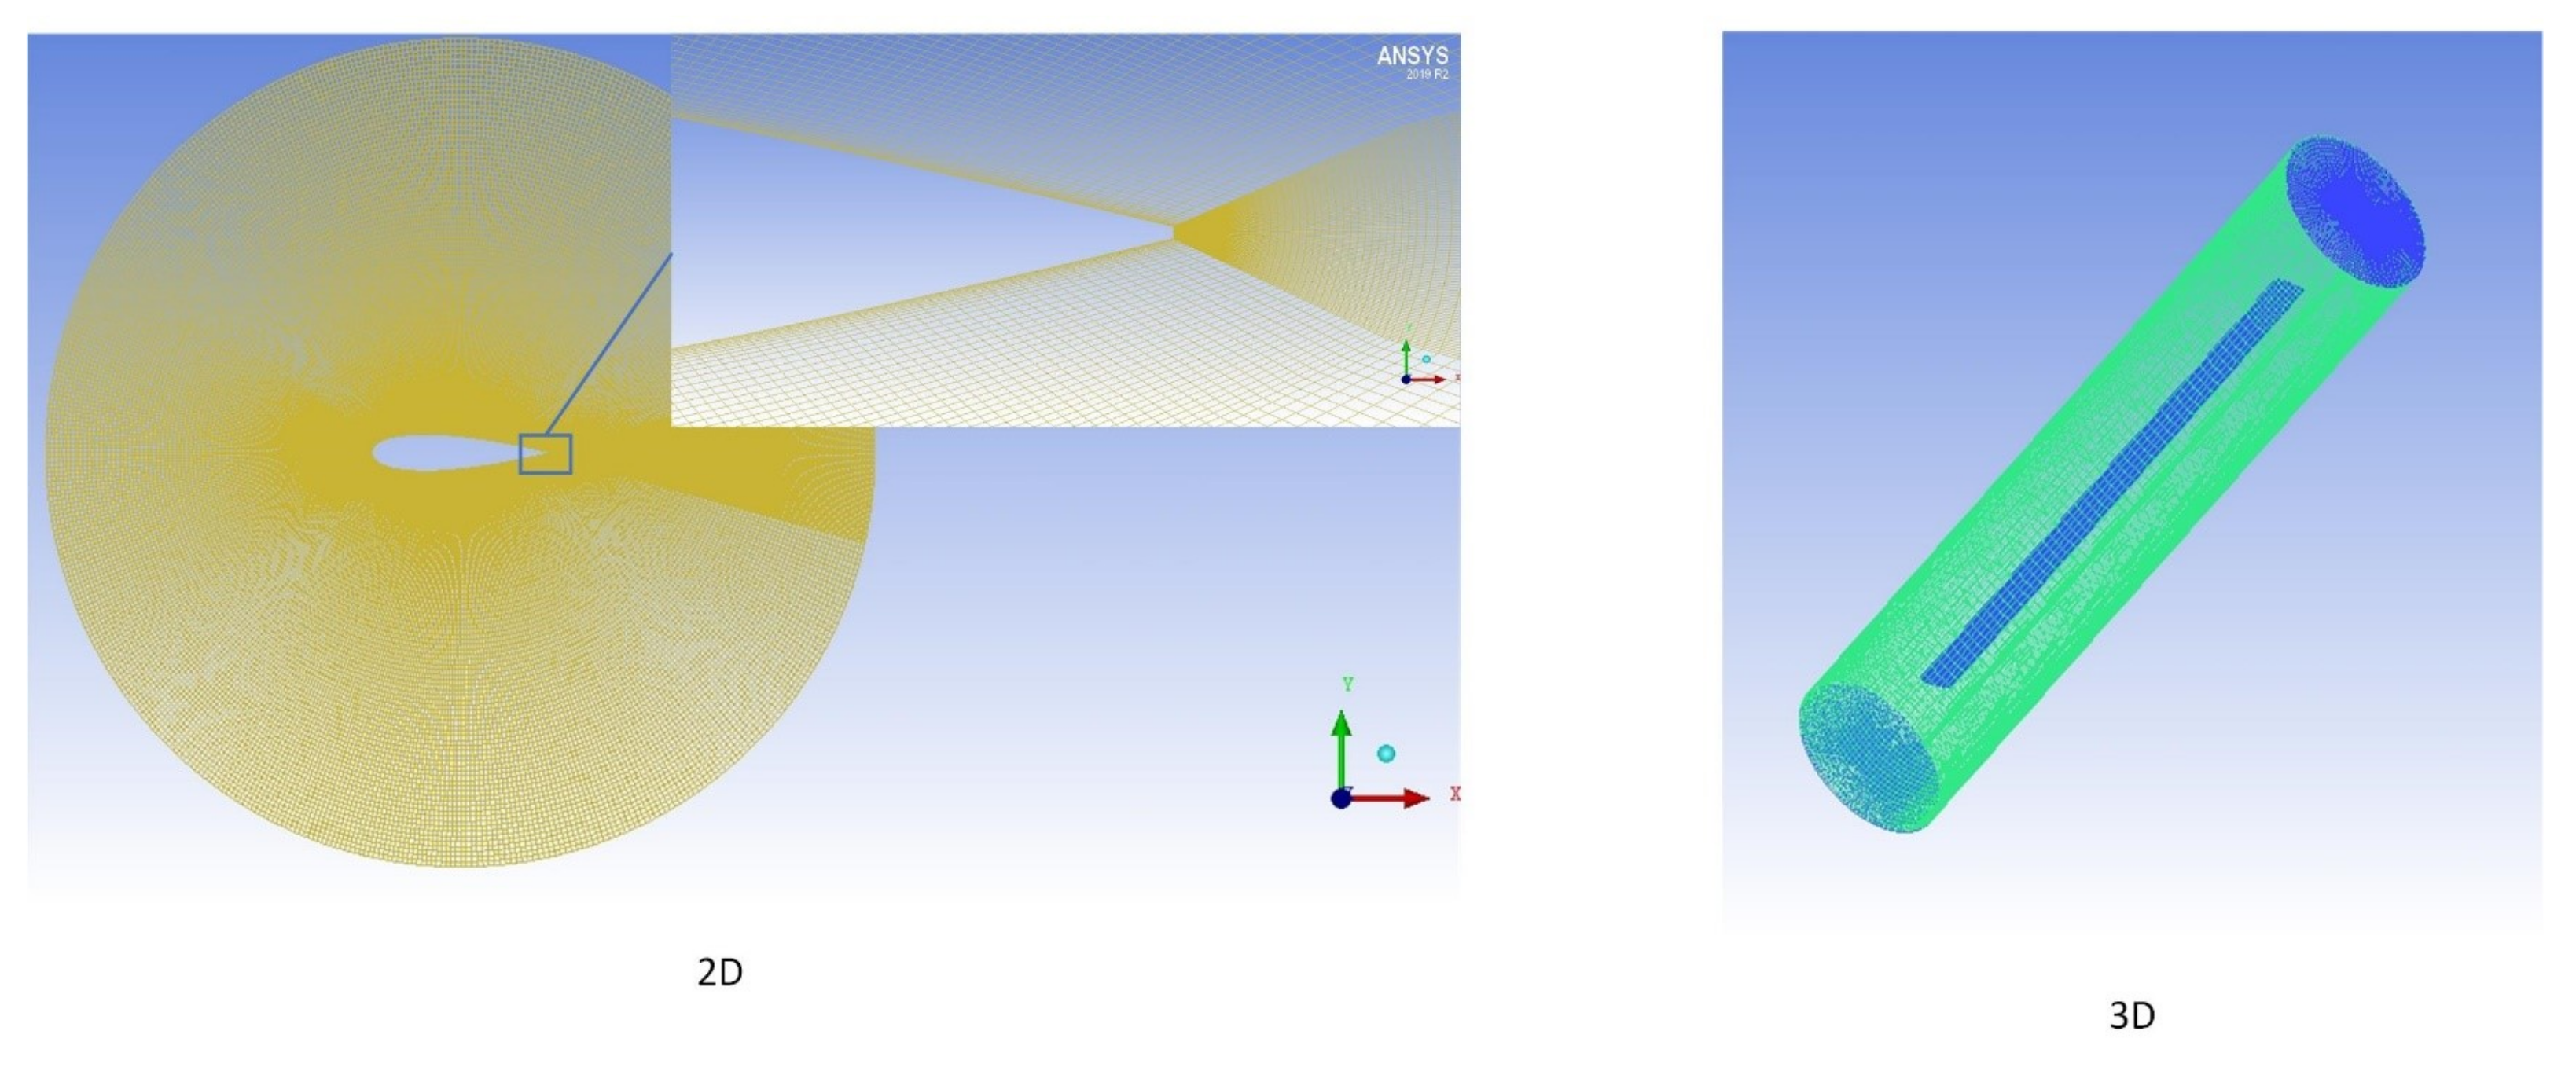
The 2-D mesh and 3-D mesh of the divided blade domain are shown in
Figure 7.
When the wind wheel rotates, the internal and nearby flow fields are simulated in the rotating domain, and the divided grid is shown in
Figure 8.
The quality of meshing determines the results and efficiency of the entire simulation. When the quality of the grid is poor, or the divided grid is relatively sparse, when the wind wheel is rotating, the flow field around the blade cannot be fully calculated, which makes the calculation result and the actual value have a large error. When the number of grids is large, the time spent in each calculation is large, which is not suitable for a large amount of research work. Therefore, it is necessary to verify the independence of the grid and find a grid that not only meets the requirements of calculation accuracy, but also can greatly shorten the calculation time.
When we mesh the two-dimensional computational domain, this study divides three different numbers of grids: 197,142, 360,754, and 488,650. For the three grid quality models, the torque coefficient of the wind wheel for one cycle when the wind speed is 9 m/s and the tip speed ratio is 2.65 is calculated. The graph of the change of the wind wheel torque coefficient with the azimuth angle is obtained for different grid qualities, as shown in
Figure 9.
With different grid qualities, the torque coefficient of the wind wheel is changed periodically with the azimuth angle, and the torque amplitude is obtained at the same azimuth angle every 120°. In respect of coarse grid (190,000 magnitude), compared with the other two sets of grids, the torque coefficient is relatively small. At this time, the airflow around the blades is not fully calculated. Compared with the medium-quality (360,000 magnitude) grid, the calculation results of a good-quality grid (490,000 magnitude) have been slightly improved, but the calculation results have almost overlapped. In the two-dimensional grid division, 360,000-level grids are used, which can not only ensure the accuracy of the calculation, but also greatly reduce the simulation time.
2.3. Parameter Settings
In this study, the parameter settings for numerical simulation using Fluent are as follows.
Fluent is set to double precision to ensure the accuracy of the calculation. The simulation uses multi-core parallel computing to improve computing efficiency.
The solution of the whole simulation adopts pressure-based transient (Transient) calculation, and the established wind wheel model is simulated by SST k-
model and Realizable k-
model, as shown in
Figure 10. Both turbulence models can reflect the aerodynamic performance of the wind wheel in motion. Compared with the Realizable k-
model, the SST k-
model is closer to the experimental results, so the turbulence model used in this study is the SST k-
model. The rotation domain part uses a sliding grid to simulate the state of the offshore wind turbine when it rotates. Here, it needs to be pointed out that a Reynolds Stress model like the SSG or LRR model would be also appropriate and suitable for studying vertical axis offshore wind turbines.
The angular velocity of rotation is calculated according to the change of the tip speed ratio and the wind speed, which is shown in Equation (
3):
where
is the angular velocity of the rotating domain;
is the tip speed ratio, the range of the tip speed ratio selected here is 1.2–3.3; and
r is the radius of the wind wheel is 515 mm.
When the wind speed is 9 m/s and the tip speed ratio is 2.65, the rotation speed of the wind wheel is 46.31 rad/s. The surface of the blade is set as a wall, specifically a moving wall, which moves with the movement of the rotating domain. The left boundary is set as the velocity inlet, and the wind speed is set to 9 m/s. The right boundary is set as a pressure outlet. Both upper and lower boundaries are set as symmetrical non-slip walls (symmetry). The interface between the blade domain and the rotating domain is set as an exchange surface (interface), which is used for data exchange during simulation. The interface between the rotating domain and the stationary domain can be handled in the same way.
In addition, the pressure–velocity coupling is solved by SIMPLE. The momentum equation, turbulent kinetic energy and turbulence dispersion rate are all used in the second-order upwind style to ensure the accuracy of calculation.
Time Step Size (TSS) refers to the length of time for calculating one step in the simulation process. If the time step is too long, the information on the blade surface is not fully calculated, which affects the calculation accuracy; if the time step is too short, the calculation result can be guaranteed, but a lot of calculation time is consumed. The time required to rotate 1°, which is shown in Equation (
4):
In this study, the independence of the time step is verified. This study sets the time step to the time of 1°, 2°, and 5° per rotation of the wind wheel, and compares the torque coefficient when the tip speed ratio is 2.65. The time step independence verification is shown in
Figure 11.
As can be seen in the figure, when the time step is 1° and 2° rotation time, the calculated torque coefficients are relatively close and have reached the simulation accuracy requirements, and when the time step is 5° rotation time, the change in interval is slightly larger, ignoring too much information on the blade surface, resulting in a small torque coefficient being calculated. Therefore, in the calculation in this study, the time step used is the time it takes for the blade to rotate 2°, and each time step is iterated at most 20 steps.
3. Research on Airfoil Trailing Edge
The torque coefficient of the wind wheel can reflect the change of the torque during the operation of the wind wheel, and its relationship is shown in Equation (
5):
Among them,
is the sweeping area,
r is the radius of the wind wheel, and
v is the wind speed. The Fluent software can be used to solve the instantaneous torque coefficients
,
,
, and the sum
of the three blade torque coefficients of each blade at each time step. One of the aerodynamic performance of a offshore wind turbine is reflected by the power coefficient curve
and the power curve
. Empirically, the calculation has converged in the 10th cycle. According to the instantaneous torque coefficient value obtained in the 10th cycle, the average torque coefficient of the wind wheel is obtained, and thus the average wind energy utilization coefficient
and average power
P of the wind wheel are obtained. The power coefficient is given by Equation (
6):
Here, is the default value provided by Fluent.
3.1. Design of the Length of the Airfoil Trailing Edge Flap
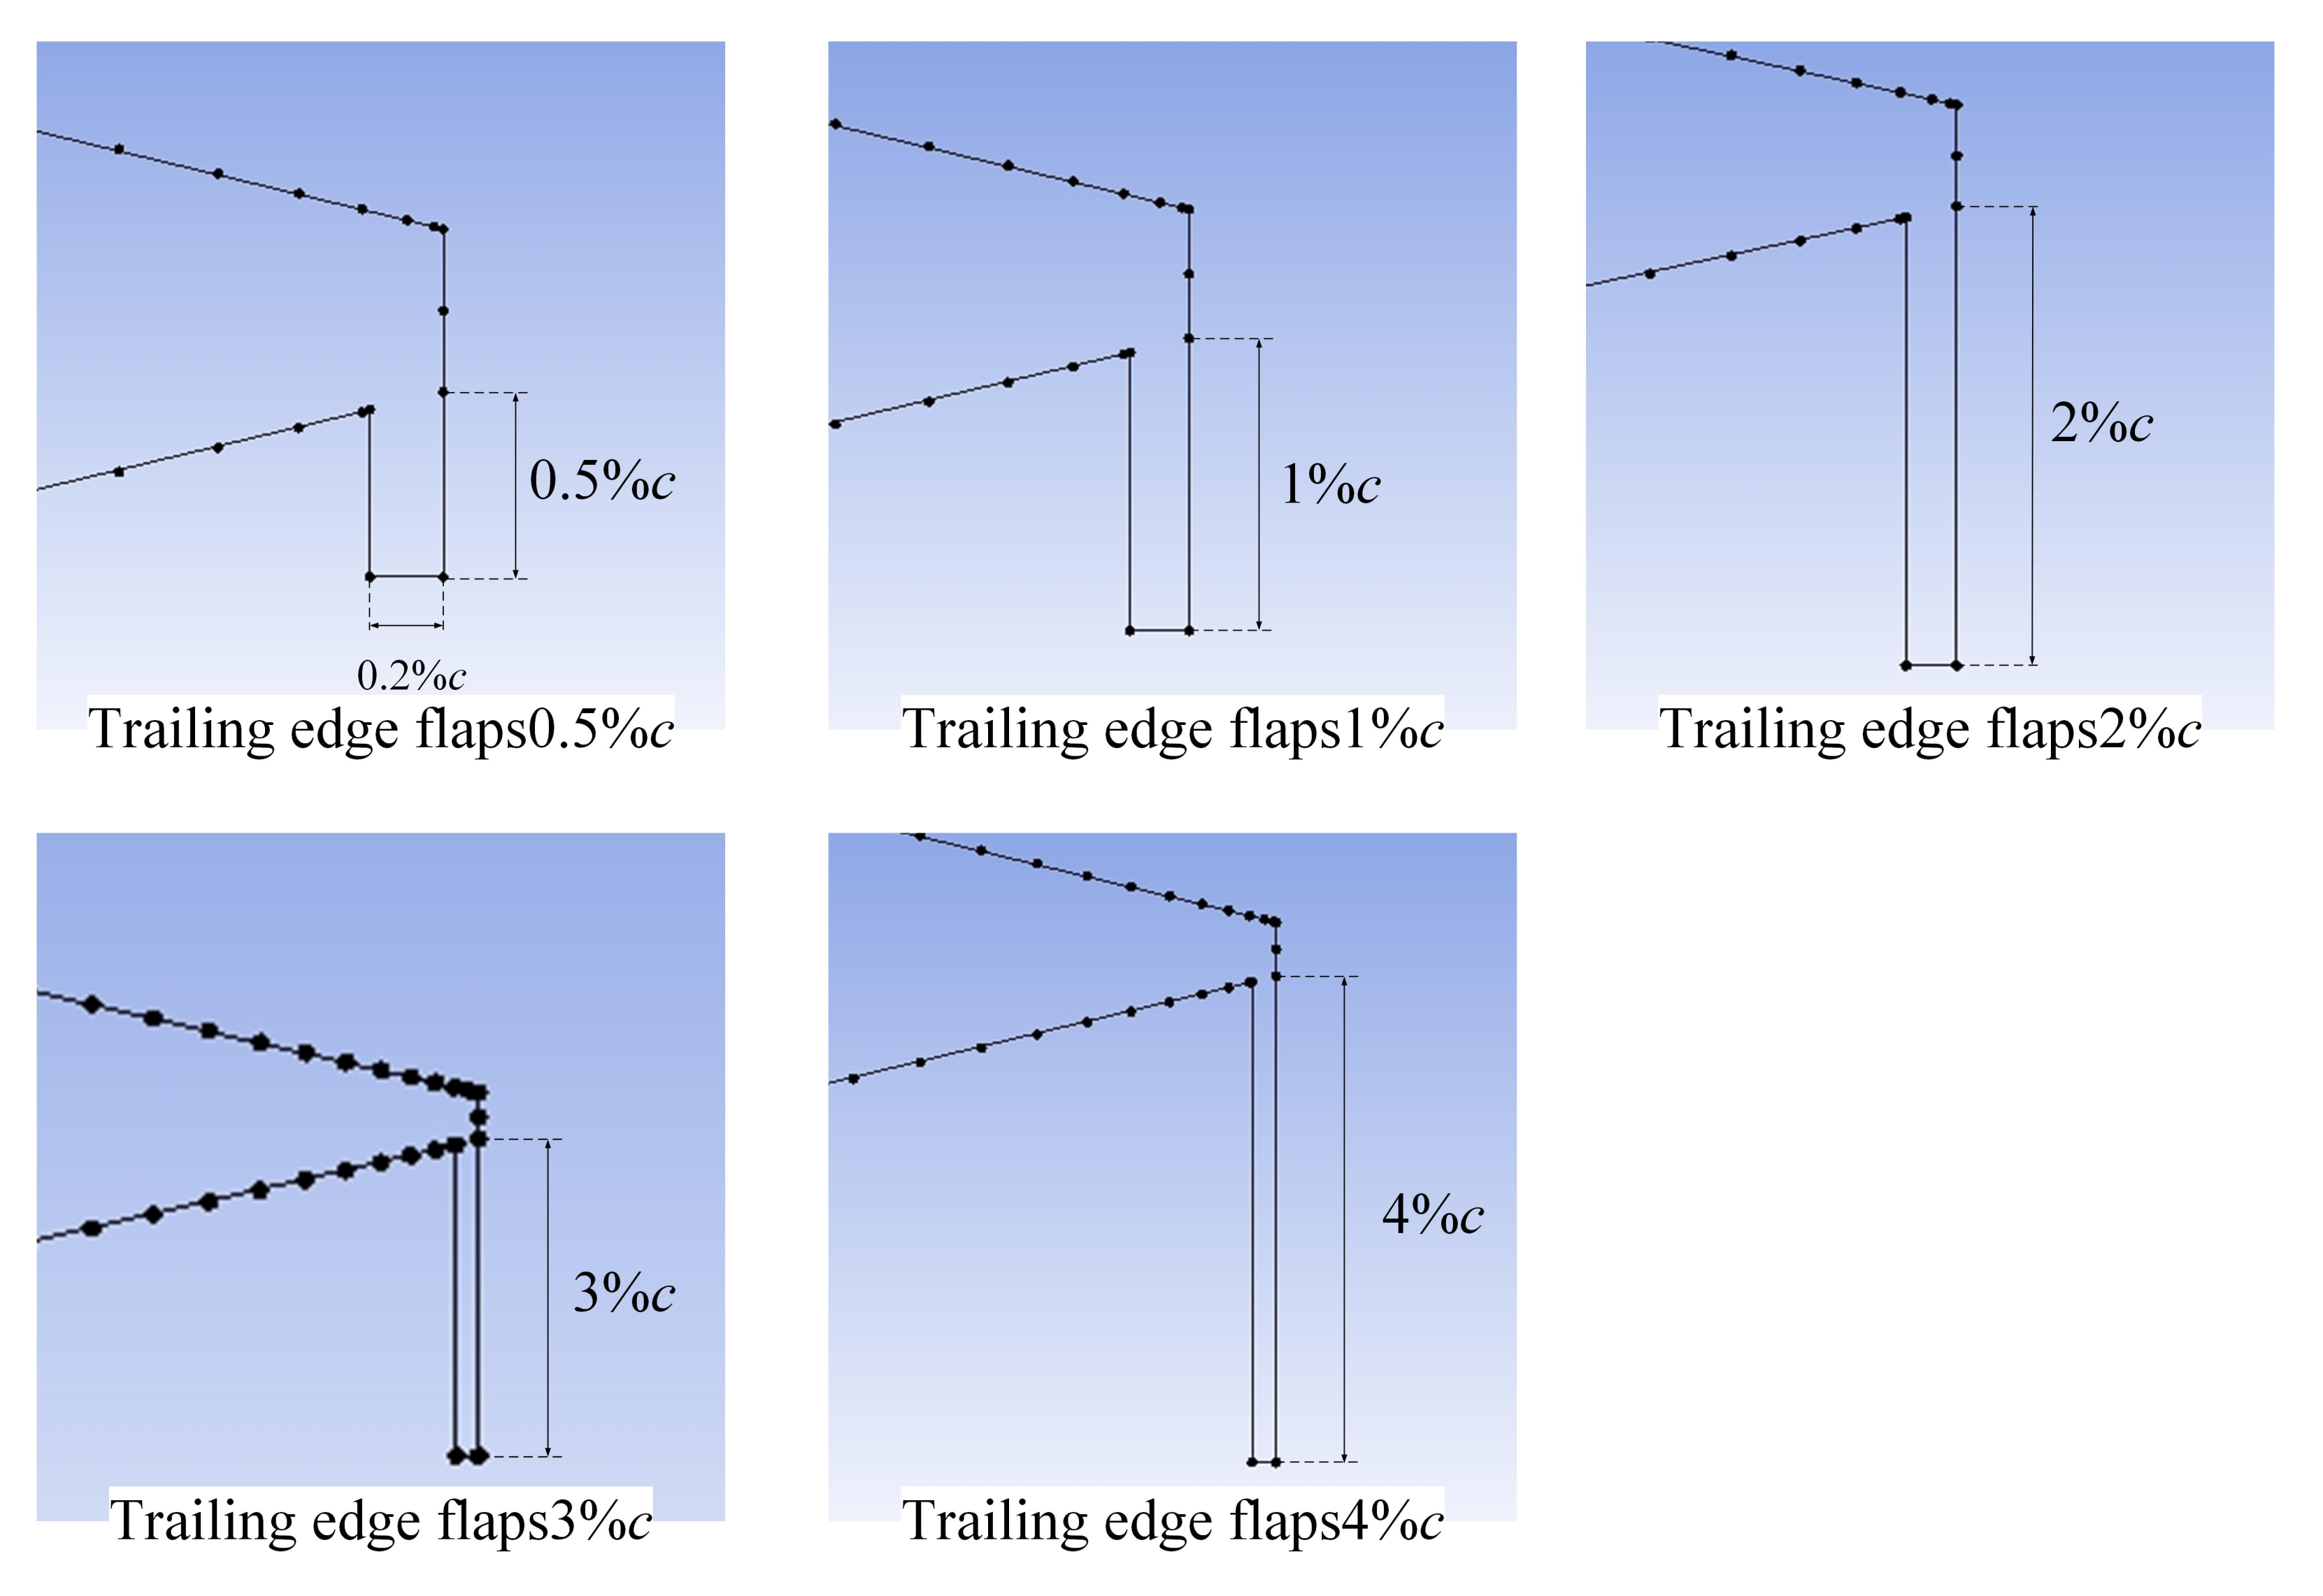
This study stipulates that the length of the flap perpendicular to the chord is called the length of the flap, the length parallel to the chord is called the thickness of the flap, and the angle between the flap and the chord is the angle of the flap.
Figure 12 is a schematic diagram of the trailing edge of flaps with different lengths when the flap angle is 90° and the flap thickness is 0.2% chord length.
A certain length of trailing edge flap can increase the ability of the airfoil to obtain torque and increase the lift of the blade during operation. However, the excessively long trailing edge flap will also hinder the operation of the offshore wind turbine and reduce the performance of the offshore wind turbine. It is necessary to study the length of the trailing edge flap and the length of the trailing edge flap. This study examines the influence of the length of the trailing edge flap on the performance of the H-type vertical axis offshore wind turbine. Based on the chord length c of the airfoil, flaps with lengths of 0.5%c, 1%c, 2%c, 3%c, and 4%c were added to the trailing edge of the airfoil. The thickness of the flaps in the research process is not very important, and all were kept at 0.2%c; then, the research was carried out according to the simulation process in
Section 3. As the structure of the flap part at the trailing edge is relatively complicated, a detailed meshing is carried out at the trailing edge, as shown in
Figure 13. By controlling the nodes of the structural grid, the number of grids in the entire model is roughly the same as the original model.
3.2. Torque Analysis of Airfoil Trailing Edge Flap Length
After we model offshore wind turbines with different flap lengths, Fluent is used for CFD simulation. We obtain the torque coefficient of the vertical axis offshore wind turbine with different flap lengths and compare it with the original model, as shown in
Figure 14.
It can be seen from the figure that the trailing edge flap has a great influence on the vertical axis offshore wind turbine. We trail edge flaps of different lengths change the performance of the wind wheel differently, and most of the modified airfoils have better aerodynamic performance. The offshore wind turbine with 3%c trailing edge flaps has the maximum torque coefficient when < 2.5, and compared with the original NACA0021 airfoil offshore wind turbine, it has a greater improvement; the offshore wind turbine can be used at low speeds. A larger torque is obtained, and the self-starting ability is better. When the tip speed ratio is 2.0, the torque coefficient is 24.85% higher than that of a wind wheel without trailing edge flaps; however, when the airfoil is at the tip speed comparison is in the high state, the torque obtained by the wind wheel decreases slightly. In addition, wind wheels equipped with trailing edge flaps can increase the maximum torque. The trailing edge flap of 0.5%c can enable the wind wheel to obtain greater torque at various tip speed ratios, and the effect of improvement is more obvious. When the tip speed ratio is 2.0, there is a 15.46% increase in performance. The 2%c trailing edge flap does not perform well under the condition of low tip speed ratio, and the self-starting ability is reduced. At high tip speed ratio, the torque coefficient has a certain increase. The 1%c trailing edge flap also has a certain degree of improvement at various tip speed ratios. When the flap length starts from 4%c, although the maximum torque is still 11.82% higher than the original airfoil, when the tip speed ratio is greater than 2.5, the torque obtained is already lower than the original model. By comparing and installing trailing edge flaps of different lengths, the study found that adding 0.5%c and 3%c trailing edge flaps can greatly improve the performance of the wind wheel.
As shown in
Figure 15, after we compare the change of the flap length to the torque coefficient of a single blade, it is found that the addition of trailing edge flaps will make the blade performance in the downwind region (180–360°) more obvious. Among them, the flaps of 0.5%c have the largest lifting range from 180° to 270°, and the flaps of 3%c and 4%c have more obvious lifting effects from 270° to 360°. The addition of trailing edge flaps will also reduce the performance of the blades in the upwind area. Among them, the 4%c flap is the most obvious, and the 0.5%c flap is closer to the original airfoil in this part. Combining the torque coefficient of the two parts, the flaps of 0.5%c and 3%c provide most obvious increase in performance of the offshore wind turbine.
In order to better study the influence of the trailing edge flap on the vertical axis offshore wind turbine, this study studies the power coefficient of the offshore wind turbine under different flap lengths, as shown in
Figure 16.
We add a certain length of trailing edge flap can significantly improve the power coefficient of the wind wheel and the efficiency of the wind wheel. Among them, the rotor power coefficient of the trailing edge flaps of 0.5%c and 3%c has the most significant increase. The average power coefficient of the trailing edge flap of 0.5%c is increased by 9.27% at each tip speed ratio. When the tip speed ratio is 2.5, the power coefficient of the wind wheel reaches the maximum value of 0.3523, which is the maximum power of the wind wheel. The coefficient is 9.89% higher than the original airfoil. The 3%c trailing edge flap has a more obvious increase in efficiency at low tip speed ratios. When the tip speed ratio is less than 2.65, the average power coefficient increases by 18.74%. When the tip speed ratio is 2.5, the maximum power factor has reached 0.3409, which is 6.33% higher than the original airfoil. The 1%c and 2%c trailing edge flaps can also improve the performance of the wind wheel to a certain extent. When the tip speed ratio is less than 2.65, the average power coefficient is increased by 4.36% and 5.80%, respectively. At the point of 2.5, the maximum power coefficient reached 0.3379 and 0.3361, respectively, and the increase was 5.40% and 4.83%, respectively. When the tip speed ratio of the 1%c, 2%c, and 3%c trailing edge flaps is greater than 2.65, the power coefficient of the wind wheel is closer to the original airfoil, and there is no significant improvement. When the trailing edge flap length is 4%c, the power coefficient of the wind wheel is closer to the original model, especially when the blade tip speed is relatively high, the power coefficient has been greatly reduced, indicating that the flap length is from 4%c. In the beginning, the trailing edge flaps are too long, resulting in a significant hindrance to the wind wheel. Therefore, this study found that when the flap length is less than 4%c, the addition of trailing edge flaps can improve the aerodynamic performance of the vertical axis offshore wind turbine, especially the self-starting ability of the offshore wind turbine. Among them, the airfoils with the trailing edge flaps of 0.5%c and 3%c have achieved ideal performance.
3.3. Velocity Analysis of the Length of Airfoil Trailing Edge Flaps
Figure 17 is compared to the streamline diagram at the trailing edge of the blade with 240° after it is added flaps. The additional trailing edge flaps play a role in guiding the flow at the trailing edge of the blade, and the flow field around the blade changes. The flaps increase the contact area of the tail, which can attract more airflow and obtain greater thrust. Especially when the blades are in the downwind area, the increase in airflow pushes the blades to rotate, and the performance of the offshore wind turbine is improved more obviously. In the upwind area, the flaps will increase the resistance to the rotation of the blades, and the torque obtained at this time will be slightly reduced.
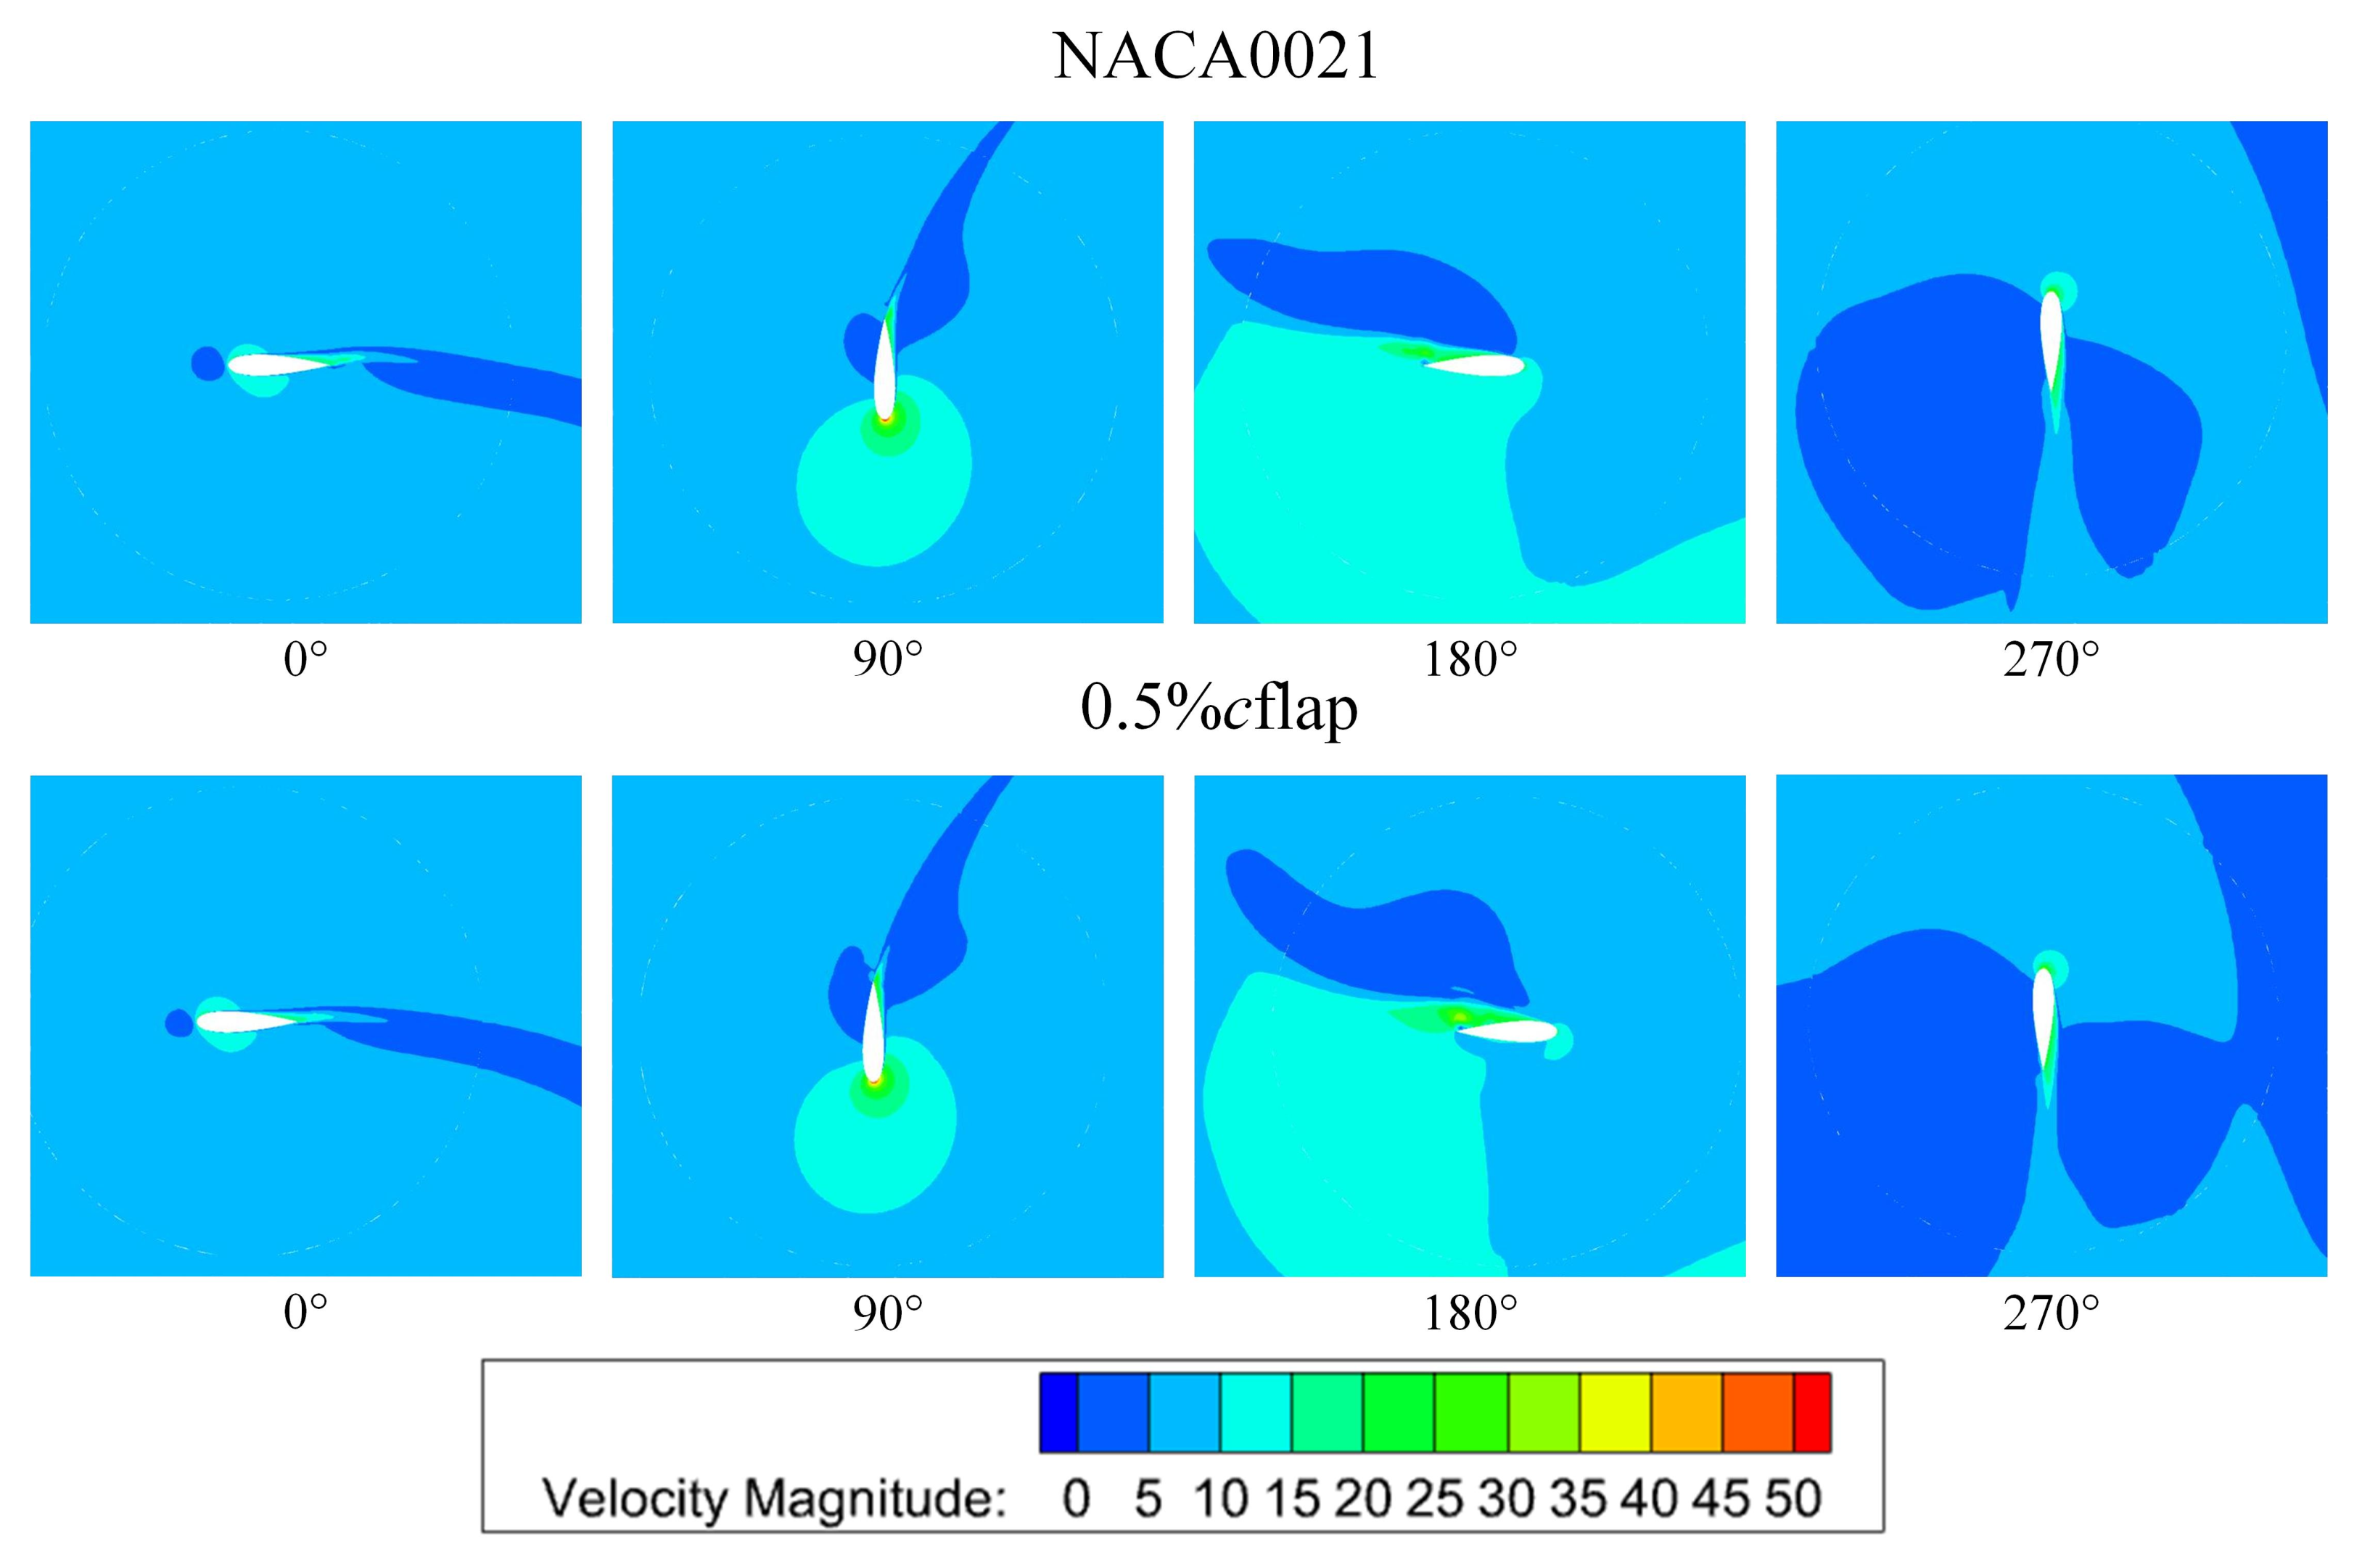
Figure 18 is compared to the airfoil with 0.5%c trailing edge flaps. When the tip speed ratio is 2.0, it is found that the trailing edge flaps can bring great changes. When the azimuth angle is 0°, the flap can reduce the low-speed vortex at the leading edge of the airfoil, at the same time, the high-speed zone inside and outside the leading edge of the blade becomes uniform, and the high-speed zone at the tail of the blade becomes smooth. With the rotation of the wind wheel, the speed of the leading edge of the airfoil increases, and the low-speed field gradually spreads to the trailing edge and middle of the blade. When the blade rotates to 90°, the middle and both sides of the tail gradually begin to be covered by the low-speed zone. In fact, in the first half of the rotation of the blades, the changes brought about by the trailing edge flaps are not obvious. At 180°, the speed around the airfoil begins to have a big difference. The installation of trailing edge flaps makes the high wind speed concentrated on the inner side of the trailing edge of the blade, and the color of the outer wind speed is obviously lightened, forming a large wind speed difference, which is beneficial to drive the blade to rotate. When the blade rotates to 270°, the low-speed area on both sides of the blade is larger due to the influence of the trailing edge flap.
After we install the 0.5%c trailing edge flap, the vortex generated by the rotation of the wind wheel is reduced. In
Figure 19, it can be clearly seen at approximately 180° that the trailing edge flaps make the shed vortex smoother and reduce its strength. The trailing edge flaps play a role of diversion, making the vortex closer to the inside of the wind wheel, and affect other vortices. The influence of the blades is reduced. Around a single blade, the strength of the vortex has been reduced to a certain extent, which is more obvious at azimuth angles of 120° and 150°. At azimuth angles of 300° and 330°, the vortex shed from the tail of the blade is connected in a line, which has little disturbance to the flow field inside the wind wheel. This study has found that adding trailing edge flaps can effectively improve the flow field inside the wind wheel, and the performance of the wind wheel is improved.
3.4. Pressure Analysis of the Length of Airfoil Trailing Edge Flaps
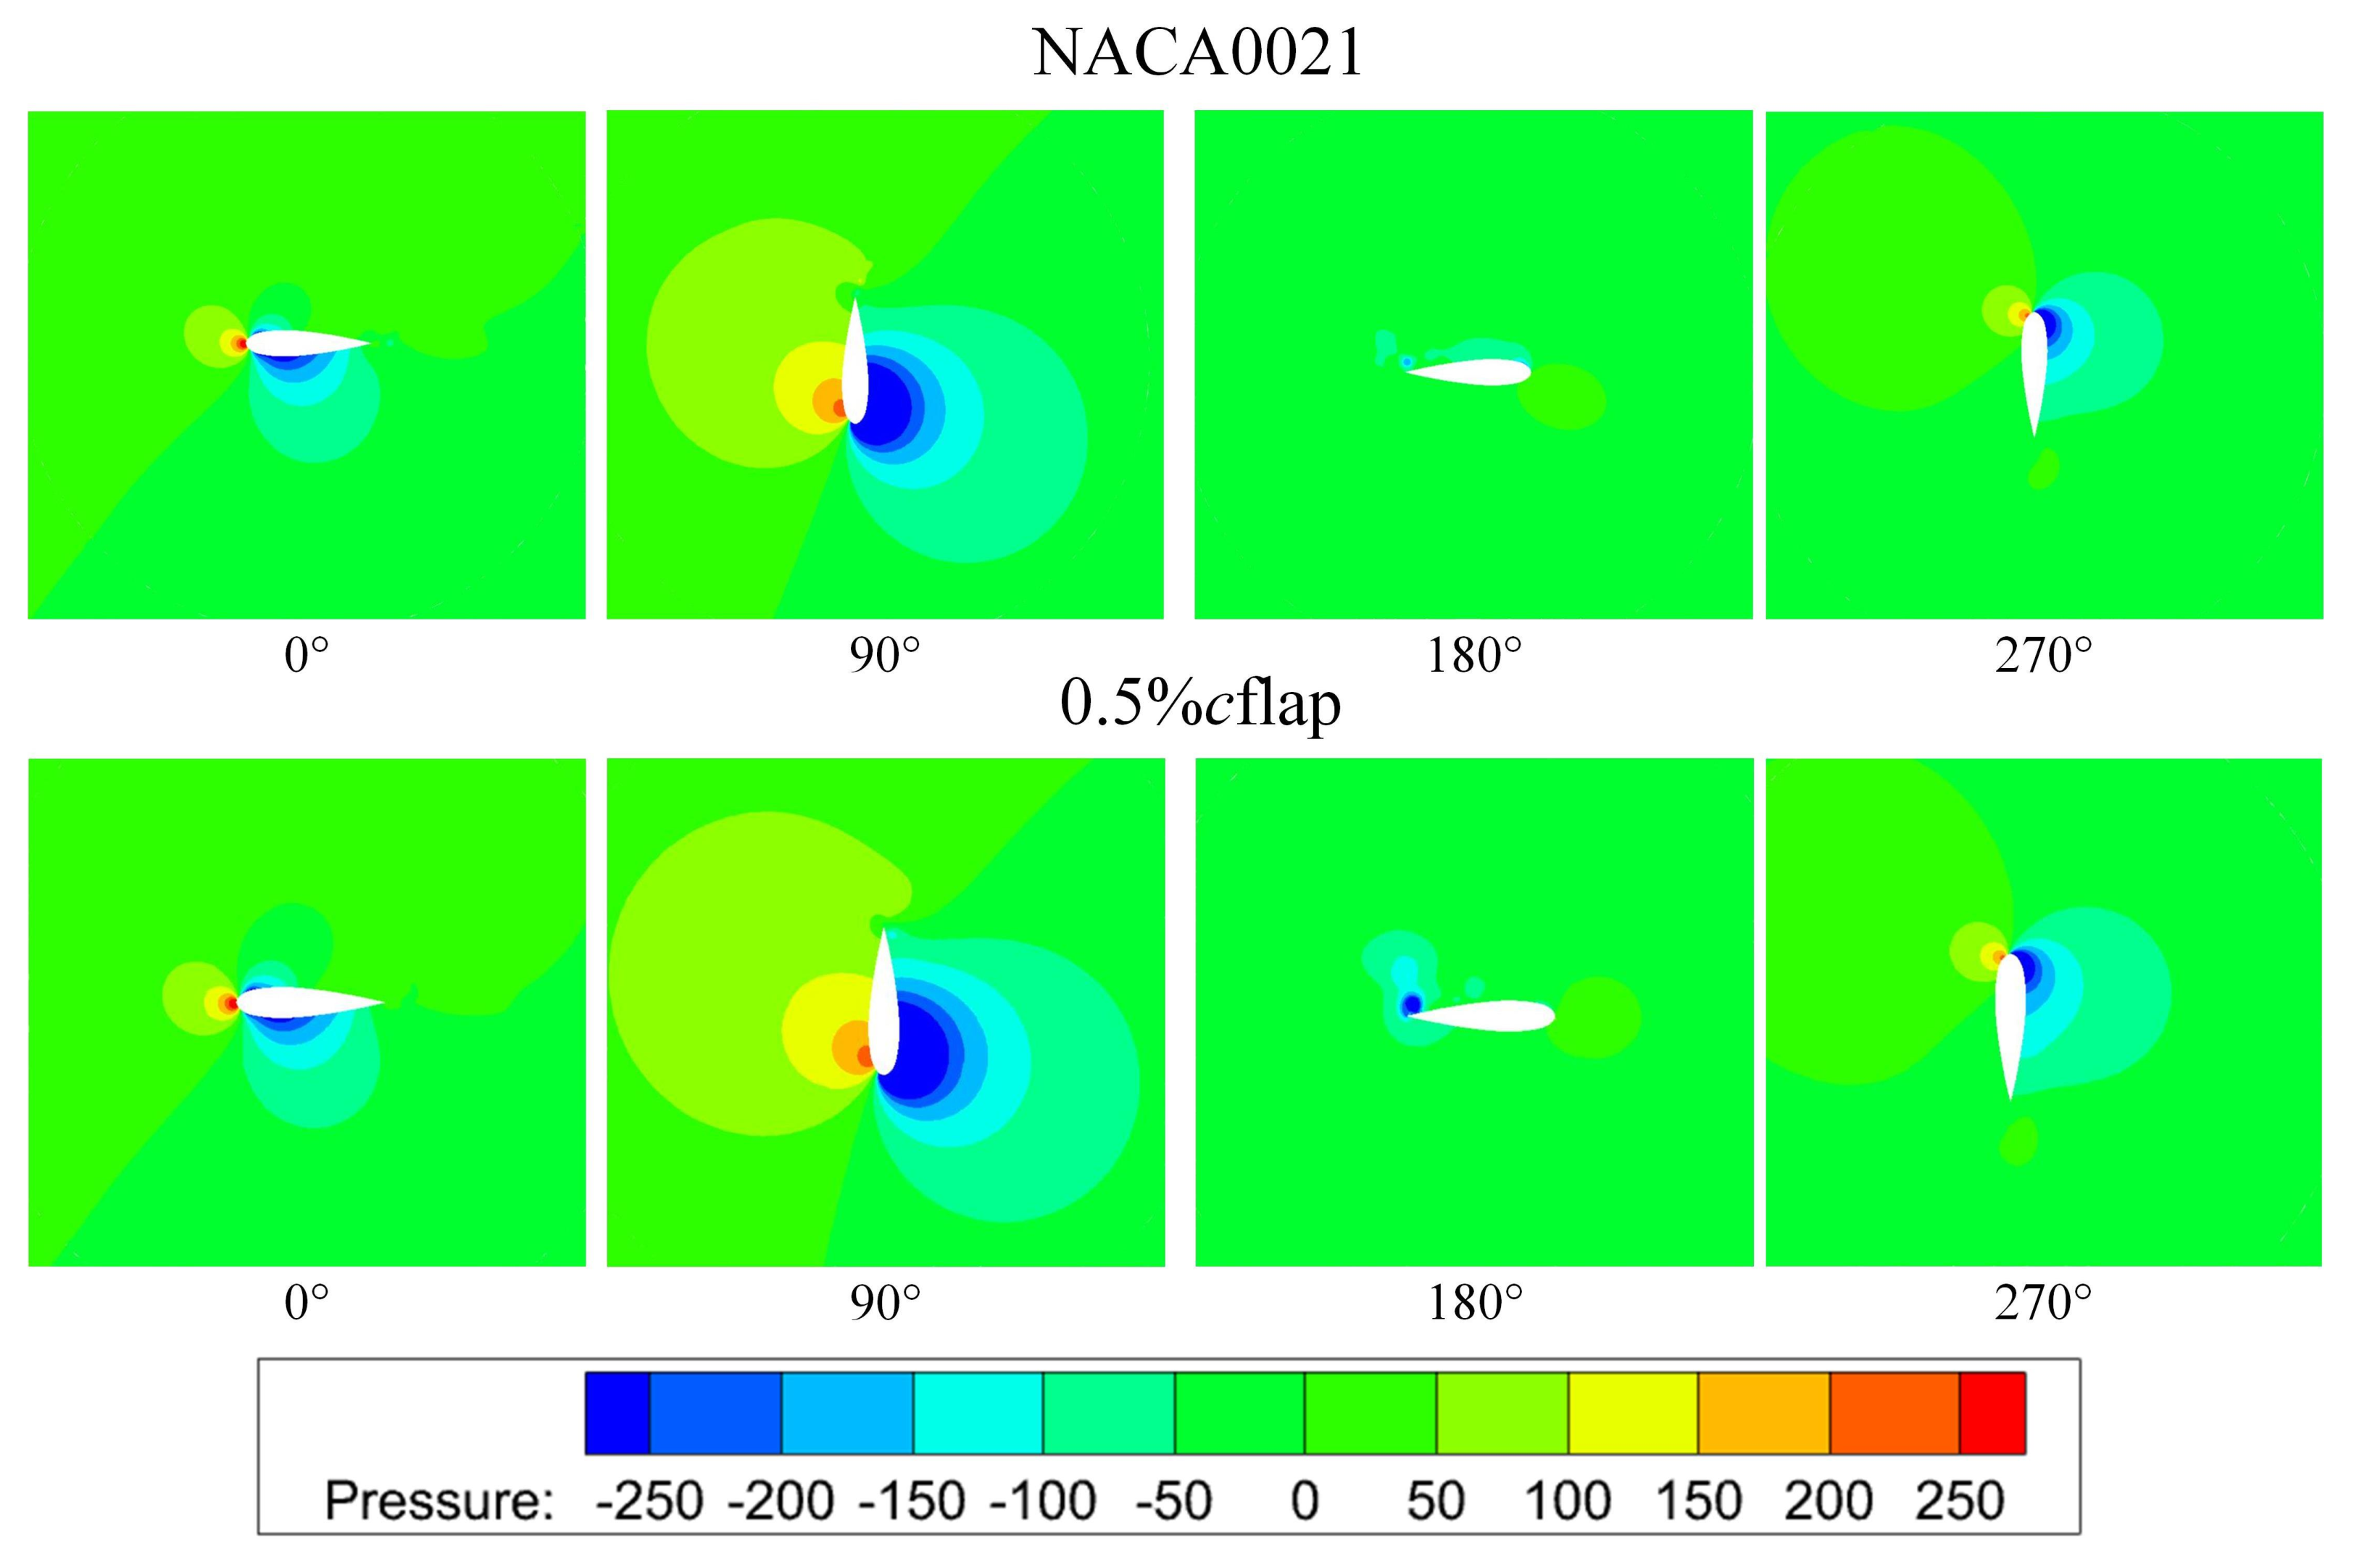
Figure 20 shows the pressure change around the airfoil with the addition of 0.5%c trailing edge flaps. At azimuth angle of 0°, the negative pressure area inside the blade spreads to the inside of the wind wheel. During the 0–90° rotation, the negative pressure zone and high pressure zone spread to both sides of the blade. At 90°, the trailing edge flap increases the pressure difference on both sides of the blade, and the negative pressure extends to the trailing edge of the blade. When the blade continues to rotate, at 180°, the flap creates a dark blue negative pressure vortex on the trailing edge of the blade. When the blade rotates to 270°, the negative pressure area outside the blade increases, and the pressure difference becomes larger, which is beneficial to the offshore wind turbine to obtain lift.
3.5. Design of Airfoil Trailing Edge Flap Angle
After we study the influence of the trailing edge flap and the length of the flap on the vertical axis offshore wind turbine, this study finds that the trailing edge flap of appropriate length can guide the blades. When we study the length of the flaps, the flap angles are all 90°. This study finds that when the flap length is 0.5%c and 3%c, the aerodynamic performance of the wind wheel is improved significantly. In this section, keeping the flap length at 0.5%c and set the flap angle to 0°, 22.5°, 45°, 67.5°, and 90°, respectively. We study and compare wind wheels with flaps of different angles. The schematic diagram of the airfoil of different angle flaps is shown in
Figure 21. After the flap angle is changed, the division of the grid needs to be adjusted to a certain extent, while ensuring the quality of the grid, the number of grids is approximately equal. The grid near the flaps is shown in
Figure 22.
3.6. Torque Analysis of Airfoil Trailing Edge Flap Angle
The wind wheels are modeled with flaps and different trailing edge angles. We divide the grid and carry out numerical calculations for each model under different tip speed ratios, and then compare the results with the NACA0021 airfoil wind wheel.
Figure 23 shows the comparison of the calculated trailing edge flap angle torque coefficient.
The difference in the angle of the flap makes the torque coefficient of the wind wheel different. When the flap angle is 90°, the torque coefficient of the wind wheel at each tip speed ratio is the highest. At this time, the wind wheel obtains the highest torque during operation, and the wind wheel has the best aerodynamic performance. When = 2, only when the flap angles are 45° and 90°, the torque coefficient of the wind wheel is larger than that of the original NACA0021 airfoil. At this time, the airfoil structure can improve the self-starting ability of the wind wheel. Wind wheels with other flap angles and airfoils will reduce the self-starting ability of the wind wheels. When 2, except for the airfoil with a flap angle of 0°, which cannot make the wind wheel obtain greater torque, other airfoils can increase the torque of the wind wheel, which will cause the wind wheel to increase the torque at this time. The performance has been improved. The torque coefficient decreases as the flap angle decreases, and the aerodynamic performance of the wind wheel also deteriorates as the flap angle decreases. The airfoil with flap angles of 90°, 67.5°, 45°, and 0° can improve the performance of the wind wheel to different degrees. The torque coefficient of the airfoil with flap angle of 22.5° is in the case of each tip speed ratio. The lower airfoil is slightly smaller than NACA0021 airfoil, and the performance of the wind wheel decreases.
Figure 24 shows the comparison of the torque coefficients of a single blade when the tip speed ratio is 2.65.
The 22.5° flap minimizes the torque obtained by the blade. The 0° flap can make the blades obtain higher torque in the upwind area, but the increasing in the downwind area is not very obvious. The flaps of other angles are not much different from the original airfoil in the upwind area, but they are significantly improved in the downwind area, especially the 90° flaps have the largest increase in performance, and the range of negative torque is reduced. The 90° flap can obtain the largest torque in one cycle, which makes the performance improvement the most obvious for the vertical axis offshore wind turbine.
The comparison of the angle power coefficient of the trailing edge flap is shown in
Figure 25. The maximum power coefficient of wind wheels equipped with trailing edge flaps all appear when the tip speed ratio is 2.5, and the maximum power coefficient changes with the change of the flap angle. The trailing edge flaps with flap angles of 90°, 67.5°, 45°, and 0° increase the maximum efficiency of the wind wheel by 9.89%, 5.12%, 5.80%, and 4.90%, respectively. When the flap angle is 22.5°, the maximum The power factor is slightly lower than the original model. When
2.5, except when the flap angle is 22.5°, the power coefficient of the wind wheel decreases slightly, and the airfoil with other flap angles can maintain the aerodynamic performance of the wind wheel at a higher level. When
is in the interval [2, 3.3], the trailing edge flaps with flap angles of 0°, 45°, 67.5°, and 90° can increase the power coefficient of the wind wheel by an average of 4.86%, 6.55%, 1.27%, and 7.97%, respectively. When the flap length is 0.5%c, an airfoil with a flap angle of 90° can maximize the performance of the vertical axis offshore wind turbine, which not only improves the self-starting ability of the offshore wind turbine, but also increases the maximum efficiency of the offshore wind turbine by 9.89%; the power coefficient when
is in the interval of [2, 3.3] increases by 7.97% on average. In addition, the trailing edge flaps with flap angles of 67.5°, 45° and 0° can also improve the aerodynamic performance of the wind wheel to varying degrees. The trailing edge flaps with a flap angle of 22.5° make the wind performance of the wheels slightly reduced.
3.7. Velocity Analysis of the Angle of the Airfoil Trailing Edge Flap
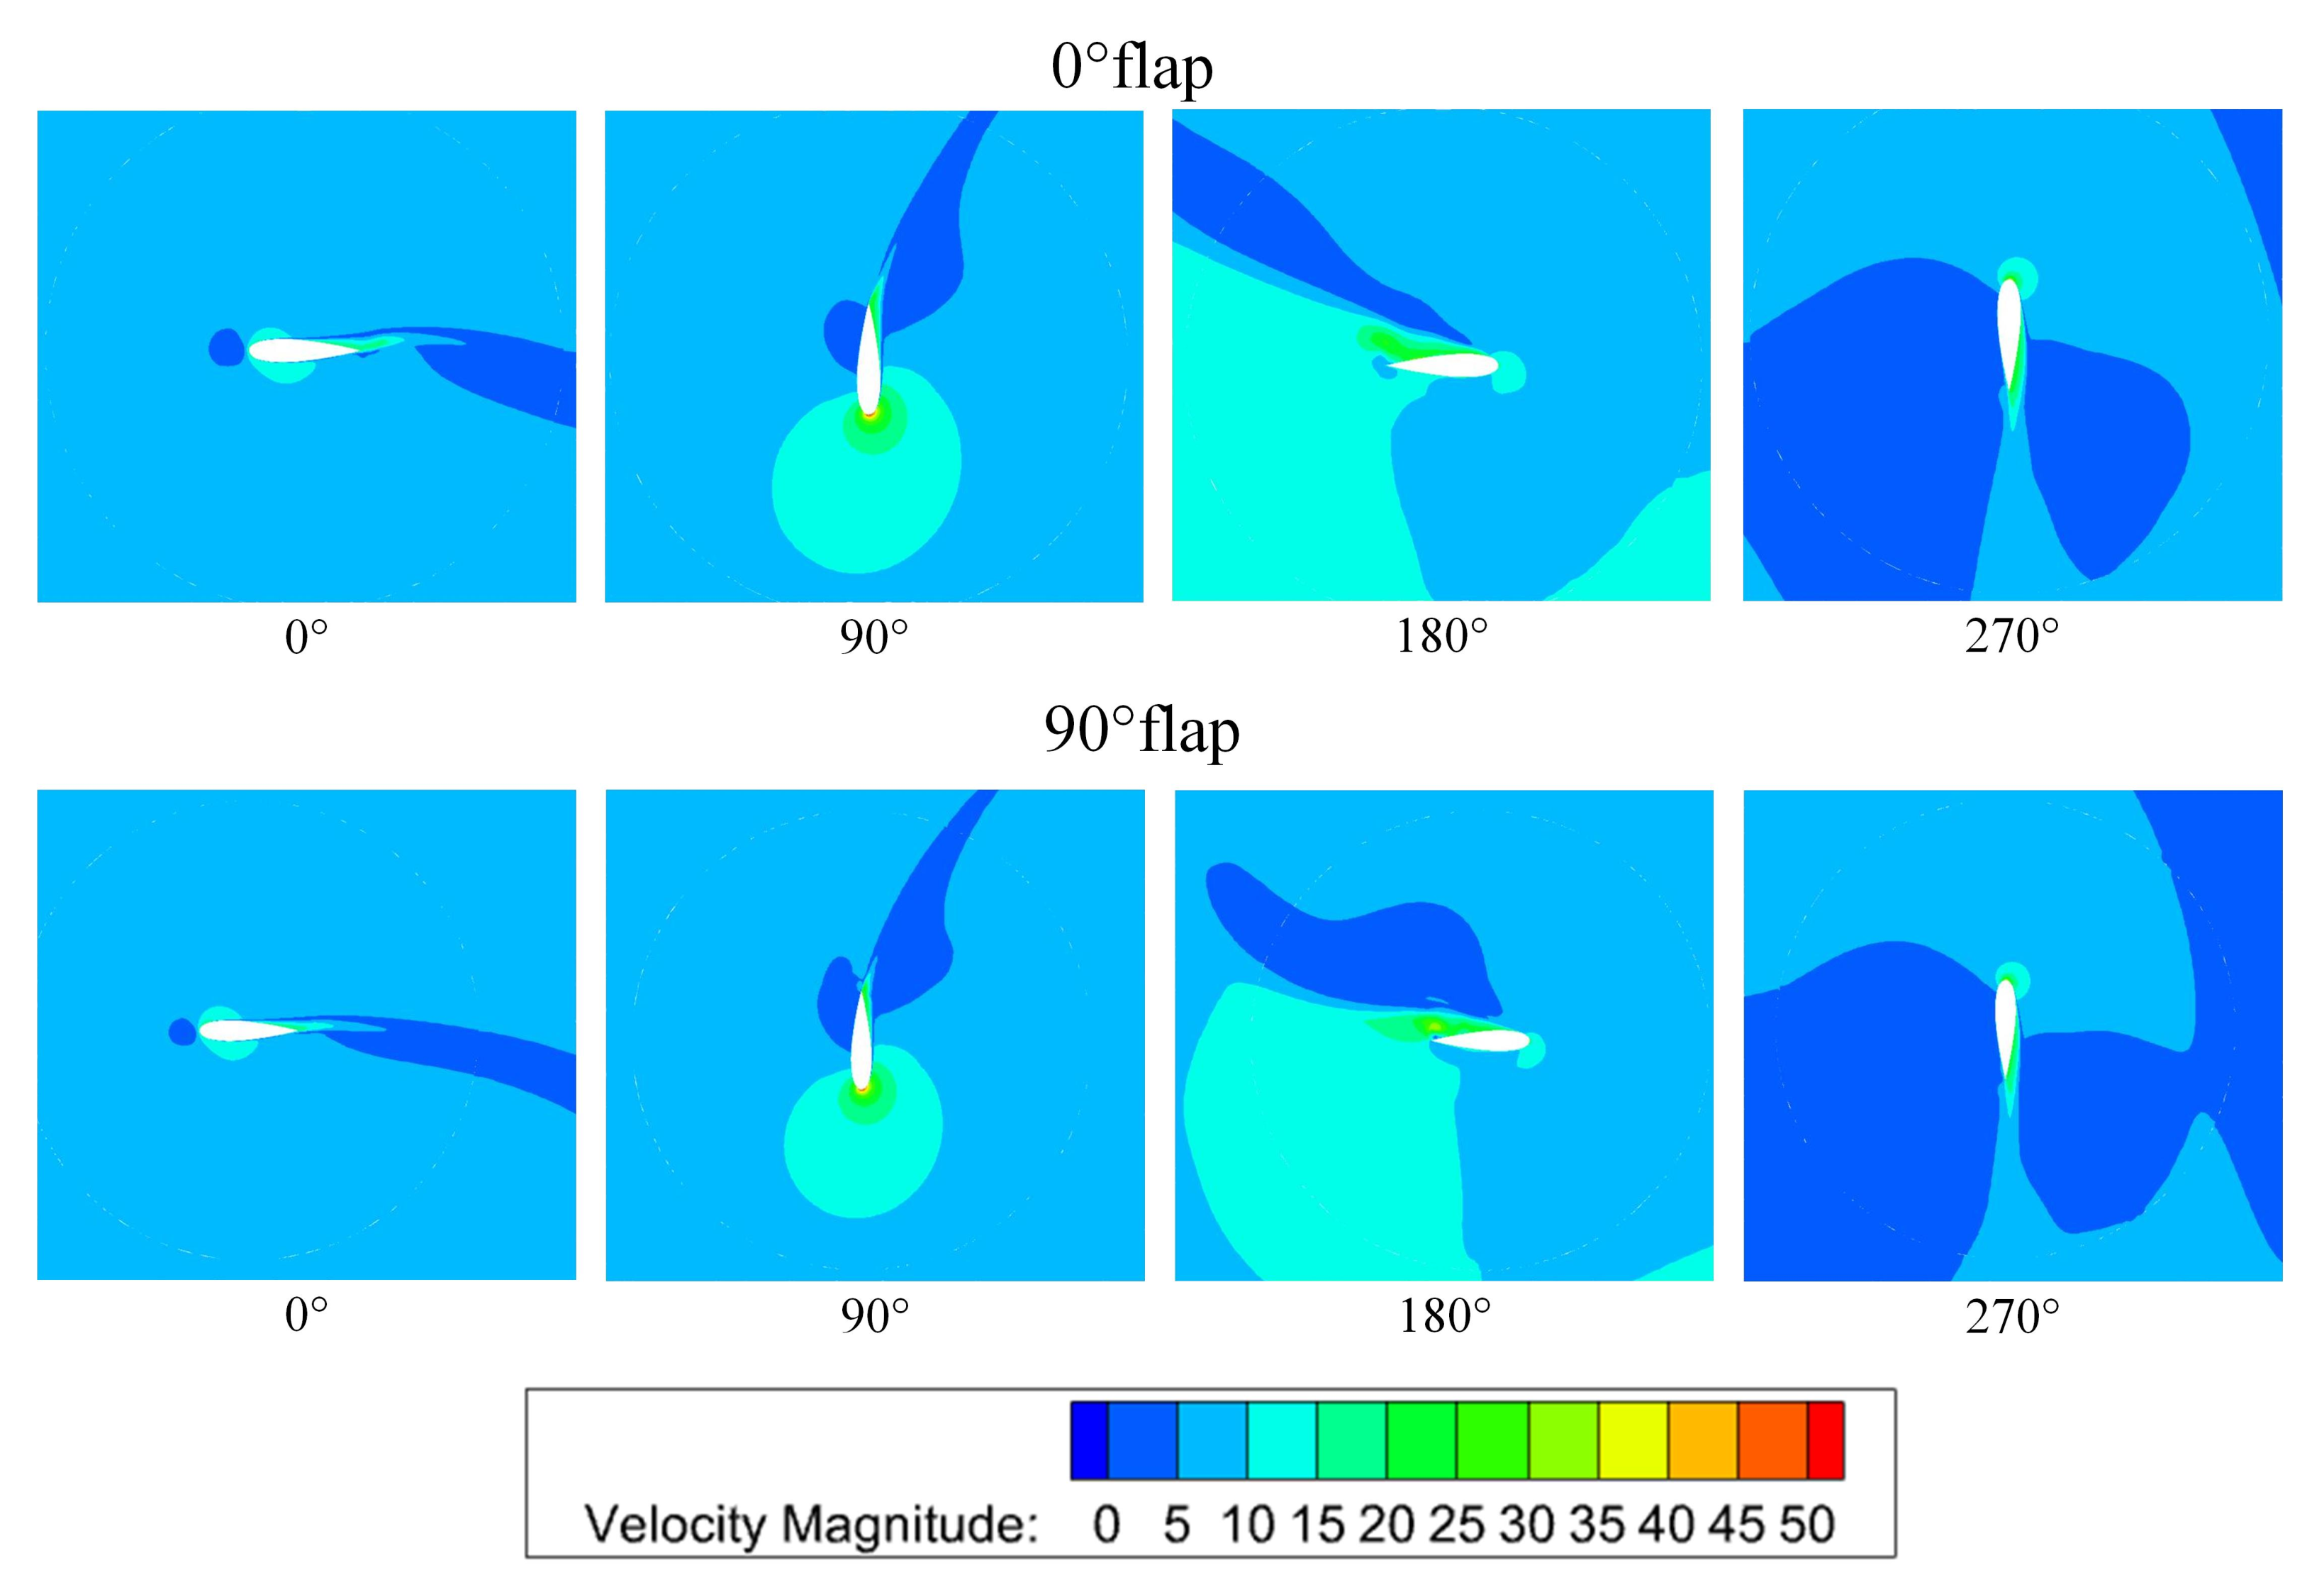
Figure 26 shows the comparison of the velocity clouds around the blades with 0° flaps and 90° flaps at 9 m/s. At azimuth angle of 0°, the blades with 0° flaps are affected by the flaps, causing the high-speed vortex at the outer tail of the blade to be somewhat turbulent, and the flaps obstruct the wind more obviously. When the azimuth angle is 90°, the high-speed vortex at the front end of the blade of the 90° flap is slightly reduced, and the low-speed area on the outside extends to the tail. When the blade rotates to 180°, the low-speed region of the trailing edge of the 90° flap is concentrated at the trailing edge flap. The inner side of the blade is covered by the high-intensity high-speed flow, and the low-speed region on the outer side of the blade has a wider range, which is conducive to the large size of the blade. At this time, the trailing edge of the blade with the 0° flap has obvious low-speed vortices. At azimuth angle of 270°, the high-speed vortex on the outside of the blade is slightly reduced, while the low-speed vortex extends to the outside.
Figure 27 shows the comparison of the vorticity field in a cycle inside the offshore wind turbine blades with 0° flaps and 90° flaps.
Comparing the vortices of the two airfoils, it is found that the blades of the 0° flap, the length and width of the vortex formed at the tail of the blade are significantly smaller than the blade of the 90° flap in operation, and the vortex strength is reduced. The generated vortex has less influence on the next blade, which is conducive to the good aerodynamic performance of the vertical axis offshore wind turbine. The 0° flap is equivalent to increasing the length of the blade, making the vortex closer to the next blade, and greatly disturbing the flow field around the blade.
3.8. Pressure Analysis of Airfoil Trailing Edge Flap Angle
Figure 28 shows the pressure distribution around the blade when the trailing edge angle is different. The change of pressure field is obvious at 90° and 180°. When the azimuth angle of the 90° flap blade is 90°, the negative pressure inside the blade decreases, the positive pressure range on the outside of the blade increases significantly, the positive pressure zone of the blade extends to the tail end, the pressure difference between the two sides increases, and the torque obtained increases. When it reaches 180°, a dark blue negative pressure vortex appears on the trailing edge of the blade of the 90° flap. The negative pressure increases, and the torque of the blade increases at the same time.
4. Conclusions
This study examines the H-type vertical axis offshore wind turbine and expounds the development history and research status of the vertical axis offshore wind turbine. At the same time, the theories and commonly models used for the study of vertical axis offshore wind turbines are introduced, and the principles of the operation of vertical axis offshore wind turbines are explained. The blade is the carrier for the offshore wind turbine to obtain power. Based on the NACA0021 airfoil, the structure of the blade is modified in this study to improve the self-starting ability and wind energy capture rate of offshore wind turbine.
On the NACA0021 airfoil trailing edge, flaps of different lengths and angles are added. We add flaps with lengths of 0.5%c, 1%c, 2%c, 3%c, and 4%c and angles of 0°, 22.5°, 45°, 67.5°, and 90° on the trailing edge of the airfoil, respectively. We have found that an offshore wind turbine with a flap length of 0.5%c and a flap angle of 90° has greatly improved self-starting ability. When the tip speed ratio is 2.0, the torque coefficient is increased by 15.46%. The trailing edge flap also improves the conversion efficiency of the offshore wind turbine. When the tip speed ratio is increased from 1.2 to 3.3, the average power factor is increased by 9.27%, and the maximum power factor of the offshore wind turbine is increased by 9.89%.
In this study, the self-starting ability and wind energy capture rate of offshore wind turbines have been improved through the modification of the blade and wind wheel structure. In future work, in-depth research can also be carried out in the following areas.
- (1)
The simulation of a three-dimensional model is less focused on in this study. This is because there is a lot of work done in this article, the calculation of the three-dimensional model requires too much calculation time and computing resources, and the three-dimensional comparison is not significantly different from the two-dimensional comparison. Sufficient time is needed for three-dimensional research, and we aim to conduct 3D research in future works.
- (2)
Due to the limitation of experimental conditions, this study compares the experimental data of other scholars with the results of numerical simulations without experimental verification.
- (3)
Despite the extensive literature on the importance of uncertainties in CFD-based optimization of airfoils, there remain multiple sources of uncertainties, such as using 2-D CFD simulations for a 3-D system, uncertainties from the turbulence model, the errors due to numerical meshes, etc.
These new explorations will be presented in future research work being processed by authors of the present paper.


