Article

Does Job Satisfaction Influence the Productivity of Ride-Sourcing Drivers? A Hierarchical Structural Equation Modelling Approach for the Case of Bandung City Ride-Sourcing Drivers

1
Department of Civil Engineering, Faculty of Engineering, Universitas Katolik Parahyangan, Bandung 40141, Indonesia
2
Department of Civil Engineering, Institut Teknologi Nasional Bandung, Bandung 40124, Indonesia
3
School of Transportation Sciences, Hasselt University, 3500 Hasselt, Belgium
*
Author to whom correspondence should be addressed.
Sustainability 2021, 13(19), 10834; https://doi.org/10.3390/su131910834
Submission received: 3 September 2021 / Revised: 21 September 2021 / Accepted: 26 September 2021 / Published: 29 September 2021
(This article belongs to the Special Issue Shared Mobility and Sustainable Transportation)

Abstract

:
With various benefits being offered by ride-sourcing companies, Indonesian cities have experienced a substantial increase in the number of ride-sourcing drivers in the past five years. However, with tense working conditions, there is a question as to how drivers perceive their work satisfaction and how this satisfaction influences their productivity. This study aims to investigate the factors that influence ride-sourcing drivers’ job satisfaction and productivity. For this purpose, a questionnaire was distributed to ride-sourcing drivers in 2019 and analysed using hierarchical structural equation modelling (SEM). Wage competitiveness and financial safety are found to be appreciated the most by ride-sourcing drivers, while undertaking multiple jobs tends to be associated with low satisfaction. Satisfaction is also found to positively influence trip productivity. Drivers who perceive themselves as being exposed to health and safety risks tend to have lower satisfaction.

1. Introduction

Various cities around the world have witnessed a rise in mobility-on-demand platforms in this decade [1,2,3]. Within the cities’ mobility and transport ecosystems [4], these platforms have also created opportunities for the cities’ economies by providing new jobs for residents [5]. Indonesia is among the countries with the highest growth in mobility-on-demand services, such as ride-sourcing: one city was involved in 2013 and 50 cities in 2018 [2]. The popularity of ride-sourcing attracted more than 2 million drivers in 2019 [6]. The services characterize a sharing economy [1], with the drivers sharing their assets (e.g., car, motorcycle) for the services; the drivers are responsible for the maintenance of their own vehicles [5,7]. However, these characteristics have raised tension about the working environment of the drivers, potential job dissatisfaction, and consequently, productivity and risks to service quality, safety and security [7,8,9], including work-related stressors [10]. Therefore, questions have been raised as to how ride-sourcing drivers perceive their job and how this relates to possible service issues and potential policy in developing a more sustainable urban mobility policy, especially in developing countries. This research question is rooted in the argument that the performance of drivers is important as it influences passengers’ satisfaction and loyalty, including perceived vehicle and driver-related risk [11].
The links between satisfaction, productivity, and determinants of satisfaction and productivity have been widely investigated in earlier works. Halkos and Bousinakis [12] found that increased stress leads to reduced productivity and increased satisfaction leads to increased productivity for workers of private and public sector employers. In the transport sector, a study by Kwon et al. [13] in Korea indicated that job satisfaction is the key determinant in ensuring the safety of the trip. They found that bus drivers’ job satisfaction is influenced by working conditions, including the driving experience, work pressure related to road conditions, and supporting infrastructure. Boyce [14] found that health issues in truck drivers affect safety, including physical stress. While most studies of the links between satisfaction and productivity have been investigated, little is known about the ride-sourcing sector.
Most of the studies on ride-sourcing have undertaken the analysis from the demand side (users), such as the implications of ride-hailing for mode choice [3,15,16], usage behaviour [2], environmental sustainability [17], and vehicle kilometres travelled [18]. Some studies also attempt to explain the supply-side approach of ride-sourcing [19,20,21,22,23], where the analysis focuses on drivers’ satisfaction, and their productivity is rarely investigated. The driver is at the centre of the service since they have a substantial role in the trip decision or provide quality of service. Notable studies to investigate characteristics, behaviour and preferences were carried out by Ashkrof et al. [7] in the Netherlands, and Fielbaum and Tirachini [9] in Chile. However, the investigation clusters linking job preferences (including job satisfaction) and operational or productivity behaviour remain missing. Research becomes even more limited when looking for studies from developing countries.
This study aims to investigate the influence of ride-sourcing drivers’ job satisfaction on productivity. In particular, the study aims to contribute in three ways: by revealing the factors that affect ride-sourcing drivers’ job satisfaction and productivity; by investigating the relationship between job satisfaction and the productivity of ride-sourcing drivers; and by investigating ride-sourcing drivers using empirical data from a developing country (Indonesia). To achieve those objectives, a questionnaire was distributed to ride-sourcing drivers in 2019 in Bandung, Indonesia. To reveal the factors that influence job satisfaction and drivers’ productivity, this study captures the benefits and drawbacks of working as a ride-sourcing driver and the attitude of ride-sourcing drivers towards working behaviour. This study employs hierarchical structural equation modelling (SEM) [24] as the research method.
The remainder of the paper is structured as follows. Section 2 presents the literature review about ride-sourcing drivers, followed by the research method in Section 3, describing the collection of data and respondents’ characteristics. The model estimation is presented in Section 4, followed by the discussion and conclusions.

2. Job Satisfaction and Outcome of Ride-Sourcing Drivers

Aside from the mobility and customer aspects of the ride-sourcing industry, ride-sourcing drivers’ experiences have begun to gain attention among researchers in the past years [18,25,26]. The industry has grown dramatically over the past decade all over the world. The most recognisable examples of companies in this industry include Uber and Lyft from the United States, Didi Chuxing from China, Grab from Malaysia, and Gojek from Indonesia. As this industry is known as one of the centrepieces of the so-called “gig economy”, ride-sourcing business rests upon a partner relationship approach instead of a general employer–employee relationship when defining the relationship between the company and its drivers. This partner relationship grants a driver some freedom when arranging their working time [27,28]. On the one hand, this industry creates an opportunity to supply the market demand for employment as drivers for ride-sourcing. On the other hand, the industry creates tough competition between incumbent drivers of taxis or other kinds of community transport [22], including public transport. It also attracts a range of motivations and strategies from drivers, ranging from incidental or part-time to full-time driving [29].
Bearing this in mind, scheduling flexibility plays the most pivotal role in motivating ride-sourcing drivers in different countries for them to perceive their occupation as a satisfying job [18,25,26]. It is noteworthy that flexibility has been recognized as an exceptionally valuable attribute among the workers: a previous study found that an average worker is willing to pay up to 20 per cent of their salary in exchange for work with no short notice scheduled and 8 per cent for working from home [30]. Hall and Krueger [27] mentioned that drivers are attracted to scheduling flexibility as it seemingly allows them to gain a surplus from multiple-source of income as a ride-sourcing driver, whether as a part-time or even a full-time worker in working places. Moreover, since there is no formal limit on the number of apps that can operate fleets of drivers in the city, there may be a considerable overlap between fleets, with some drivers belonging to more than one [22]. Thus, multiple drivers take shifts to keep a ridesharing car in constant service [31].
At first glance, the possibility of having income or productivity as a ride-sourcing driver seems to be an intriguing benefit. Anderson [29] argued that the monetary incentive of for-profit ridesharing encourages a number of drivers to treat ridesharing as a job, equivalent to that of driving a taxi. However, ride-sourcing drivers have found their take-home income from driving to be lower than their expectations, which is the least satisfying attribute of their job. The variation of spatial and temporal working conditions, including the dispatching and pricing scheme, determines operational and driver performance, which creates systematic disparities in drivers’ earnings [32] and influences drivers’ satisfaction. One reason for this income disparity is how ride-sourcing platforms display drivers’ travelled kilometres, which will further determine the drivers’ income [9,18]. Drivers in the same location experienced disparities in productivity after being dispatched on trips with different destinations, where trip distance is the dominant factor in driver productivity [32]. The availability and reliability of information on future demand may enable the driver to wait in place for the next rider’s request without cruising around and contributing to congestion [33]. Factors that determine profit expectations and platform commission of drivers are the platform price [34], seat occupancy by implementing ride-splitting [23], or a policy of surge pricing that imposes on drivers’ number of working hours [21]. Moreover, vehicle-related expenses (e.g., periodic inspection, maintenance and vehicle tax) are also a burden to the drivers. As a result, the take-home pay is less than it may seem to be [25,35].
Alongside scheduling flexibility and income factors, previous studies have sought to find other factors that influence job satisfaction or dissatisfaction among ride-sourcing drivers. These include, but are not limited to, working hours, current and previous job, driving enjoyment, safety, and interaction with other people. Overall, studies in both developing and developed countries conclude that ride-sourcing service is quite a satisfying job for drivers [18,25,26]. Moreover, compared to other workers, ride-sourcing drivers have a higher level of life satisfaction and a feeling of worthwhileness [25].
Job satisfaction has been widely explored. It has been found that workers with a high level of job satisfaction give an astonishing performance, which will also enhance the company’s performance. A possible explanation provided by Bakotić [36] is that workers tend to be more diligent in working, as well as creatively and devotedly making an effort to overcome the barriers in their job. Companies with such workers have been shown to have extraordinary business outcomes, including market performance, earnings, and high returns on their assets [37,38,39,40]. Although research on job satisfaction and outcomes among non-employee workers is rare, a previous study on the gig economy by Li and Chen [41] (who included ride-sourcing drivers in their observations) found that gig workers may show counter-productive working behaviour when they fail to receive the expected support.
Drivers’ satisfaction is influenced by many factors, stretching from personal issues to road environment, quality of the service, working environment, psychological aspects, and community issues. Based on an investigation of the effects of road traffic operation, Lee et al. [42] found that the overall satisfaction that drivers generally perceive relates to drivers’ route-changing behaviours. The quality of the service, which can be expressed by internal service quality, has a positive effect on employees’ satisfaction, commitment, and wellbeing, which in turn positively influence employees’ performance [43]. Sharma et al. [43] also state that employees’ wellbeing positively strengthens the effects of employees’ satisfaction and commitment on performance. The working environment is also found to be important in increasing drivers’ satisfaction. Borndörfer et al. [44] found that duty scheduling in public transit can significantly increase drivers’ satisfaction at almost zero cost, which is important to increase the attractiveness of the profession. Schulz et al. [45] indicate a strong positive relationship between psychological capital and job satisfaction and organizational commitment, and a strong negative correlation with an intention to quit. The study by Avey et al. [46] found a significant positive relationship between psychological capital and desirable employee attitudes and measures of performance, while it is negatively related to undesirable employee attitudes.
Based on a study from the US, Wygal et al. [47] indicated that drivers’ job satisfaction is related to compensation, management quality, equipment quality, home time, and wait time. In the UK, Duffy and McGoldrick [10] showed that work-related stressors are associated with lower levels of job satisfaction and unfavourable scores on mental health indices when compared to normative samples. They found that health, home-related concerns, and work-related concerns (i.e., problems intrinsic to the job, lack of involvement and support during the organizational changes occurring, and fears regarding physical assault) are determinants of job stress, which is intensified as a result of streamlining and increased competition. In terms of the expectation of job satisfaction, LeMay et al. [48] found that both new and experienced truck drivers reported higher satisfaction than managers projected, while new and experienced truck drivers had similar expectations of job satisfaction.
Job satisfaction can also be expressed by the willingness of drivers to recommend this occupation to others or to their children. Johnson et al. [49] found that the most common reasons for truck drivers not to recommend the occupation to their children were excessive time away from home, it is hard to make a reasonably good income, and their work is not a respected occupation.
In summary, job satisfaction and outcomes have been found to be substantial within various occupations, and boost job satisfaction. Job satisfaction is found to hold great prospects for strengthening both workers’ and companies’ outcomes. However, as far as the authors are aware, none of the academic literature seeks to find evidence concerning job satisfaction and productivity, specifically among ride-sourcing drivers. The following sections examine the working behaviour among ride-sourcing drivers in Bandung, Indonesia, and discuss the role of this attribute in shaping ride-sourcing drivers’ job performance.

3. Research Design

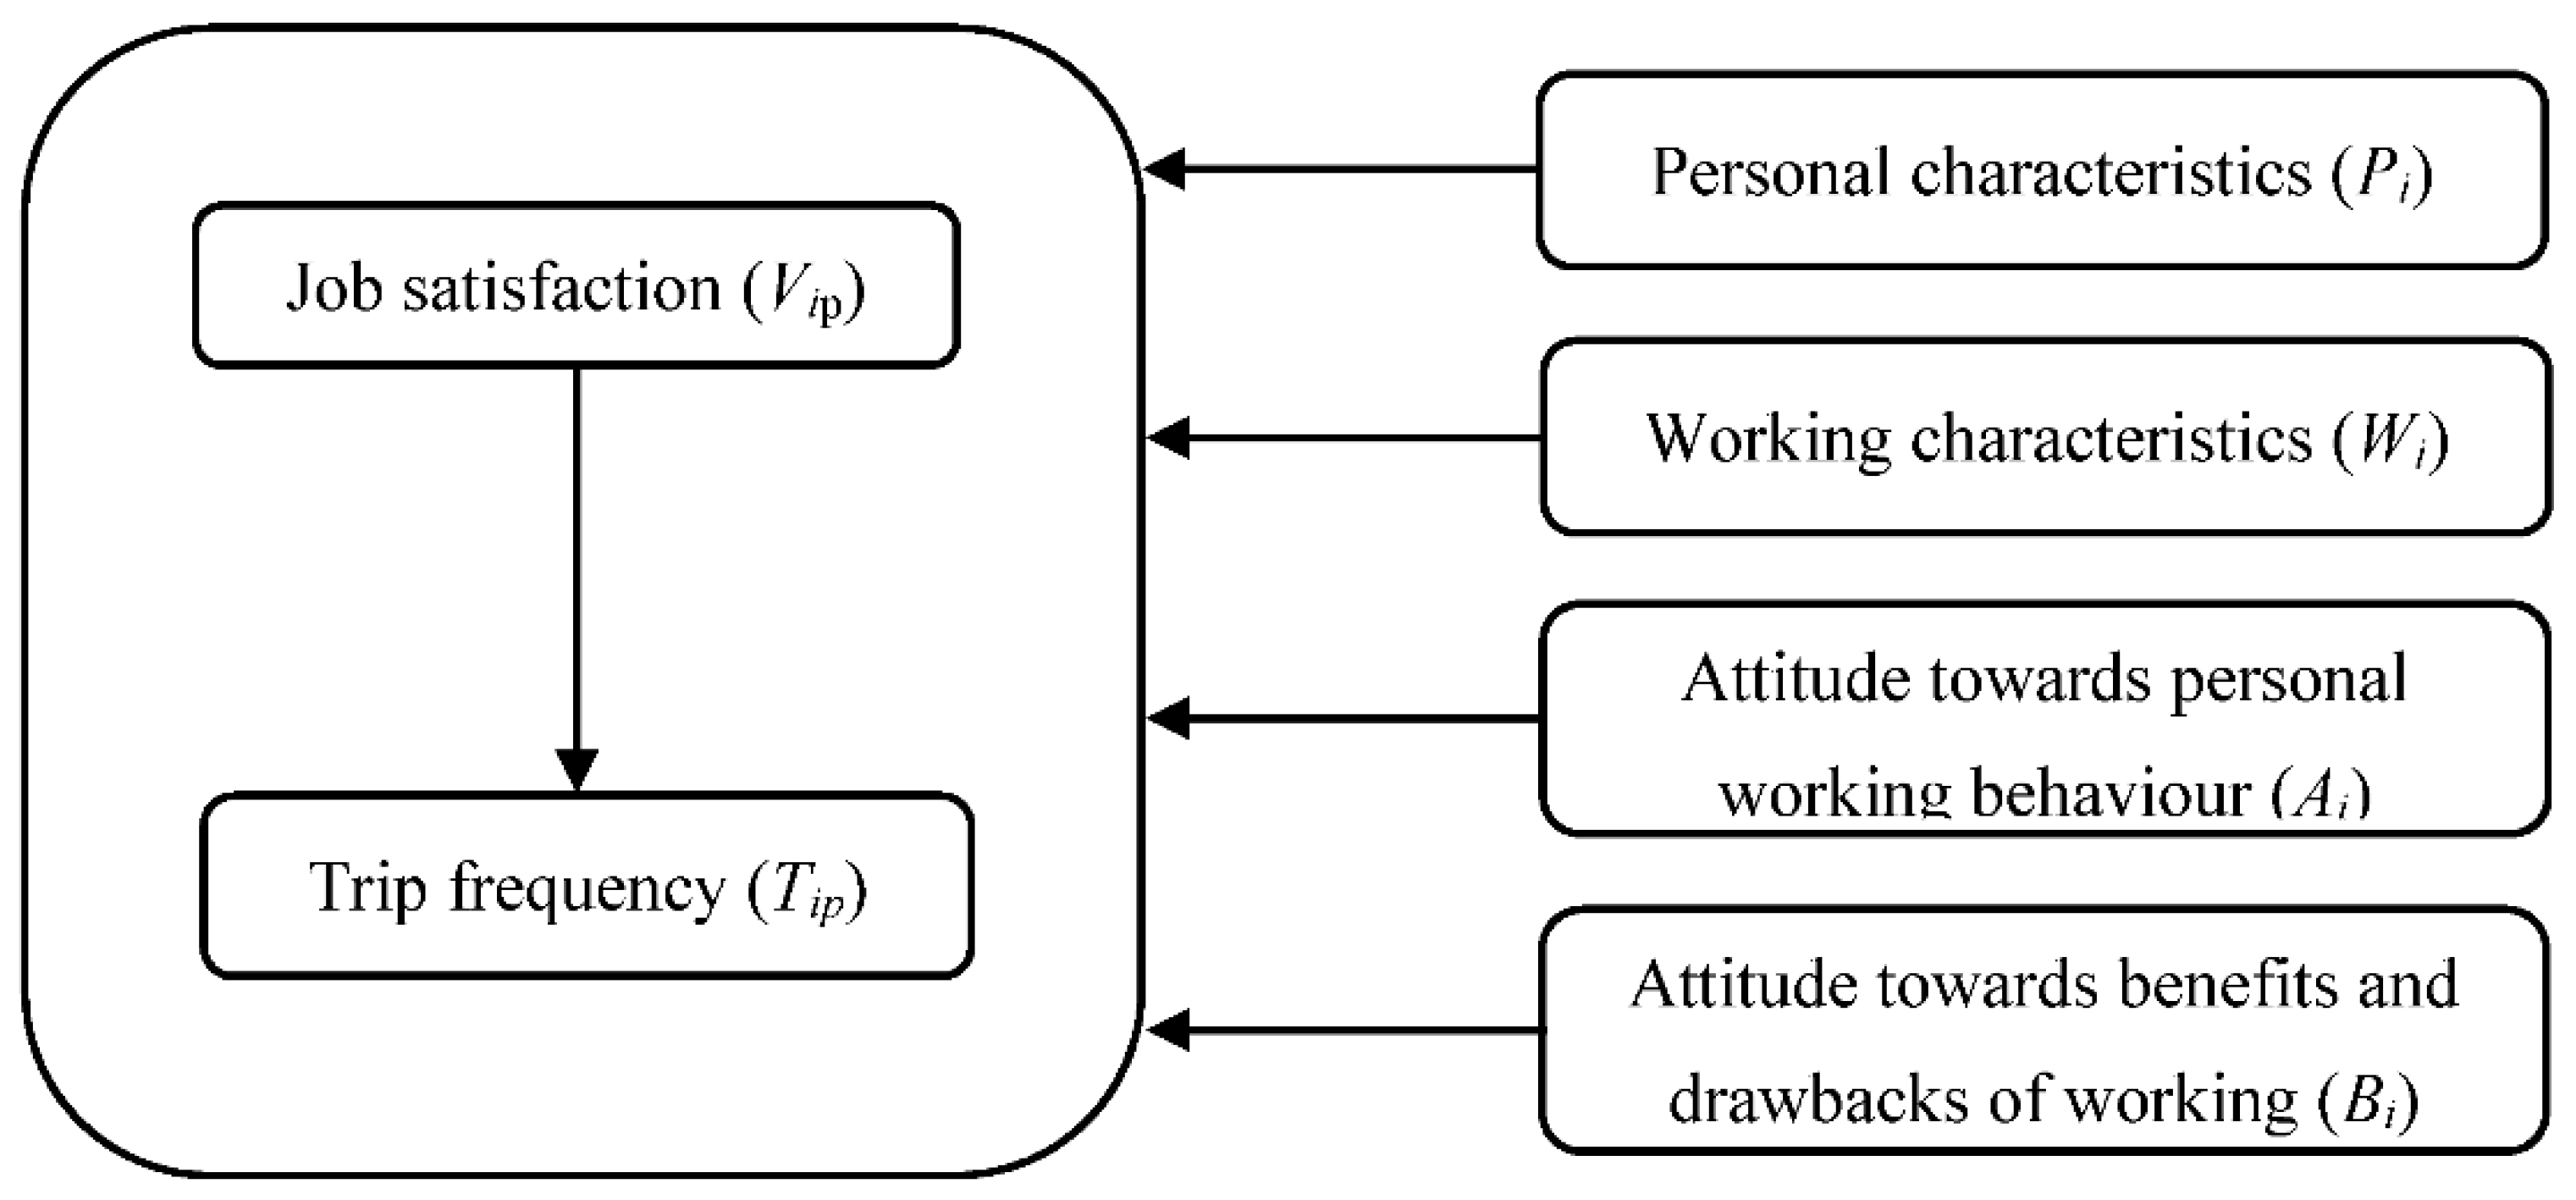
3.1. Proposed Model Construct

As a way to better understand the relationship between job satisfaction and frequency of usage and the factors that influence those variables, a model of hierarchical SEM is estimated. The model also investigates the interaction between working characteristics and attitude towards ride-sourcing drivers. Figure 1 shows the proposed model. The proposed model and hypotheses were developed based on the literature in the previous section. Job satisfaction is influenced by home-related concerns [10] and work-related concerns [10,21,42,43], and psychological resources that meet the criteria for positive organizational behaviour [50] include hope, efficacy, optimism, and resilience [51]. Avey et al. [46] show the positive relationships between psychological capital and desirable employee attitudes (job satisfaction, organizational commitment, psychological wellbeing); desirable employee behaviours (citizenship); and multiple measures of performance (self, supervisor and objective evaluations), including undesirable employee attitudes (cynicism, turnover intention, job stress, and anxiety) and undesirable employee behaviours (deviance). Furthermore, our study employed instruments of the attitudes as an additional explanatory variable. Attitude towards personal working behaviour characteristics refers to studies by Ramlee et al. [52], Poulter et al. [53], and Hong et al. [54]. Attitude towards the benefit and drawback of working characteristics refers to studies by Fielbaum and Tirachini [9] and Ashkrof et al. [7].
The hypotheses of this study are as follows.
Hypotheses 1 (H1).
Job satisfaction is affected by personal and working characteristics (i.e., experience of working as a driver, income, etc.), attitude towards personal working behaviour, and attitude towards the benefits and drawbacks of working as a ride-sourcing driver.
Hypotheses 2 (H2).
Daily trip frequency is explained by drivers’ job satisfaction as well as personal and working characteristics (i.e., experience of working as a driver, income, etc.), attitude towards personal working behaviour, and attitude towards the benefits and drawbacks of working as a ride-sourcing driver.
Job satisfaction and trip frequency were analysed in the model as endogenous variables, while all other variables were treated as exogenous. The hypotheses are tested by applying the structural form of equations, where the hierarchical SEM is used in a similar way to two-stage least squares (2SLS). The hierarchical SEM is a multilevel regression analysis that can tackle endogeneity using an instrumental variables (IV) method similar to the two- and three-stage least squares methods (2SLS and 3SLS) [24]. The modified SEM has more advantages compared to traditional SEM such as 2SLS, 3SLS, and other SEM models such as full information maximum likelihood SEM (FIML SEM) [55]. The advantage of the hierarchical SEM is that it can deal with categorical variables, needs less computational time compared to multilevel path analysis models [24], is able to include multiple endogenous variables or multiple equations, and is able the include more than one nesting effect [55].
The creation of job satisfaction ( V i ) is like the creation of the first stage of 2SLS (the creation of IV), whereas the incorporation of estimated job satisfaction ( V i ^ ) into the trip frequency model is like the second step of 2SLS. As in 2SLS, the inclusion of V i ^   or estimated job satisfaction tries to tackle endogeneity problems using ride-sourcing (Vi) and other observed variables (working characteristics, attitude towards personal working behaviour, and attitude towards the benefits and drawbacks of working as a ride-sourcing driver). The detailed equations are shown in Equations (1) and (2). As with 2SLS, the equations of this study were run separately for the first and the second stages; thus, the estimated error terms are assumed not to be correlated. Therefore, the model sacrifices simultaneous and reciprocal effects. Myung [56] defined this model of non-full information SEM as 2SLS, where it is as being contrary to FIML-SEM and 3SLS. Detailed discussion of hierarchical SEM can be found elsewhere [24,55,56,57,58,59,60,61].
Models of both job satisfaction and trip frequency are used ordinary linear regression. As the first stage, the equation to estimate job satisfaction is provided below:
V i = ( α 1 ) + ( β 1 P i + β 2 W i + β 3 A i + β 4 B i ) + ε 1
where Vi is job satisfaction for a ride-sourcing driver i. The right-hand side of Equation (1) consists of: Pi = personal characteristics of driver i; Wi = working characteristics of driver i; Ai = attitude towards working behaviour of driver; i, Bi = attitude towards benefits or drawbacks of working as a ride-sourcing driver i.
In the travel frequency model or the second-stage model, this study incorporates V i ^ (estimated job satisfaction as a ride-sourcing driver i), where it was estimated from the job satisfaction model. Endogeneity problems were expected to be tackled by applying V i ^ instead of Vi. The recursive structure between perceived usefulness and ride-sourcing usage is represented by applying V i ^ in the second stage model. As the second stage, the equation to estimate job satisfaction is provided below:
T i = ( α 2 ) + ( β 5 V i ^ + β 6 P i + β 7 W i + β 8 A i + β 9 B i ) + ε 2
Moreover, the stepwise method is used for both models, which is the step-by-step iterative construction of a regression model that involves the selection of independent variables to be used in a final model [62]. Several insignificant variables are retained in the models due to interactions with the goodness-of-fit of the models after a review during the stepwise process [63].

3.2. Questionnaire Development and Data Collection

This study distributed questionnaires to ride-sourcing drivers in Bandung City, Indonesia. Since there is no information regarding the number of ride-sourcing drivers in Indonesia, the sample size of 400 was determined from Yamane’s equation [64], given that the population of Bandung was 2,497,938 [65] and assuming a 5 per cent significance level. The sample size was upgraded to 500 to overcome the possibility of errors during the survey. The questionnaires were constructed based on the literature regarding ride-sourcing travel behaviour [2,15] and the drivers’ satisfaction and experience [7].
The questionnaire was divided into four parts. The first part contained questions about the drivers’ socio-demographic characteristics. The second part was related to the characteristics of their travel behaviour, such as the number of trips per day, average travel time, and length. In the third part, the respondents were asked to identify their attitude towards their personal working behaviour (such as experience in driving, always achieving bonuses from the companies, managing their daily life balance, etc.) using a five-point Likert scale, where 1 represented “strongly disagree” and 5 represented “strongly agree”. In the last part, drivers were questioned on their attitude towards working behaviour with respect to negative effects on health, fulfilling financial needs, among others. The questions about attitudes towards personal working behaviour characteristics refer to studies by Ramlee et al. [52], Poulter et al. [53], and Hong et al. [54], while attitudes toward the benefits and drawbacks of working characteristics refer to studies by Fielbaum and Tirachini [9] and Ashkrof et al. [7]. These questions were provided to the respondents using a five-point Likert scale ranging from “strongly disagree” (1) to “strongly agree” (5). In this part, respondents were also asked about their satisfaction with their job on a five-point Likert scale ranging from “strongly disagree” (1) to “strongly agree” (5). The construct of satisfaction towards the driver’s job was focused on five attributes: pleasant, wealthy, convenience, good, and happy job.
The questionnaire form was distributed between 24 April and 14 May 2018 after a series of reviews and revisions following a pilot survey. The pilot survey was designed to eliminate the possibility of survey biases. During the pilot survey, we recorded all comments from the respondents and made revisions to ensure the quality of the questionnaire. Thus, there should have very little possibility of biases in the final version to collect the full responses. The wording of the questionnaire is evaluated during the survey based on the notes made by surveyors to make sure whether respondents experienced difficulty in understanding the questions. The questionnaire was distributed in six administrative areas in Bandung City. The method used to distribute the questionnaire was convenience sampling using face-to-face interviews with drivers in several different locations, identified before the final survey. Pre-determined locations are used to eliminate bias in the form of over-representation or domination of respondents from a specific location. Before asking the questions, the survey assistants asked a filter question—whether the respondent was a ride-sourcing driver. Only ride-sourcing drivers proceeded to answer the remainder of the questionnaire. This filtering question was provided to eliminate the possibility of survey biases by ensuring only the right respondents. The filtering question is also beneficial to eliminate the possibility of non-response bias. Moreover, the respondents were informed that they would receive a shopping voucher as a gift after completing the questionnaire and that the survey would take an average of 15 min of their time. The respondents who agreed to give 15 min of their time were guided to finish the questionnaire. After completing the questionnaire and before being given the appreciation voucher, the survey assistants made sure the questionnaire was complete to eliminate the possibility of non-response biases. After reviewing the collected dataset, 497 out of 500 respondents’ datasets were used for further analysis.

3.3. Respondents’ Characteristics

Table 1 presents the personal characteristics and working characteristics of the valid respondents. The survey captured drivers who do not have income other than as a ride-sourcing driver, accounting for 72 per cent of the total respondents. The sample mainly comprised married respondents (67%), who had completed secondary school (69%), and made IDR 1–6 million monthly income (81%). As a ride-sourcing driver, each driver completed 14 trips per day, and slightly more than half of the respondents drove 5–10 km on each trip. There seems to be a balance between drivers who have been working for less than a year, those who have been working for one to two years, and those who have been working for more than two years (32, 39, and 30%, respectively). Each month, the majority of drivers spend between IDR 100–200 thousand on vehicle maintenance (47%): at the time of this study, 1 USD equals 14,500 IDR.
Other work-related variables measured in this study identify to what extent drivers agree on statements regarding attitude towards personal working behaviour (see Table 2). The average rating for each statement given was between 3 (neutral) and 4 (agree), with standard deviations between 0.6 and 1.0. One presented behaviour that scored above 4 was carefulness in driving. This behaviour was rated at 4.16 on average, with a relatively low standard deviation (0.65). In contrast, drivers tended to see themselves as neither an achiever nor as having a high driver rating. These statements are the only statements that scored below 3 or tended to be disagreed with.
Table 3 shows the average rating of how their job may bestow benefits or have drawbacks. Typically, respondents can fulfill their financial needs with their income as a ride-sourcing driver. However, drivers tend to have mixed opinions regarding several drawbacks of being a ride-sourcing driver, as the average score for the given statement is around 3.00 (neutral), with a relatively higher standard deviation. Worries regarding the risk of unemployment due to impermanent contracts and road accidents scored above 3.00. The drawback drivers may have due to health risks and income uncertainty averaged slightly below 3.00.

4. Model of Driver Job Satisfaction and Number of Daily Trips

The structural analysis of job satisfaction and number of daily trips is described in this section. There are several steps in the analysis. Exploratory factor analysis (EFA) was used in the first step to reduce the dimension of job satisfaction and attitude towards drivers’ working behaviour. EFA is used to reduce and simplify the dimension into one factor in the sense of overall job satisfaction, since there are five attributes of job satisfaction (i.e., pleasant, wealthy, convenience, good, and happy). The Bartlett method is used to calculate the value of overall job satisfaction for each respondent and is used in the first analysis of the hierarchical SEM.
Furthermore, EFA was performed to define the typology of various attitudes towards the drivers’ working behaviour. Orthogonal varimax rotation was applied to provide adequate information about the variables and simplify the factor structure. Variables with factor loadings of less than 0.5 were removed, where the value as much as 0.5 is used as a threshold for practical significance, as suggested by Hair et al. [62]. The value from the Kaiser–Meyer–Olkin sampling adequacy test is higher than 0.7, as shown in Table 4, which indicates that the sum of the partial correlations is small relative to the sum of the population.
The fourteen (14) attitudes towards drivers’ working behaviour are classified into four components, as described in Table 4. The components represent how respondents value their experience, working schedule, work-health balance, and obligation as a driver. One of the components represents drivers’ experience and their interactions within the driver community. Drivers who are careful and pay more attention to their health are also represented by one component. The third component describes drivers that enjoy exploration but select their working time. The last component represents drivers who achieve targets and have been rewarded by the operator.
Juxtaposed with drivers’ daily trip frequency, Figure 2 displays the average factor score of drivers’ attitudes towards working behaviour. An interesting finding is that drivers who take more trips in a day (more than 16 trips) seem to be the drivers who explore and time-selector. This working behaviour comprises drivers who like new destinations and prefer to work at certain times of the day, either in the afternoon or at night. Moreover, highly scored high achiever drivers may also be related to more frequent daily trips, as the average factor score for the fewest trips falls below 0.8 then gradually climbs towards positive values. Another result that may be an expected finding is that highly scored drivers, who are careful and self-attentive, stricter on their working schedule and health, and seem to take fewer trips in a day.
The results of the hierarchical SEM are described in Table 5 and Table 6. As we employed the results of factor analysis as an independent variable in the hierarchical SEM, it implies a low correlation between variables. Furthermore, we analysed the correlation among explanatory variables in the models by estimating the variance inflation factor (VIF). It is found that only a few variables have a significant correlation with the threshold of 2.5 of VIF, namely drivers who are married (5.384) and have a child at home (5.355). However, both these variables are significant in the model of job satisfaction. Moreover, estimated job satisfaction was found to have a high VIF (7.210). Since the job satisfaction estimated from other variables was found to be significant in the first step of the hierarchical SEM, a high value of VIF normally occurs. Thus, it can be summarized that this method in the study does not have a multicollinearity problem.
Table 5 presents the estimated results of the linear regression for measuring drivers’ job satisfaction with the explanatory variables of personal and travel characteristics, attitude towards driver’s working behaviour, and benefits and drawbacks of the work. Before the interpretation of the model, we evaluated several parameters of the model’s quality. Indicators of R2 indicate that the model can accurately predict 26.6 per cent of the data variance (R2 = 0.266). The result of the ANOVA test indicates that the explanatory variables are significant predictors for the dependent variable.
The results show that drivers’ job satisfaction is described by various factors. From personal characteristics, it is found that drivers that are married or have a child in their household tend to be less satisfied in their job as drivers. Moreover, those who work only as a ride-sourcing driver tend to be more satisfied in their job as a driver than those who have multiple occupations. From the trip characteristics, it is found that drivers who have less than average trip lengths tend to appreciate their jobs more, while long-distance drivers tend to have less satisfaction in their job. In addition, newcomer drivers and those who have a Bachelor’s degree were found to be less satisfied with their job.
Moreover, attitudes towards personal working behaviour were found to shape job satisfaction. Drivers who are careful and take care of their health tend to appreciate their job. Social interactions and knowledge were also found to influence driver satisfaction. Drivers who have more experience and socialize with other drivers tend to cherish their role as ride-sourcing drivers. While there are various benefits and drawbacks to working as ride-sourcing drivers, the model found that those who can fulfill their financial needs with their job as a driver tend to be satisfied with their job. On the other hand, drivers who perceive risks to health due to exposure to air pollution or accidents tend to appreciate their job less.
Table 6 shows the estimation of the daily trip frequency model. The explanatory variables in this model are personal and working characteristics, as well as attitudes towards personal working behaviour. The model also accommodates estimated job satisfaction, based on the previous model, as a part of the model construct. The R2 value shows that 24.2 per cent of the data variance can be explained by the model. The quality of the model is also supported by the result of the ANOVA test that rejected the null hypothesis that explanatory variables are not significant predictors for the dependent variable.
As expected, drivers who appreciate their job as a ride-sourcing driver tend to have more trips per day. Income was found to be associated with trip frequency. High-income drivers tend to have more trips in a day, while low-income drivers experience the opposite. Interestingly, car-based ride-sourcing (CBRS) drivers tend to have lower trip frequencies than motorcycle-based ride-sourcing (MBRS) drivers. Moreover, attitude towards personal working behaviour was found to influence the daily trip frequency. High achieving drivers tended to have more trips per day, while drivers who manage their health and are careful when driving tend to have a lower trip frequency.

5. Discussion and Conclusions

The rise of ride-sourcing has not only provided alternatives for mobility in cities but also opportunities for job creation, consequently improving the economy. However, the characteristics of the working environment have raised several issues regarding drivers’ job satisfaction which might affect the service quality and companies’ revenue target. Drivers’ job satisfaction is argued to be influenced by the working experience where the ride-sourcing market is in tough competition, both between ride-sourcing operators and between ride-sourcing and other community transport or public transport drivers. This study aims to explore what factors affect drivers’ job satisfaction and, consequently, whether this satisfaction influences their daily trip frequency. To the authors’ knowledge, the limited number of earlier studies from the perspective of drivers used data from developed countries [7,19,20]. Given the unique characteristics of ride-sourcing services in developing countries, this study tries to draw the behaviour from the perspective of drivers in Bandung, Indonesia.
Contrary to the results of the study by Fielbaum and Tirachini [9] in Chile, it is found that drivers who only have a job as a ride-sourcing driver tend to have more satisfaction than those who combine it with other jobs. This finding might be related to the difference between Chile and Indonesia in terms of the ride-sourcing services and company regulations. Ride-sourcing companies in Indonesia have different financial incentives to Chile, and drivers who accomplish a certain number of trips will receive a different amount as a bonus. The target of achieving the bonus might positively influence drivers who only have one job rather than drivers who have to manage their ride-sourcing driver job with others, adding more stress and complexities. The number of jobs implies time flexibility. Lucas and Heady [66] stated that commuters with a flexible time working environment reported less driver stress and fewer feelings of time urgency than those without flexible time.
Keller [67] states that increases in driver pay are required to ensure minimal turnover and maximum external productivity and customer relations. This implies an important effect of drivers’ income in shaping the way they work as drivers. The target to achieve the bonus could also explain how the average trip length shapes job satisfaction. It was found that drivers who have shorter trips tend to cherish their job more than those who have longer trips. With shorter trip length meaning less time needed to accomplish the target number, the probability of getting a bonus will be higher for drivers who frequently take orders for shorter trip lengths. This is in line with the finding by Zha et al. [21] under the surge pricing scenario, where a higher average revenue rate corresponds to longer working hours in the neoclassical assumption but may lead to a reduction in working hours in the income-targeting one. In contrast, drivers who are married tend to be less satisfied with their job. This might be related to the financial needs of a married couple that cannot be provided with the limited and less competitive wage of ride-sourcing.
Supporting earlier studies [7,9], wage competitiveness and financial safety are found to support job appreciation as a ride-sourcing driver. The efficacy of such compensation models for the employees is found to be an important determinant [47]. Indications show that the role of income-focused, full- and part-time drivers is growing, resulting in increasing demand for full- and part-time drivers rather than incidental workers [29]. This can be achieved by drivers selecting to working in very busy periods, which results in the platform and drivers enjoying higher revenue while customers may be experiencing an extra cost [21]. Moreover, these services are more likely to increase the number of kilometres travelled, which is less ecologically efficient because of the empty miles driven by drivers to pick up passengers [29]. In contrast, the health factor due to exposure to air pollution is among the risks perceived to lower satisfaction as a driver. This finding also underlines other studies [68,69] on other driving jobs (i.e., public transport) where increased job strain, health problem exposure and, consequently, wellbeing influence job satisfaction; the outcome can influence traffic safety risks. Moreover, attitude towards personal working behaviour is found to shape job satisfaction. A more careful driver who takes care of their health tends to appreciate their job. Social interactions and knowledge are also found to influence satisfaction, as drivers who have more experience and socialize with other drivers tend to cherish their role as ride-sourcing drivers.
Supporting the previous research regarding satisfaction and productivity [13,69], it was found that higher job satisfaction among ride-sourcing drivers influences an increase in the productivity of the trip, represented by higher daily trip frequency. The results also showed that a high-income driver tends to have more trips per day, given the ride-sourcing business model that gave various bonuses when a trip frequency target was achieved. Moreover, given the higher travel time needed for CBRS than for MBRS, the CBRS driver tended to have a lower trip frequency than MBRS. With the greater demand, higher speed, and flexibility of MBRS compared to CBRS [70], it appears that MBRS drivers can accomplish more trips than CBRS, who need more time. This finding is quite different from the finding of Zuniga-Garcia et al. [32], using data from Austin, Texas, that short trips yielded lower productivity, even when ending in areas with high demand.
The model also confirmed that drivers’ attitude towards their personal working behaviour shaped their productivity. With ambitious targets, high achiever drivers tend to have more trip productivity. Drivers with more experience seem to have more knowledge about future demand information, which enables them to manage their time and location more productively. Kontou et al. [33] state that information on future demand enables the driver to wait in place for the next rider’s request without cruising around and contributing to congestion. In contrast, it is found that a driver who is concerned, manages their health well, and is careful in driving tends to have a lower trip frequency. Exposure to health risks and traffic accidents due to air pollution and massive motorization is commonly perceived in Indonesian cities [71,72,73]. Therefore, those who manage their health and manage the risk of traffic accidents tend to reduce their trip frequency.
Based on the findings of this study, theoretical and practical contributions can be highlighted. The theoretical contribution can be summarized in two aspects. Firstly, this study shines a light on the determinant factors of job satisfaction as ride-sourcing drivers. The results of this study show the difference from practices in other countries. The second contribution is the explanation regarding the determinants of job productivity—i.e., number of trips and income. To some extent, this study also contributes to travel behaviour studies regarding ride-sourcing drivers. Moreover, as the present discussion mainly uses data from developed countries, this study’s contribution enriches the knowledge base with evidence from a developing country.
The practical contributions of this study are threefold. Firstly, this study highlights the importance of developing a positive working environment to retain and increase job satisfaction and ultimately improve job performance. Secondly, it highlights the need for the provision of a proper selection process before an individual enters the industry: a positive relationship between expectation and experience will positively contribute to job satisfaction. Thirdly, this study highlights the need to set a standard of living and working as a driver. This standard will protect the risks of working as a driver and at the same time promote optimism as a driver. A detailed explanation of the contribution is given in the recommendations section.

6. Recommendations and Future Works

Based on the findings of this study, some recommendations can be provided. The first is regulation when setting up the working environment of ride-sourcing drivers. The ride-sourcing industry at present mostly applies a working contract between drivers and operators, and a driver is more likely to be an outsourced employee than a permanent employee. The feeling of security about continuity as a driver for a ride-sourcing operator is potentially determined by the way they behave as drivers on duty. Racing on the road to reach a destination is an example of the impact of the feeling of security to obtain higher income. Regulation would be beneficial to ensure the rights of drivers, which in the end will improve their wellness and satisfaction. Regulation will protect and improve the bargaining power of drivers, as well as passengers, in a market without price controls: Dempsey [74] argued about imperfections in the structure of the taxi market, as well as ride-sourcing.
The second recommendation concerns the selection and licensing of ride-sourcing drivers. The suggestion from Harding et al. [22] regarding concerns about driver background checks and safety and the findings of this study regarding ride-sourcing drivers’ concerns about health and safety on the road implies a need to set an entry requirement for someone to work as a ride-sourcing driver. This may provide a minimum standard for someone before deciding to work as a driver of a public transport vehicle, including ride-sourcing. When they satisfy the minimum standard, it can be assumed that they are ready for work and its consequences. This may increase job satisfaction, as expectations and requirements can be synchronized. This recommendation follows the suggestion of LeMay et al. [48] regarding the expectations of new drivers, as they are the future or the turnover statistic of the future. When drivers hear the same realistic messages in orientation that they hear from recruiters, this will help the firm build a reputation for truthfulness with drivers. In the end, it can be expected that drivers will have greater satisfaction. This recommendation also follows the suggestion by Wygal et al. [47] that equipment quality is important to drivers on many levels since drivers depend on their equipment to safely and effectively perform their job functions.
The third recommendation is the need to set a standard of living and working for drivers who work in the transportation environment, including ride-sourcing. The minimum living standard should be a practical follow-up for our finding regarding variables of job satisfaction. The standard will be beneficial to standardize the working and living of drivers in the transportation sector, which may reduce the bias or over-expectations of new drivers before entering the field. For example, the standard should regulate the working time, whether it is flexible or not, following the suggestion by Lucas and Heady [66] that employers should consider flexible time to enhance workers’ on-the-job performance. This recommendation is in line with the finding of Duffy and McGoldrick [10] that drivers should be aware of the work-related issue as it contributes to job stress and ultimately reduces job satisfaction. A recommended standard may support the effort for driver retention and performance in the working place, as suggested by Schulz et al. [45] and Avey et al. [46], by employing psychological resources. The availability of a reasonable standard of living and working as drivers may develop drivers’ hope, resiliency, efficacy, and optimism. Furthermore, this kind of standard may also contribute by offering insights into the positive aspects of the occupation, as suggested by Johnson et al. [49].
This study has some limitations that could be a basis for further research. This research indicates that the health and safety risk is a factor that influences drivers’ satisfaction. However, the implications of the job for health and safety remain unquantified. Research on the influence of ride-sourcing working behaviour on health and safety could also be on the future research agenda. Potential urban management policies will directly contribute to increasing the wellbeing of drivers as representative of the transport stakeholders.
Another limitation of this study is the employment of cross-sectional data. This study employed data from a time before the COVID-19 pandemic broke out. Further study may employ panel data or even time series to study the change in drivers’ job satisfaction over time under different kinds of policies.

Author Contributions

Conceptualization, T.B.J. and M.R.; data curation, J.S.; formal analysis, T.B.J., M.R. and J.S.; funding acquisition, T.B.J.; methodology, T.B.J., M.R. and J.S.; software, M.R. and J.S.; supervision, T.B.J.; writing—original draft, M.R. and J.S.; writing—review and editing, T.B.J. and M.R. All authors have read and agreed to the published version of the manuscript.

Funding

The authors would like to thank the Directorate of Research and Community Services, the Directorate General of Research and Development Strengthening, and the Ministry of Research, Technology and Higher Education of the Republic of Indonesia, who provided the research grant. (013/SP2H/RDPKR-JAMAK/LL4/2021 & III/LPPM/2021-07/127-PE).

Institutional Review Board Statement

Ethical review and approval were waived for this study, due to no personal identity were involved or reported.

Informed Consent Statement

Informed consent was obtained from all subjects involved in the study.

Data Availability Statement

Not applicable.

Conflicts of Interest

The authors declare no conflict of interest.

References

  1. Tirachini, A. Ride-hailing, travel behaviour and sustainable mobility: An international review. Transportation 2019, 47, 2011–2047. [Google Scholar] [CrossRef]
  2. Rizki, M.; Joewono, T.B.; Belgiawan, P.F.; Irawan, M.Z. The travel behaviour of ride-sourcing users, and their perception of the usefulness of ride-sourcing based on the users’ previous modes of transport: A case study in Bandung City, Indonesia. IATSS Res. 2020. [Google Scholar] [CrossRef]
  3. Dias, F.F.; Lavieri, P.S.; Garikapati, V.; Astroza, S.; Pendyala, R.M.; Bhat, C.R. A behavioral choice model of the use of car-sharing and ride-sourcing services. Transportation 2017, 44, 1307–1323. [Google Scholar] [CrossRef]
  4. Rayle, L.; Dai, D.; Chan, N.; Cervero, R.; Shaheen, S. Just a better taxi? A survey-based comparison of taxis, transit, and ridesourcing services in San Francisco. Transp. Policy 2016, 45, 168–178. [Google Scholar] [CrossRef] [Green Version]
  5. Rizki, M.; Joewono, T.B.; Belgiawan, P.F.; Prasetyanto, D. Exploring the Ride-Hailing Drivers’ Characteristics and Their Order Rejection Behavior in Bandung City; Springer: Singapore, 2021; pp. 861–869. [Google Scholar] [CrossRef]
  6. Azka, R.M. Berapa Sih Jumlah Pengemudi Ojek Online? Simak Penelusuran Bisnis.com! 12 November 2019. Available online: https://ekonomi.bisnis.com/read/20191112/98/1169620/berapa-sih-jumlah-pengemudi-ojek-online-simak-penelusuran-bisnis.com (accessed on 28 July 2021).
  7. Ashkrof, P.; Correia, G.H.D.A.; Cats, O.; van Arem, B. Understanding ride-sourcing drivers’ behaviour and preferences: Insights from focus groups analysis. Res. Transp. Bus. Manag. 2020, 37, 100516. [Google Scholar] [CrossRef]
  8. Useche, S.A.; Gómez, V.; Cendales, B.; Alonso, F. Working Conditions, Job Strain, and Traffic Safety among Three Groups of Public Transport Drivers. Saf. Health Work. 2018, 9, 454–461. [Google Scholar] [CrossRef] [PubMed]
  9. Fielbaum, A.; Tirachini, A. The sharing economy and the job market: The case of ride-hailing drivers in Chile. Transportation 2020, 1–27. [Google Scholar] [CrossRef]
  10. Duffy, C.A.; McGoldrick, A.E. Stress and the bus driver in the UK transport industry. Work. Stress 1990, 4, 17–27. [Google Scholar] [CrossRef]
  11. Nguyen-Phuoc, D.Q.; Oviedo-Trespalacios, O.; Vo, N.S.; Le, P.T.; Van Nguyen, T. How does perceived risk affect passenger satisfaction and loyalty towards ride-sourcing services? Transp. Res. Part D Transp. Environ. 2021, 97, 102921. [Google Scholar] [CrossRef]
  12. Halkos, G.; Bousinakis, D. The effect of stress and satisfaction on productivity. Int. J. Prod. Perform. Manag. 2010, 59, 415–431. [Google Scholar] [CrossRef]
  13. Kwon, Y.; Byun, J.; Park, S. Exploring the determinants of bus drivers job satisfaction: Evidence from South Korea. Res. Transp. Bus. Manag. 2019, 33, 100436. [Google Scholar] [CrossRef]
  14. Boyce, W.S. Does truck driver health and wellness deserve more attention? J. Transp. Health 2016, 3, 124–128. [Google Scholar] [CrossRef]
  15. Irawan, M.Z.; Belgiawan, P.F.; Tarigan, A.; Wijanarko, F. To compete or not compete: Exploring the relationships between motorcycle-based ride-sourcing, motorcycle taxis, and public transport in the Jakarta metropolitan area. Transportation 2019, 47, 2367–2389. [Google Scholar] [CrossRef]
  16. Clewlow, R.R. Carsharing and sustainable travel behavior: Results from the San Francisco Bay Area. Transp. Policy 2016, 51, 158–164. [Google Scholar] [CrossRef]
  17. Suatmadi, A.Y.; Creutzig, F.; Otto, I.M. On-demand motorcycle taxis improve mobility, not sustainability. Case Stud. Transp. Policy 2019, 7, 218–229. [Google Scholar] [CrossRef]
  18. Tirachini, A.; Gomez-Lobo, A. Does ride-hailing increase or decrease vehicle kilometers traveled (VKT)? A simulation approach for Santiago de Chile. Int. J. Sustain. Transp. 2019, 14, 187–204. [Google Scholar] [CrossRef]
  19. Wang, S.; Smart, M. The disruptive effect of ridesourcing services on for-hire vehicle drivers’ income and employment. Transp. Policy 2020, 89, 13–23. [Google Scholar] [CrossRef]
  20. Zha, L.; Yin, Y.; Yang, H. Economic analysis of ride-sourcing markets. Transp. Res. Part C Emerg. Technol. 2016, 71, 249–266. [Google Scholar] [CrossRef] [Green Version]
  21. Zha, L.; Yin, Y.; Du, Y. Surge Pricing and Labor Supply in the Ride-Sourcing Market. Transp. Res. Procedia 2017, 23, 2–21. [Google Scholar] [CrossRef]
  22. Harding, S.; Kandlikar, M.; Gulati, S. Taxi apps, regulation, and the market for taxi journeys. Transp. Res. Part A Policy Pr. 2016, 88, 15–25. [Google Scholar] [CrossRef]
  23. Chen, X.; Zheng, H.; Wang, Z.; Chen, X. Exploring impacts of on-demand ridesplitting on mobility via real-world ridesourcing data and questionnaires. Transportation 2018, 48, 1541–1561. [Google Scholar] [CrossRef]
  24. Dharmowijoyo, D.B.E.; Susilo, Y.O.; Karlström, A. On complexity and variability of individuals’ discretionary activities. Transportation 2016, 45, 177–204. [Google Scholar] [CrossRef] [Green Version]
  25. Berger, T.; Frey, C.B.; Levin, G.; Danda, S.R. Uber happy? Work and well-being in the ‘Gig Economy’. Econ. Policy 2019, 34, 429–477. [Google Scholar] [CrossRef]
  26. Wilmans, G.; Rashied, N. Self-employment through ride-hailing: Drivers’ experiences in Johannesburg, South Africa. Acta Commer. 2021, 21. [Google Scholar] [CrossRef]
  27. Hall, J.V.; Krueger, A.B. An Analysis of the Labor Market for Uber’s Driver-Partners in the United States. ILR Rev. 2017, 71, 705–732. [Google Scholar] [CrossRef]
  28. Hahn, R.; Metcalfe, R. The ridesharing revolution: Economic survey and synthesis. More Equal Des. Econ. Des. Responses Inequal. 2017, 4. Available online: https://www.regulation.org.uk/library/2017-the_ridesharing_revolution.pdf (accessed on 15 September 2021).
  29. Anderson, D.N. “Not just a taxi”? For-profit ridesharing, driver strategies, and VMT. Transportation 2014, 41, 1099–1117. [Google Scholar] [CrossRef] [Green Version]
  30. Mas, A.; Pallais, A. Valuing Alternative Work Arrangements. Am. Econ. Rev. 2017, 107, 3722–3759. [Google Scholar] [CrossRef] [Green Version]
  31. Johnson, C. Rider’s Delight: How Two Lyft Drivers Bring the Party to the People. Shareable. 2013. Available online: http://www.shareable.net/blog/riders-delight-how-two-lyft-drivers-bring-the-party-to-the-people (accessed on 15 September 2021).
  32. Zuniga-Garcia, N.; Tec, M.; Scott, J.G.; Ruiz-Juri, N.; Machemehl, R.B. Evaluation of ride-sourcing search frictions and driver productivity: A spatial denoising approach. Transp. Res. Part C Emerg. Technol. 2019, 110, 346–367. [Google Scholar] [CrossRef]
  33. Kontou, E.; Garikapati, V.; Hou, Y. Reducing ridesourcing empty vehicle travel with future travel demand prediction. Transp. Res. Part C Emerg. Technol. 2020, 121, 102826. [Google Scholar] [CrossRef]
  34. Sun, L.; Teunter, R.H.; Babai, M.Z.; Hua, G. Optimal pricing for ride-sourcing platforms. Eur. J. Oper. Res. 2019, 278, 783–795. [Google Scholar] [CrossRef]
  35. Eisenmeier, S.R.J. Ride-Sharing Platforms in Developing Countries: Effects and Implications in Mexico City. 2018. Available online: https://pathwayscommission.bsg.ox.ac.uk/Sigfried-Eisenmeier-paper (accessed on 15 September 2021).
  36. Bakotić, D. Relationship between job satisfaction and organisational performance. Econ. Res.-Ekon. Istraživanja 2015, 29, 118–130. [Google Scholar] [CrossRef]
  37. Harter, J.K.; Schmidt, F.L.; Hayes, T.L. Business-unit-level relationship between employee satisfaction, employee engagement, and business outcomes: A meta-analysis. J. Appl. Psychol. 2002, 87, 268–279. [Google Scholar] [CrossRef] [PubMed] [Green Version]
  38. Gould-Williams, J. The importance of HR practices and workplace trust in achieving superior performance: A study of public-sector organizations. Int. J. Hum. Resour. Manag. 2003, 14, 28–54. [Google Scholar] [CrossRef]
  39. Evans, J.R.; Jack, E.P. Validating Key Results Linkages in the Baldrige Performance Excellence Model. Qual. Manag. J. 2003, 10, 7–24. [Google Scholar] [CrossRef]
  40. Schneider, B.; Hanges, P.J.; Smith, D.B.; Salvaggio, A.N. Which comes first: Employee attitudes or organizational financial and market performance? J. Appl. Psychol. 2003, 88, 836–851. [Google Scholar] [CrossRef] [Green Version]
  41. Li, S.; Chen, Y. The Relationship Between Psychological Contract Breach and Employees’ Counterproductive Work Behaviors: The Mediating Effect of Organizational Cynicism and Work Alienation. Front. Psychol. 2018, 9, 1273. [Google Scholar] [CrossRef] [Green Version]
  42. Lee, D.; Lee, C.; Pietrucha, M.T. Evaluation of driver satisfaction of travel information on variable message signs using fuzzy aggregation. J. Adv. Transp. 2008, 42, 5–22. [Google Scholar] [CrossRef]
  43. Sharma, P.; Kong, T.T.C.; Kingshott, R. Internal service quality as a driver of employee satisfaction, commitment and performance. J. Serv. Manag. 2016, 27, 773–797. [Google Scholar] [CrossRef]
  44. Borndörfer, R.; Schulz, C.; Seidl, S.; Weider, S. Integration of duty scheduling and rostering to increase driver satisfaction. Public Transp. 2017, 9, 177–191. [Google Scholar] [CrossRef]
  45. Schulz, S.A.; Luthans, K.W.; Messersmith, J.G. Psychological capital. Int. J. Phys. Distrib. Logist. Manag. 2014, 44, 621–634. [Google Scholar] [CrossRef]
  46. Avey, J.B.; Reichard, R.J.; Luthans, F.; Mhatre, K.H. Meta-analysis of the impact of positive psychological capital on employee attitudes, behaviors, and performance. Hum. Resour. Dev. Q. 2011, 22, 127–152. [Google Scholar] [CrossRef] [Green Version]
  47. Wygal, A.; Voss, D.; Hargis, M.; Nadler, S. Assessing Causes of Driver Job Dissatisfaction in the Flatbed Motor Carrier Industry. Logistics 2021, 5, 34. [Google Scholar] [CrossRef]
  48. A Lemay, S.; Williams, Z.; Carver, M. A triadic view of truck driver satisfaction. J. Transp. Manag. 2009, 21, 1–15. [Google Scholar] [CrossRef]
  49. Johnson, J.C.; Bristow, D.N.; McClure, D.J.; Schneider, K.C. Determinants of job satisfaction among long-distance truck drivers: An interview study in the United States. Int. J. Manag. 2011, 28, 203–216, 394. Available online: https://www.proquest.com/scholarly-journals/determinants-job-satisfaction-among-long-distance/docview/853332572/se-2?accountid=31495 (accessed on 15 September 2021).
  50. Luthans, F. The need for and meaning of positive organizational behavior. J. Organ. Behav. 2002, 23, 695–706. [Google Scholar] [CrossRef] [Green Version]
  51. Luthans, F. Positive organizational behavior: Developing and managing psychological strengths. Acad. Manag. Perspect. 2002, 16, 57–72. [Google Scholar] [CrossRef]
  52. Ramlee, N.; Osman, A.; Salahudin, S.N.; Yeng, S.K.; Ling, S.C.; Safizal, M. The Influence of Religiosity, Stress and Job Attitude towards Organizational Behavior: Evidence from Public Universities in Malaysia. Procedia Econ. Financ. 2016, 35, 563–573. [Google Scholar] [CrossRef] [Green Version]
  53. Poulter, D.; Chapman, P.; Bibby, P.A.; Clarke, D.D.; Crundall, D. An application of the theory of planned behaviour to truck driving behaviour and compliance with regulations. Accid. Anal. Prev. 2008, 40, 2058–2064. [Google Scholar] [CrossRef] [PubMed]
  54. Hong, J.; McArthur, D.P.; Livingston, M. Can Accessing the Internet while Travelling Encourage Commuters to Use Public Transport Regardless of Their Attitude? Sustainability 2019, 11, 3281. [Google Scholar] [CrossRef] [Green Version]
  55. Dharmowijoyo, D.B.; Susilo, Y.O.; Joewono, T.B. Residential location and health effects on multitasking behaviours and day experiences. Sustainability 2021, in press. [Google Scholar]
  56. Myung, I.J. Tutorial on maximum likelihood estimation. J. Math. Psychol. 2003, 47, 90–100. [Google Scholar] [CrossRef]
  57. Dharmowijoyo, D.B.E.; Joewono, T.B. Mobility and Health: The Interaction of Activity-Travel Patterns, Overall Well-Being, Transport-Related Social Exclusion on Health Parameters. In Energy Efficiency in Mobility Systems; Springer: Singapore, 2020; pp. 53–83. [Google Scholar]
  58. Kariuki, M.; Dharmowijoyo, D.; Tanjung, L.E.; Shalihati, S.F. The Integration of Time-Space Prism and Psychological Mechanism on The Use of Public Transport. Asian J. Technol. Manag. (AJTM) 2020, 13, 35–46. [Google Scholar] [CrossRef]
  59. Gujarati, D. Basic Econometric; McGraw Hill: Boston, MA, USA, 2003. [Google Scholar]
  60. Hansen, C.B. Inference in Linear Panel Data Models with Serial Correlation and an Essay on the Impact of 401(k) Participation on the Wealth Distribution. Ph.D. Thesis, Massachusetts Institute of Technology, Cambridge, MA, USA, 2004. [Google Scholar]
  61. Liu, Y.; Bellibas, M.S.; Printy, S. How school context and educator characteristics predict distributed leadership. Educ. Manag. Adm. Leadersh. 2016, 46, 401–423. [Google Scholar] [CrossRef]
  62. Hair, J.F.; Black, B.; Babin, B.J.; Anderson, R.E. Multivariate Data Analysis: International Edition, 7th ed.; Pearson: London, UK, 2013; Available online: https://www.pearson.com/uk/educators/higher-education-educators/program/Hair-Multivariate-Data-Analysis-Global-Edition-7th-Edition/PGM916641.html (accessed on 1 September 2021).
  63. Wang, G.C.S.; Jain, C.L. Regression Analysis: Modeling & Forecasting; Institute of Business Forec: Flushing New York, NY, USA, 2003. [Google Scholar]
  64. Yamane, T. Statistics. An Introductory Analysis, 2nd ed.; Harper & Row: New York, NY, USA, 1973. [Google Scholar]
  65. Bandung Statistics Bureau. Bandung in Figures 2019; BPS: Bandung, West Java, Indonesia, 2019. [Google Scholar]
  66. Lucas, J.L.; Heady, R.B. Flexitime commuters and their driver stress, feelings of time urgency, and commute satisfaction. J. Bus. Psychol. 2002, 16, 565. [Google Scholar] [CrossRef]
  67. Keller, S.B. Driver relationships with customers and driver turnover: Key mediating variables affecting driver performance in the field. J. Bus. Logist. 2002, 23, 39–64. [Google Scholar] [CrossRef]
  68. Chung, Y.-S.; Wu, H.-L. Stress, strain, and health outcomes of occupational drivers: An application of the effort reward imbalance model on Taiwanese public transport drivers. Transp. Res. Part F Traffic Psychol. Behav. 2013, 19, 97–107. [Google Scholar] [CrossRef]
  69. Green, F. Well-being, job satisfaction and labour mobility. Labour Econ. 2010, 17, 897–903. [Google Scholar] [CrossRef] [Green Version]
  70. Satudata. Ojek Online: Solusi Kerja Masa Kini. 2020. Available online: https://satudata.kemnaker.go.id/infograpik/eyJpdiI6Ik4yUVlDbytTZ2dDdlFUblp6emtPQlE9PSIsInZhbHVlIjoiQUR0N0FhMG5nN09odzhZNi9aWFovUT09IiwibWFjIjoiMjFmOTNlNzk0ZjIyZjYyNmFkZjQ3OGE1M2JmMTdkODk3ZGQzZDVhNWExMWZiODYzZTgwZTk0OTdlOTc4ZTU3NSJ9/details (accessed on 18 August 2021).
  71. Roberts, F.G.S.; Tiwari, S. Time to ACT: Realizing Indonesia’s Urban Potential. World Bank. 2019. Available online: https://openknowledge.worldbank.org/handle/10986/31304 (accessed on 6 April 2020).
  72. Prasetyanto, D.; Rizki, M.; Maulana, A. The Role of Attitude, Behavior, and Road Conditions in Traffic Violation among Workers and Students in Bandung City, Indonesia. Open Transp. J. 2021, 15, 147–159. [Google Scholar] [CrossRef]
  73. Joewono, T.B.; Susilo, Y.O. Traffic Violations by Young Motorcyclists on Indonesian Urban Roads. J. Transp. Saf. Secur. 2016, 9, 236–261. [Google Scholar] [CrossRef]
  74. Dempsey, P.S. Taxi industry regulation, deregulation, and reregulation: The paradox of market failure. Transp. Law J. 1996, 24, 73–120. [Google Scholar]
Figure 1. The proposed model construct.
Sustainability 13 10834 g001
Figure 2. Average factor scores for drivers’ attitude towards personal working behaviour based on daily trip frequency.
Sustainability 13 10834 g002
Table 1. Respondents’ characteristics.
VariableProportionMeanSD
Personal characteristics
Married 0.67
Single income as a ride-sourcing driver0.72
EducationDid not finish primary or secondary school0.14
Completed secondary school0.69
Completed Bachelor’s degree0.17
Monthly income<IDR 1 million0.04
IDR 1–3 million0.38
IDR 3–6 million0.43
IDR 6–9 million0.11
>IDR 9 million0.06
Working characteristics
Average daily trip frequency 14.325.65
Average trip distance<5 km0.22
5–10 km0.54
10–15 km0.10
>15 km0.14
Experience as a driver<1 year0.32
1–2 years0.39
>2 years0.30
Vehicle maintenance cost per month<IDR 100 thousand0.22
IDR 100–200 thousand0.47
>IDR 200 thousand0.31
Table 2. Respondents’ attitudes towards personal working behaviour characteristics.
VariablesMeanSD
High knowledge regarding urban road network3.640.72
Join the online driver community3.550.89
Love to interact with many people3.920.63
Enjoy driving on the road3.860.62
Take care of cleanliness3.920.64
Manage the working schedule3.760.70
Careful driver4.160.65
Manage health3.900.64
Prefer to drive at night3.220.88
Prefer to drive in the afternoon3.370.89
Happy with new destination3.510.67
Always achieve target3.500.81
Working every day3.150.94
Achievers 2.980.90
Never reject a customer’s trip request3.390.89
High driver rating2.720.87
Table 3. Respondents’ attitudes towards benefits and drawbacks of working characteristics.
VariableMeanSD
Fulfilling financial needs3.920.70
Health risk and its implications2.970.99
Risk of unemployment due to impermanent contract3.150.98
Risk of road accidents3.141.00
Worry about income uncertainty2.901.00
Table 4. Factor analysis of drivers’ attitude towards personal working behaviour.
VariablesComponent
Experienced and Socialized DriversCareful and Self-Attention DriversExplorer and Time-Selector DriversHigh Achiever Drivers
High knowledge regarding urban road network0.733
Join the online driver community0.712
Love to interact with many people0.783
Enjoy driving on the road0.728
Take care of cleanliness 0.675
Manage the working schedule 0.621
Careful driver 0.769
Manage healthiness 0.715
Prefer to drive at night 0.787
Prefer to drive in the afternoon 0.656
Happy with new destination 0.547
Always achieve target 0.503
Working every day 0.693
Achievers 0.736
Extraction method: Principal component analysis. Rotation method: Varimax with Kaiser normalization.
Kaiser–Meyer–Olkin measure of sampling adequacy0.777
Bartlett’s test of sphericity (χ2; df.; p-value)(1391; 105; 0.000)
Note: Loadings lower than 0.5 were suppressed [33].
Table 5. Model of job satisfaction.
VariablesUnstd. Coef.Std. Coef.t
BetaBeta
Constant−0.618 −1.759 a
Personal characteristics
 Married (D)−0.606−0.286−3.141 b
 Children (D)−0.474−0.214−2.359 b
 Bachelor drivers (D)−0.307−0.115−2.740 b
Working characteristics
 Only works as ride-sourcing driver (D)0.4190.1884.603 b
 Less than 5 km average distance per trip (D)0.2510.1042.490 b
 More than 15 km average distance per trip (D)−0.242−0.085−1.964 b
 Less than 1 year’s experience as driver (D)−0.205−0.096−2.241 b
 Higher than IDR 100,000 vehicle maintenance cost per month (D)−0.621−0.177−4.275 b
Attitude towards personal working behaviour
 Experienced and socialized driver0.0890.0892.069 b
 Careful and self-attentive driver0.1030.1032.445 b
 Explorer and time-selector driver0.0310.0310.738
Attitude towards benefits and drawbacks of the work
 Fulfilling financial needs0.3350.2345.244 b
 Health risk and its implications−0.172−0.170−3.351 b
 Risk of unemployment due to impermanent contract0.0650.0641.255
R2; F; p-value0.266; 12.362; 0.000
Unstd. = unstandardized; Std. = standardized; (D) = dummy; a significant at 10%; b significant at 5%.
Table 6. Model of daily trip frequency.
Variables Unstd. Coef.Std. Coef.t
BetaBeta
Constant16.960 45.945 b
Satisfaction
Job satisfaction ^1.3370.2572.418 b
Working characteristics
Monthly income higher IDR 9,000,000 (D)2.5090.0761.867 a
Monthly income less than IDR 3,000,000 (D)−3.857−0.342−8.098 b
CBRS driver (D)−2.742−0.194−4.716 b
Attitude towards personal working behaviour
Experienced and socialized driver−0.471−0.083−0.798
Careful and self-attentive driver−0.669−0.119−2.740 b
Explorer and time-selector driver−0.246−0.044−1.081
High achiever driver0.7250.1283.140 b
R2; F; p-value0.242; 19.280; 0.000
Unstd. = unstandardized; Std. = standardized; (D) = dummy; a significant at 10%; b significant at 5%; ^ estimated.
Publisher’s Note: MDPI stays neutral with regard to jurisdictional claims in published maps and institutional affiliations.

