Article

Distribution, Source and Potential Risk Assessment of Polychlorinated Biphenyls (PCBs) in Sediments from the Liaohe River Protected Area, China

1
Northeast Key Laboratory of Arable Land Conservation and Improvement, Ministry of Agriculture, College of Land and Environment, Shenyang Agricultural University, Shenyang 110866, China
2
College of Energy and Environment, Shenyang Aerospace University, Shenyang 110136, China
*
Author to whom correspondence should be addressed.
These authors contributed equally to this work.
Sustainability 2021, 13(19), 10750; https://doi.org/10.3390/su131910750
Submission received: 22 July 2021 / Revised: 12 September 2021 / Accepted: 18 September 2021 / Published: 28 September 2021
(This article belongs to the Special Issue Green Restoration of Polluted Environment)

Abstract

:
This study aimed to assess the occurrence, distribution, toxicity equivalency and health risks of dl-PCBs (dioxin-like PCBs) from nine sites collected in surface sediments from Liaohe River Protected Area. ∑dl-PCBs concentrations in sediments range from 79.2 to 365.1 pg/g. Sediment profiles showed that pentachlorobiphenyl is the most abundant congener among all sampling sites. The results of principal component analysis and cluster analysis indicated that PCBs were mainly derived from electronic waste and paint additives in the sediments of Liaohe River Protected Area. Toxic equivalent quantity (TEQ) values of the PCBs in the Liaohe River Protected Area sediments are at comparatively lower levels compared with the previously reported data. Hazardous ratio (HR) for human health risk assessment allied to cancer was found to be lower than the non-carcinogenic risk assessment within an acceptable range.

1. Introduction

Polychlorinated biphenyls (PCBs) are listed by the United Nations Environment Pro-gram as one of the persistent organic pollutants (POPs) worldwide, and because of their persistence and high fat solubility, PCBs accumulate in the bodies of living organisms [1,2]. Even low dose intake of PCBs will harm both humans and ecosystems due to its long-distance migration; its long-term effects have a half-life in organisms up to 1–10 years, and a high bioaccumulation factor [3,4,5,6].
The current studies have had difficulty analyzing the specific sources of persistent organic pollutants such as PCBs. So far, the method of analyzing the sources of PCBs in the sediments is principal component analysis, which is used in many studies. Wang et al. [7] analyzed the sources of PCBs in the sediments of the Pearl River Delta and concluded that fish feed was the main source of PCBs in the sediments. Di et al. [8] analyzed the sources of PCBs and polychlorinated dibenzo-p-dioxins, furan (PCDD/Fs) in the soil of the industrial area. The results showed that PCBs and PCDD/Fs derived from urban and industrial waste incineration. Ragab et al. [9] analyzed the sources of PCBs in the Red River and the results show that PCBs in sediment are mainly from the use of agriculture in the surrounding agricultural areas. This study combined principal component analysis and cluster analysis to analyze the sources of PCBs in Liaohe River Protected Areas. The analysis of the sources of PCBs in the sediments of the Liaohe River Protected Area will help the government to formulate management policies to reduce the amounts of PCBs produced in the future. As a reference method, it is also possible to determine the sources of PCBs in other river sediments.
Sediments are one of the main causes of PCBs in the water environment, which provides favorable conditions for the potential risks of organic pollutants [10]. Due to the high toxicity and potential harm [11], the analysis of content distribution of PCBs is particularly important. Over the past decades, toxicity equivalency factor (TEF) has been used to study the ecological risk of dl-PCBs in sediments [12]. Kang et al. [13] evaluated the toxic equivalent concentration of PCBs, indicating that the pollution of the Korean rivers was at a high level and derived mainly from industrial wastewater.
Mirsadeghi et al. [14] evaluated the carcinogenic risk and non-carcinogenic risk of polycyclic aromatic hydrocarbons (PAHs) in the exposure of Malaysian shellfish diets and direct intake of drinking water and sediments. Pongpiachan et al. [15] used a health risk assessment model to assess the health risk including carcinogenic and non-carcinogenic risk in the direct and skin exposure. However, the risk assessment method for direct ingestion and skin contact has considerable uncertainty because humans directly contact the seabed sediments through ingestion and skin exposure with difficulty. Based on the accumulation factors of the sediments in the Jiaozhou Bay wetland, Yang et al. [16] calculated the concentration of PAHs in the fish body through content of PAHs in the sediments, then evaluated the health risks caused by the dietary exposure pathway. The method established the relationship between the PAH concentration of the fish body and in the sediments. However, few scholars reported the studies regarding the health risk assessment of PCBs in sediments. In this study, the health risks of PCBs were evaluated in the sediments of Liaohe River Protected Areas.
This study is a field study based on chemical analysis of surface sediments, aiming to evaluate the current contamination status and health risk of PCBs as well as investigate their sources and toxicity equivalency.

2. Materials and Methods

2.1. Study Area and Sample Collection

The Liaohe River plays an important role in northeast China, flowing through four provinces with a total length of 1345 km. Due to a large number of human factors, the current Liaohe River has become one of China’s most polluted rivers. The Liaohe River Protected Area was established in 2010, mainly to establish ecological protection planning for protected areas, to carry out ecological assessment. At present, the study of sediments in the Liaohe River Protected Area is mainly focused on heavy metals, endocrine disrupting chemicals, AhR-agonists, and organ chlorine [17,18,19,20].
Samples of nine surface sediments (<10 cm) were collected in the main stream of the Liaohe River Protected Area in May 2014 (Figure 1). Nine sampling sites are the intersection point of tributary and main stream in the Liaohe River. Sediment samples were collected by a stainless-steel grab and then dried by a freeze dryer in our laboratory. After drying, the sediments were homogenized with a grinder and passed through a 200 mesh sieve prior to extraction.

2.2. Chemical Analysis

Soxhlet extraction was carried out to quantify target PCBs in sediments by using a total of 400 mL of acetone: n-hexane (1:1) mixed solvent. The reflow speed was controlled at 5–6 times/h, and the solvents were continuously extracted for 36 h with copper scraps. After extraction with nitrogen, the extract was replaced with n-hexane. Based on the polarity of the organic matter in the extracted sample, a special glass tube of 50 cm and an inner diameter of 10 mm was used, and alumina and silica gel were used as the filler. Elution process: The column was eluted with 70 mL of n-hexane: dichloromethane (7:3 by volume) to collect the eluent. The eluent was concentrated to 1 ml under a stable nitrogen stream before testing. The quantitative internal standard was also added and tested.
PCBs in the test solutions were measured by JMS800D (HRGC/HRMS) (JEOL, Tokyo, Japan). The chromatographic column is DB-5MS (Agilent Technologies Inc, Palo Alto, CA, USA) (60 m × 0.25 mm × 0.25 μm). Inlet temperature: 270 °C; Carrier gas: He (99.9995%); Flow rate: 1.2 mL/min; Input method: no shunt, 2 μL; Temperature program: 75 °C (2 min)—(15 °C/min) 150 °C—(2.5 °C/min)—290 °C (1 min). Mass spectrometer conditions were: ionization mode: El, electron energy 38 eV. Scan mode: Select ion detection SIM; Resolution > 10,000; Calibration: All tetra-fluorocarbon oil PFK was used as quality correction material.

2.3. Assessment Model of Health Risk

The human body can be exposed to pollution in the environment through a variety of exposure routes, according to the provisions of USEPA 1989, the actual exposure of the sediments to the human body and related literature [16], taking into account the intake of food (fish, shellfish, etc.). The direct exposure route is exposed as follows:
CDI Direct intake = C fish · IR fish · CF · ED · EF / BW · AT
where CDIDirect intake is the amount of chronic daily intake (mg/(kg·d)), Cfish is concentration of contaminants in fish (mg/kg), IRfish is the ingestion rate (g/d); BW is the mean body weight (kg), AT is the average time (non-carcinogenic: 30y × 365d = 10,950d; carcinogen: 70y × 365d = 25,550d) [16]; ED is the exposure day, EF is the exposure frequency (d/y), and CF is the concentration conversion factor (10−6 kg/mg).
The biota sediment accumulation factor (BSAF) was defined for the ratio of pollutant content to sediment pollutants in the organism by USEPA and some scholars have calculated the BSAF values of PCBs by a large number of experimental studies. The studies provide the possibility of estimating the concentration of pollutants in the body based on the concentration of pollutants in the sediments [21]. The concentration of PCBs in fish (Cfish) can be calculated according to the following formula [22]:
C fish = C sediments · f lipid · BASF / OC sediments
where Csediments is the concentration of PCBs in sediments (mg/kg), flipid is the fat content of fish (0.07), OCsediments is the percentage of organic carbon in the sediments (0.04).
Tracey [21] used 1.03 as the BSAF of PCBs on the basis of summarizing the different BSAF data of 4054 groups of 27 species.
It is obviously unreasonable to assess the health risk of all people with only one type of exposed population, due to the different physical characteristics and exposure conditions of different populations According to the relevant studies, we selected the children (1–11 years old), young people (12–17 years old), adults (18–70 years old) as three exposure conditions for health risk assessment, the exposure parameters of the three groups of people selected from the studies (Table 1) [22].
Non-carcinogenic risk assessment calculations are characterized by the chronic daily intake (CDI) to the chronic reference dose (RfD) [22] of the poison, usually expressed as health quotient (HQ) [23].
HQ = CDI Direct intake / RfD Direct intake
where HQ is a non-carcinogenic risk value, CDIDirect intake is chronic daily intake(mg/kg·d−1); RfDDirect intake is Ccronic reference dose (mg/kg·d−1). The RfD of the direct route of PCBs was 2 × 10⁻⁵ mg/kg·d−1 [24].
The total non-carcinogenic risk is the value for each substance when calculated for the non-carcinogenic risk associated with the combined effects of multiple substances and expressed by the Health Index (HI).
HI = HQ 1 + HQ 2 + + HQ n
Non-carcinogenic health risk assessment has a threshold only if the non-carcinogenic risk exceeds its threshold. According to USEPA, when HI ≤ 1, no non-carcinogenic effects are produced; when HI > 1, the exposed population has a potential non-carcinogenic risk [16].
The carcinogenic risk assessment is usually calculated using the product of daily exposure dose CDI and carcinogenic slope factor which is denoted by R. Oral intake of sediment particles caused by carcinogenic risk R can be calculated as follows:
R Direct intake = CDI Direct intake · CSF Direct intake
CDIDirect intake is the chronic daily intake in the direct route of ingestion (mg/kg/d), CSFDirect intake is the cancer slope factor of the direct route of ingestion (mg/kg/d)−1, which is 2 about PCBs (mg/kg/d)−1 [23].
Carcinogenic risk assessment is no threshold concept, as long as the presence of carcinogenic substances that exposure to human health hazards. According to USEPA, the carcinogenic risk is less than 10−6 shows that PCBs have little potential carcinogenic risk to the human bodies. When the value is at 10−4–10−6, the carcinogenic risk is at an acceptable level. When the value is greater than 10−4 that the carcinogenic risk is unacceptable, it will have a significant risk of human health carcinogenic risk [16].

2.4. Quality Assurance and Quality Control

Prior to sample analysis, column performance was checked and the peaks in the sample were subjected to external standardization and quantitative analysis using a mixed standard. The target compound was not detected in the assay blank. The sampling recoveries of PCBs congeners range from 80.9% to 113.2%. The limit of detection (LOD) and limit of quantification (LOQ) were established to evaluate the sensitivity. The LOD and LOQ of the instrument were respectively defined as signal-to noise (S/N) of 3:1 and 10:1. The LOD was calculated as 10–60 pg/g while the LQD was 20–120 pg/g. The relative standard deviation (RSD) was less than 20%. Quantitative results for all target compounds were corrected for blanks and recovery.

3. Results and Discussion

3.1. PCB Concentrations in Sediments from the Liaohe River

The concentration of PCBs ranges from 79.2 to 416.2 pg/g (for dry weight), and the mean value is 365.1 pg/g (for dry weight) (Table 2), partly fell within the range of global soil background values (0.026–97 ng/g) [25], and is slightly higher than that of the East Sea in surface sediments in China (24.3–343 pg/g) [26], which is much lower than the economically developed Pearl River Delta region (11.5–48.3 ng/g) [13], the Yangtze River Delta region (5.08–19.04 ng/g) [27], and Monastir Bay (3.1–9.3 ng/g) [28]. In addition, the highest concentration of PCBs is at S9, followed by S8, and the lowest concentration of PCBs is at S5. PCB123, PCB118, and PCB77 are the main components in the Liaohe River Protected Area. Due to both a relative lack of natural sources of PCBs in the ecosystem and rapid economic growth, the main sources of PCBs in China are the increasing industrial products, e-waste disassembly, and inadvertent releases from capacitor equipment [29,30]. In order to prevent the leakage of PCBs and keep the content within a safe range, although the PCBs content is relatively low, the government still needs to strengthen the management of storage points and recycling processes for industrial and commercial products containing PCBs.

3.2. Sources of PCBs in the Sediments

Among all PCBs congeners, tri-, tetra- and penta-CBs were classified as light PCBs, while hexa- and hepta-CBs were classified as heavy PCBs [31]. The distribution trend of dl-PCBs concentrations in the Liaohe River Protected Area is ranked as Pe-PCB > Tc-PCB > Hx-PCB > Hp-PCB, which was similar to the PCB distribution in sediments of Fenhe reservoir [32] and Jiaojiang Estuary [33] from China. The concentration of Pe-PCB accounting for more than 55%, even reaching 76% at S8 (Figure 2). It is worth noticing that Pe-PCB, Tc-PCB, and Hx-PCB are the main PCBs in all sampling sites, which is mainly due to that more than 95% of PCBs discharged to the estuarine environment in China consist of tri-CBs to Hx-PCBs [34]. Obviously, the concentration of heavy PCBs (Hx-PCB and Hp-PCB) is lower than that of light PCBs (Tc-PCB and Pe-PCB). This might be due to the degradation of heavy PCBs into light PCBs through long-distance transportation [30], and because light PCBs are easier to transport [32].
The dl-PCBs are mainly derived from the Pe-PCB in the surface sediments of the Liaohe River Protected Area. The concentration of Tc-PCB and Hx-PCB respectively range from 13% to 39% and 1.6% to 12% at all sampling sites. Although the molecular weight of the individual congener of Hp-PCB is higher than Pe-PCB, the content of Hp-PCB accounted for ND to 2%, which is lower than Pe-PCB, probably because high chlorinated polychlorinated biphenyls can be degraded quickly by microbial metabolism of bacteria and fungi [35,36], resulting in lower pollution levels of surface sediments in the Liaohe River Protected Area. However, the highest percentage of Pe-PCB indicates that the potential source of PCBs might be ship painting [30]. Furthermore, the second highest percentage of Tc-PCB leads to the existence of fish feed contamination in the Liaohe River [7].
Cluster and principal component analysis were used to analyze the sources of dL-PCBs. The results of the principal component analysis with different samples as variables explained 78.8% of the variation of the principal variable (PC1) and sub-variable (PC2) of PCBs in different samples (Figure 3). PC1 explained 57.3% of the total variance with a high loading of PCB156 and PCB189, while PC2 explained 21.5% of the total variance with a high loading of PCB77, PCB118, and PCB123. Then, the samples were divided into three groups (Figure 4).
The first group is S2 with a higher level of PCB77, PCB118, and PCB123. The composition of PCBs at S2 is similar to Aroclor1242 and mainly exists in electronic products, indicating those PCBs (PCB77, PCB118, and PCB123) presumably derive from electronic wastes at S2. The second group includes S8 and S9 where the level of PCB156, PCB189 is higher, the composition is similar to Aroclor1254 [37]. The pollution likely derives from commercial products such as Aroclor1254 of oil paint. Other sampling sites comprise the third group with similar compositions of S2, but the concentration of PCBs is further lower than that of S2, which presumably affected by S2. The results indicate a lower level but widespread pollution of PCBs in the third group.

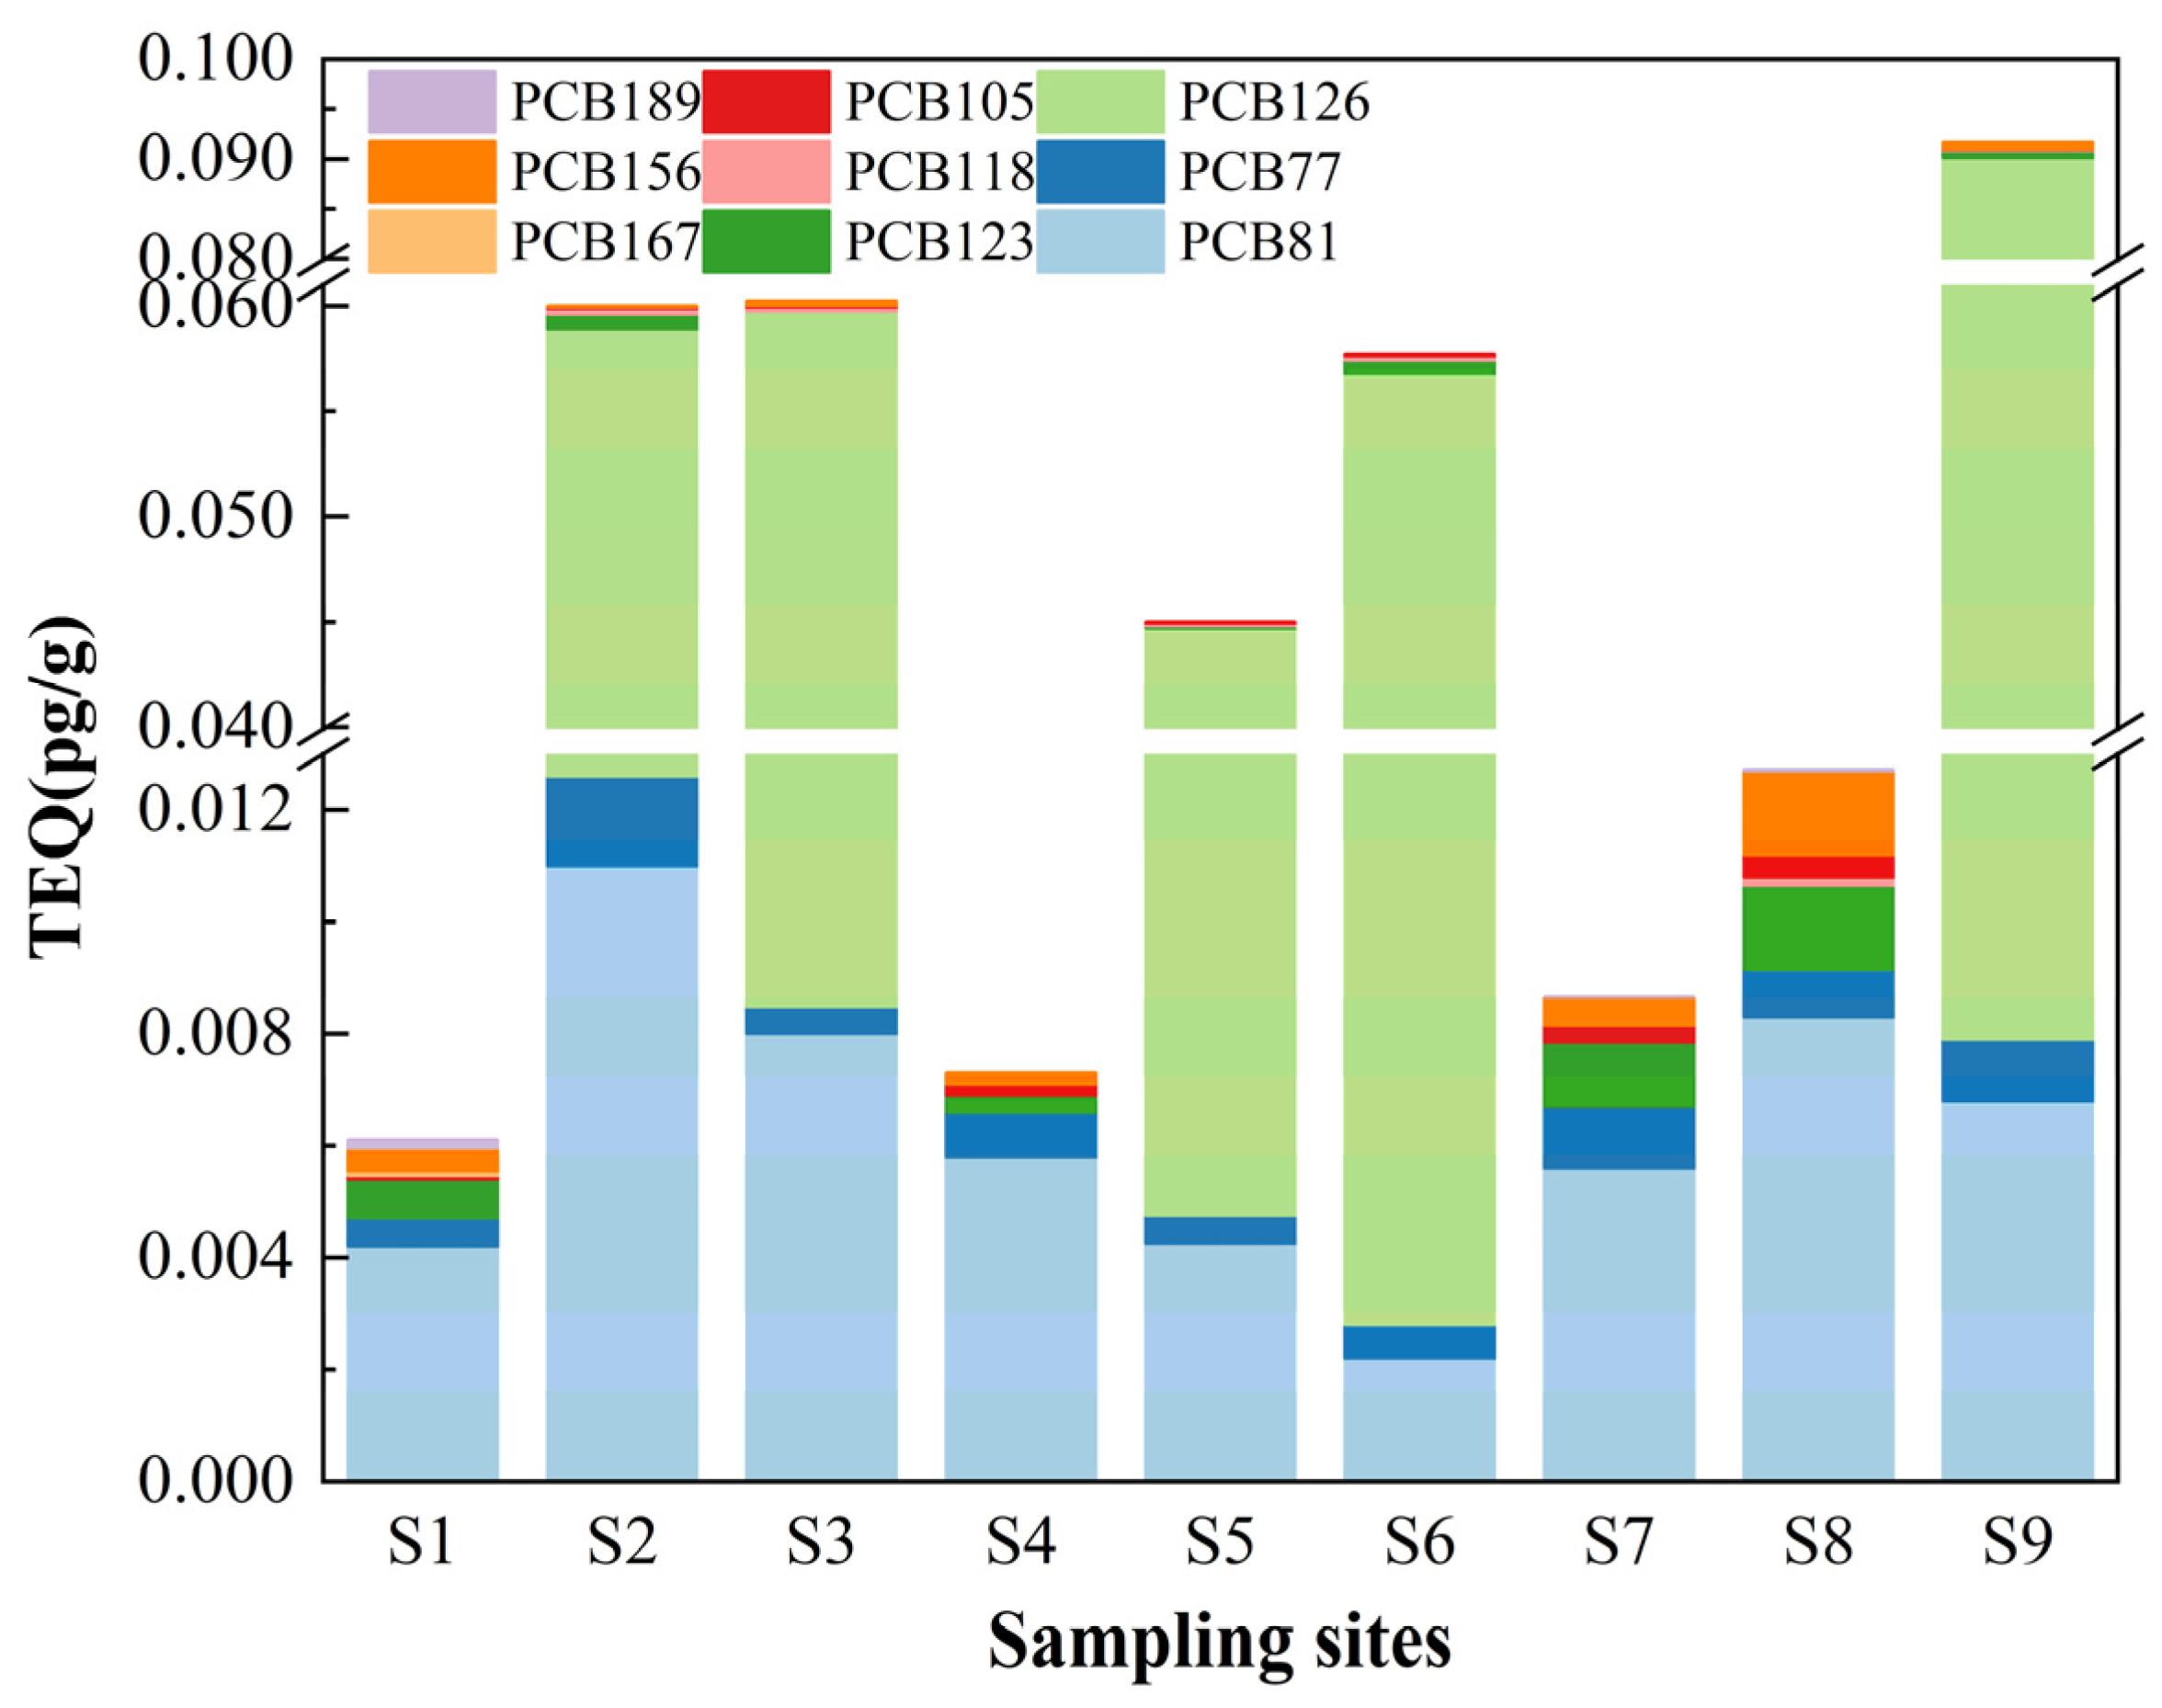
3.3. Toxic Equivalents and Health Risk of dl-PCBs

According to the environmental quality standards proposed by Long [38], effect range low (ERL) and effect range mediate (ERM) of PCBs were 22.7 ng/g and 180 ng/g, respectively. The concentration of PCBs ranges from 79.2 to 146.2 pg/g in the sediments from the Liaohe River Protected Area, which is lower than ERL and ERM. Thus, PCBs are unlikely to harm aquatic organisms, because the ecological risk probability of PCBs is less than 10%. The TEQ of PCBs concentration range from 5.8 × 10⁻³ to 9 × 10⁻² pg/g with the average concentration of 3.8 × 10⁻² pg/g in the Liaohe River Protected Area. The concentration of PCBs is much lower than the Canadian sediments quality standards (4 pg/g) [39], indicating little ecological risk in the Liaohe River Protected Area. PCB126 is the main contributor to TEQ at S2, S3, S5, S6, and S9 (Figure 5). The difference is mainly caused by the various TEF of diverse PCBs, and PCB126 has a greater carcinogenic risk compared with other PCBs. While PCB126 is not detected at S1, S4, S7, and S8. PCB81 mainly contributes to TEQ, but the much lower TEF of PCB81 than PCB126 led to lower total TEQ at S1, S4, S7, and S8. However, the possible ecological hazards cannot be ignored due to the bio-accumulative effect of PCBs.
This study carried out the non-carcinogenic risk assessment of nine species of PCBs. The results showed a low carcinogenic risk from ingesting fish grown in the studied areas. The non-carcinogenic risk values for children, young people and adults were respectively 2.8 × 10⁻² (1.1 × 10⁻² to 5.0 × 10⁻²), 3.3 × 10⁻² (1.3 × 10⁻² to 5.8 × 10⁻²), and 0.23 (9 × 10⁻² to 0.40), non-carcinogenic risk is less than 1 (Figure 6), indicating little risk of non-carcinogenic. The non-carcinogenic risk of adults in the three groups was significantly great, which is 8.2 times and 7 times higher than that of children and young people, respectively. The selection of non-carcinogenic parameters mainly contributes to the difference in the evaluation results. The highest exposure dose and non-carcinogenic risk present in adults on account of the longest exposure dose and highest direct intake rate of the fish. The non-carcinogenic risk of children is lower than that of young people but with higher exposure dose (ED) on account of the lower fish intake rate (IR) and body weight (BW). Contaminants dose intake (CDI) calculation shows lower BW and ED of children than that of young people, indicating the lower non-carcinogenic risk of children.
The same chronic reference dose (RD) values of different monomer PCBs indicates that the non-carcinogenic risk of each monomer was related to the concentration and the exposure parameters of diverse people (Figure 7). In order to provide guidance for controlling pollutant emissions and protecting human health, we selected major contributors to non-carcinogenic risk by comparing PCB isomers. The isomers that put adults at the highest risk of developing non-carcinogenic risk were selected for the study. The non-carcinogenic risk of each PCBs isomer is lower than 1, indicating little non-carcinogenic risk for single isomer. PCB123 and PCB77 are the main contributors to the non-carcinogenic risk for their highest concentration.
The carcinogenic risk of PCBs for children, young and adults was respectively 1.33 × 10⁻⁶ (7.20 × 10⁻⁷ to 2.97 × 10⁻⁶), 1.54 × 10⁻⁶ (9.42 × 10⁻⁷ to 3.44 × 10⁻⁶) and 1.05 × 10⁻⁵ (Figure 8). The carcinogenic risk values lower than 10−6 indicate no potential carcinogenic risk. The higher carcinogenic risk in adults than in young and children still relates to dietary intake. The carcinogenic risk of PCBs for adults in two carcinogenic PCBs (PCB118, PCB156) was 8.9 × 10⁻⁶ (3.1 × 10⁻⁶ to 8.0 × 10⁻⁵) and 1.4 × 10⁻⁵ (ND to 5.14 × 10⁻⁶).

4. Conclusions

In this study, the concentration of dl-PCBs was analyzed by HRGC/HRMS and the risk assessment of PCBs was carried out by using the health risk model. The results showed that the concentration of PCBs and TEQs is at a moderate and low level in sediments from the Liaohe River Protected Area, while the environmental risk still cannot be ignored. PCBs were mainly derived from electronic waste and commercial products such as paint additives, and later to focus on controlling the disorderly emissions of electronic waste. The risk of PCBs was within the range of acceptable risk by health risk assessment. The results of non-carcinogenic risk assessment of nine species of PCBs showed a low carcinogenic risk from ingesting fish grown in the studied areas. Although the non-carcinogenic risk of PCBs is low for children, young people, and adults, the non-carcinogenic risk of adults in the three groups was significantly greater: 8.2 times and 7 times higher than that of children and young people, respectively.

Author Contributions

Conceptualization, Y.Z. and C.W.; data curation, Y.Z.; formal analysis, C.W.; funding acquisition, Y.Z.; investigation, C.W.; methodology, Y.Z.; project administration, Y.Z. and L.D.; resources, Y.Z.; software, Y.Z.; supervision, Y.Z.; validation, C.W.; visualization, C.W.; writing–original draft, C.W.; writing–review and editing, C.W. All authors have read and agreed to the published version of the manuscript.

Funding

This research was funded by LIAONING REVITALIZATION TALENTS PROGRAM (NO: XLYC1807045) AND SHENYANG YOUTH SCIENCE, TECHNOLOGY INNOVATION TALENTS SUPPORT PLAN (NO: RC180101).

Acknowledgments

This research was supported by LIAONING REVITALIZATION TALENTS PROGRAM (NO: XLYC1807045) and SHENYANG YOUTH SCIENCE, TECHNOLOGY INNOVATION TALENTS SUPPORT PLAN (NO: RC180101).

Conflicts of Interest

The authors declare no conflict of interest.

References

  1. Anim, A.K.; Drage, D.S.; Goonetilleke, A.; Mueller, J.F.; Ayoko, G.A. Distribution of PBDEs, HBCDs and PCBs in the Brisbane River estuary sediment. Mar. Pollut. Bull. 2017, 120, 165–173. [Google Scholar] [CrossRef] [PubMed] [Green Version]
  2. Diop, M.; Net, S.; Howsam, M.; Lencel, P.; Watier, D.; Grard, T.; Duflos, G.; Diouf, A.; Amara, R. Concentrations and Potential Human Health Risks of Trace Metals (Cd, Pb, Hg) and Selected Organic Pollutants (PAHs, PCBs) in Fish and Seafood from the Senegalese Coast. Int. J. Environ. Res. 2017, 11, 349–358. [Google Scholar] [CrossRef]
  3. Abarnou, A.; Dupont, J.P.; Avoine, J.; Lafite, R.; Simon, S. Role of suspended sediments on the distribution of PCB in the Seine Estuary (France). Cont. Shelf Res. 2018, 7, 1345–1350. [Google Scholar] [CrossRef]
  4. Eqani, S.A.; Malik, R.N.; Katsoyiannis, A.; Zhang, G.; Chakraborty, P.; Mohammad, A.; Jones, K.C. Distribution and risk assessment of organochlorine contaminants in surface water from River Chenab, Pakistan. J. Environ. Monit. 2012, 14, 1645–1654. [Google Scholar] [CrossRef]
  5. Pedersen, K.B.; Lejon, T.; Jensen, P.E.; Ottosen, L.M. Simultaneous electrodialytic removal of PAH, PCB, TBT and heavy metals from sediments. J. Environ. Manag. 2017, 198, 192–202. [Google Scholar] [CrossRef] [Green Version]
  6. Tombesi, N.; Pozo, K.; Álvareza, M.; Přibylová, P.; Kukučka, P.; Audy, O.; Klánová, J. Tracking polychlorinated biphenyls (PCBs) and polybrominated diphenyl ethers (PBDEs) in sediments and soils from the southwest of Buenos Aires Province, Argentina (South eastern part of the GRULAC region). Sci. Total Environ. 2017, 575, 1470–1476. [Google Scholar] [CrossRef]
  7. Wang, H.S.; Du, J.; Leung, H.M.; Leung, A.O.W.; Liang, P.; Giesy, J.P.; Wong, C.K.C.; Wong, M.H. Distribution and source apportionments of polychlorinated biphenyls (PCBs) in mariculture sediments from the Pearl River Delta, South China. Mar. Pollut. Bull. 2011, 63, 516–522. [Google Scholar] [CrossRef]
  8. Di, G.A.; Terzaghi, E.; Raspa, G.; Borin, S.; Mapelli, F.; Chouaia, B.; Zanardini, E.; Morosini, C.; Colombo, A.; Fattore, E. Differentiating current and past PCB and PCDD/F sources: The role of a large contaminated soil site in an industrialized city area. Environ. Pollut. 2017, 223, 367–375. [Google Scholar]
  9. Ragab, S.; Sikaily, A.E.; Nemr, A.E. Concentrations and sources of pesticides and PCBs in surficial sediments of the Red Sea coast, Egypt. Egypt J. Aquat. Res. 2016, 42, 365–374. [Google Scholar] [CrossRef] [Green Version]
  10. Cui, S.; Fu, Q.; Guo, L.; Li, Y.F.; Li, T.X.; Ma, W.L.; Wang, M.; Li, W.L. Spatial–temporal variation, possible source and ecological risk of PCBs in sediments from Songhua River, China: Effects of PCB elimination policy and reverse management framework. Mar. Pollut. Bull. 2016, 106, 109–118. [Google Scholar] [CrossRef] [PubMed]
  11. Mahmood, A.; Syed, J.H.; Malik, R.N.; Zheng, Q.; Cheng, Z.; Li, J.; Zhang, G. Polychlorinated biphenyls (PCBs) in air, soil, and cereal crops along the two tributaries of River Chenab, Pakistan: Concentrations, distribution, and screening level risk assessment. Sci. Total Environ. 2014, 481, 596–604. [Google Scholar] [CrossRef]
  12. Safe, S. Polychlorinated biphenyls (PCBs), dibenzo-p-dioxins (PCDDs), dibenzofurans (PCDFs), and related compounds: Environmental and mechanistic considerations which support the development of toxic equivalency factors (TEFs). Crit. Rev. Toxicol. 1990, 21, 51–88. [Google Scholar] [CrossRef]
  13. Kang, Y.H.; Sheng, G.Y.; Fu, J.M.; Mai, B.X.; Zhang, G.; Lin, Z.; Min, Y.S. Polychlorinated Biphenyls in Surface Sediments from the Pearl River Delta and Macau. Mar. Pollut. Bull. 2000, 40, 794–797. [Google Scholar] [CrossRef]
  14. Mirsadeghi, S.A.; Zakaria, M.P.; Yap, C.K.; Shahbazi, A. Risk assessment for the daily intake of polycyclic aromatic hydrocarbons from the ingestion of cockle (Anadara granosa) and exposure to contaminated water and sediments along the west coast of Peninsular Malaysia. J. Environ. Sci. 2011, 23, 336–345. [Google Scholar] [CrossRef]
  15. Pongpiachan, S.; Tipmanee, D.; Deelaman, W.; Muprasit, J.; Feldens, P.; Schwarzer, K. Risk assessment of the presence of polycyclic aromatic hydrocarbons (PAHs) in coastal areas of Thailand affected by the 2004 tsunami. Mar. Pollut. Bull. 2013, 76, 370–378. [Google Scholar] [CrossRef] [PubMed]
  16. Yang, W.; Lang, Y.; Li, G. Cancer risk of polycyclic aromatic hydrocarbons (PAHs) in the soils from Jiaozhou Bay wetland. Chemosphere 2014, 112, 289–295. [Google Scholar] [CrossRef]
  17. Ke, X.; Wang, C.; Zhang, H.; Zhang, Y.; Gui, S. Characterization of estrogenic receptor agonists and evaluation of estrogenic activity in the sediments of Liaohe River protected areas. Mar. Pollut. Bull. 2015, 100, 176–181. [Google Scholar] [CrossRef] [PubMed]
  18. Li, H.; Ye, S.; Ye, J.; Fan, J.; Gao, M.; Guo, H. Baseline survey of sediments and marine organisms in Liaohe Estuary: Heavy metals, polychlorinated biphenyls and organochlorine pesticides. Mar. Pollut. Bull. 2016, 114, 555–563. [Google Scholar] [CrossRef] [PubMed]
  19. Ke, X.; Gui, S.; Huang, H.; Zhang, H.; Wang, C.; Guo, W. Ecological risk assessment and source identification for heavy metals in surface sediment from the Liaohe River protected area, China. Chemosphere 2017, 175, 473–481. [Google Scholar] [CrossRef]
  20. Zhang, Y.; Ke, X.; Gui, S.; Wu, X.; Wang, C.; Zhang, H. Evaluation of AhR-agonists and AhR-agonist activity in sediments of Liaohe River protected areas, China. Mar. Pollut. Bull. 2017, 115, 292–296. [Google Scholar] [CrossRef]
  21. Tracey, G.A.; Hansen, D.J. Use of Biota-Sediment Accumulation Factors to assess similarity of nonionic organic chemical exposure to benthically-coupled organisms of differing trophic mode. Arch. Environ. Contam. Toxicol. 1996, 30, 467–475. [Google Scholar] [CrossRef]
  22. Xia, Z.H.; Duan, X.L.; Qiu, W.X.; Liu, D.; Wang, B.; Tao, S.; Jiang, Q.J.; Lu, B.; Song, Y.X.; Hu, X.X. Health risk assessment on dietary exposure to polycyclic aromatic hydrocarbons (PAHs) in Taiyuan, China. Sci. Total Environ. 2010, 408, 5331–5337. [Google Scholar] [CrossRef]
  23. Lang, Y.H.; Li, G.L.; Yang, W.; Wang, X.M.; Peng, P. Ecological Risk and Health Risk Assessment of Dioxin-like PCBs in Liaohe Estuarine Wetland Soils, China. Polycycl. Aromat. Compd. 2014, 34, 425–438. [Google Scholar] [CrossRef]
  24. Kumar, B.; Verma, V.K.; Kumar, S.; Sharma, C.S. Probabilistic health risk assessment of polycyclic aromatic hydrocarbons and polychlorinated biphenyls in urban soils from a tropical city of India. Environ. Lett. 2013, 48, 1253–1263. [Google Scholar] [CrossRef]
  25. Meijer, S.N.; Ockenden, W.A.; Sweetman, A.; Breivik, K.; Grimalt, J.O.; Jones, K.C. Global distribution and budget of PCBs and HCB in background surface soils: Implications or sources and environmental processes. Environ. Sci. Technol. 2003, 37, 667–672. [Google Scholar] [CrossRef] [PubMed]
  26. Zhang, P.; Song, J.; Liu, Z.; Zheng, G.; Zhang, N.; He, Z. PCBs and its coupling with eco-environments in Southern Yellow Sea surface sediments. Mar. Pollut. Bull. 2007, 54, 1105–1115. [Google Scholar] [CrossRef]
  27. Wang, H.; Wang, A.; Bi, N.; Zeng, X.; Xiao, H. Seasonal distribution of suspended sediment in the Bohai Sea, China. Cont. Shelf Res. 2014, 90, 17–32. [Google Scholar] [CrossRef]
  28. Nouira, T.; Risso, C.; Chouba, L.; Budzinski, H.; Boussetta, H. Polychlorinated biphenyls (PCBs) and Polybrominated Diphenyl Ethers (PBDEs) in surface sediments from Monastir Bay (Tunisia, Central Mediterranean): Occurrence, distribution and seasonal variations. Chemosphere 2013, 93, 487–493. [Google Scholar] [CrossRef] [PubMed]
  29. Erickson, M.D.; Kaley, R.G. Applications of polychlorinated biphenyls. Environ. Sci. Pollut. Res. 2011, 18, 135–151. [Google Scholar] [CrossRef] [PubMed]
  30. Tang, D.H.; Liu, X.J.; He, H.J.; Cui, Z.A.; Gan, H.Y.; Xia, Z. Distribution, sources and ecological risks of organochlorine compounds (DDTs, HCHs and PCBs) in surface sediments from the Pearl River Estuary, China. Mar. Pollut. Bull. 2020, 152, 110942. [Google Scholar] [CrossRef] [PubMed]
  31. Wang, W.; Bai, J.H.; Zhang, G.L.; Xin, J.J.; Wang, X.; Liu, X.H.; Cui, B.S. Occurrence, sources and ecotoxicological risks of polychlorinated biphenyls (PCBs) in sediment cores from urban, rural and reclamation-affected rivers of the Pearl River Delta, China. Chemosphere 2019, 218, 359–367. [Google Scholar] [CrossRef]
  32. Li, W.H.; Tian, Y.Z.; Shi, G.L.; Guo, C.S.; Feng, Y.C.; Yue, X.P. Source and risk assessment of PCBs in sediments of Fenhe reservoir and watershed, China. J. Environ. Monit. 2012, 14, 1256. [Google Scholar] [CrossRef]
  33. Zhou, S.S.; Shao, L.Y.; Yang, H.Y.; Wang, C.; Liu, W.P. Residues and sources recognition of polychlorinated biphenyls in surface sediments of Jiaojiang Estuary, East China Sea. Mar. Pollut. Bull. 2012, 64, 539–545. [Google Scholar] [CrossRef]
  34. Duan, X.; Li, Y.; Li, X.; Li, M.; Zhang, D. Distributions and sources of polychlorinated biphenyls in the coastal East China Sea sediments. Sci. Total Environ. 2013, 463–464, 894–903. [Google Scholar] [CrossRef] [PubMed]
  35. Rhee, G.Y.; Sokol, R.C.; Bush, B.; Bethoney, C.M. Long-term study of the anaerobic dechlorination of Aroclor 1254 with and without biphenyl enrichment. Environ. Sci. Technol. 1993, 27, 714–719. [Google Scholar] [CrossRef]
  36. Maltseva, O.V.; Tsoi, T.V.; Iii, J.F.Q.; Fukuda, M.; Tiedje, J.M. Degradation of anaerobic reductive dechlorinationproducts of Aroclor 1242 by four aerobic bacteria. Biodegradation 1999, 10, 363–371. [Google Scholar] [CrossRef] [PubMed]
  37. Frame, G.M.; Cochran, J.W.; Bøwadt, S.S. Complete PCB congener distributions for 17 aroclor mixtures determined by 3 HRGC systems optimized for comprehensive, quantitative, congener specific analysis. J. High Resolut. Chromatogr. 1996, 19, 657–668. [Google Scholar] [CrossRef]
  38. Long, E.R.; Macdonald, D.D.; Smith, S.L.; Calder, F.D. Incidence of adverse biological effects within ranges of chemical concentrations in marine and estuarine sediments. Environ. Manag. 1995, 19, 81–97. [Google Scholar] [CrossRef]
  39. McCready, S.; Birch, G.F.; Long, E.R.; Spyrakis, G.; Greely, C.R. Predictive abilities of numerical sediment quality guidelines in Sydney Harbour, Australia, and vicinity. Environ. Int. 2006, 32, 638–649. [Google Scholar] [CrossRef]
Figure 1. Sampling sites in the Liaohe River Protected Area, China.
Sustainability 13 10750 g001
Figure 2. PCB homologue group proportions in sediments of nine sampling sites.
Sustainability 13 10750 g002
Figure 3. Principal component analysis (PCA) of PCBs in sediments from the Liaohe River Protected Area.
Sustainability 13 10750 g003
Figure 4. Cluster analysis of PCBs in sediments from the Liaohe River Protected Area.
Sustainability 13 10750 g004
Figure 5. Contributions to ΣTEQ of different substituent chlorines PCBs at different sampling sites.
Sustainability 13 10750 g005
Figure 6. The non-carcinogenic risk of three age groups.
Sustainability 13 10750 g006
Figure 7. The non-carcinogenic risks of individual PCBs.
Sustainability 13 10750 g007
Figure 8. Carcinogenic risk of three age groups.
Sustainability 13 10750 g008
Table 1. Different population exposure parameters.
Exposure ParameterUnitDistribution StatusChildYoungAdult
IRg/dlogarithmic normal distributionLN(2.4,0.24)LN(9.9,0.99)LN(14.4,1.44)
EDauniform distributionU(0,11)U(0,6)U(0,52)
AFmg/cm2logarithmic normal distributionLN(0.04,3.41)LN(0.04,3.41)LN(0.02,2.67)
EFd alogarithmic normal distributionLN(252,1.01)LN(252,1.01)LN(252,1.01)
BWkglogarithmic normal distributionLN(16.68,1.48)LN(32.41,1.08)LN(59.78,1.07)
Table 2. Concentrations of PCBs: the calculated TEQ of PCBs in sediments of Liaohe River.
AnalytesConcentrations at Different Sampling Sites (pg/g) (Dry Weight)
S1S2S3S4S5S6S7S8S9
PCB811.92.25.84.23.12.21.13.04.8
PCB771.8 × 10−229.4101.727.535.226.433.452.243.6
PCB12622ND2.12.3ND1.82.4NDND
PCB1690.47NDNDNDNDNDNDNDND
PCB1231.2 × 10−252.647.036.625.511.764.473.6134.5
PCB1183.5 × 10−442.069.638.135.721.246.362.4111.0
PCB1141.0 × 10−3NDNDNDNDNDNDNDND
PCB1058.0 × 10−312.340.117.718.515.920.229.532.8
PCB1679.0 × 10−32.62.01.81.1ND2.7NDND
PCB1565.5 × 10−26.92.66.23.5ND5.89.530.4
PCB1571.5 × 10−2NDNDNDNDNDNDNDND
PCB1891.0 × 10−21.94.12.2NDND1.91.48.0
Σ12 dioxin-like PCBs24.5149.9275136.6122.679.2178.2231.6365.1
TEQPCBs (pg/g)0.0060.010.060.060.010.040.060.010.01
ND presents the PCBs that are not detected at the sampling site.
Publisher’s Note: MDPI stays neutral with regard to jurisdictional claims in published maps and institutional affiliations.

