Article

Design Optimization and Comparative Analysis of 100% Renewable Energy Systems for Residential Communities in Typical Areas of China When Considering Environmental and Economic Performance

1
State Grid Hubei Electric Power Research Institute, Wuhan 430015, China
2
School of Environmental Science and Engineering, Huazhong University of Science and Technology, Wuhan 430074, China
*
Authors to whom correspondence should be addressed.
Sustainability 2021, 13(19), 10590; https://doi.org/10.3390/su131910590
Submission received: 15 July 2021 / Revised: 16 September 2021 / Accepted: 21 September 2021 / Published: 24 September 2021
(This article belongs to the Special Issue Utilization of Solar Energy in Smart Buildings)

Abstract

:
A 100% renewable energy system (RES) satisfies a user’s energy demand using only renewable energy, which is an important energy supply in China given that the government aims to realize carbon neutrality by 2060. The design and operation of 100% RESs in different areas would vary significantly due to the impacts of climates and geographical features. This study aimed to investigate the economic and environmental performance of 100% RESs for residential communities in different areas of China. In total, 30 typical cities were chosen based on the climate characteristics and the availability of renewable energy resources. The genetic algorithm was selected to obtain the optimal design of the 100% RES in each area by taking the minimum total annual cost and the minimum CO2 emissions as optimization objectives. The results showed that 100% RESs were dominated by solar energy and biomass. The investment could be recovered in 8 years if the economic performance was optimized in most areas, but the payback period became longer when the 100% RES was optimized when considering environmental performance. The emissions could be reduced by 86–99% for CO2 and 64–97% for NOx. The results of this study would provide data support for the investment of 100% RESs in rural or suburban areas of China.

1. Introduction

Society is facing severe problems, such as energy shortage and air pollution, due to the increasing energy demand around the world. A transition to renewable energy is essential for decreasing the dependence on fuel energy and pollution emissions [1]. Many countries have set goals to increase the proportion of renewable energy and decrease fuel energy consumption. German [2] and Danish [3] governments aim to achieve 100% renewable energy before 2050. Twenty-nine states in the United States plan to realize 100% renewable energy in 2045 [4]. China has promised to realize carbon neutrality by 2060 [5]. The use of 100% renewable energy systems (RESs) can significantly increase renewable energy penetration (as shown in Figure 1) and realize carbon neutrality. The energy production and storage devices can make use of different kinds of renewable energy sources to meet the user’s cooling, heating and electricity demands without consuming fossil fuel.

1.1. Existing Studies on 100% RESs

The use of 100% RESs has gradually attracted attention around the world [6]. Researchers carried out studies to assess the feasibility of 100% RESs at different levels. Existing studies mostly focused on the feasibility of 100% renewable energy supply at the national level. Jagemann et al. [7] evaluated the impact of the 100% RES policy on the power industry in Europe to assess the feasibility of realizing a 100% RES by 2050. Considering the energy market and the potential of renewable resources, Hansen et al. [2] studied a transition strategy for Germany to achieve 100% renewable energy by 2050. Child et al. [8] established a model based on the energy scenario of Finland in the future to assess the feasibility of realizing 100% RES by 2050. Jacobson et al. [9] analyzed a way to achieve 100% renewable energy supply in the United States by 2050 by considering the renewable energy distribution in 50 states. Strategies were designed for achieving 100% renewable energy in Ethiopia [10], Ghana [11], Bolivia [12], Philippines, Jordan [13] and Iran [14]. The findings demonstrated that it is possible to realize a 100% RES in many countries through reasonable planning and design. However, incentive policies from the government are required.
The use of a 100% RES can be realized at the regional level. Several studies focused on the feasibility of a 100% RES serving a certain city or town with abundant renewable energy. He et al. [15] analyzed the future energy consumption of the transport, building, industry and space heating sectors in Beijing. The result showed that it is possible for Beijing to reach zero CO2 emissions by 2050. Denmark is very active at promoting the utilization of RES. Thellufsen et al. [16] proposed a method to design a smart energy city for Aalborg. The case study showed that a transition to smart cities with 100% renewable energy is possible in Denmark and Europe. Jacobson et al. [17] developed a roadmap to achieve 100% renewable energy for 53 cities and towns in Canada, Mexico and the United States. The results showed that fuel costs in the power sector can be reduced by 133 USD/person/year and costs due to air pollution can also be reduced.
The use of 100% RESs has great potential in remote villages, communities or isolated islands that cannot be connected to the grid easily. Ferreira et al. [18] designed a 100% RES for Santiago Island. The analysis of different scenarios showed that it is possible to generate electricity from renewable energy alone. Several factors, such as climate conditions, may affect the performance of a 100% RES. Meschede et al. [19] analyzed the impact of probabilistic weather data on the design of an island 100% RES. A new way to determine the expected characteristics and performance of a 100% RES was applied. The developed 100% RES can reduce carbon emissions significantly. A hybrid photovoltaic/wind/micro-hydro with pumped hydro storage was investigated by Islam et al. [20] for an off-grid coastal community. The system could fully satisfy the power demand using renewable energy and reduce 910,459 kg of CO2 emissions annually. By considering technical, ecological, economic and social criteria, Sokolnikova et al. [21] designed a net-zero energy system for rural energy communities in Siberia. The designed 100% RES can achieve an annual CO2 emissions reduction of 3000 t with a lower investment cost.
China aims to reduce CO2 emissions and realize carbon neutrality by 2060 [5]. The use of 100% RESs is an important way to meet users’ energy demands locally. The feasibility and potential of RES in China are discussed and analyzed in [22]. Lugovoy et al. [23] explored the zero-emission possibility of the electricity sector in China by 2050. Three potential pathways that were designed for the electricity, transport, heating and industrial sectors to achieve 100% renewable energy supply by 2050 are discussed in [24]. The optimal design is essential for developing and promoting 100% RESs in China. Huber et al. [25] investigated the optimal design for China’s future power system. The result shows that China could be entirely powered by renewable energy sources, such as wind and solar energy. Economic performance is important to the use of 100% RESs. Dmitrii et al. [26] defined a cost-optimal 100% RES for Northeast Asia, including China. Compared with the conventional energy system, which depends on nuclear energy or fossil fuels, a 100% RES is feasible and has a lower cost. Aiming to achieve 100% RES for the grid, the cost-optimal design of a simplified renewable electricity network was proposed based on 8 years of high-resolution hourly time series data of electricity demand and wind and solar power generation of each province in China [27]. The results showed that the system is feasible for interconnecting distant regions. The studies on 100% RESs in China were mostly focused at the country or provincial levels. Detailed technical analysis about 100% RESs at the community level is still not sufficient. The authors himself have studied the performance of 100% RESs for low-density residential communities in different areas of China [28]. However, only the economic performance was addressed. The environmental performance of the 100% RES has not been addressed yet.

1.2. Gaps and Objectives

According to the above review, many studies have been done on 100% RESs. However, the existing studies still have some gaps:
  • Current studies about 100% RESs mainly focus on the planning and policy analysis at the macro level, such as counties or cities. Technical research at the community or neighborhood level is not yet sufficient. Studies on the technology integration, operation characteristics and performance analysis are required.
  • The performance and integration of a 100% renewable energy system are influenced by factors such as climate, load density, local energy markets and renewable energy resources. The system performance under different conditions needs detailed investigation.
  • Economic and environmental performance is important for promoting 100% RES. Existing studies mainly take economic or energy performance as the optimization targets. However, the environmental performances of 100% RESs are rarely concerned.
Considering the gaps mentioned above, this study aimed to investigate the economic and environmental performances and operation characteristics of 100% RESs at the community level in different areas of China. Thirty different typical regions were selected based on the renewable energy distribution and climate conditions. The 100% RESs were obtained by taking the CO2 emissions and the minimum total annual costs as the optimization objectives. The environmental and economic performances of the 100% RESs were investigated and compared. The results of this study could help the Chinese government to develop 100% RESs.
This paper is organized as follows: The simulation and optimization of 100% RESs in typical areas are considered in Section 2. The operation and performances of 100% RESs are investigated and compared in Section 3. Section 4 and Section 5 present the discussions and conclusions.

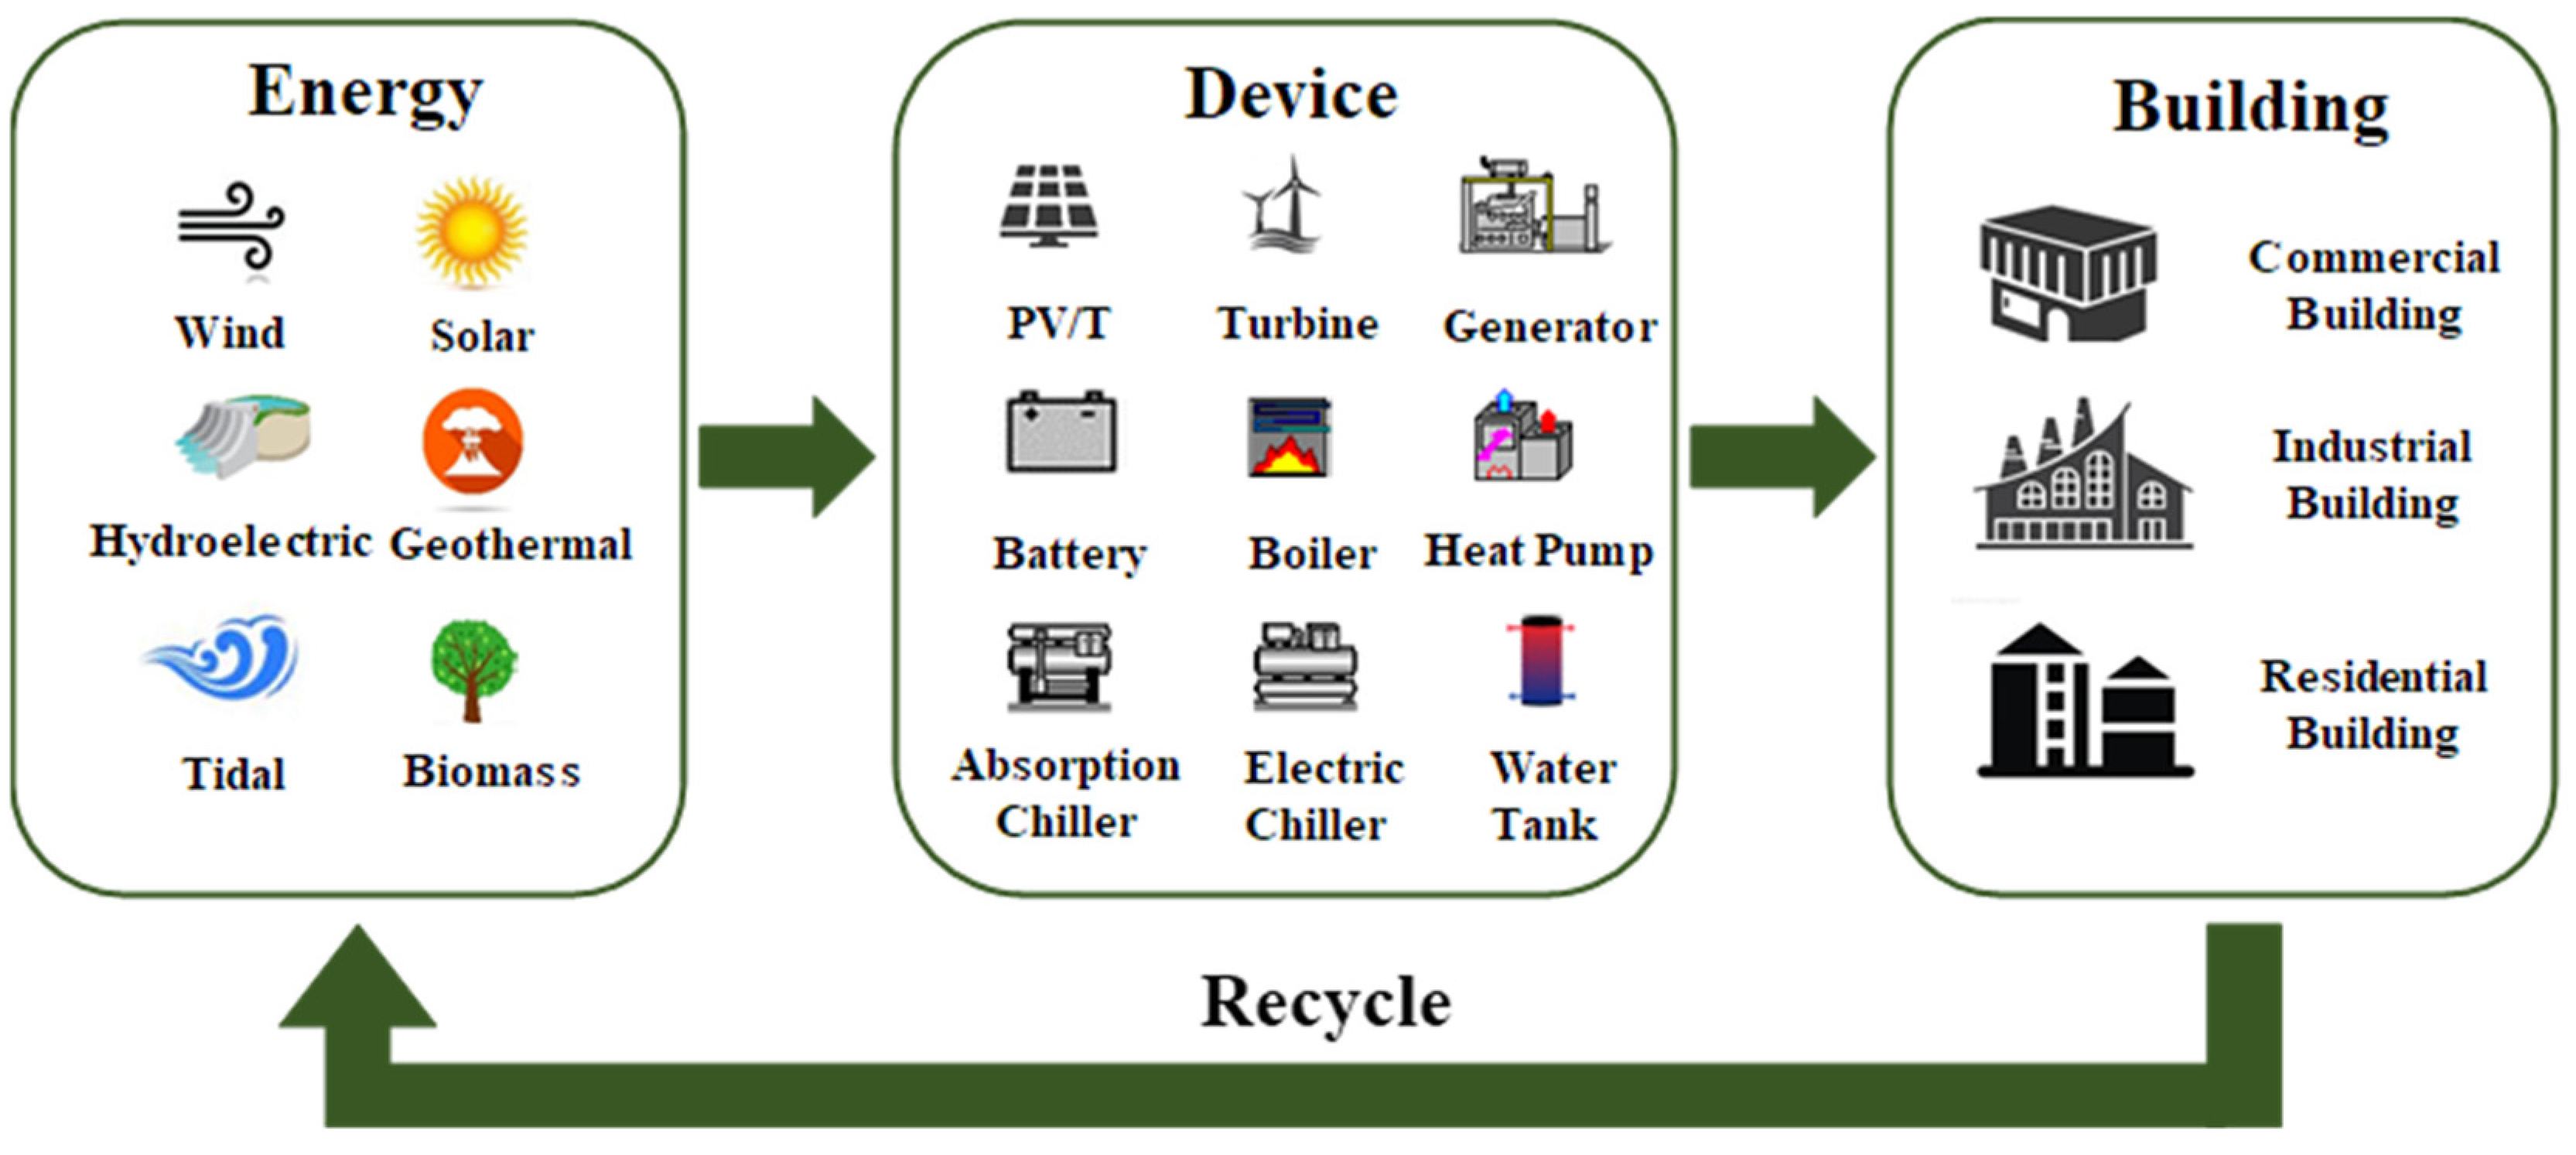
2. 100% RES Design and Modeling

It is necessary to select different typical areas to study the characteristics and performances of 100% RESs in China. This study selected 30 typical cities according to the renewable energy resources distribution and climate zones. Then, the cooling, heating, electricity and hot water loads in each area were calculated. The framework of each 100% RES was determined based on the local climate and renewable energy characteristics. By modeling and optimizing each 100% RES, the optimal design could be obtained. By performing an annual operation simulation, the characteristics and performance of each 100% RES could be investigated and compared.

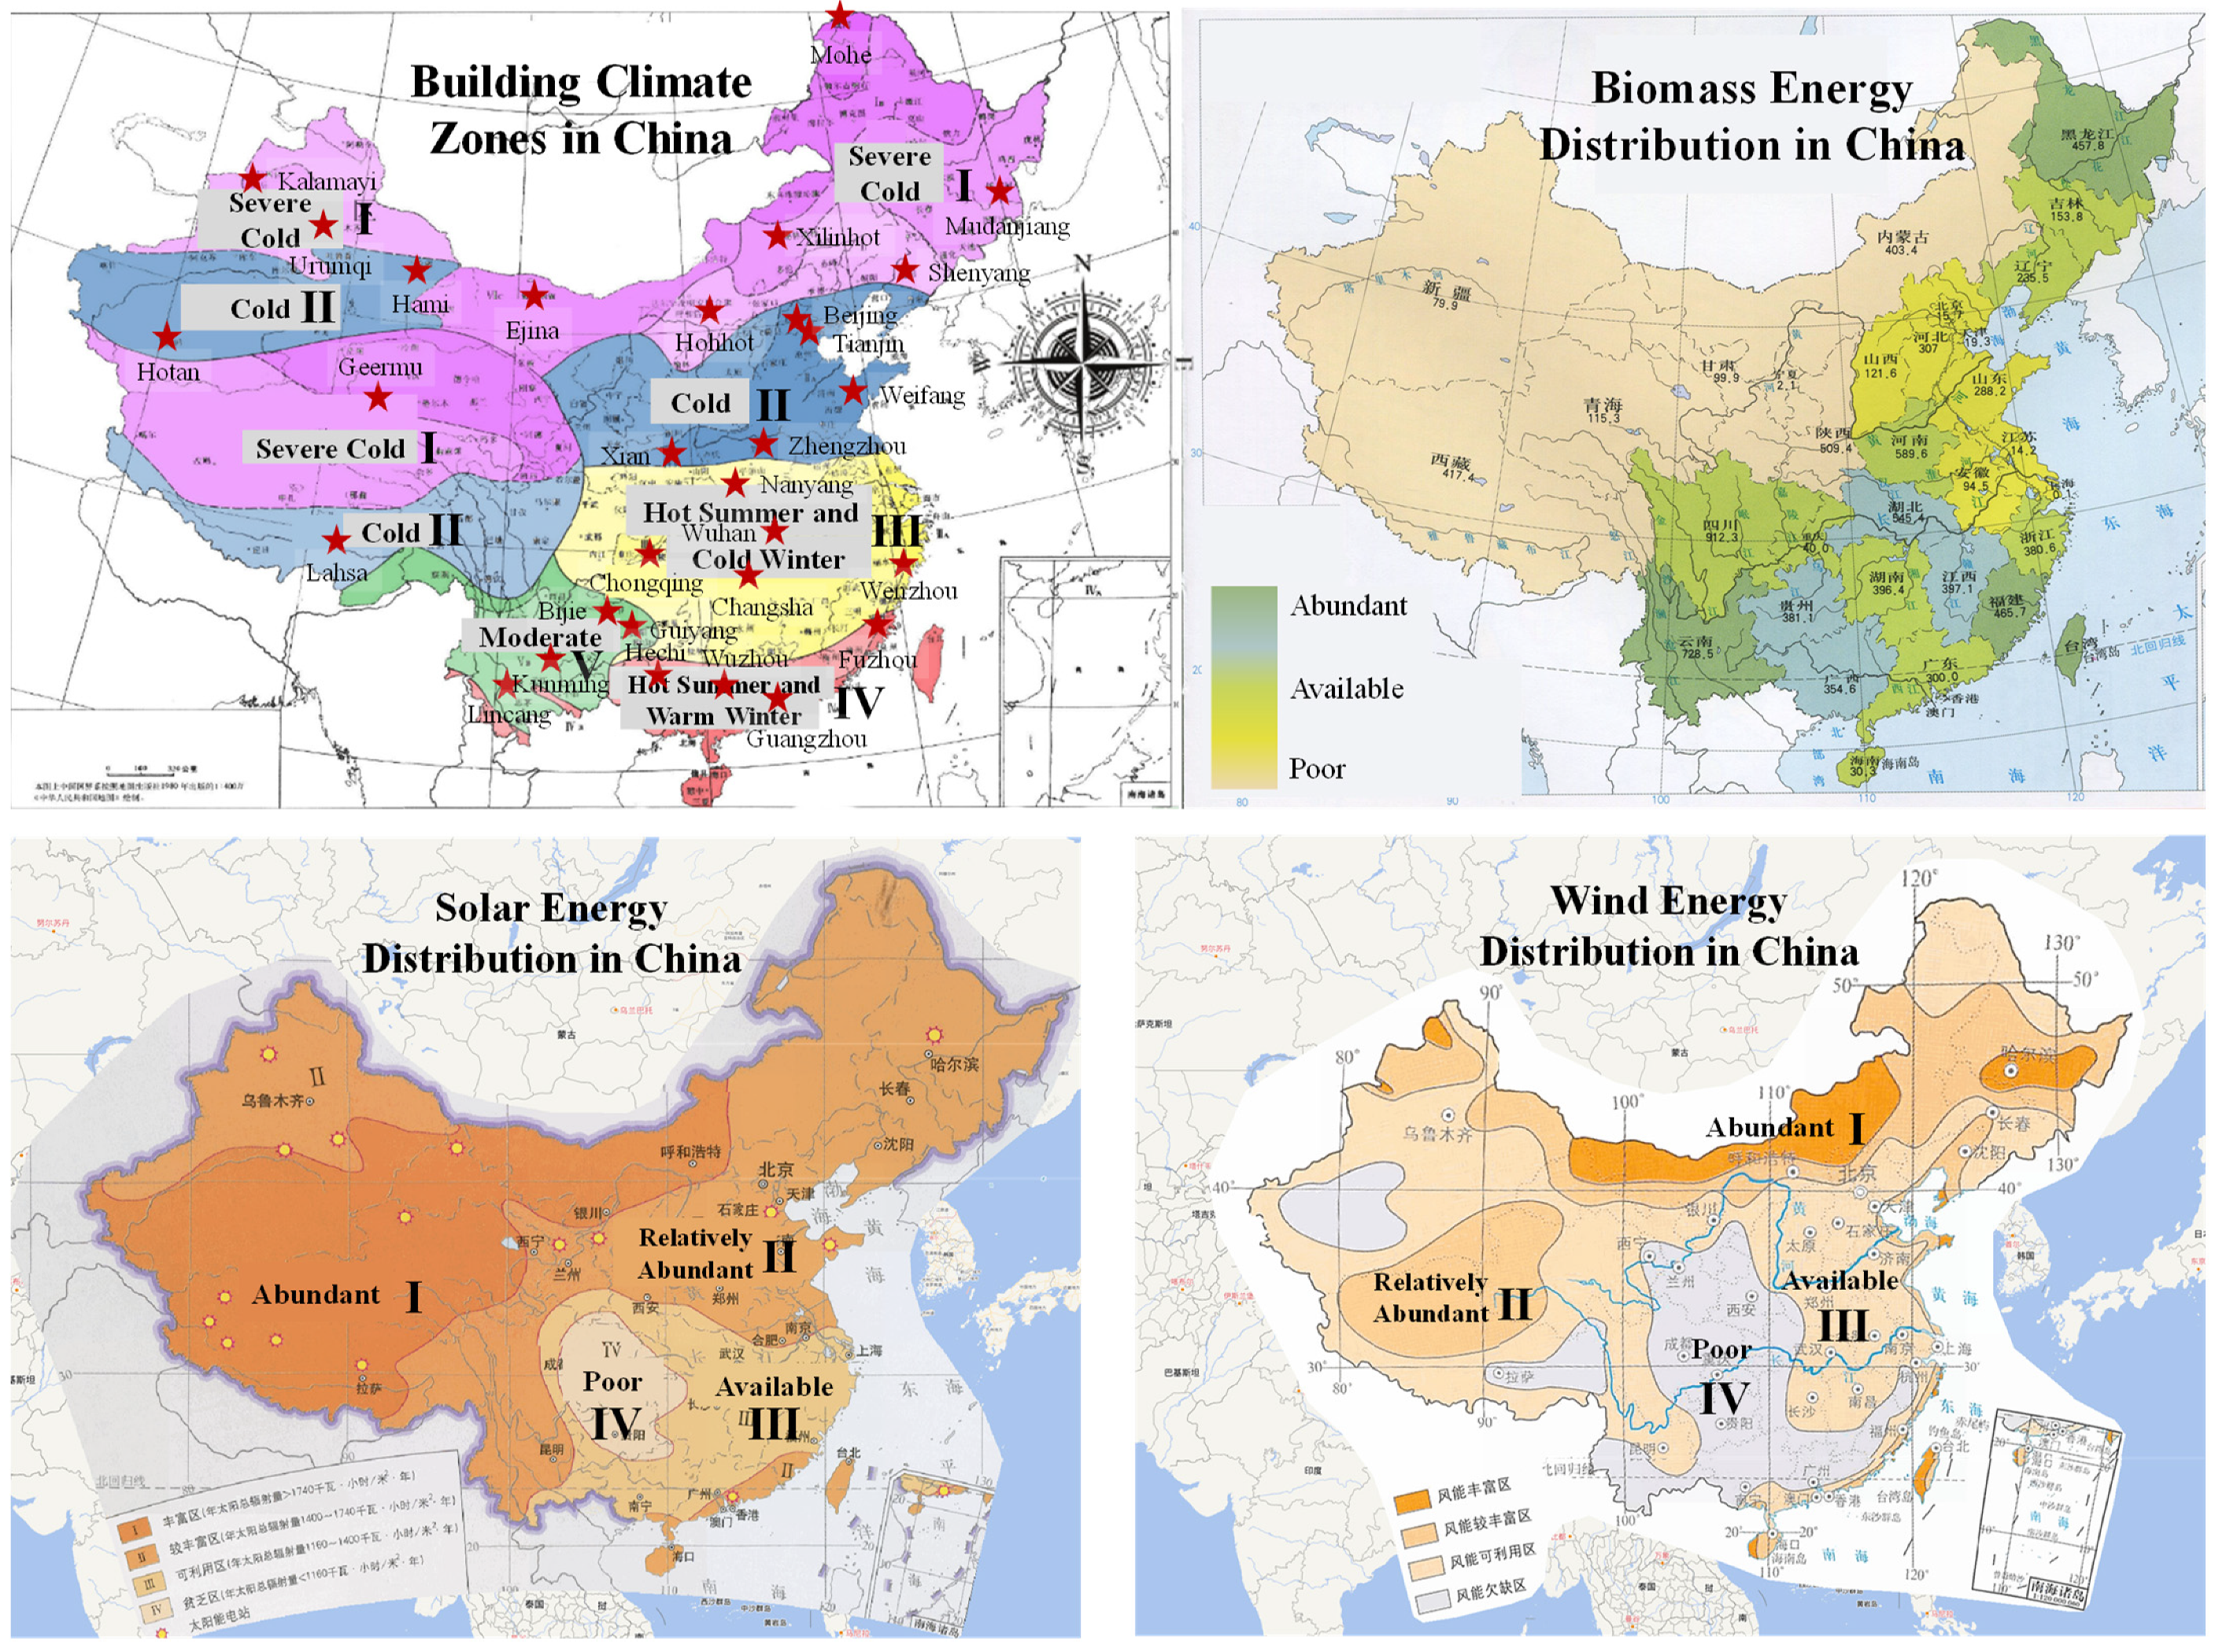
2.1. Selection of Typical Areas

The climates and renewable energy resources affect the optimal design and performance of a 100% RES. China has five climate zones [29], as well as five biomass energy [30], four solar energy [31], and four wind energy [32] resource zones, as shown in Figure 2. No cooling is required in summer in the severe cold zone (I) but the heating load is high and lasts longer in winter. In the cold zone (II) and the hot summer and cold winter zone (III), both heating and cooling are required. No heating is required but cooling loads are high and lasts for a long period in the hot summer and warm winter zone (IV). No cooling or heating is required throughout the year in the moderate zone (V). It is shown in Figure 2 that the areas where wind or solar energy is abundant (I) are mainly located in the northern and western regions of China and the climate is cold. The populous southeast regions have moderate (III) or poor (IV) solar and wind energy with a relatively warm climate. In this study, biomass was considered to be a stable source because its supply can be controlled compared with solar and wind energy. Based on the distribution of the renewable energy and building climate zones, 30 typical cities were selected to establish the 100% RESs, as shown in Table 1. The locations of the cities are marked in Figure 2. The selection of the cities was based on the principle of obtaining as many combinations of the climate, wind and solar zones as possible. To study the economic performance of the 100% RESs, the local tariff and natural gas price in each zone were obtained from the local utility department or natural gas company by the authors.

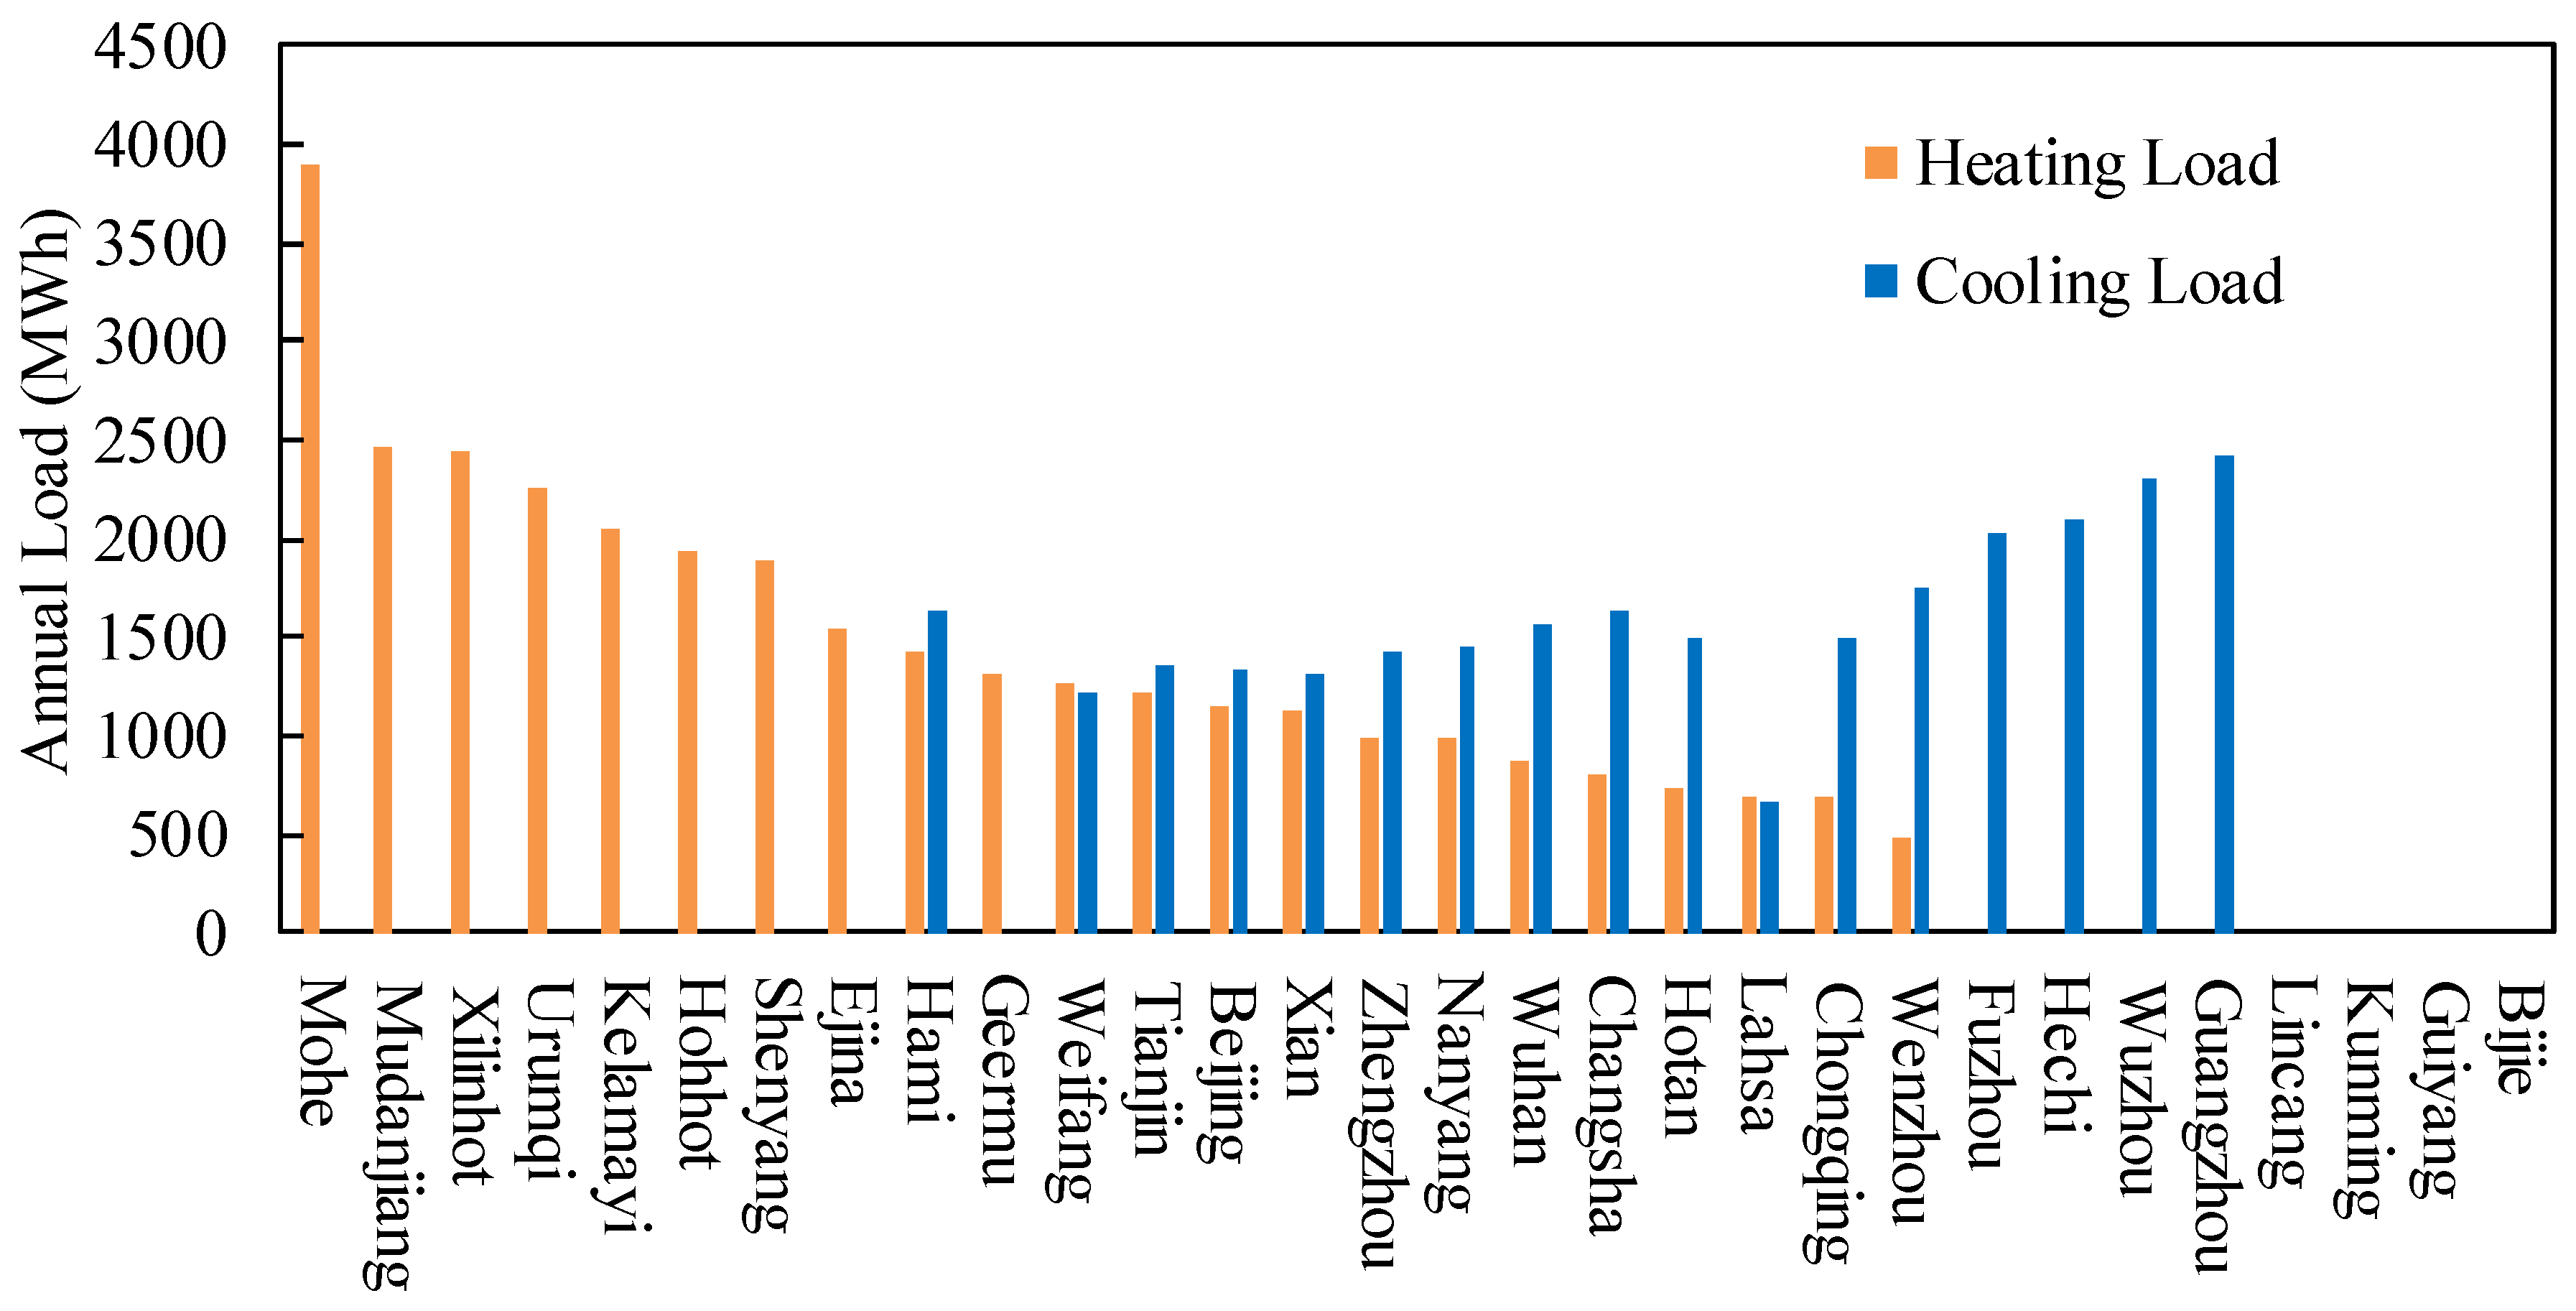
2.2. Load Calculation

A low-density residential community was selected to design a 100% RES based on the living conditions in rural areas, small towns or suburban areas of China. The residential community consisted of 60 residential buildings. The roof area of the community is 3480 m2, which can be used to install photovoltaic thermal (PV/T) systems. Considering the noise and vibration requirement, small wind turbines with a capacity of 300 W were selected. Buildings were modeled in DeST-h [33] so that the cooling and heating loads of the communities in different cities were calculated based on the typical meteorological data. The hot water and electricity loads (without air conditioning) related to the schedule of occupants were estimated based on the Code for Planning of Urban Electric Power [34] and the Code for Thermal Design of Civil Building [35]. The electricity load of the buildings was calculated based on the electricity consumption index per area of residential buildings, which is 30~50 W/m2. The hot water load was calculated based on the daily water consumption per person, which is 130~320 L/(person∙day). A diversity factor of 0.6 was used after considering the behavior randomness of residential occupants [36]. As the peak load of different households occurs at different times, the load of all the households was added and multiplied by the diversity factor to obtain the load of the community.
The annual cumulative cooling and heating load of the residential community in the 30 areas is shown in Figure 3. The heating load of cities situated in the severe cold area, such as Mohe, is high in winter due to the low air temperature, which is close to 4000 MWh. The cooling loads of cities in the hot summer and warm winter areas, such as Guangzhou, Fuzhou and Hechi, are relatively high. The cooling load of Guangzhou is close to 2500 MWh. Cities located in the hot summer and cold winter area and the cold area both have cooling and heating loads. The cooling load is between 1300 and 1800 MWh, while the heating load is between 500 and 1500 MWh. The low-density residential buildings in the moderate area, such as Kunming and Lincang, have no cooling or heating load because the outdoor air temperature is appropriate throughout the year and cooling or heating is not required.

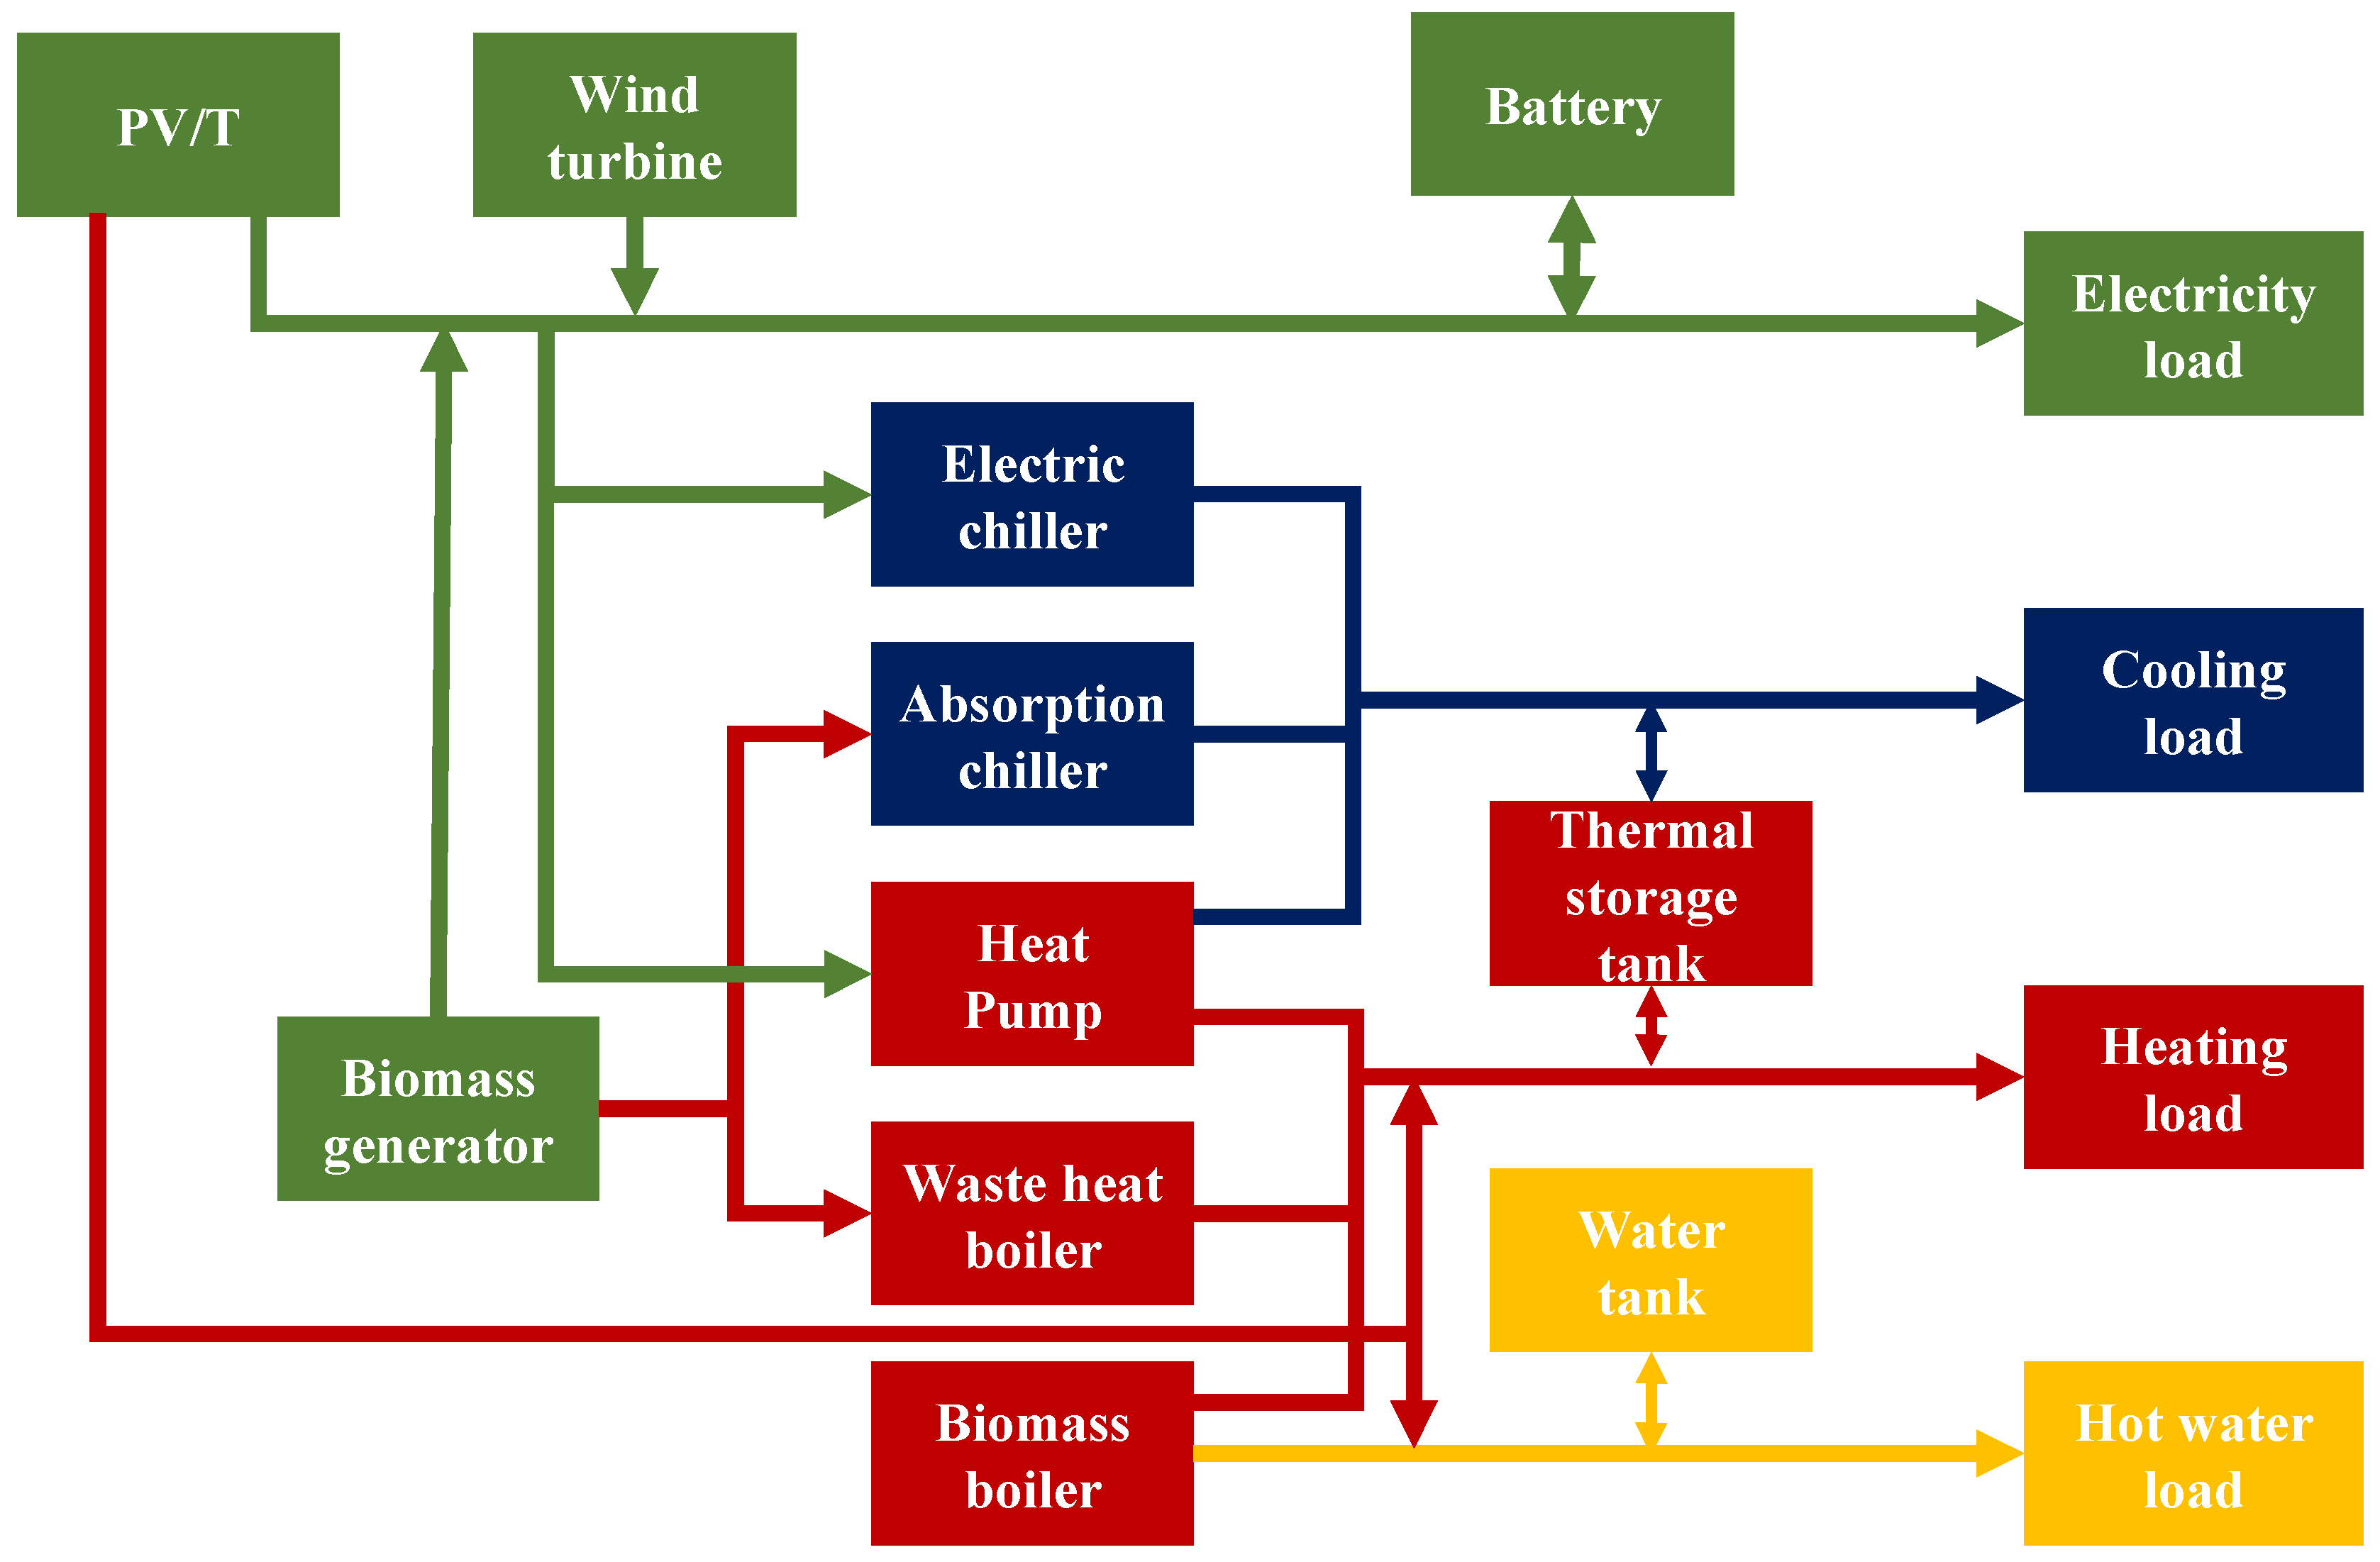
2.3. System Design and Operation Strategy

The isolated 100% RESs designed in this study can meet the demands of cooling, heating, electricity and hot water without depending on the grid. The configuration of the 100% renewable energy system is shown in Figure 4. There are four cycles in the system, including the electricity cycle, cooling cycle, heating cycle and hot water cycle. Optional equipment includes PV/Ts, wind turbines, biomass internal combustion engines, absorption chillers, heat pumps, chillers, boilers, batteries and water tanks, which are common for distributed energy systems [37]. Specific system configurations of different regions will be different due to the different meteorological and load characteristics.
The operation strategy of the 100% RES follows the electricity load (FEL), which is a widely used strategy in distributed energy systems [38,39].
  • For the electricity cycle, solar and wind energy are preferred to meet the electrical loads. Excessive electricity is stored in batteries; when the solar and wind energy is insufficient, the required energy will be provided by biomass generators and batteries.
  • The heating load is first met by the heat from PV/Ts, the waste heat recovered from the biomass generator and the thermal storage tank. Any extra heating load that is not met by these sources is supplied by boilers or heat pumps. The excessive heating energy is stored in the thermal storage tank.
  • The cooling load is first supplied by absorption chillers by recovering energy from the exhaust gas, cylinder water and thermal storage tanks. Any extra cooling load that is not met by these sources is met by heat pumps or electric chillers. The excessive cooling energy is charged in the thermal storage tank.
  • Hot water circulation is given priority regarding the use of waste heat and solar heat. The surplus heat is charged in hot water tanks while any extra hot water heating load that is not met by waste heat and solar heat is provided by the tanks and/or boilers.

2.4. System Modeling

According to the load characteristics, the framework of the 100% RES can be built. The 100% RES involves a series of energy conversion devices, where their mathematical models are introduced as follows.
  • PV/T
A PV/T generates electricity and heat from solar energy. The device model is shown as Equation (1) [40,41], where Ppv is the output power or heat (kW); ηpv,power and ηpv,thermal are the power and thermal conversion efficiencies of the PV/T, respectively; A represents the PV/T area (m2); I represents the solar energy intensity (kW/m2); and T is the outdoor ambient temperature (°C).
P pv = { η pv ,   power AI [ 1     0.005 ( T     25 ) ] η pv ,   thermal AI
2.
Wind turbine
The wind turbine generates power using wind energy and its model is shown as Equation (2) [42], where Prated,wt and Pwt represent the rated and output powers of the wind turbine (kW), respectively; v is the current wind speed (m/s); and vin, vout and vsafe represent the cut-in, cut-out and safe wind speeds (m/s), respectively.
P wt = { 0   v v in ,   v v safe P rated , wt v 3   v in 3 v out 3   v 3   v in v v out P rated , wt   v out v v safe
3.
Biomass generator
A biomass generator burns biogas to provide thermal energy and drives the engine to generate electricity. Thermal heat that is recovered from the exhaust gas or water can supply heating, cooling or hot water. Equation (3) demonstrates the model of the generator [43]. EICE, Qwater and Qwh represent the output electrical power, hot water energy from the generator and waste heat energy (kW), respectively. q represents the heat value of the biogas. According to the actual project, 20.9 MJ/m³ was used in this paper [44]. ηgenerator is the electrical efficiency of the generators. ηwh and ηwater represent the ratio of recovered heat and hot water energy to the biogas’ total heat value, respectively.
{ E ICE = qM η generator Q wh = qM η wh Q water = qM η water
4.
Heat pump and electric chiller
Heat pumps are used to generate cooling or heating energy for cities located in the hot summer and cold winter areas and the cold areas. The electric chiller supplements the absorption chillers in the hot summer and warm winter areas in summer. Equation (4) shows the models of electric chillers and heat pumps [45]. Pconsume,hpc is the electricity consumption of heat pumps or chillers (kW), while Prated,hpc is the rated power consumption of heat pumps or chillers (kW) at full capacity. EIRFPLR represents the ratio of the power consumption at partial loads to that at full loads, while plr represents the part load ratio.
{ P consume ,   hpc = P rated ,   hpc   ×   EIRFPLR EIRFPLR = a 2   ×   plr 2 + b 2   ×   plr + c 2
5.
Absorption chiller
An absorption chiller can recover waste heat from the biomass generator to supply cooling, as shown in Equation (5) [46], where Qab represents the cooling energy output of the absorption chiller (kW), Qwh represents the waste heat generated by the generator (kW) and COPab represents the coefficient of the absorption chiller.
Q ab = Q wh COP ab
6.
Boiler
The boiler uses biogas to supply heating for users, as shown in Equation (6) [47]. Pboiler represents the output heat of the boiler (kW). Qgas is the heat released by biogas combustion (kW). ηboiler is the efficiency of the boiler.
P boiler = Q gas   ×   η boiler
7.
Energy storage devices
Energy storage devices can effectively improve the stability and efficiency of a 100% RES. The energy storage system in this study was composed of thermal storage tanks, hot water tanks and batteries. Equations (7) and (8) show the model of energy storage equipment [48]. Qstore is the stored energy in the energy storage devices (kWh), Qstore,max is the capacity of the storage devices (kWh). SOCt+1 and SOCt are the states of charge at time t+1 and t, respectively. Qstore,t represents the energy charged (+) in or discharged (−) from the energy storage devices at time t (kWh).
SOC = Q store / Q store ,   max
SOC t + 1 = SOC t + Q store ,   t / Q store ,   max

2.5. Optimization Objective of the 100% RESs

The optimal design of the 100% RES in each area was obtained to achieve its optimal economic and environmental performance. The capacities of the PV/Ts, wind turbines, batteries, generators, boilers, electric chillers, heat pumps, absorption chillers, energy storage tanks and hot water tanks were optimized to obtain the configuration of each 100% RES. The economic performance is crucial to the feasibility of the system. In this study, the total annual cost (Ctotal) was selected as the optimization objective, as shown in Equations (9)–(12). It includes: (1) Capital cost C capital , which is the sum of the purchase and installation cost of all devices in the system. (2) Operation cost Coperation, I, which is the cost of biogas consumed by the system throughout the year. (3) Maintenance cost Cmaintenance,i, which is the cost required for maintaining the system, where Cinvest,i represents the investment of the ith device (CNY/kW), Ni represents the nominal capacity of the ith device (kW), y represents the life period (which was 20 years in this study), pgas is the biogas price (Nm3/CNY), Qgas is the annual biogas consumption (Nm³), λ represents the coefficient for maintenance costs (1% in this study). Table 2 shows the parameters that were adopted in the optimization calculation. The cost parameters were used to calculate the investment of the devices and the coefficient parameters were used in the system modeling to determine the system design and the operation conditions of the devices. With the GA optimization, the system configuration with the lowest total annual cost could be found.
C capital = i n N i C invest , i y
C operation = p gas Q gas
C maintenance = λ i n N i C invest , i
C total = C capital + C operation + C maintenance
A 100% RES has the advantages of low carbon emissions and high environmental protection. The annual CO2 emission reduction compared with traditional systems was taken as an environmental optimization objective, as shown in Equation (13). It is the difference between the CO2 emissions of the traditional system and the CO2 emissions of the 100% RES. The CO2 emissions of the traditional system result from coal-fired power generation and natural gas for heating. The CO2 emissions of the 100% RES are from biogas combustion. MCO2, saving is the annual CO2 emission reduction (g); Pe,tradition is the power consumption of the traditional system (kWh); Vnatural gas and Vbiogas are the natural gas and biogas consumption of the traditional system and the 100% RES (Nm3), respectively; qnatural gas and qbiogas are the heat value of natural gas and biogas, which are 9.9 kWh/Nm3 and 6.5 kWh/Nm3, respectively, in this study; mcoal is the CO2 emission index of coal-fired power generation (g/kWh); and mnatural gas and mbiogas are the CO2 emission index of natural gas and biogas (g/Nm3), respectively. The system configuration with the highest annual CO2 emission reduction can be obtained according to the environmental optimization.
M CO 2 , saving = ( P e ,   tradition m coal + V natural   gas q natural   gas m natural   gas ) V biogas q biogas m biogas

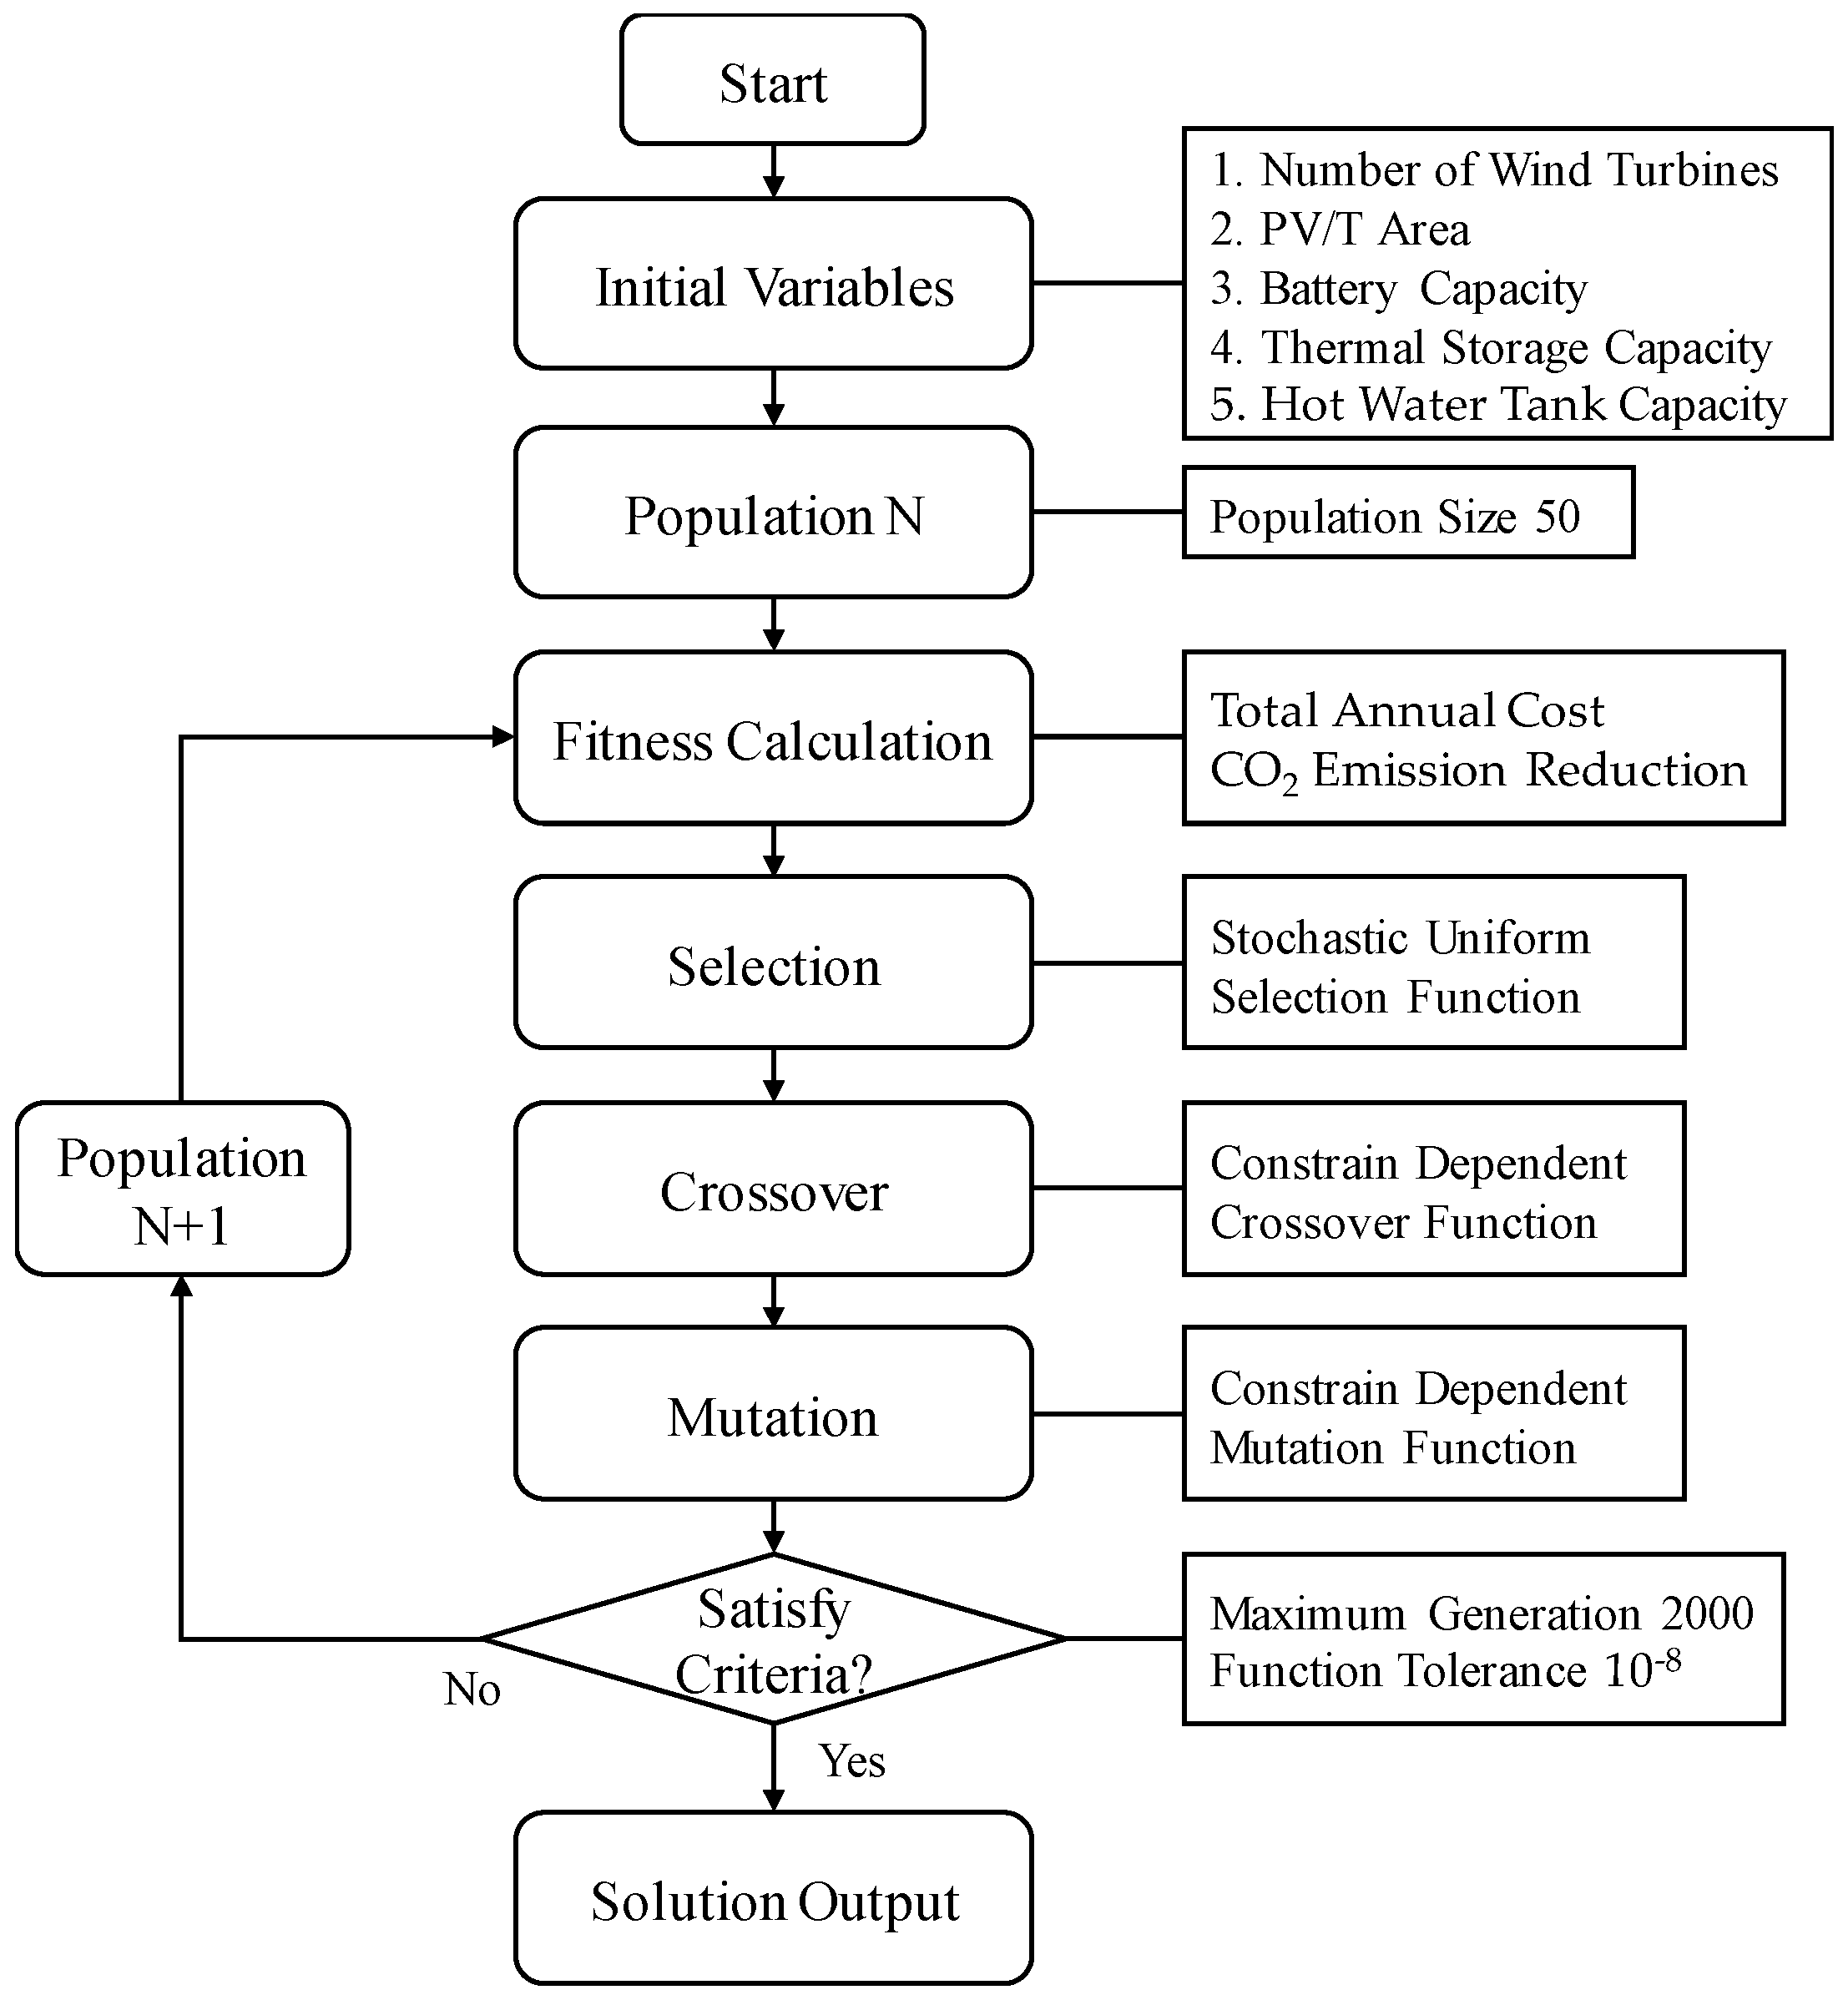
2.6. Optimization Algorithm

The optimization calculation in this study is a typical optimization problem with a single objective and multiple variables. This study took the genetic algorithm (GA) as the optimization algorithm. It was proposed by Holland [49] based on the theory of biological evolution from Darwin. It is widely used in solving system optimization problems because it can achieve the global optimal rather than easily fall into the local minima trap. Compared with the traditional optimization method, this algorithm has the advantages of high robustness, good convergence and low computing time [50,51]. The process of the GA is shown in Figure 5. The genetic algorithm optimization process starts with a randomly generated initial population of the individual. Each individual of the population is evaluated to find the corresponding fitness value. A new population of individuals is created using three genetic operators: reproduction, crossover and mutation. Only solutions with a higher level of fitness are maintained in the population. The stochastic uniform function is adopted to realize the selection. A crossover operator is used to create two new individuals from two existing individuals. Stochastic mutations are applied to some generated solutions to introduce new features in the population. If the convergence criteria are satisfied, the searching process will stop and the optimal solution can be obtained.
In this study, the calculation process was realized in MATLAB software. The population size was set to 50 and the constraint-dependent mutation function and crossover function were used. The maximum number of generations was 2000 and the function tolerance was set to 10−8 as the stopping criteria. A computer with a 3.60 GHz i7-7700 CPU and 16 GB RAM was used for the optimization. The time required for the simulation calculations varied for each calculation, but mostly within 10 min. The optimization program was run several times and the average of the results is selected.

3. Results and Analysis

The design and system performance of the optimal 100% RES that is obtained by taking different objectives varies. In this section, the 100% RESs in different areas and their operation characteristics were analyzed and compared. In short, the method with the total annual cost as the objective was called economic optimization and that with the CO2 emission reduction as the objective was called environmental optimization.

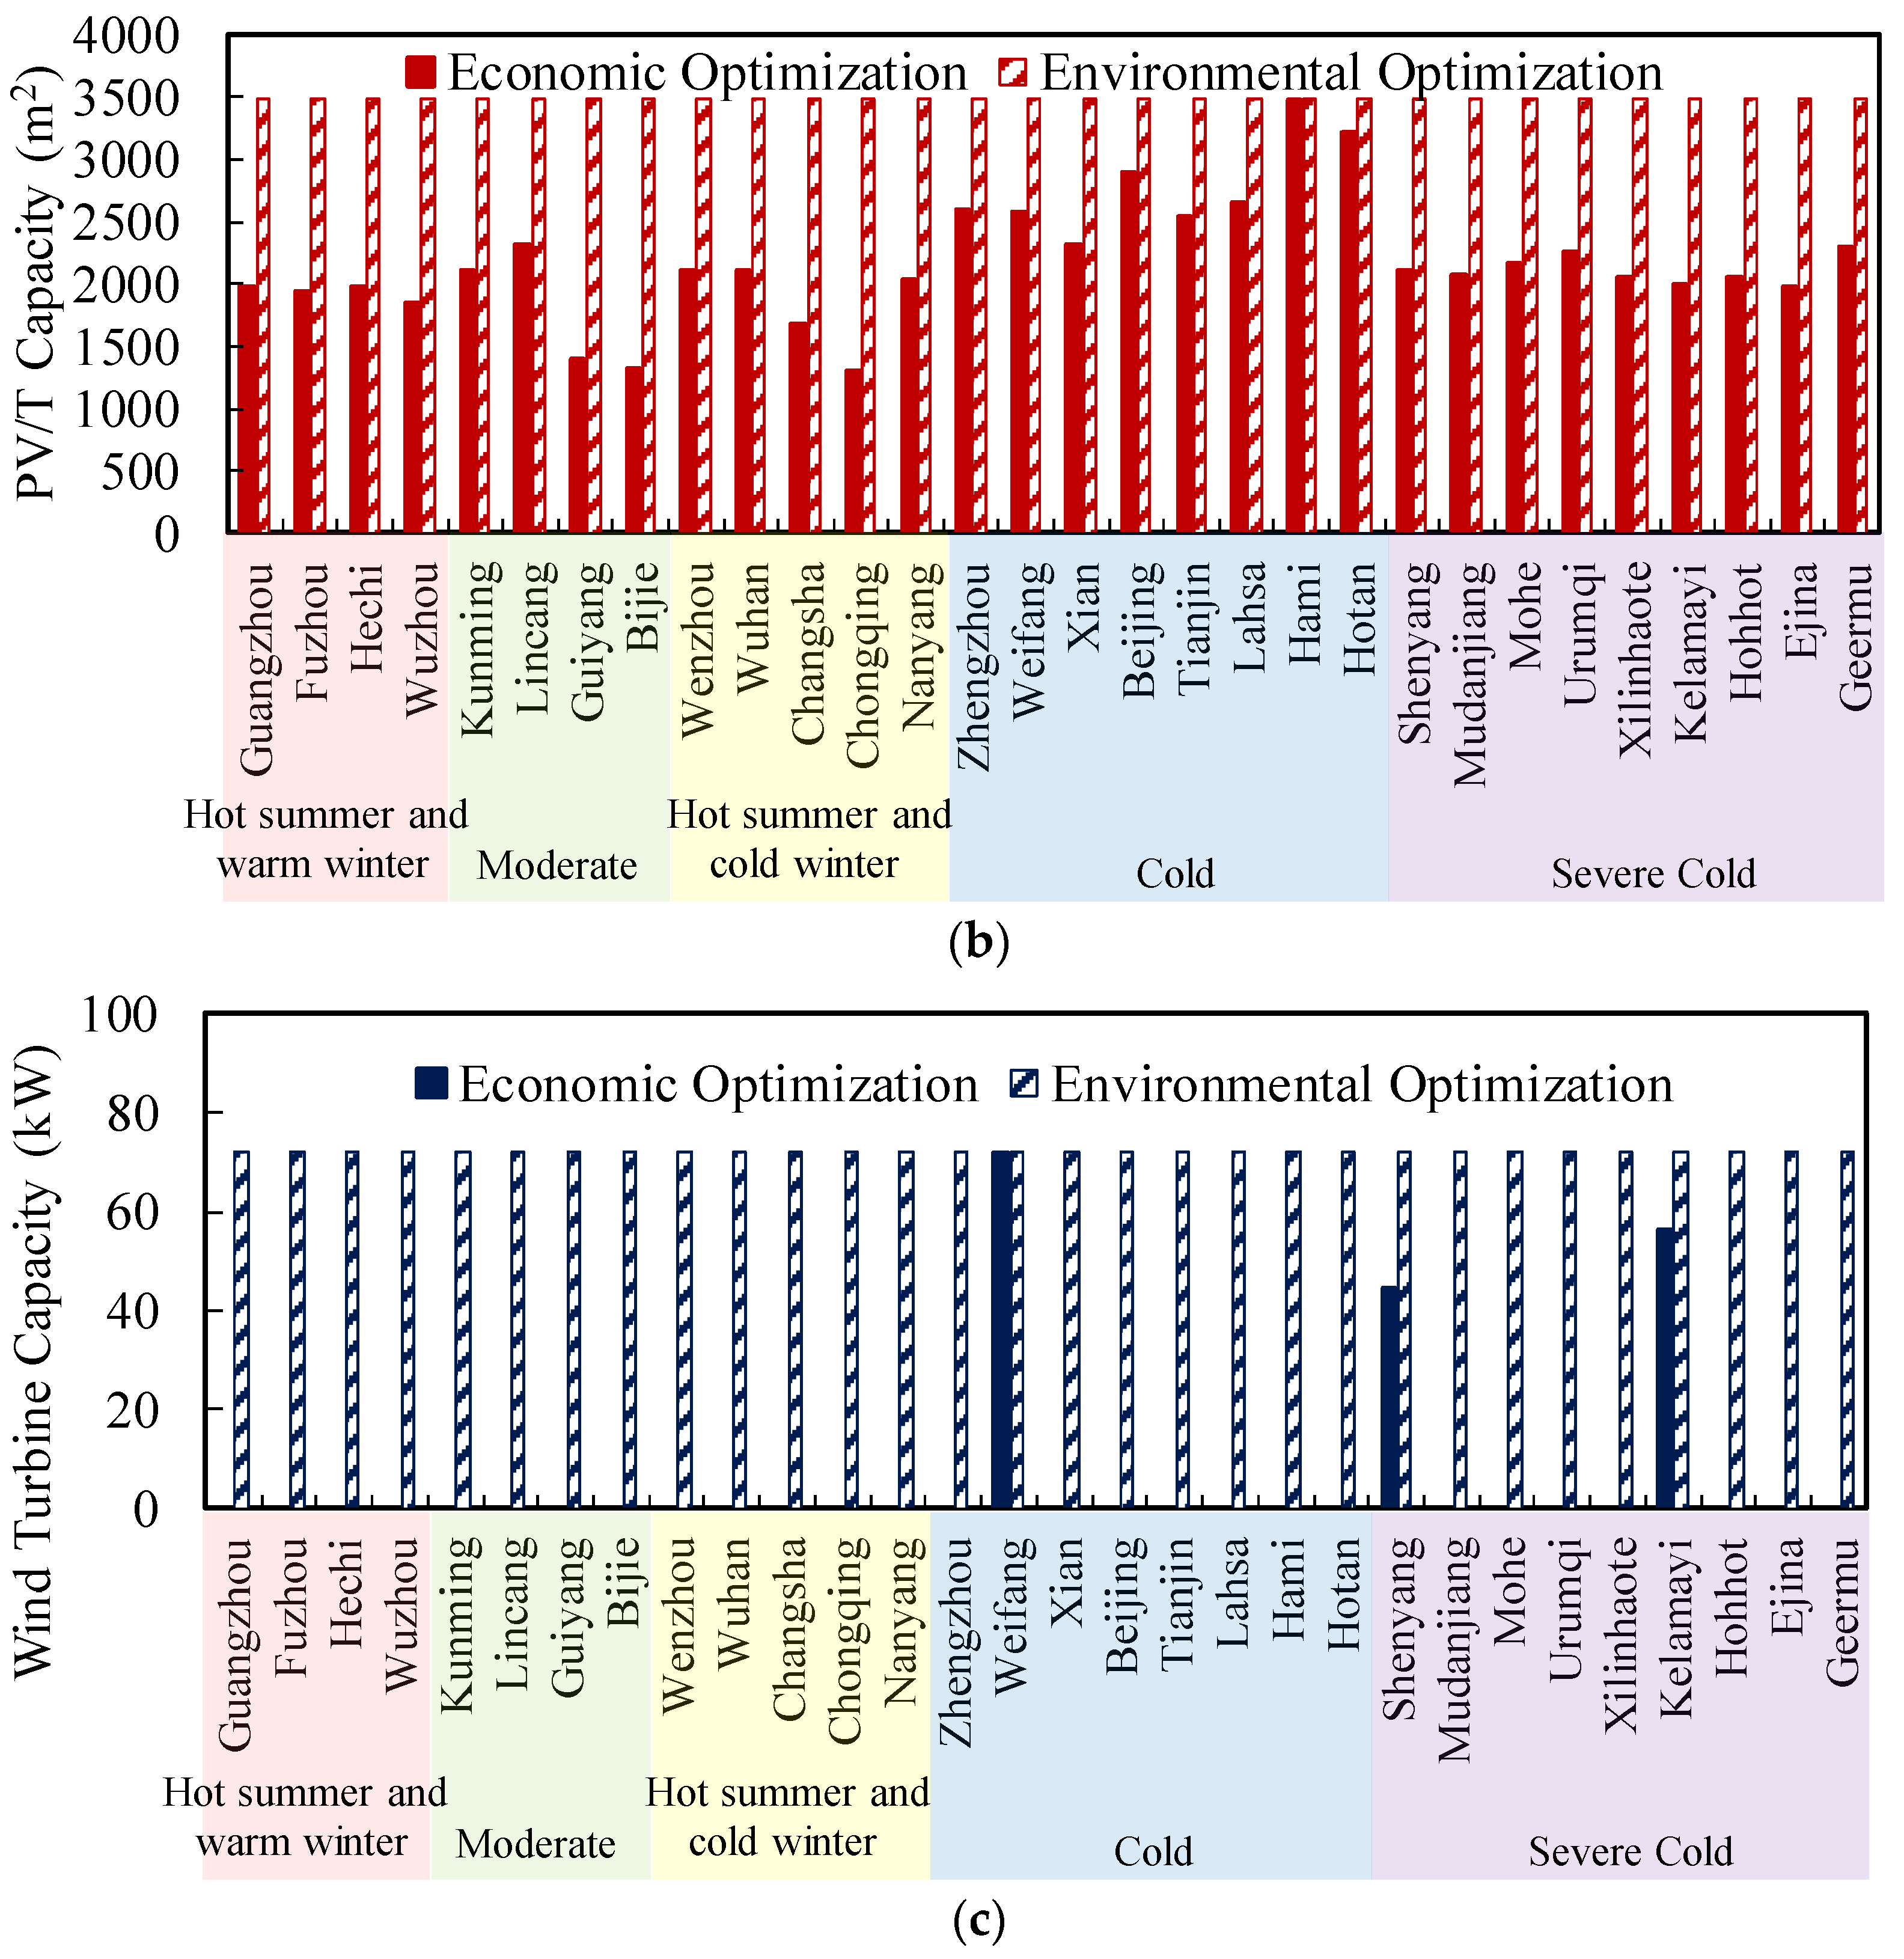
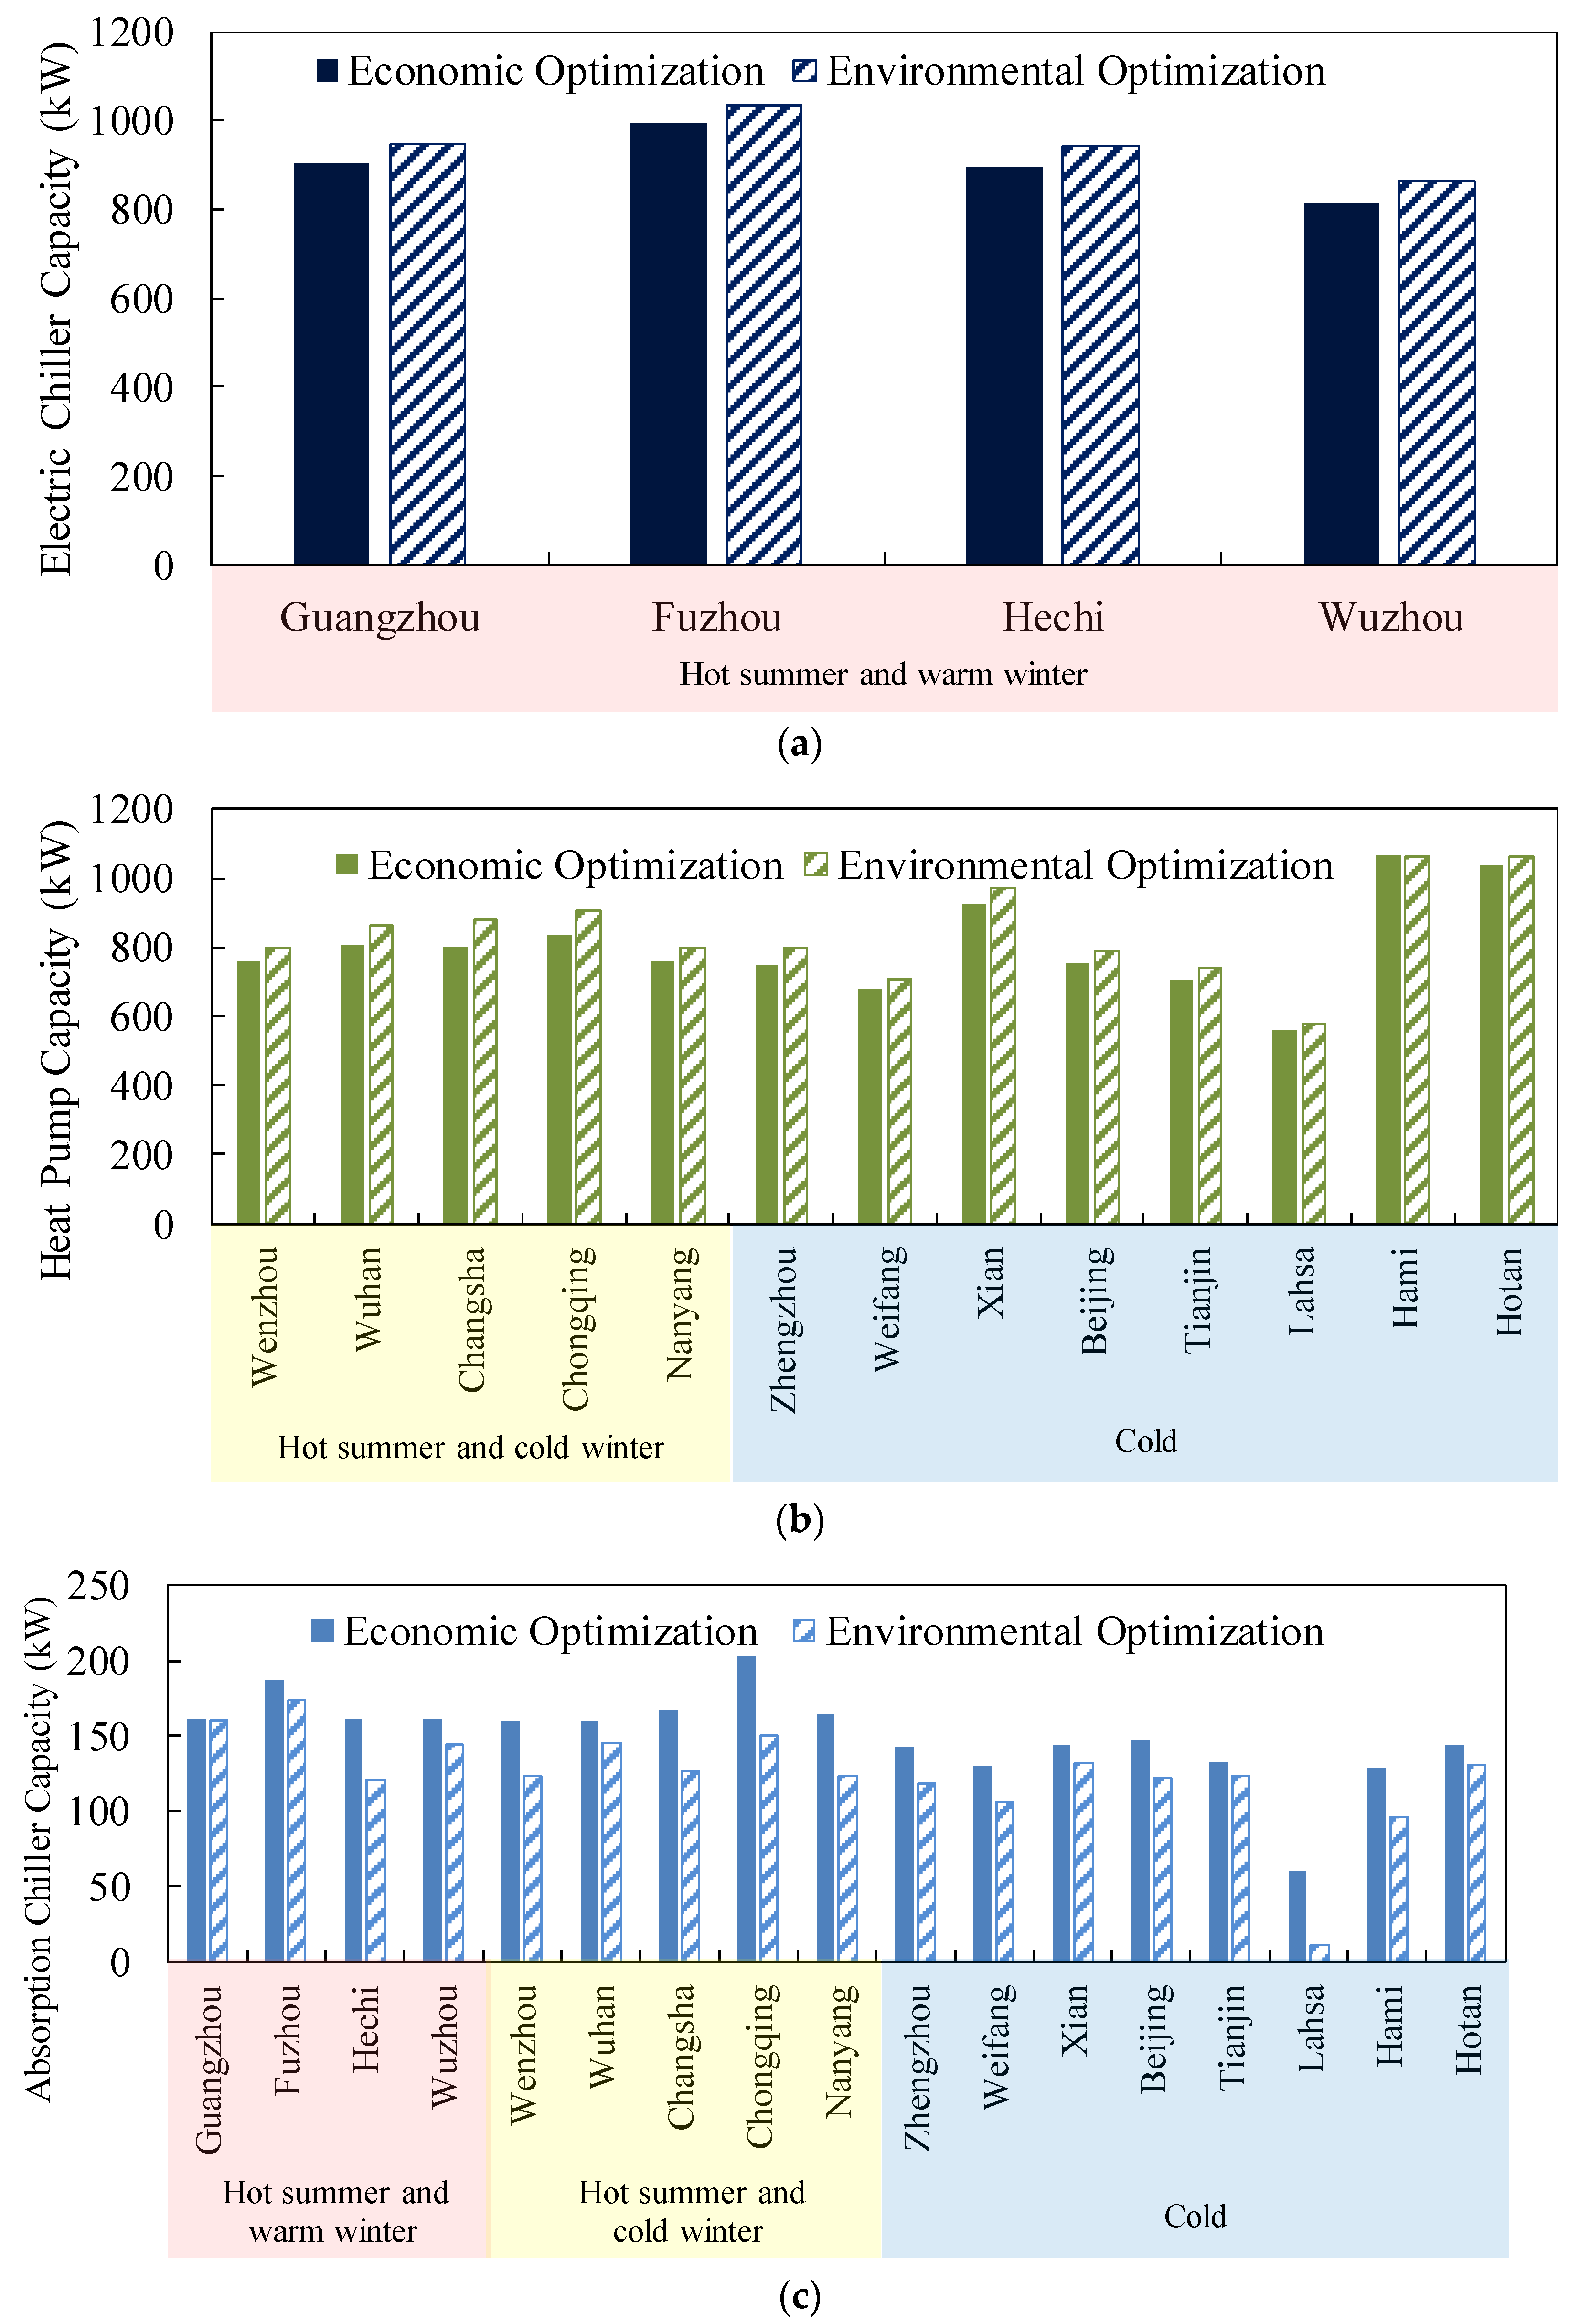
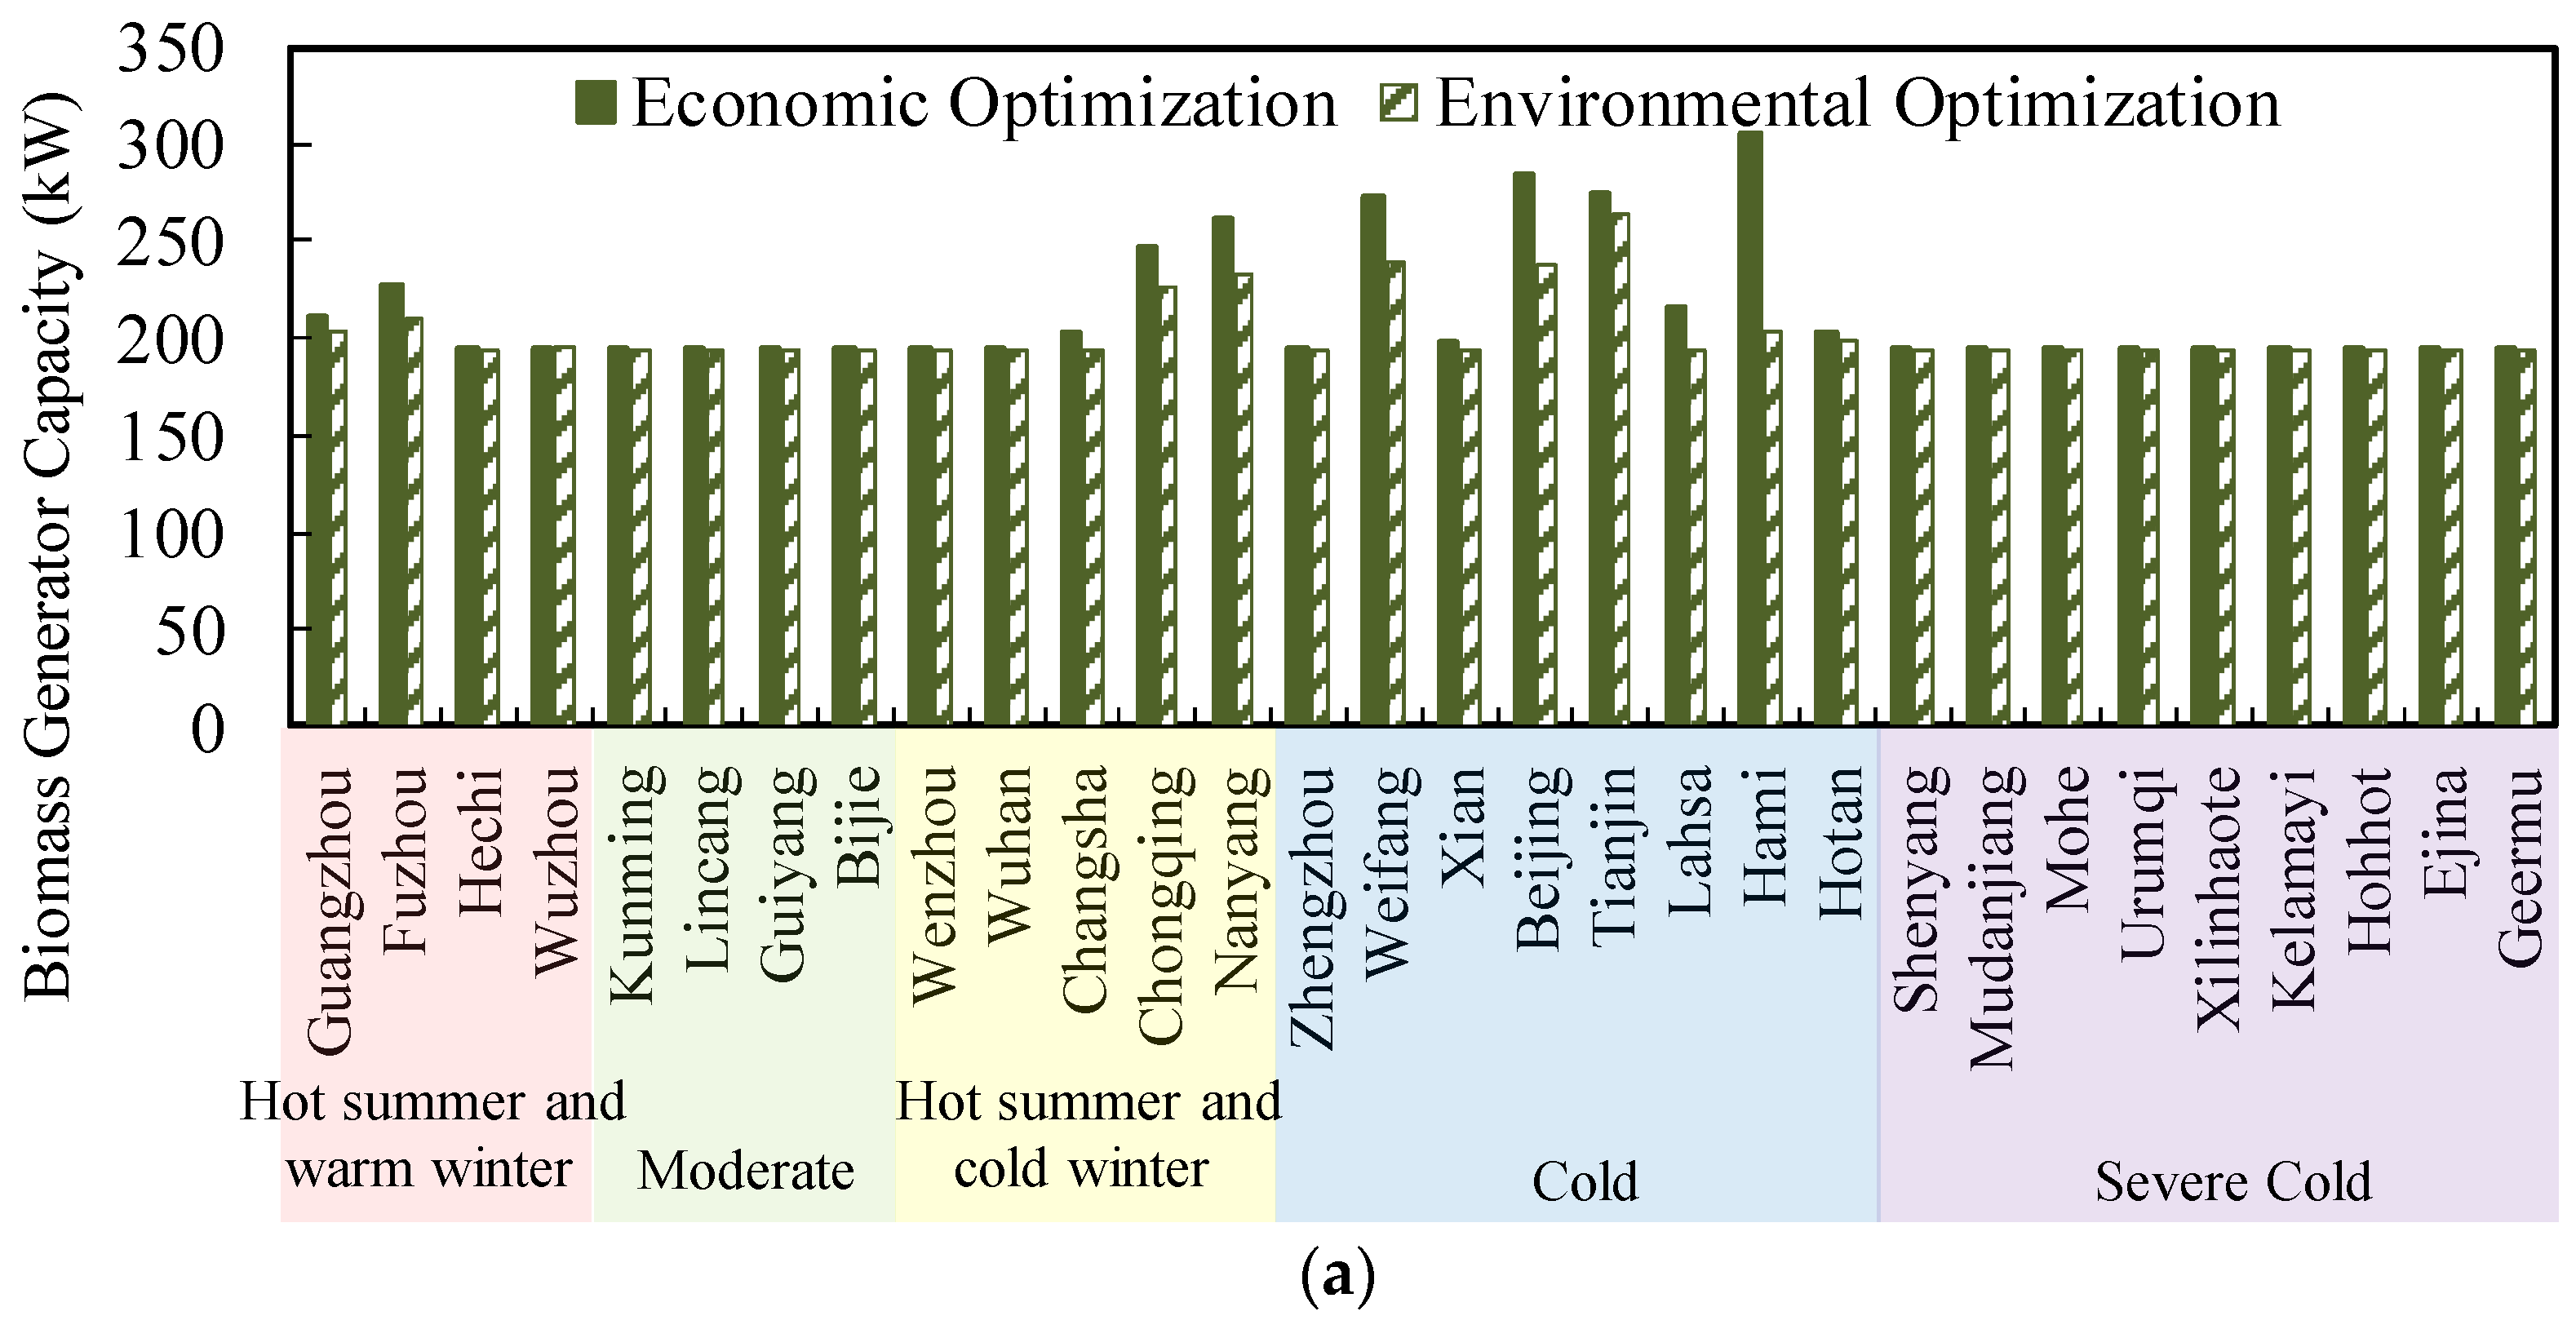
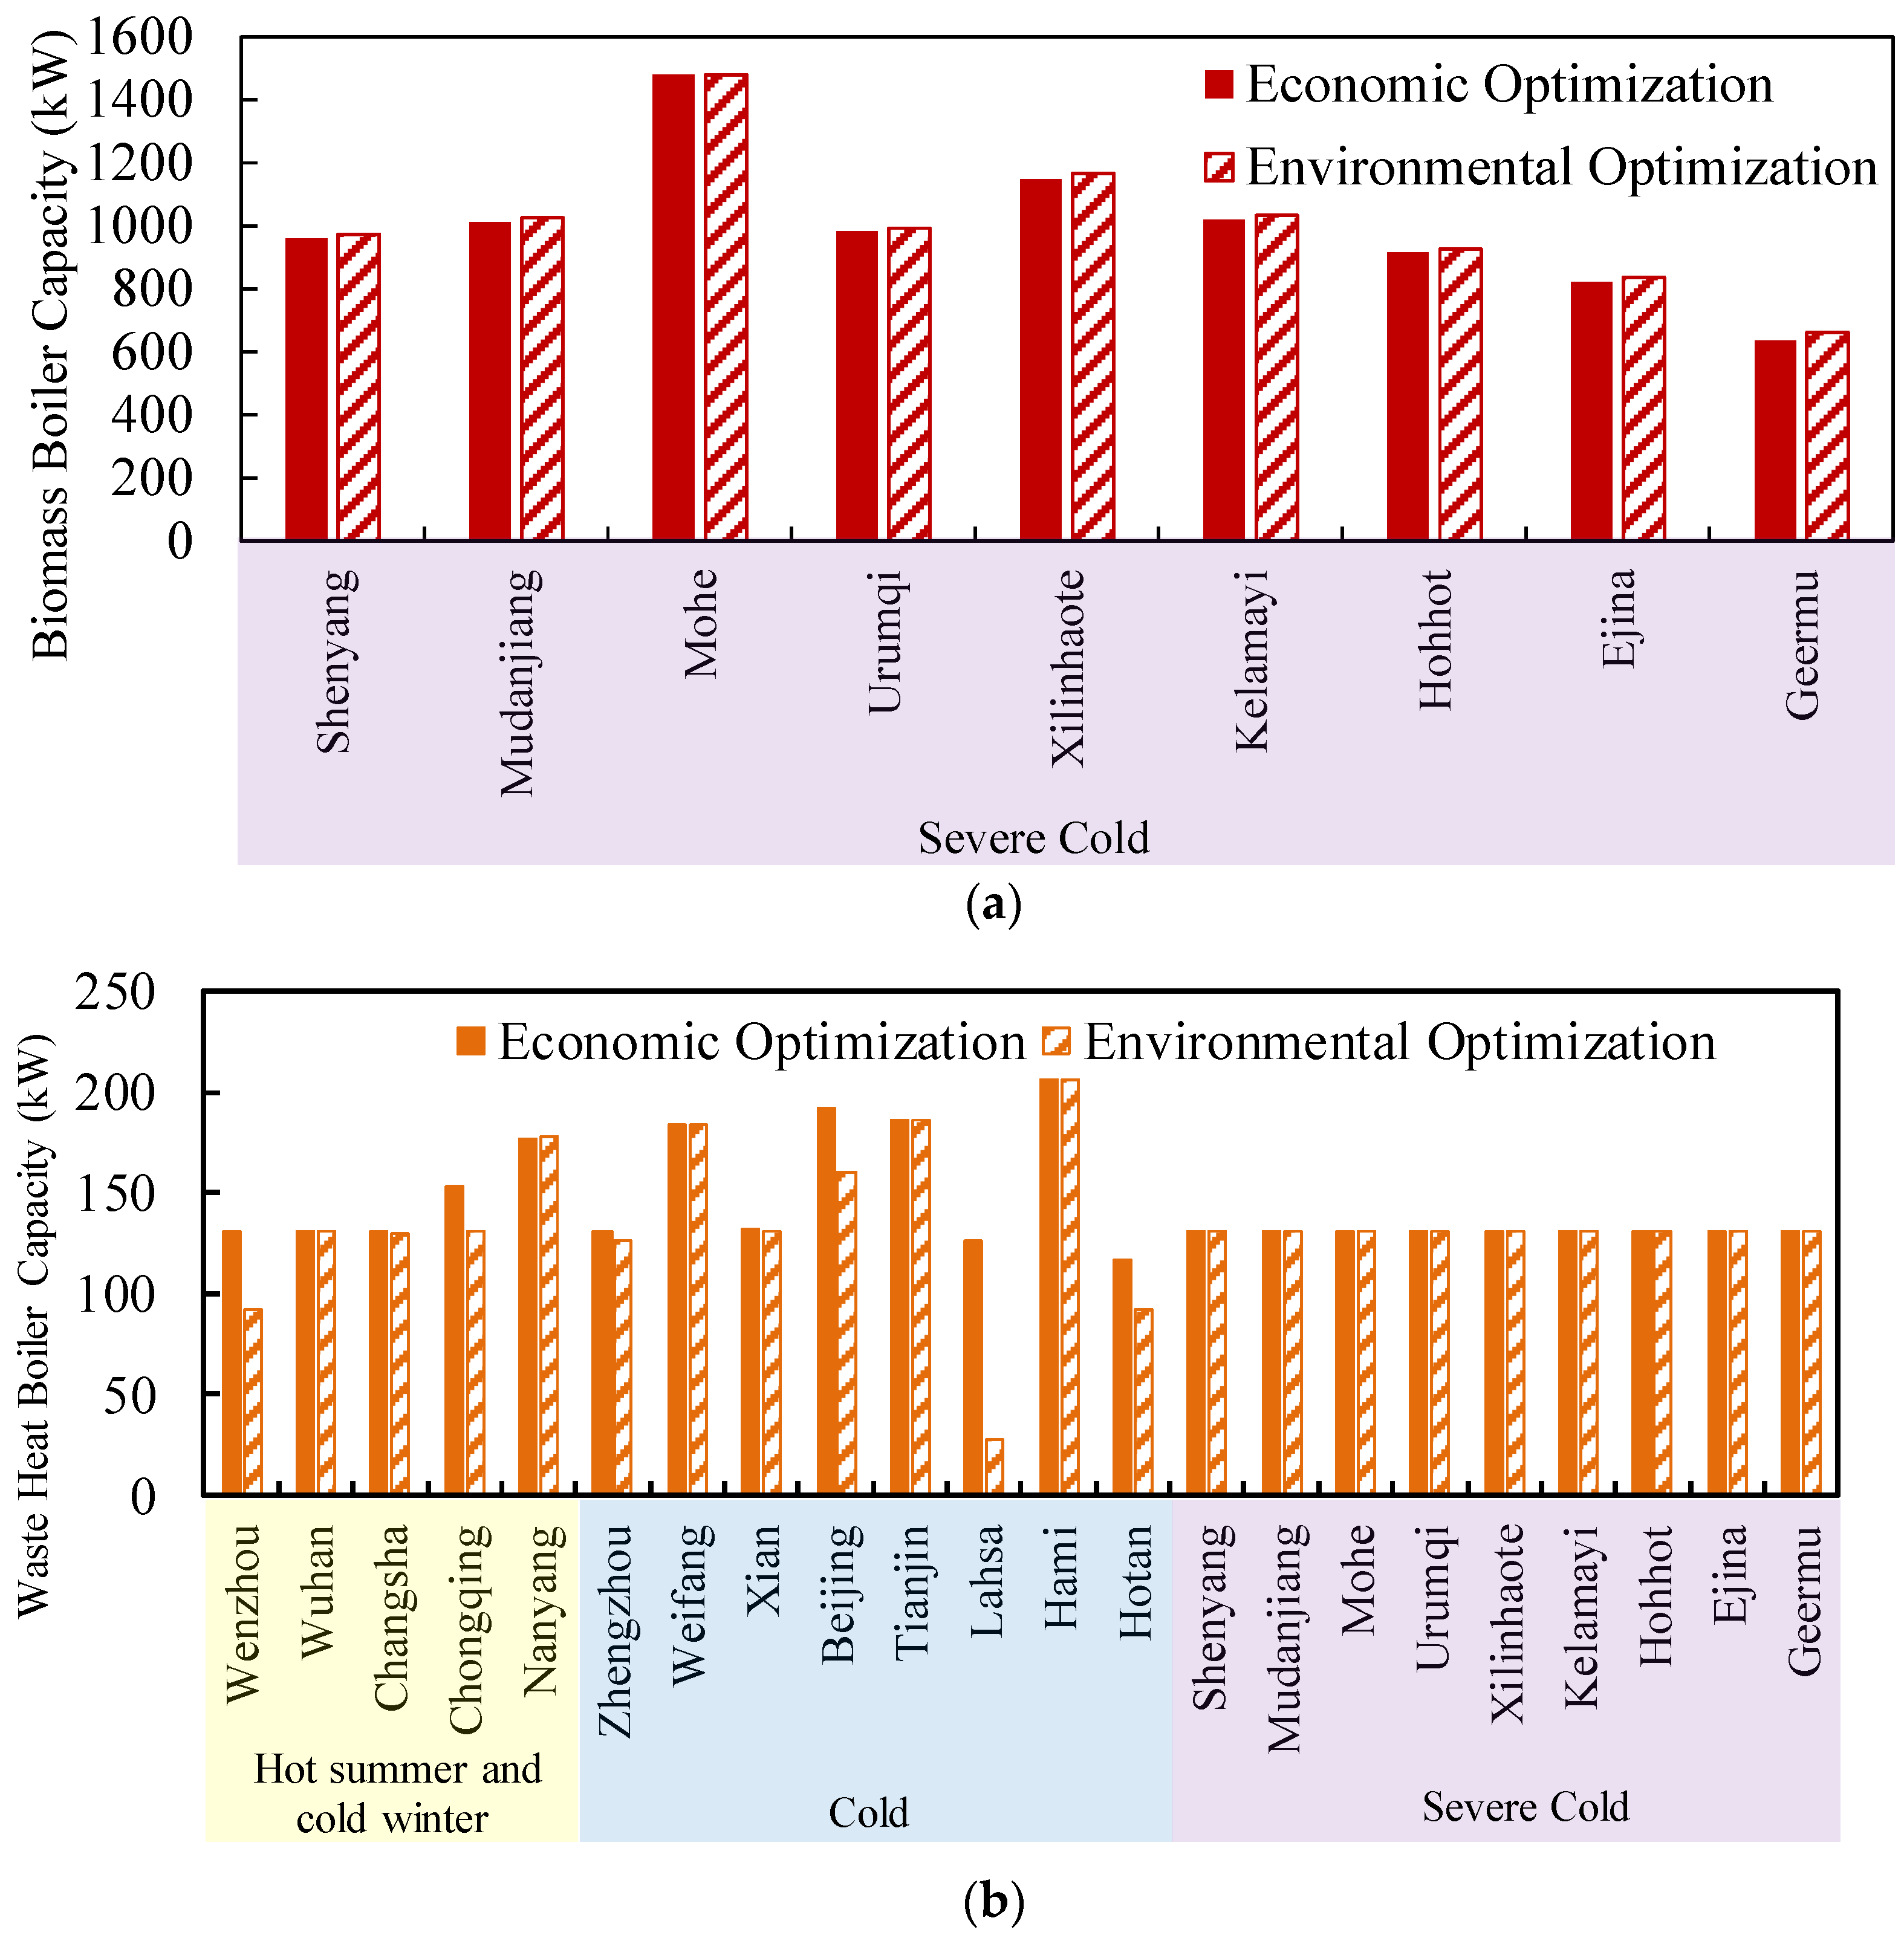
3.1. System Configuration

The optimization results of electricity subsystems of the 100% RESs in 30 cities are shown in Figure 6. Cities with different colors correspond to their climatic zones. Due to the differences in renewable energy outputs, the configurations of devices were different under different optimization objectives. The economic optimization aimed to reduce the life cycle costs of the 100% RESs. Due to the low resources of solar and wind energy, the installation capacities of PV/Ts and wind turbines were limited in some areas. The installation area of PV/Ts varied between 1293 and 3480 m2. It was relatively small in areas with poor solar energy resources, such as Guiyang, while the area was relatively high in regions with abundant solar energy resources, such as Geermu and Ejina. Only three cities (Shenyang, Weifang and Kelamayi) with abundant wind resources were proposed to have wind turbines installed, with the capacity varying from 44 to 72 kW. The biomass generators supply the electricity when the PV/Ts and WTs were not able to meet the demand; therefore, the capacity of the generators did not vary a lot between different areas, which was between 194 to 304kW. The environmental optimization aimed to reduce the CO2 emissions of the 100% RES, which was mainly from biogas combustion. Therefore, the PV/T and wind turbine installation capacities reached the maximum in all the areas. The capacity of biomass generators for environmental optimization was smaller than the capacity for economic optimization.
The optimization results of the cooling subsystems are shown in Figure 7. The capacities of the electric chillers and heat pumps were mainly determined by the peak cooling loads, while the absorption chiller installation capacities were limited by the generator capacities. According to the economic optimization, the capacities of the electric chillers, heat pumps and absorption chillers varied in the ranges of 815–993 kW, 676–1062 kW and 59–203 kW, respectively. The absorption chiller capacities were smaller but the capacities of electric chillers and heat pump chillers were larger for the environmental optimization.
The optimization results of the heating subsystems are shown in Figure 8. The capacities of the biomass boilers were mainly determined by the peak heating loads, while the waste heat boiler installation capacities were limited by the generator capacities. For the economic optimization, the biomass boiler capacities varied from 960 to 1480 kW. Mohe needed more biogas to satisfy the heating load. As a result, the biomass boiler capacity of Mohe’s 100% RES was the largest in this region. The capacities of the waste heat boilers varied from 131 to 205 kW due to the limitation of the waste heat recovered from the biomass generator. For the environmental optimization, the waste heat boiler capacity was smaller and the biomass boiler was larger than that for economic optimization, which resulted from smaller generators.

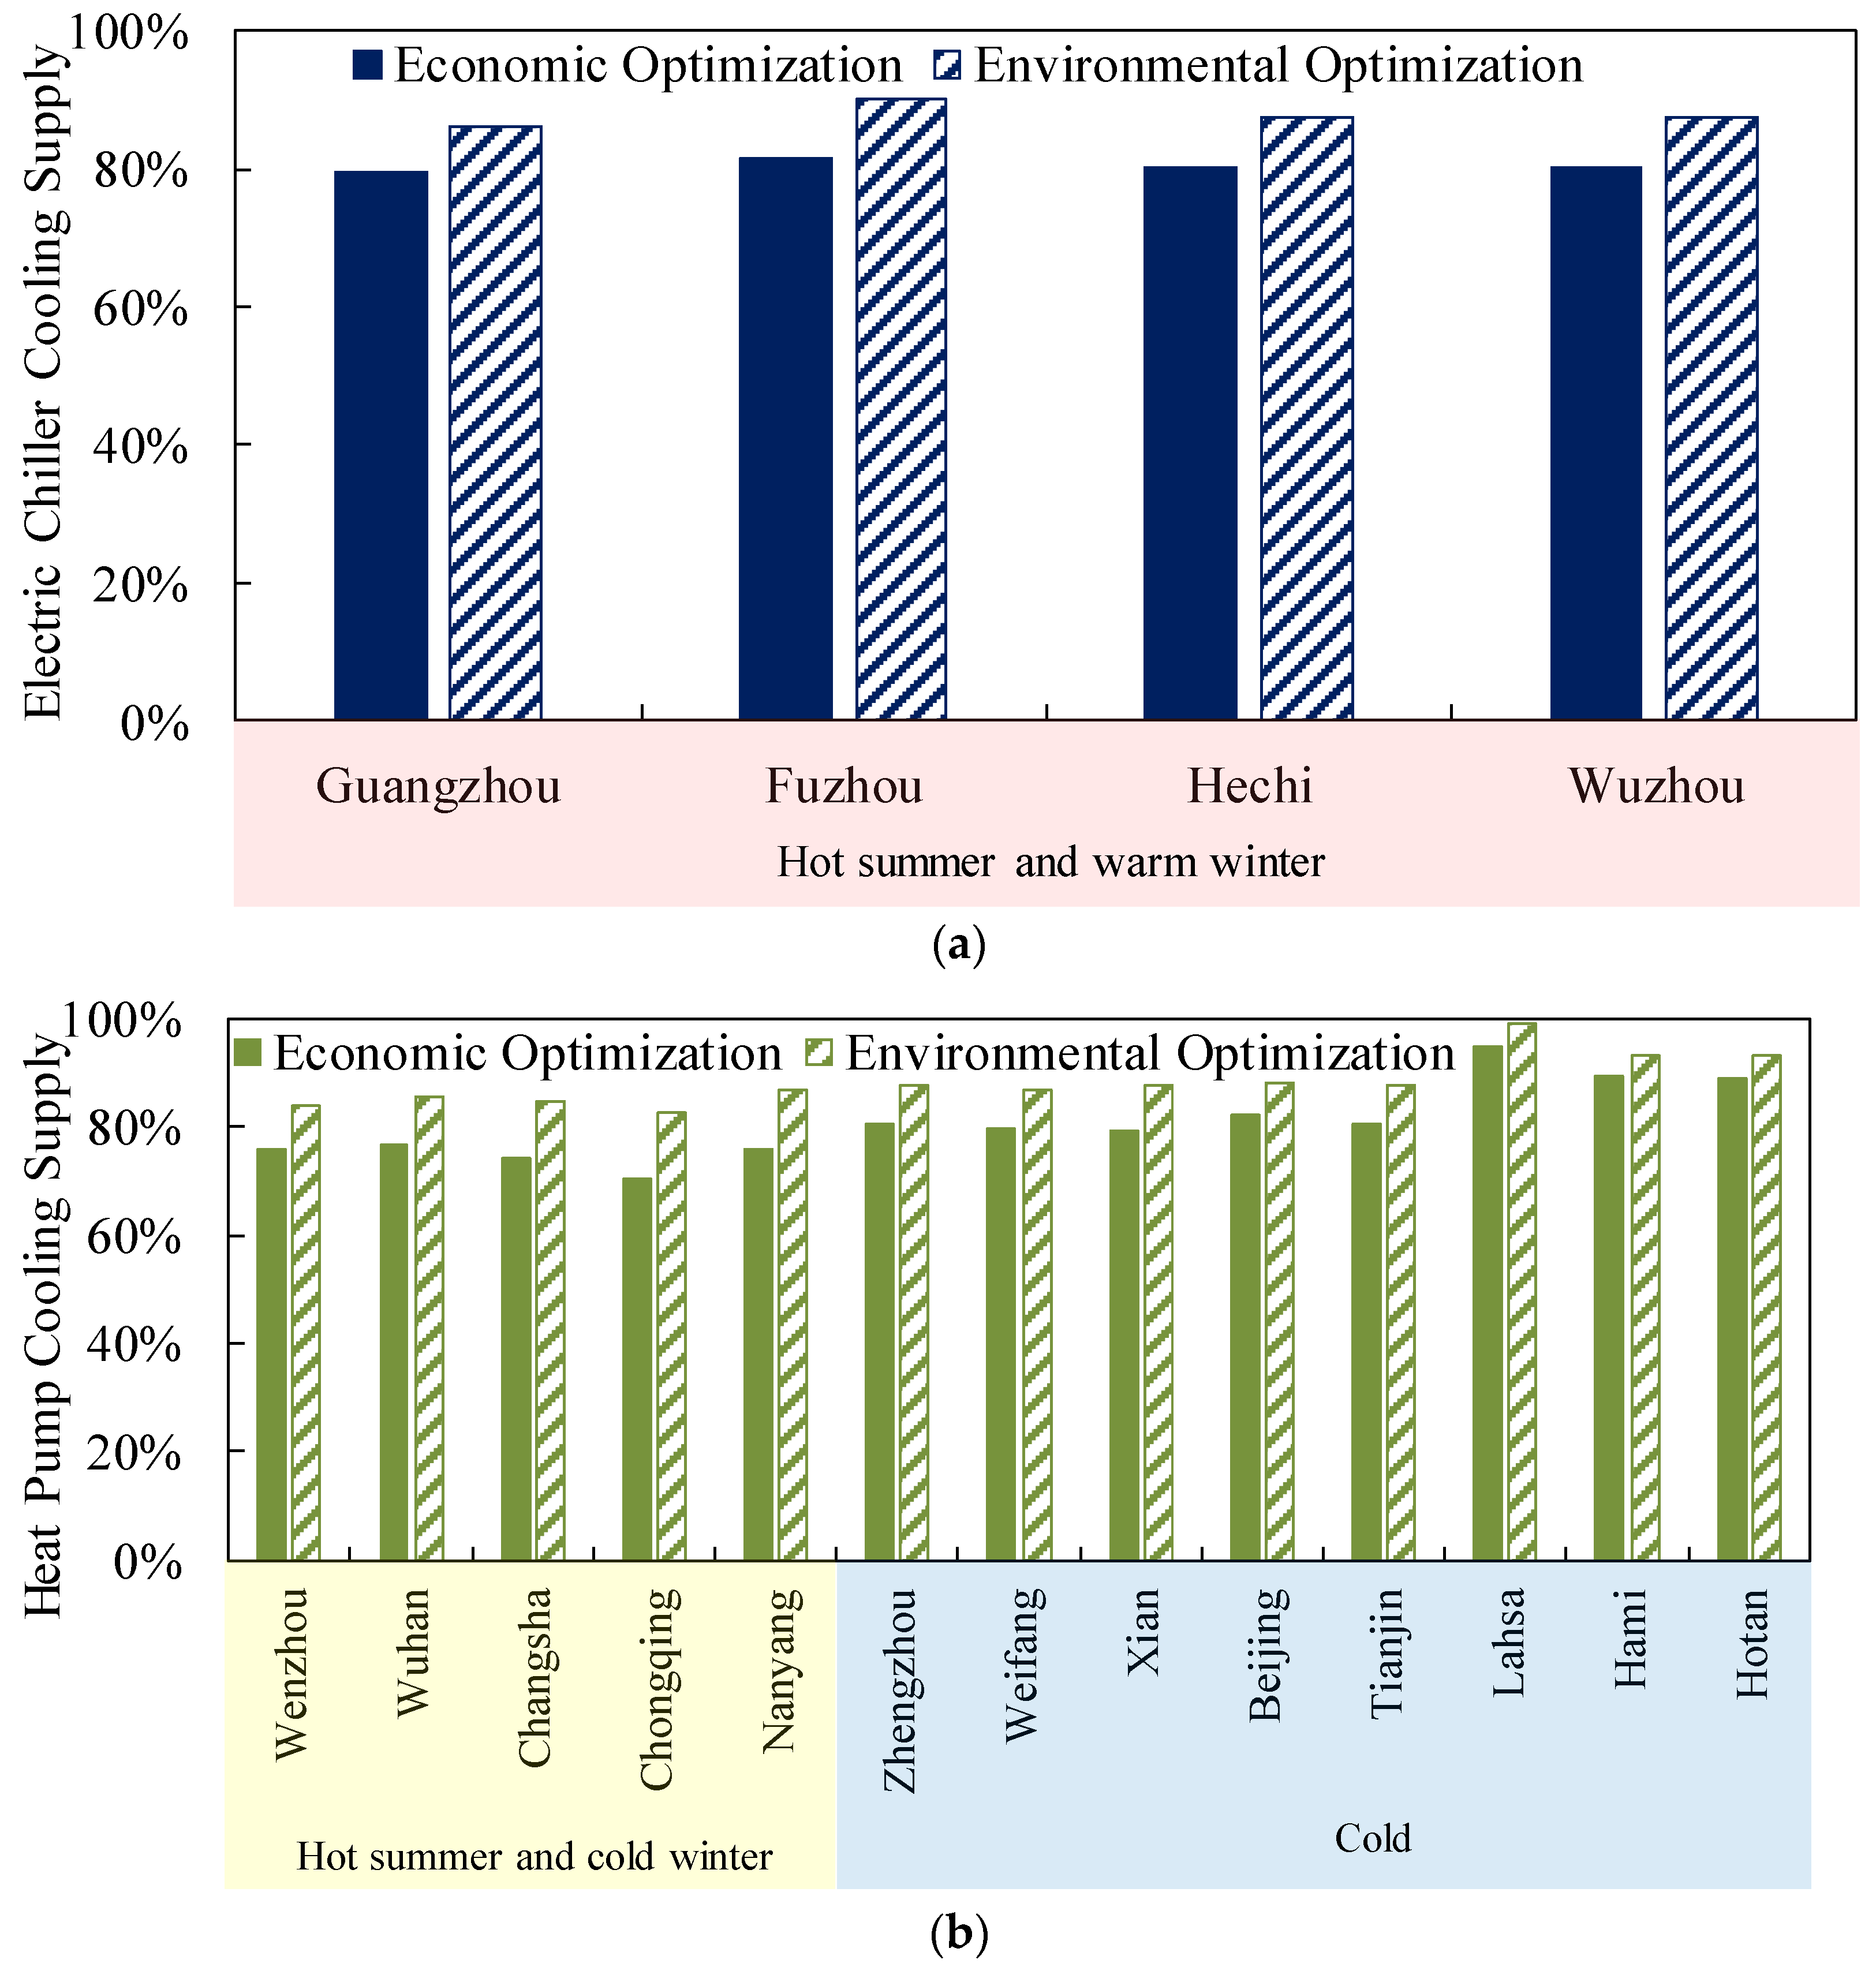
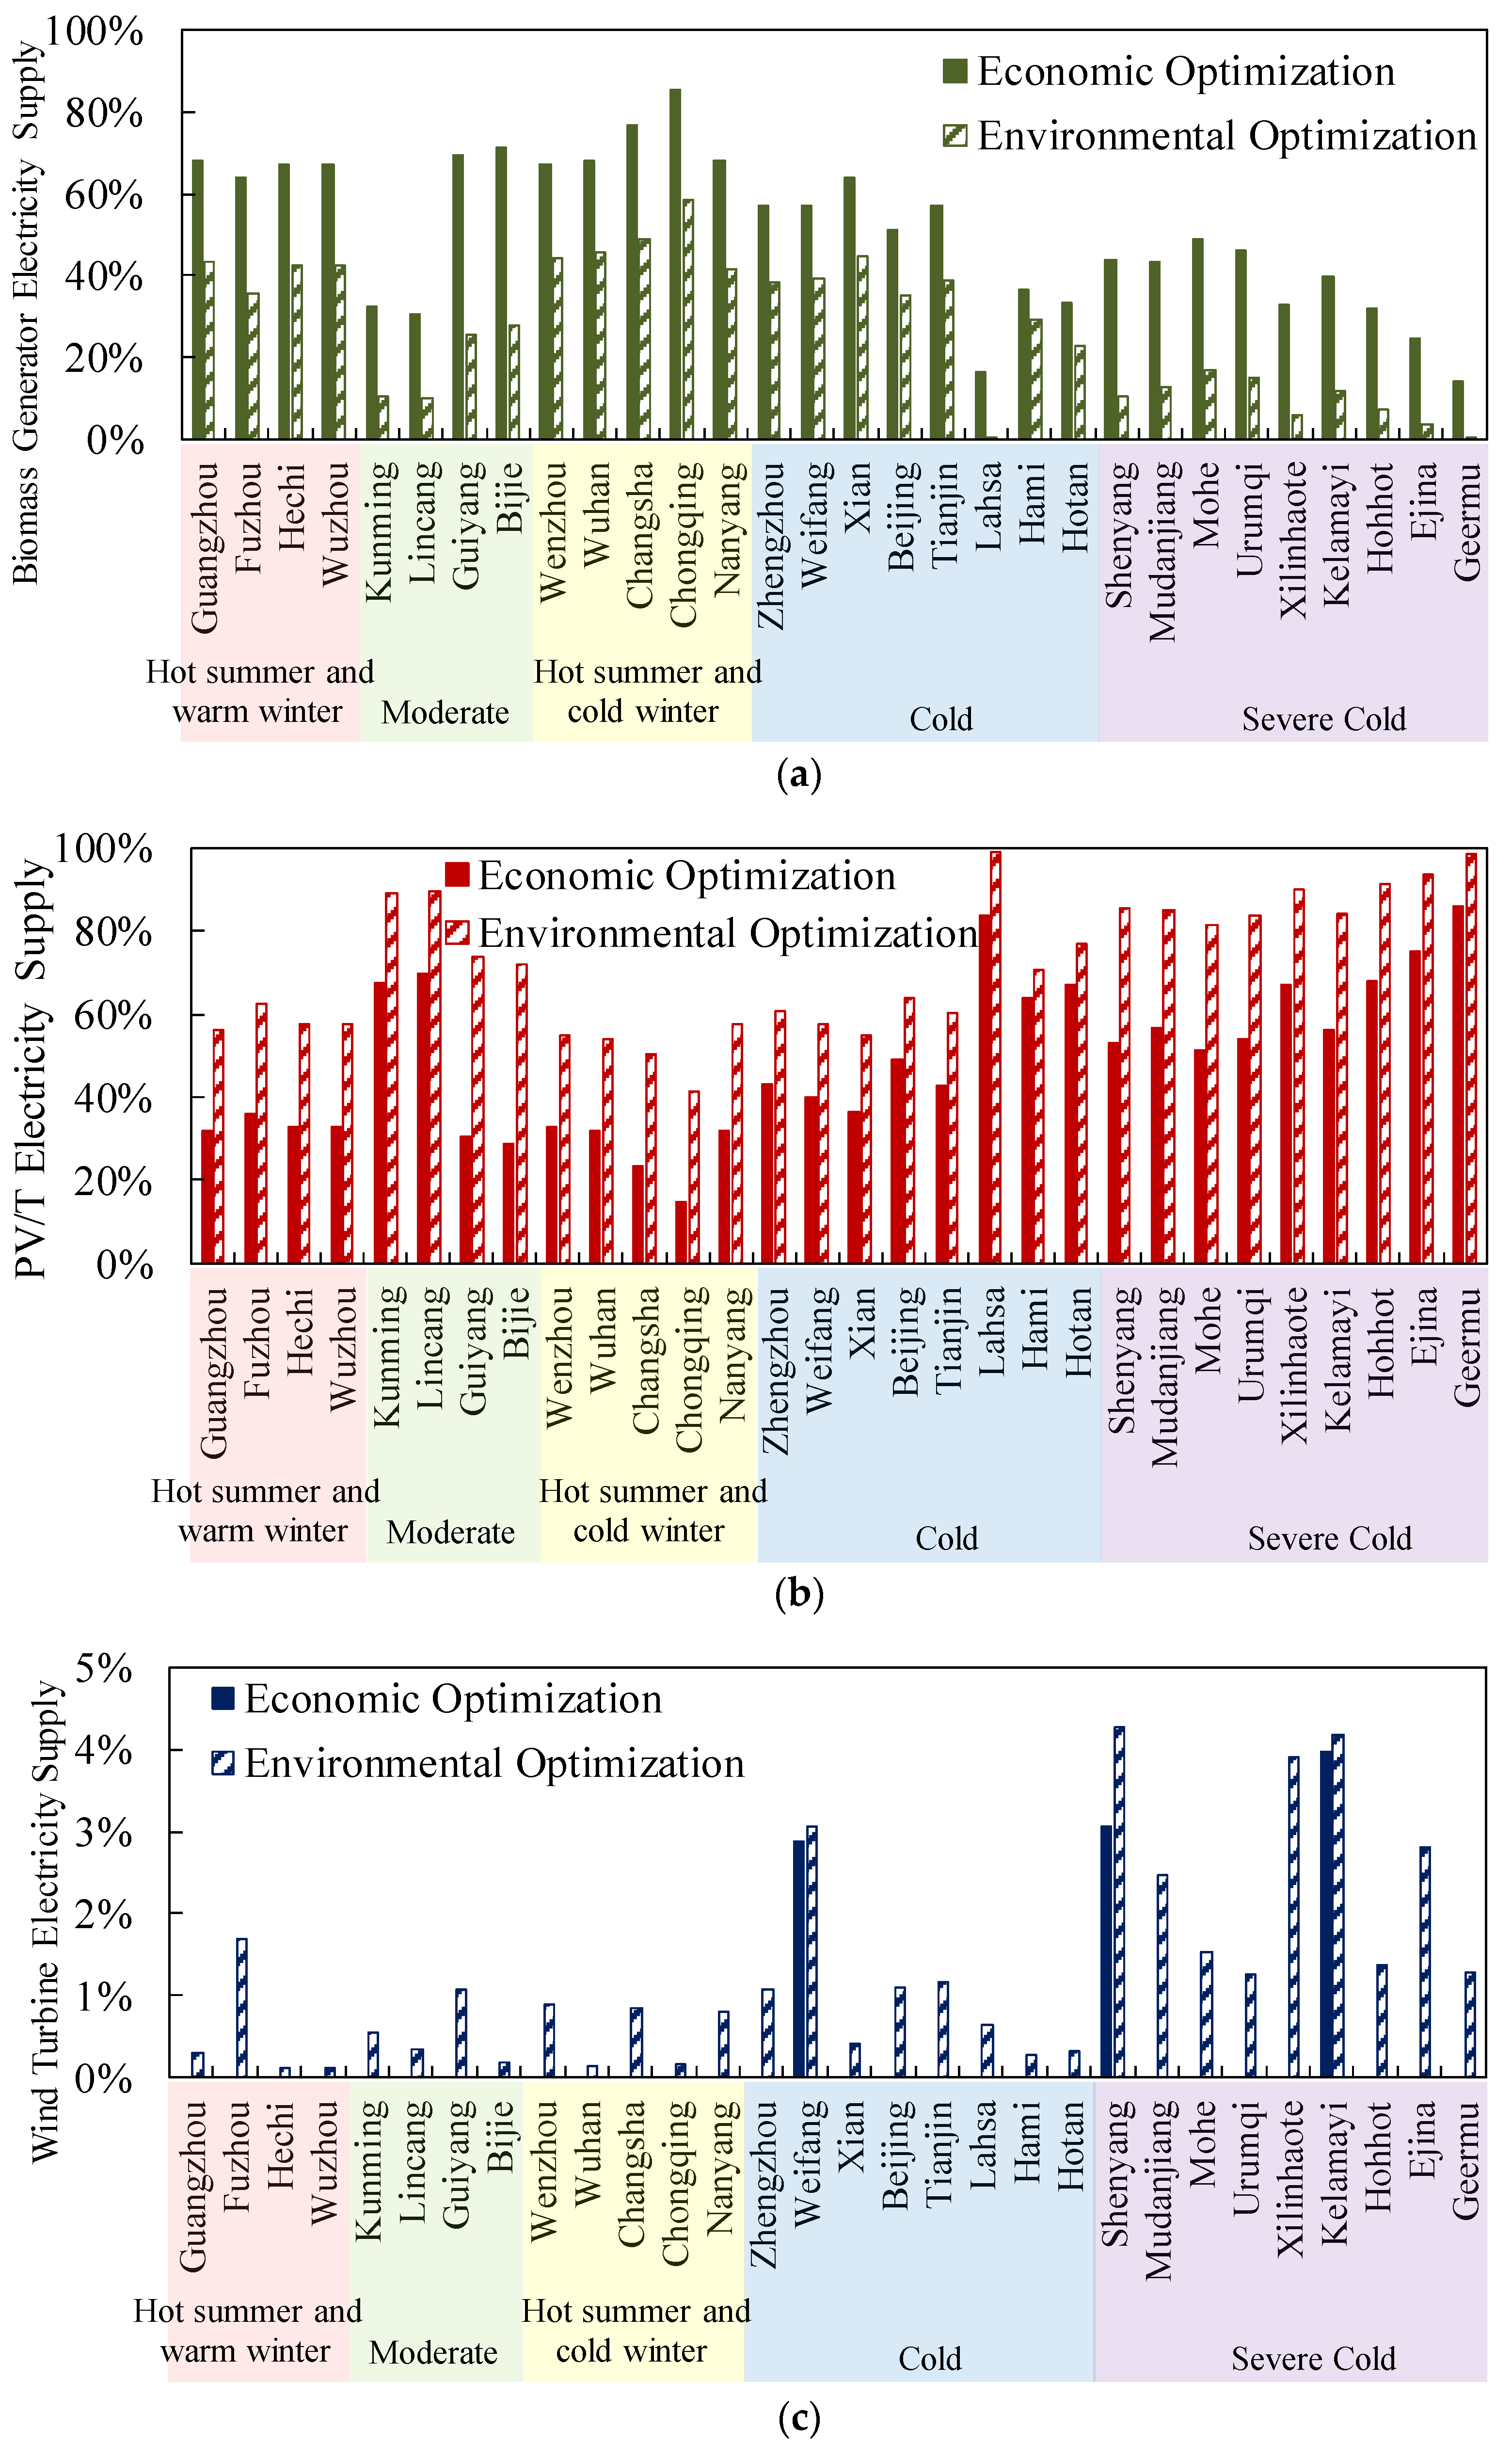
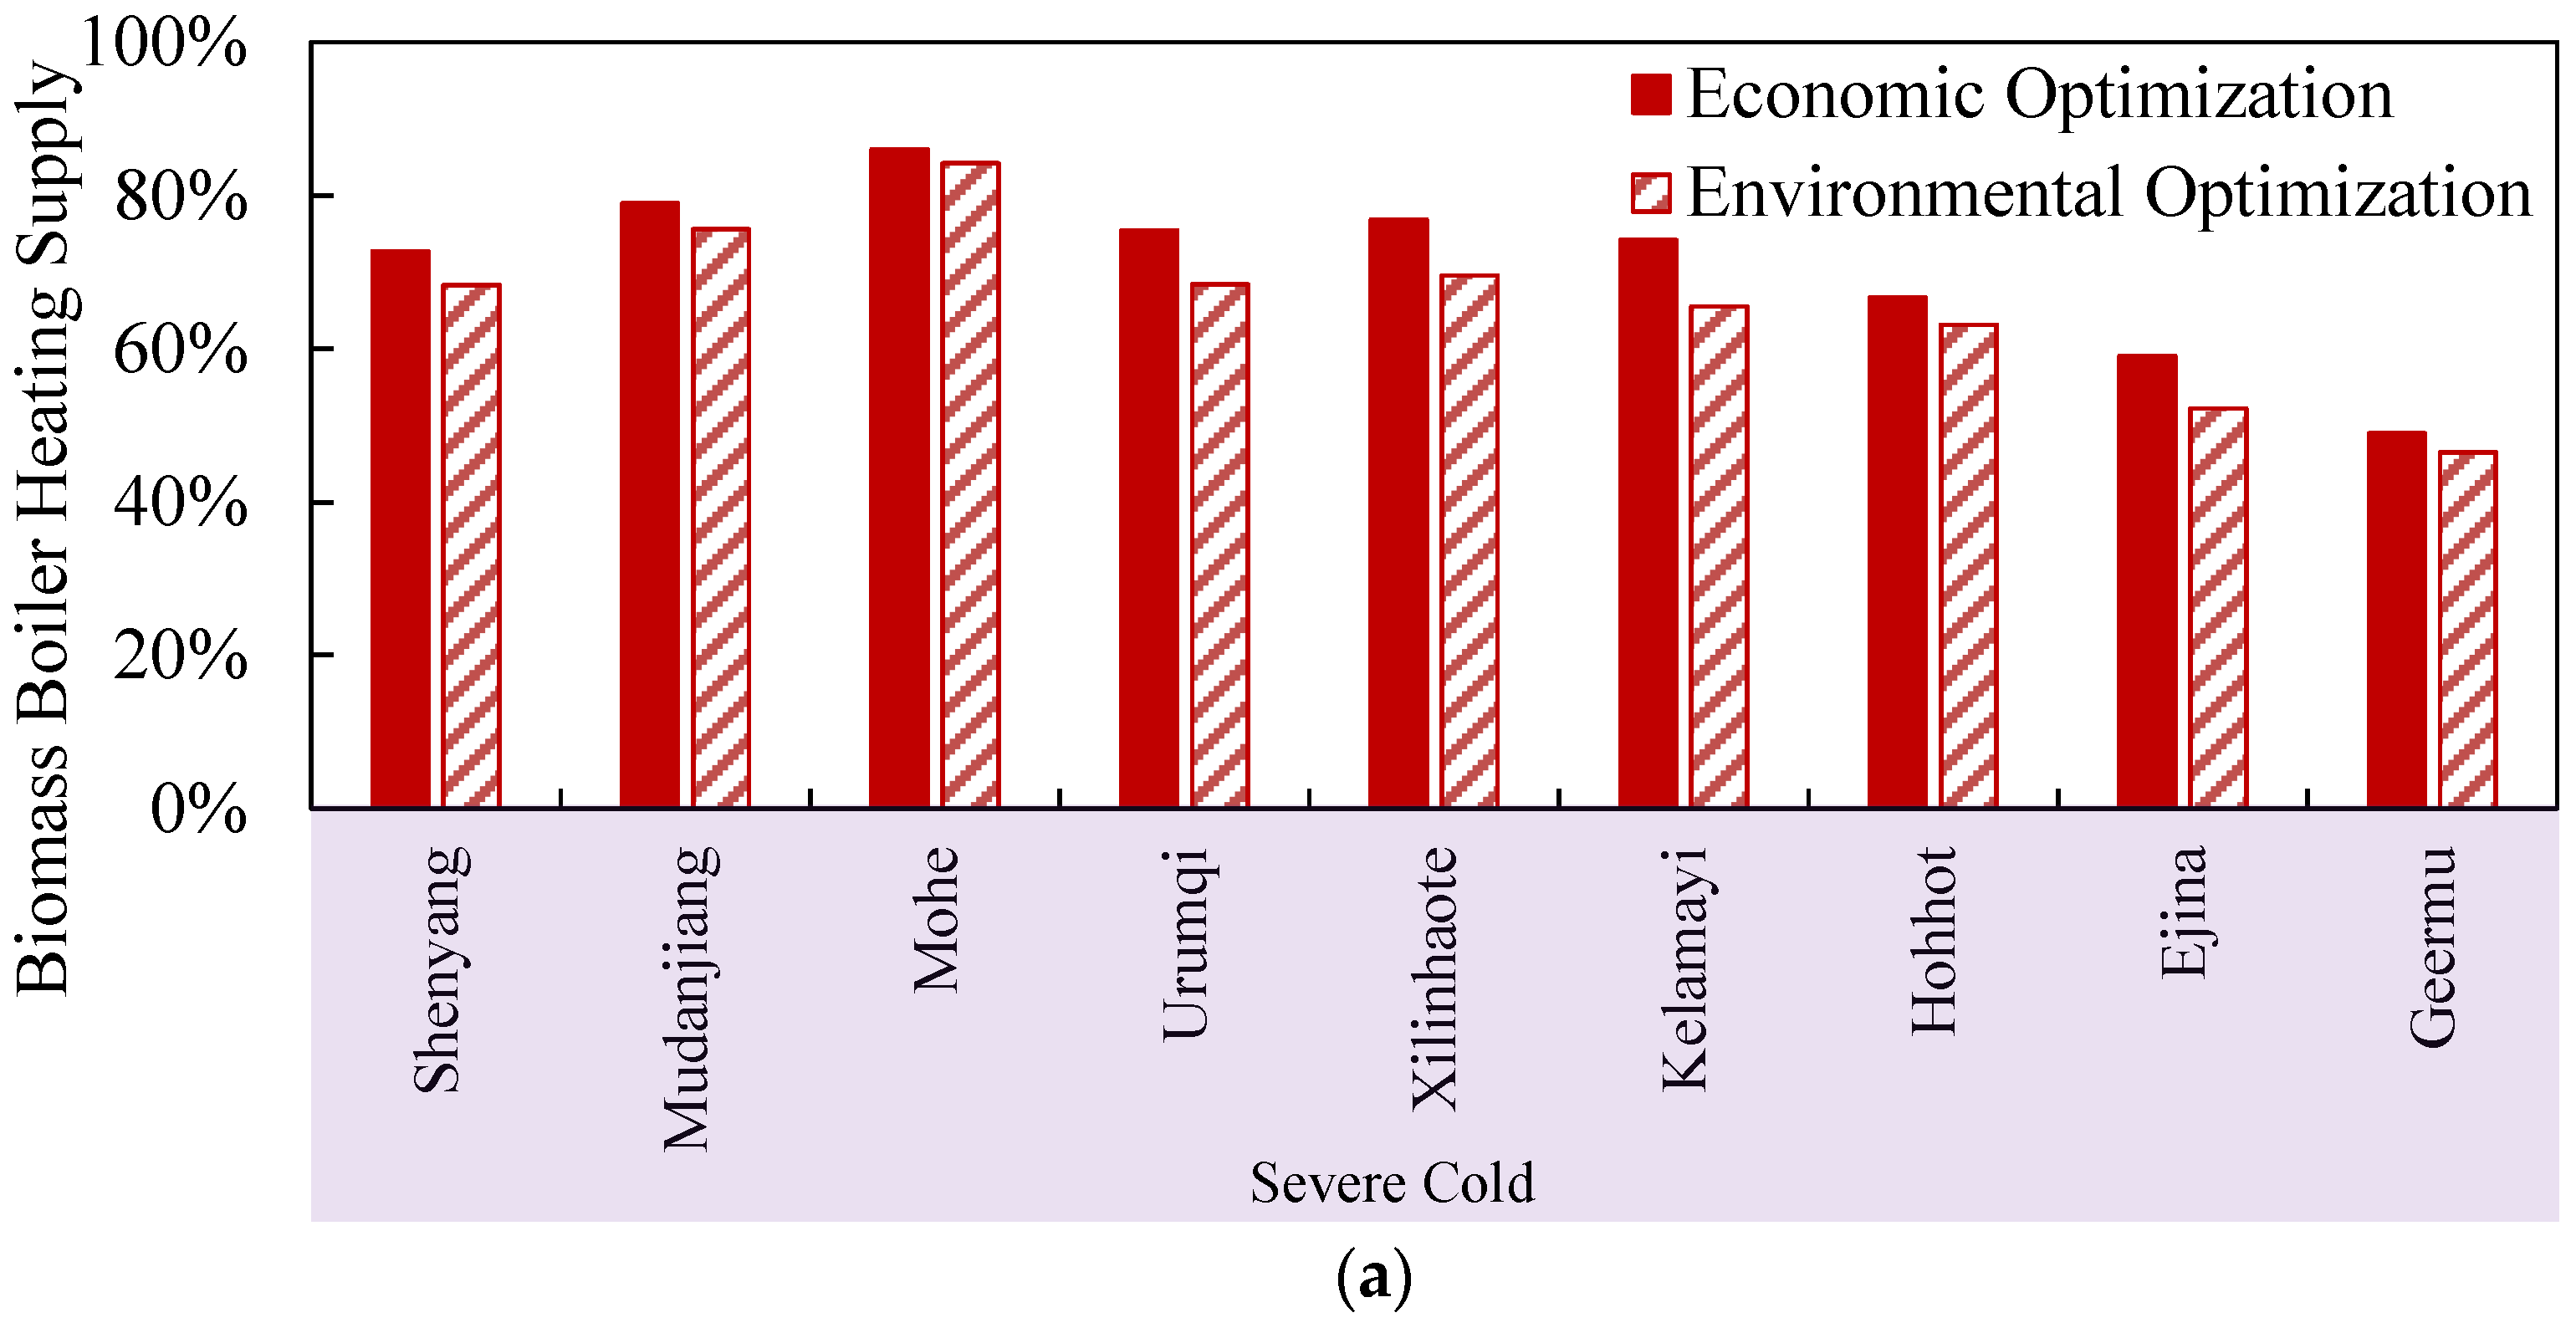
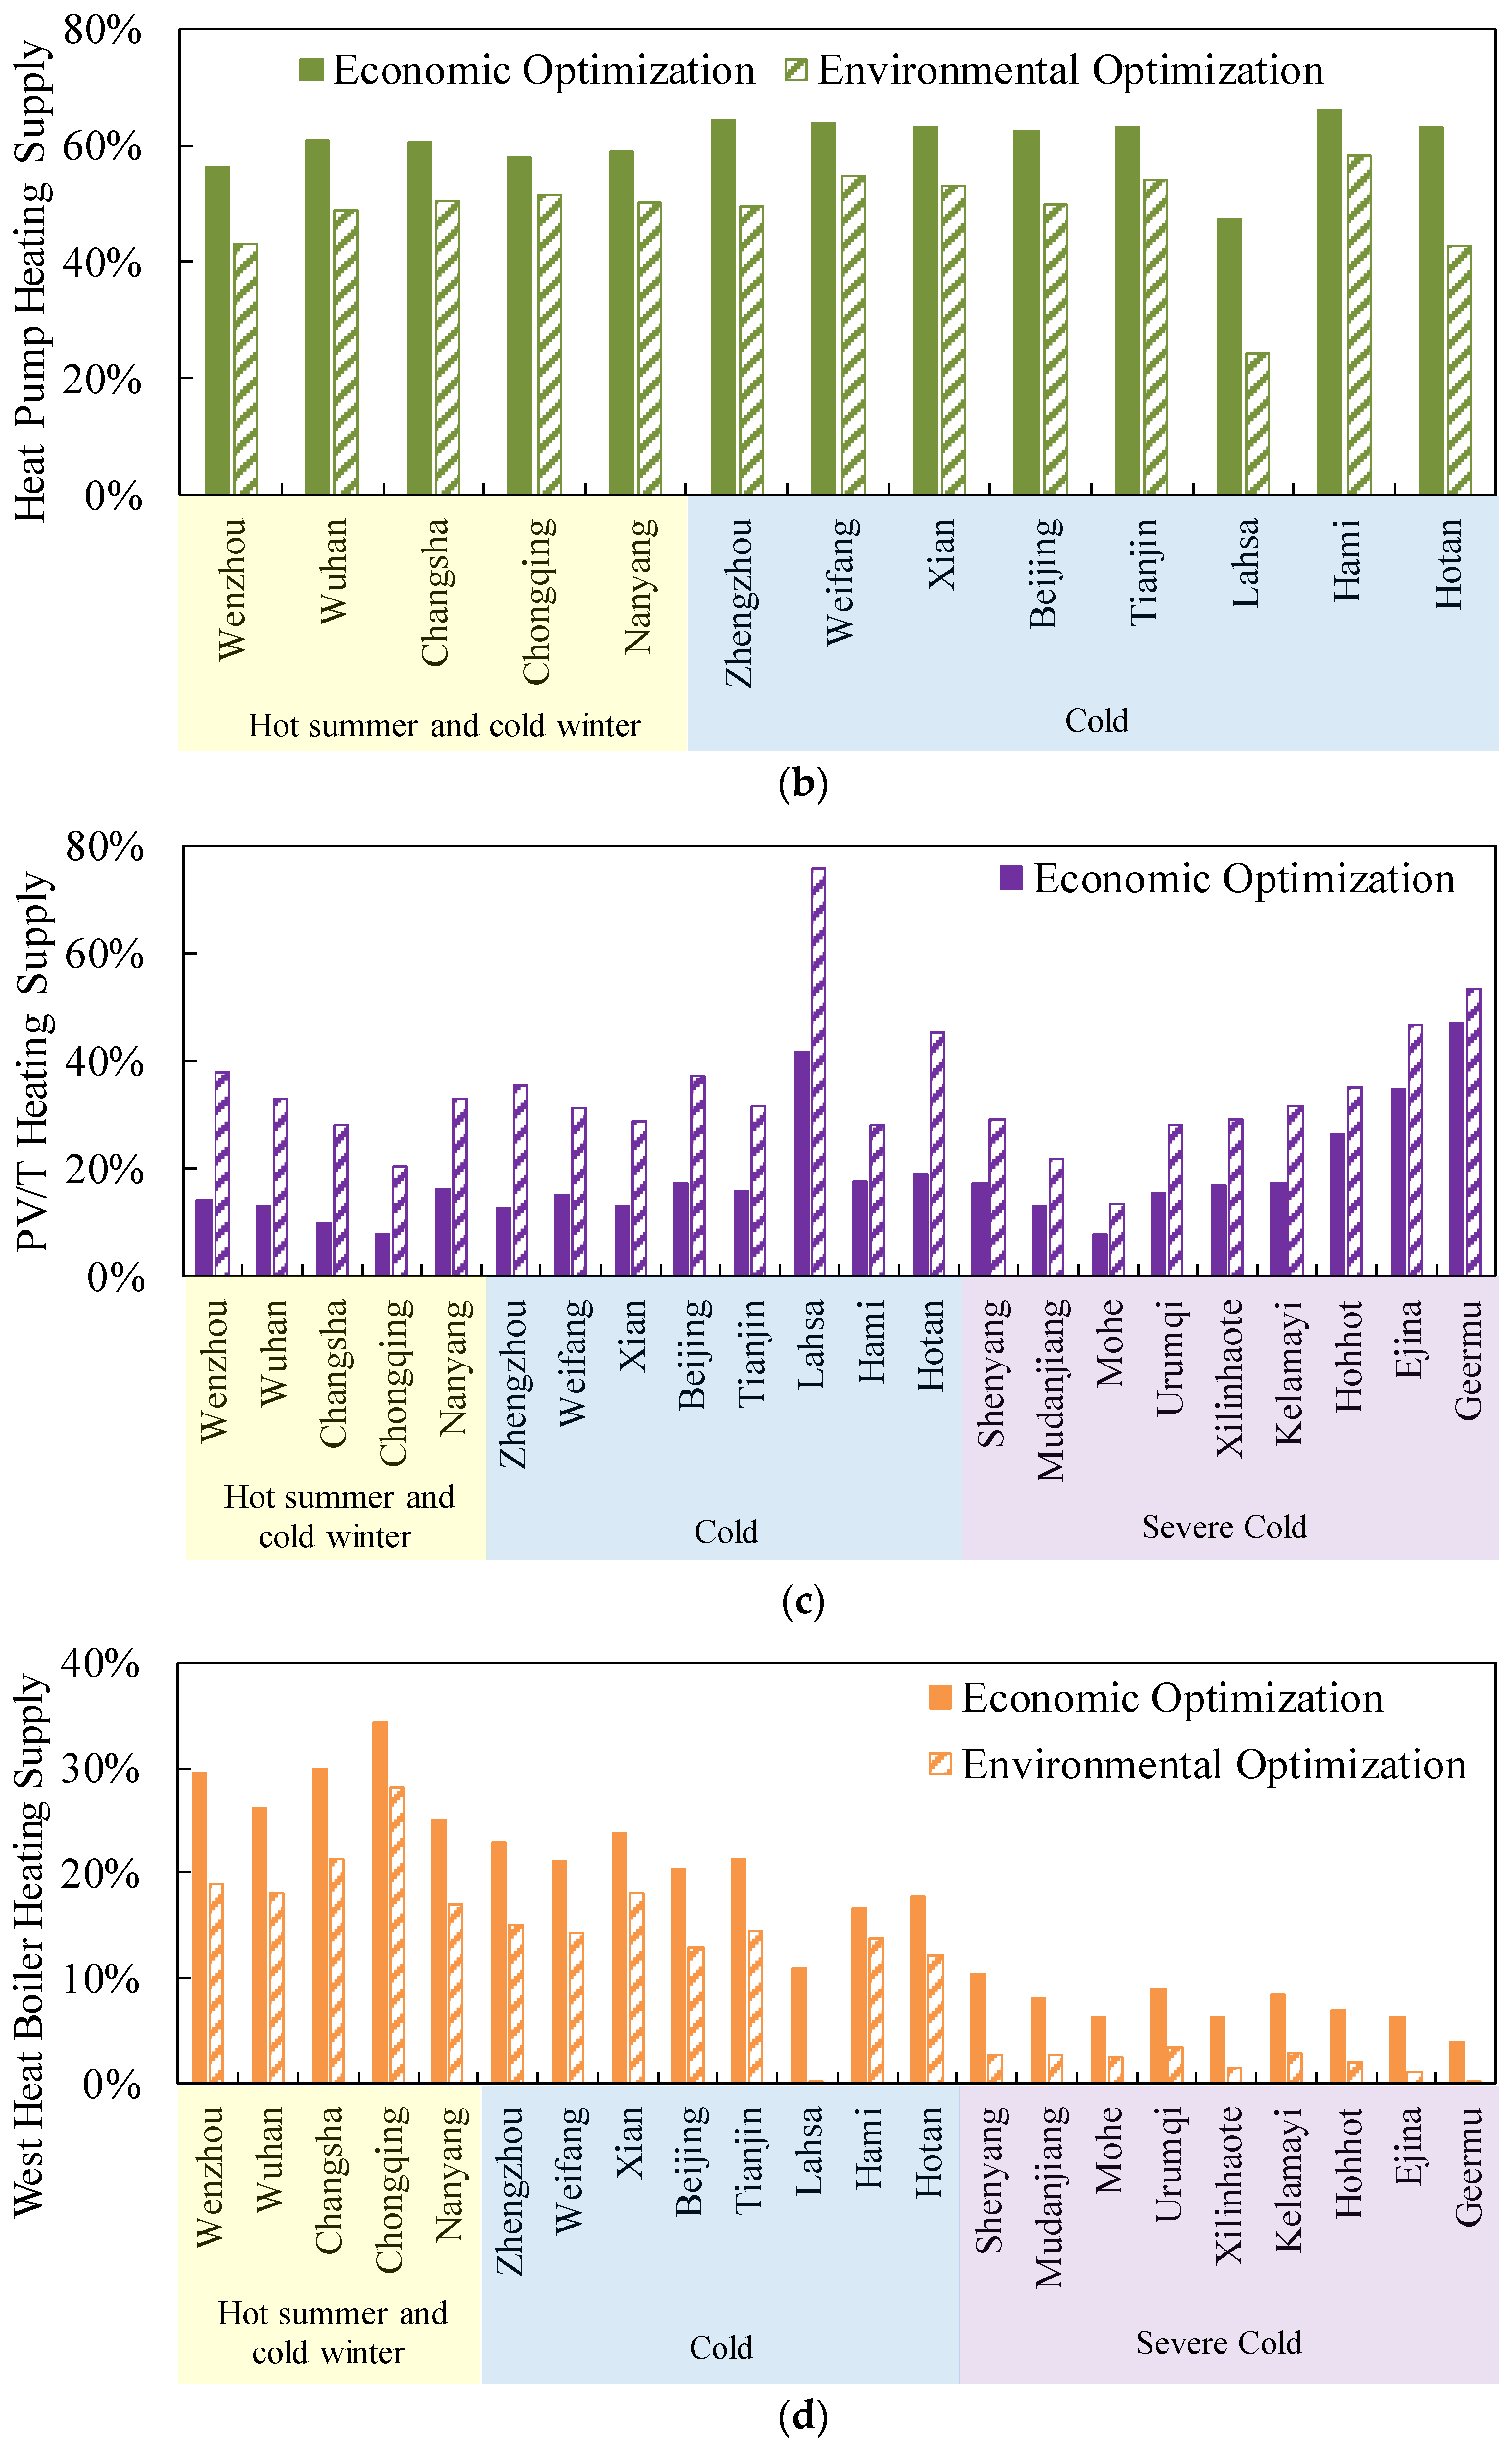
3.2. Operation Characteristics of the 100% RESs

The operation results of the 100% RESs in the selected areas of China under economic optimization and environmental optimization are shown in this section. The electricity supply of different devices is shown in Figure 9. For the economic optimization, the electricity supplies of a biomass generator, PV/T and wind turbine were influenced by the renewable energy distribution and load characteristics, which varied significantly in different areas. The power supply proportions of biomass generators were relatively high in most areas and varied from 14 to 85%. The PV/T power supply proportions changed from 14 to 84%. The lowest proportion was in Chongqing due to poor solar energy and the highest was in Geermu due to abundant solar energy. Only the three regions where wind resources were abundant (Shenyang, Weifang and Kelamayi) used wind energy and the proportion was less than 5%. For the environmental optimization, PV/Ts supplied most of the power demand in many regions. The power supply proportion of PV/Ts ranged from 44 to 98%. The biomass generator contributed 2~65% of the power supply among the different regions, while the wind turbines could only supply 0.2~4.3% of the electricity demand in different areas due to the lack of wind energy and the small capacity of wind turbines.
The cooling supply proportions of different components are shown in Figure 10. According to the results, the cooling supply of each device was mainly affected by the cooling load. Heat pumps and electric chillers accounted for a relatively large percentage of the annual cooling supply. The cooling supply proportion of electric chiller or heat pump was higher for cities such as Fuzhou due to the high cooling load in summer. For the economic optimization, the cooling supply proportion of electric chillers varied between 79 and 82% and the proportion for heat pumps varied between 70 and 95%. The cooling supply proportion of the absorption chiller was low because the available waste heat was limited, which varied between 18 and 32% among different regions. For the environmental optimization, the absorption chiller supplied less cooling due to the lower capacity of biomass generators. The cooling supply proportion for absorption chillers varied from 15 to 25%. The electric chiller and heat pump supplies more cooling energy and the proportion of cooling supply varied from 86 to 90% and 82 to 99%, respectively, for the environmental optimization.
The proportions of the heating supply of different components are shown in Figure 11. The heating supply of each device was affected by the heating load and solar energy distributions. For areas with abundant solar energy, such as Lahsa and Geermu, the solar heat was able to supply more heat than cities located in poor solar energy areas, such as Mohe and Chongqing, where heat pumps or biomass boilers accounted for a relatively high proportion of the annual heating supply. For the economic optimization, the heating supply proportion of biomass boilers varied between 50 and 86%, while the proportion of heat pumps varied between 47 and 65%. The heating supply proportion of PV/Ts varied between 7 and 47% among different areas due to the differences in the distribution of solar energy, while the waste heat boiler supply was between 3 and 34%. For the environmental optimization, the waste heat boiler supplied less heating due to the limited waste heat and the heating supply proportion was less than 29%. The solar heat met most heating loads in most regions due to the increased PV/T capacities and the heating supply proportion varied from 13 to 75%. Heat pumps met 24~55% of the heating load. The heating supply proportions of the biomass boilers did not vary too much due to the large heating demand in winter.

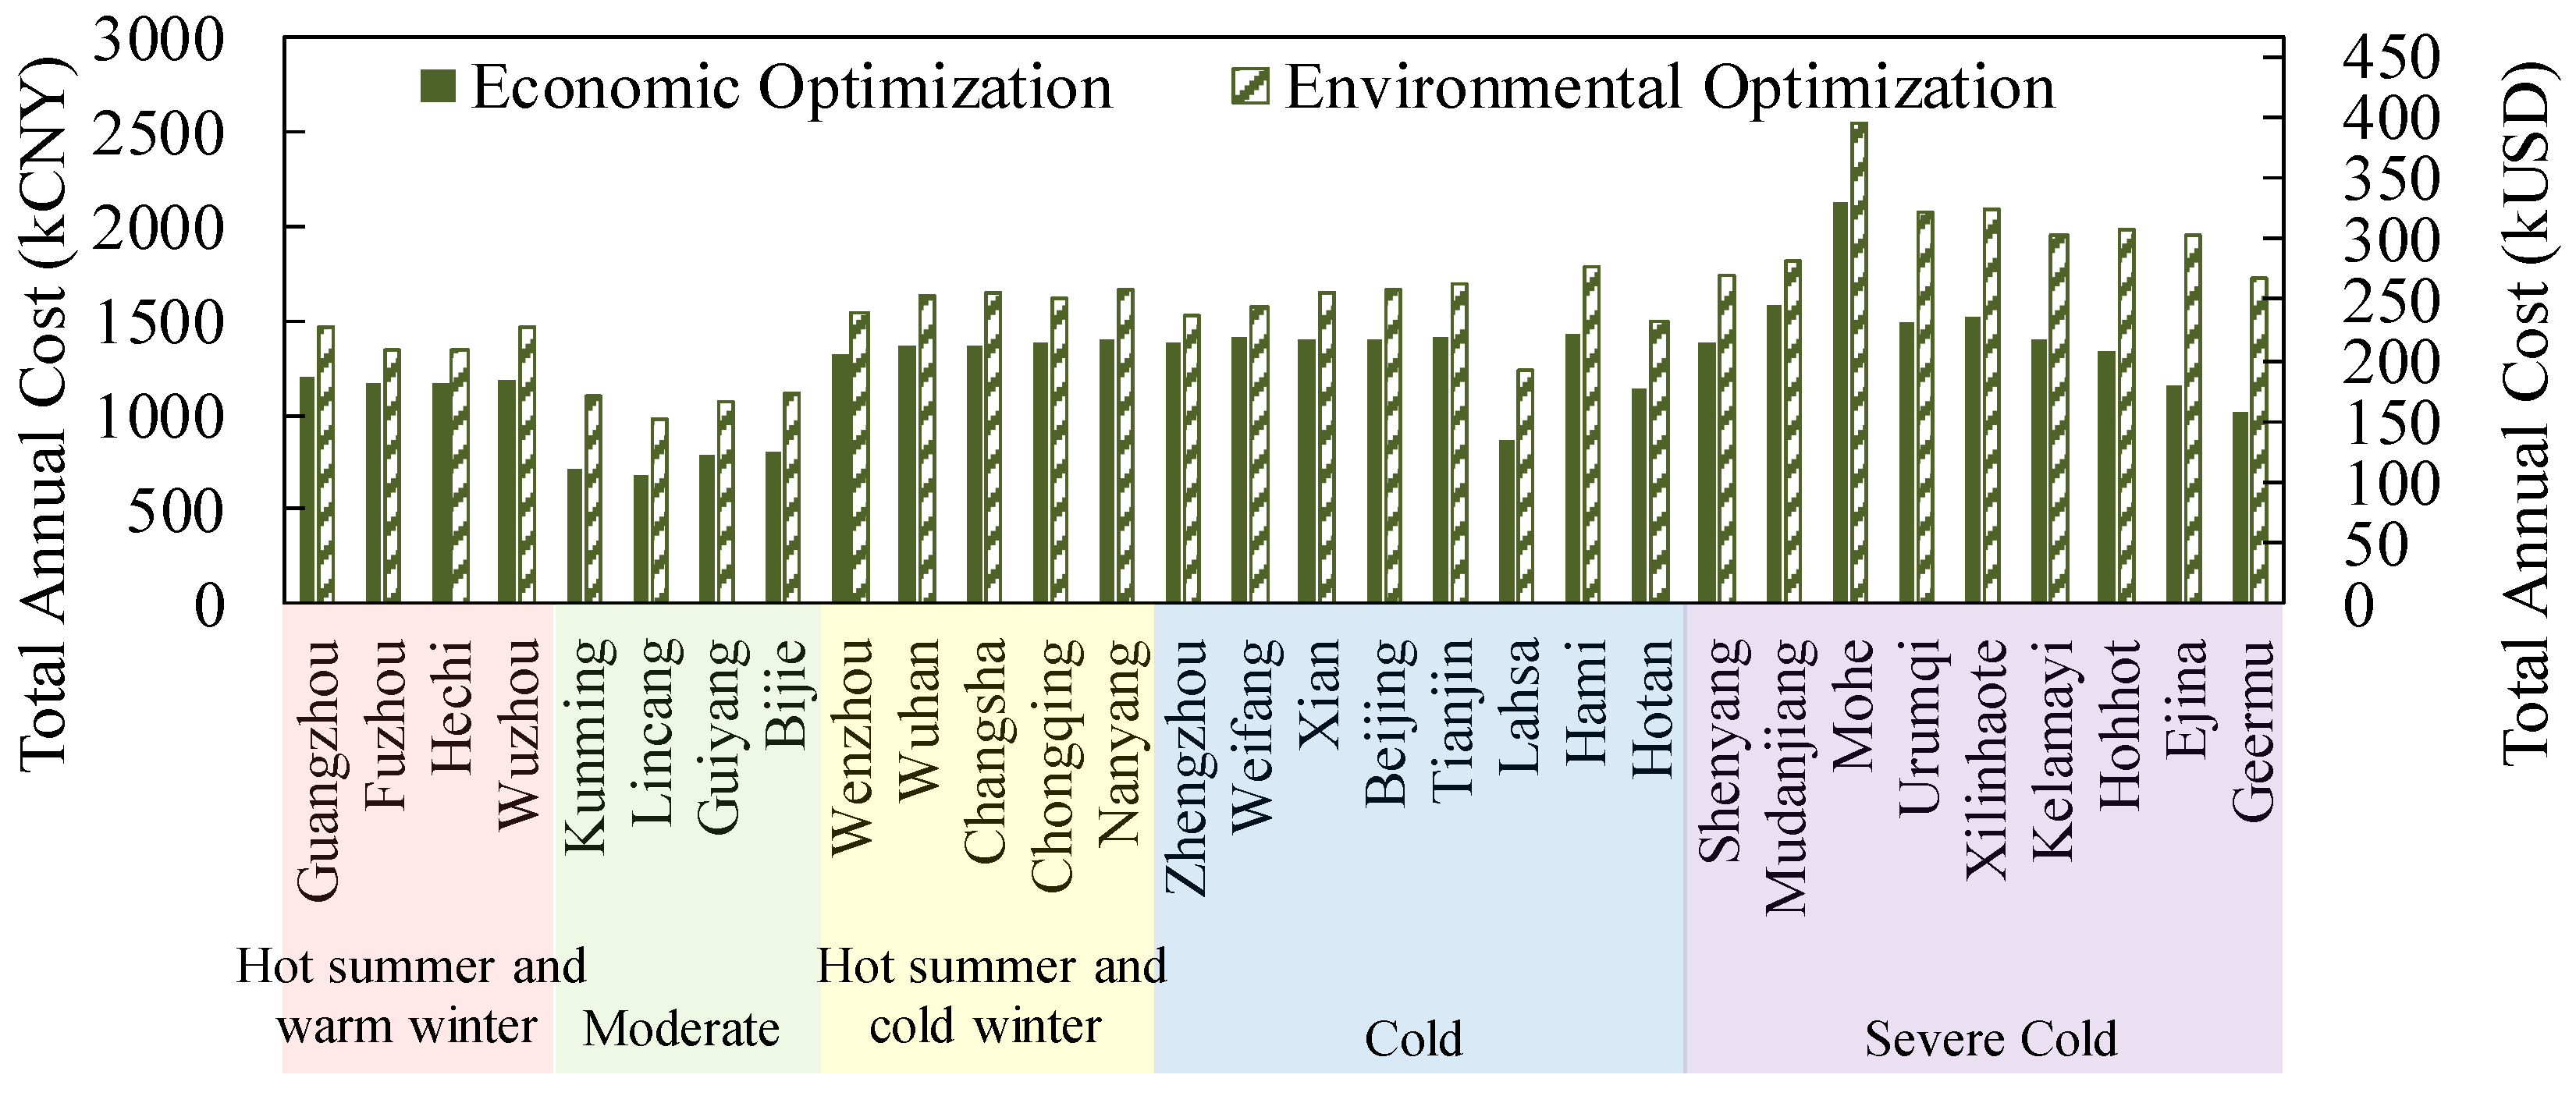
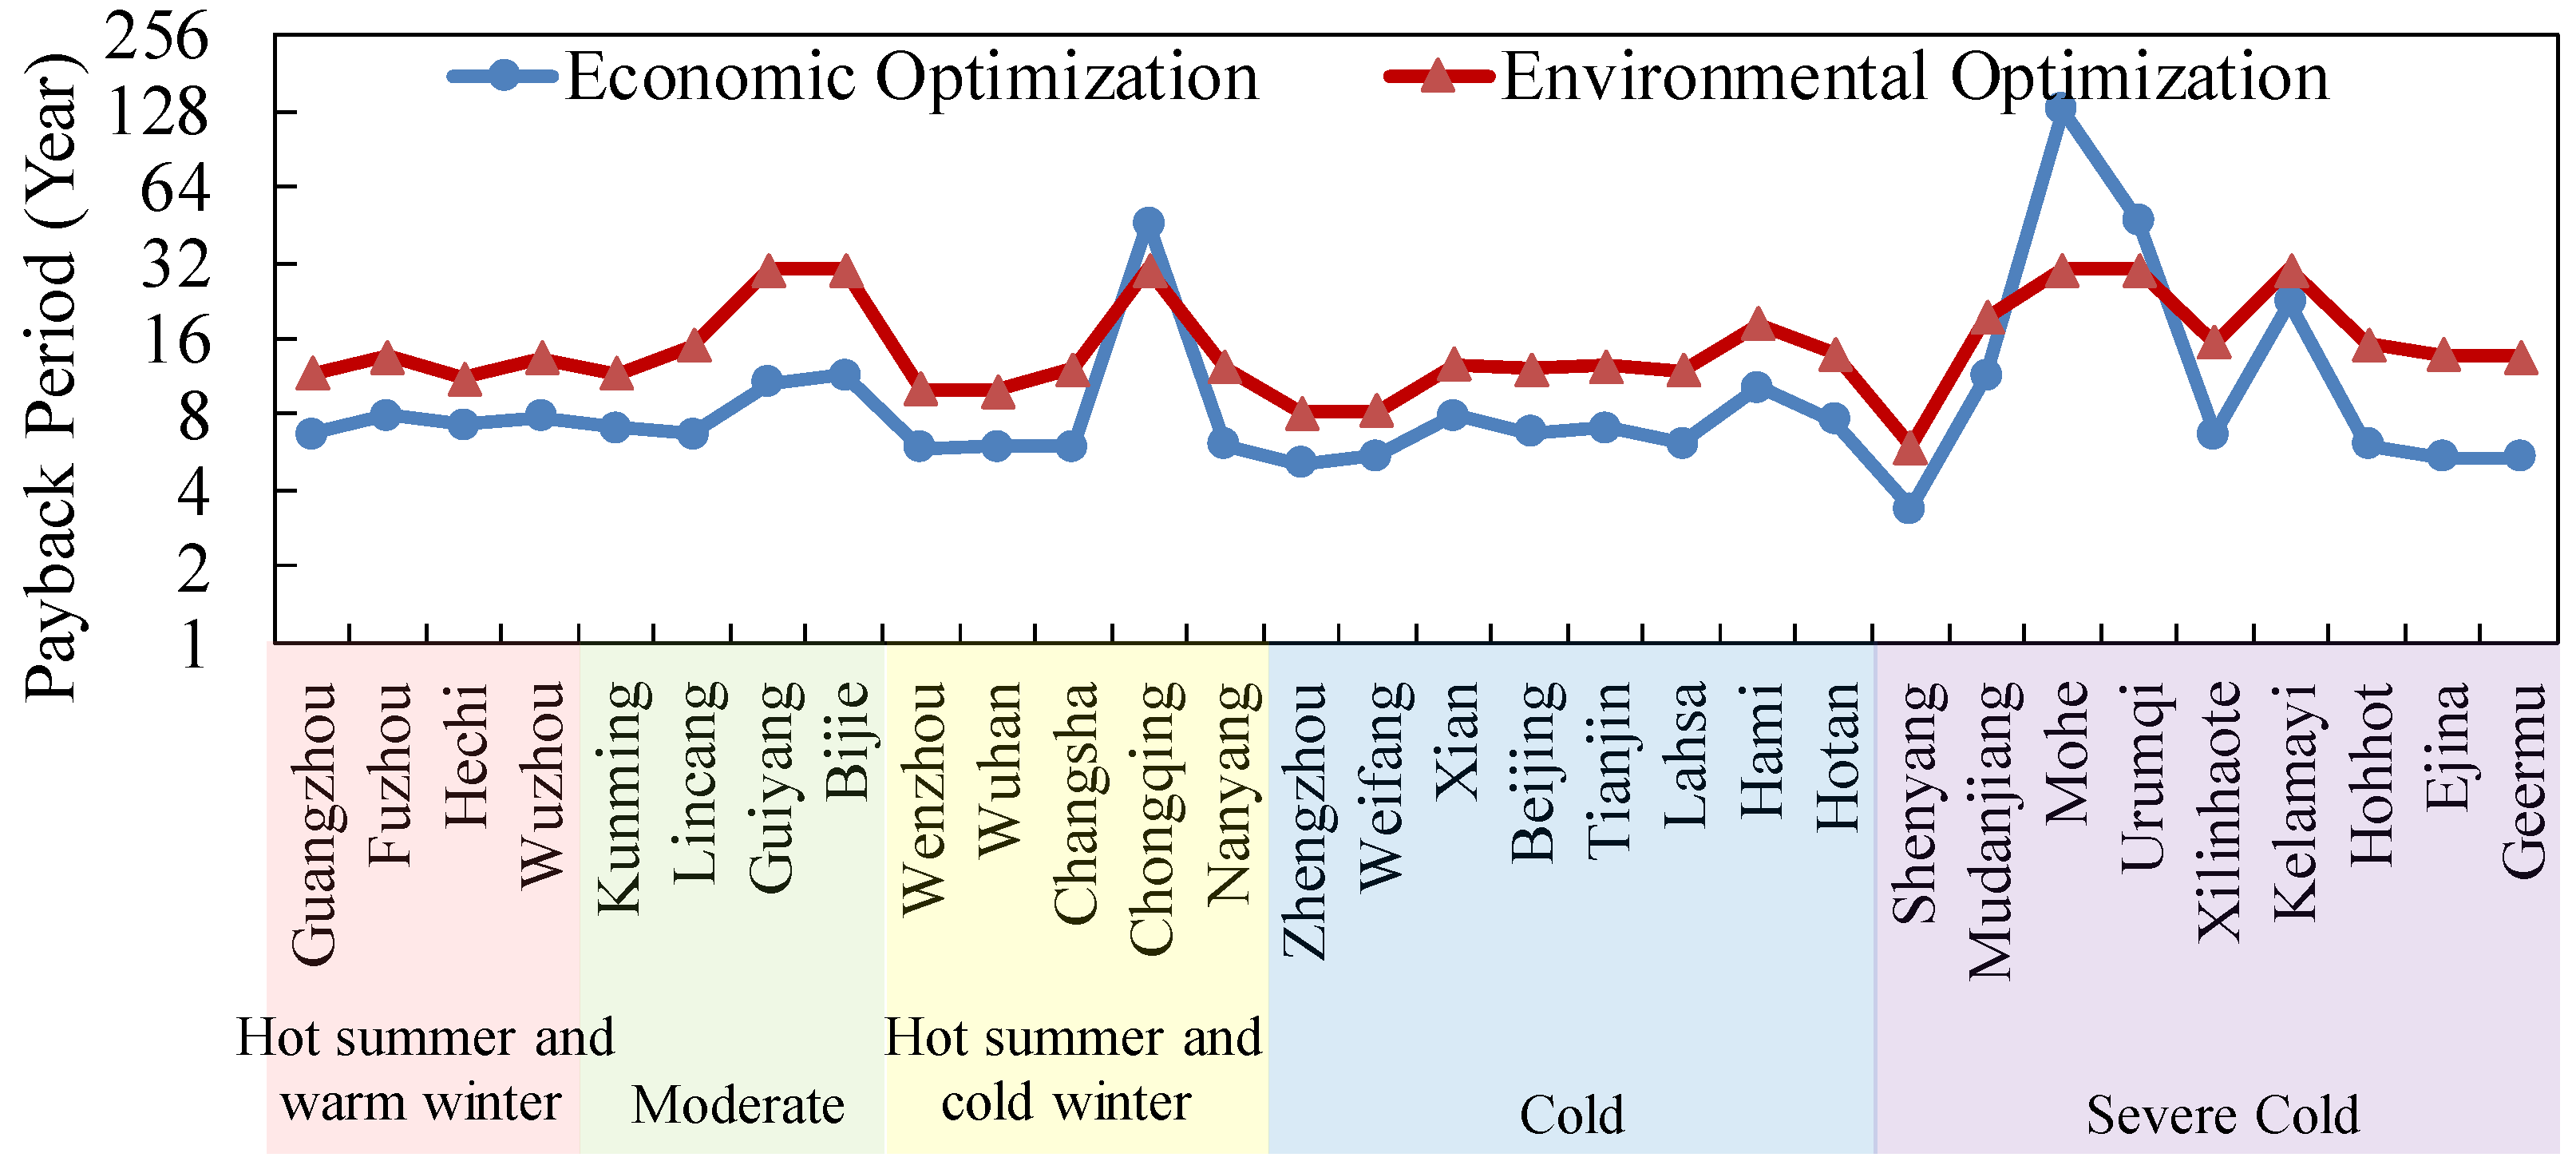
3.3. Economic Performance of the 100% RESs

The economic performances of the 100% RESs were assessed based on the total annual cost and payback period. The total annual costs of the 100% RESs under economic optimization and environmental optimization are shown in Figure 12. The total annual cost varied greatly between different regions. The 100% RES in Mohe had the highest total annual cost due to the higher heating need being supplied by biogas in winter. Lincang had the lowest total annual cost because the energy demand is low in this city. For the economic optimization, the total annual cost of the 100% RESs varied from 0.6 million CNY to 2.1 million CNY among different cities. For the environmental optimization, the total annual cost in different areas was higher and varied from 0.9 million CNY to 2.1 million CNY.
The payback period of each 100% RES was calculated in comparison with the traditional system, which relies on the grid and natural gas. The energy supply of conventional systems varied between different areas. For severe cold areas with high heating in winter and no cooling in summer, the power demand was met by the grid and the heating and hot water load was met by boilers using natural gas. In other areas, the conventional system depended on the grid to supply power for electric chillers or heat pumps to meet the cooling or heating loads, as well as the basic electricity loads. The hot water load was met by natural gas boilers. The payback periods of the 100% RESs under economic optimization and environmental optimization are shown in Figure 13. In severe cold areas, such as Mudanjiang and Mohe, the payback period was extremely high due to the high cost of heating. For cities where renewable energy is poor, such as Bijie and Chongqing, the payback periods of the 100% RESs were much longer than those in other cities of the same climate zone. The local energy markets also had a great impact on the payback period of the 100% RESs. For cities where the energy price is cheaper, such as Urumqi and Kelamayi, the payback period of the 100% RES was longer. For the economic optimization, the payback periods of the 100% RESs could be recovered within 8 years in most regions. It indicates that the 100% RESs can be a promising energy supply alternative for low-density residential communities in China. For the environmental optimization, the payback period was generally much higher compared with the economic optimization, which was over 8 years in most cities. This indicates that the 100% RESs designed based on the environmental optimization method were not feasible without any incentives, such as investment compensation or carbon tax.

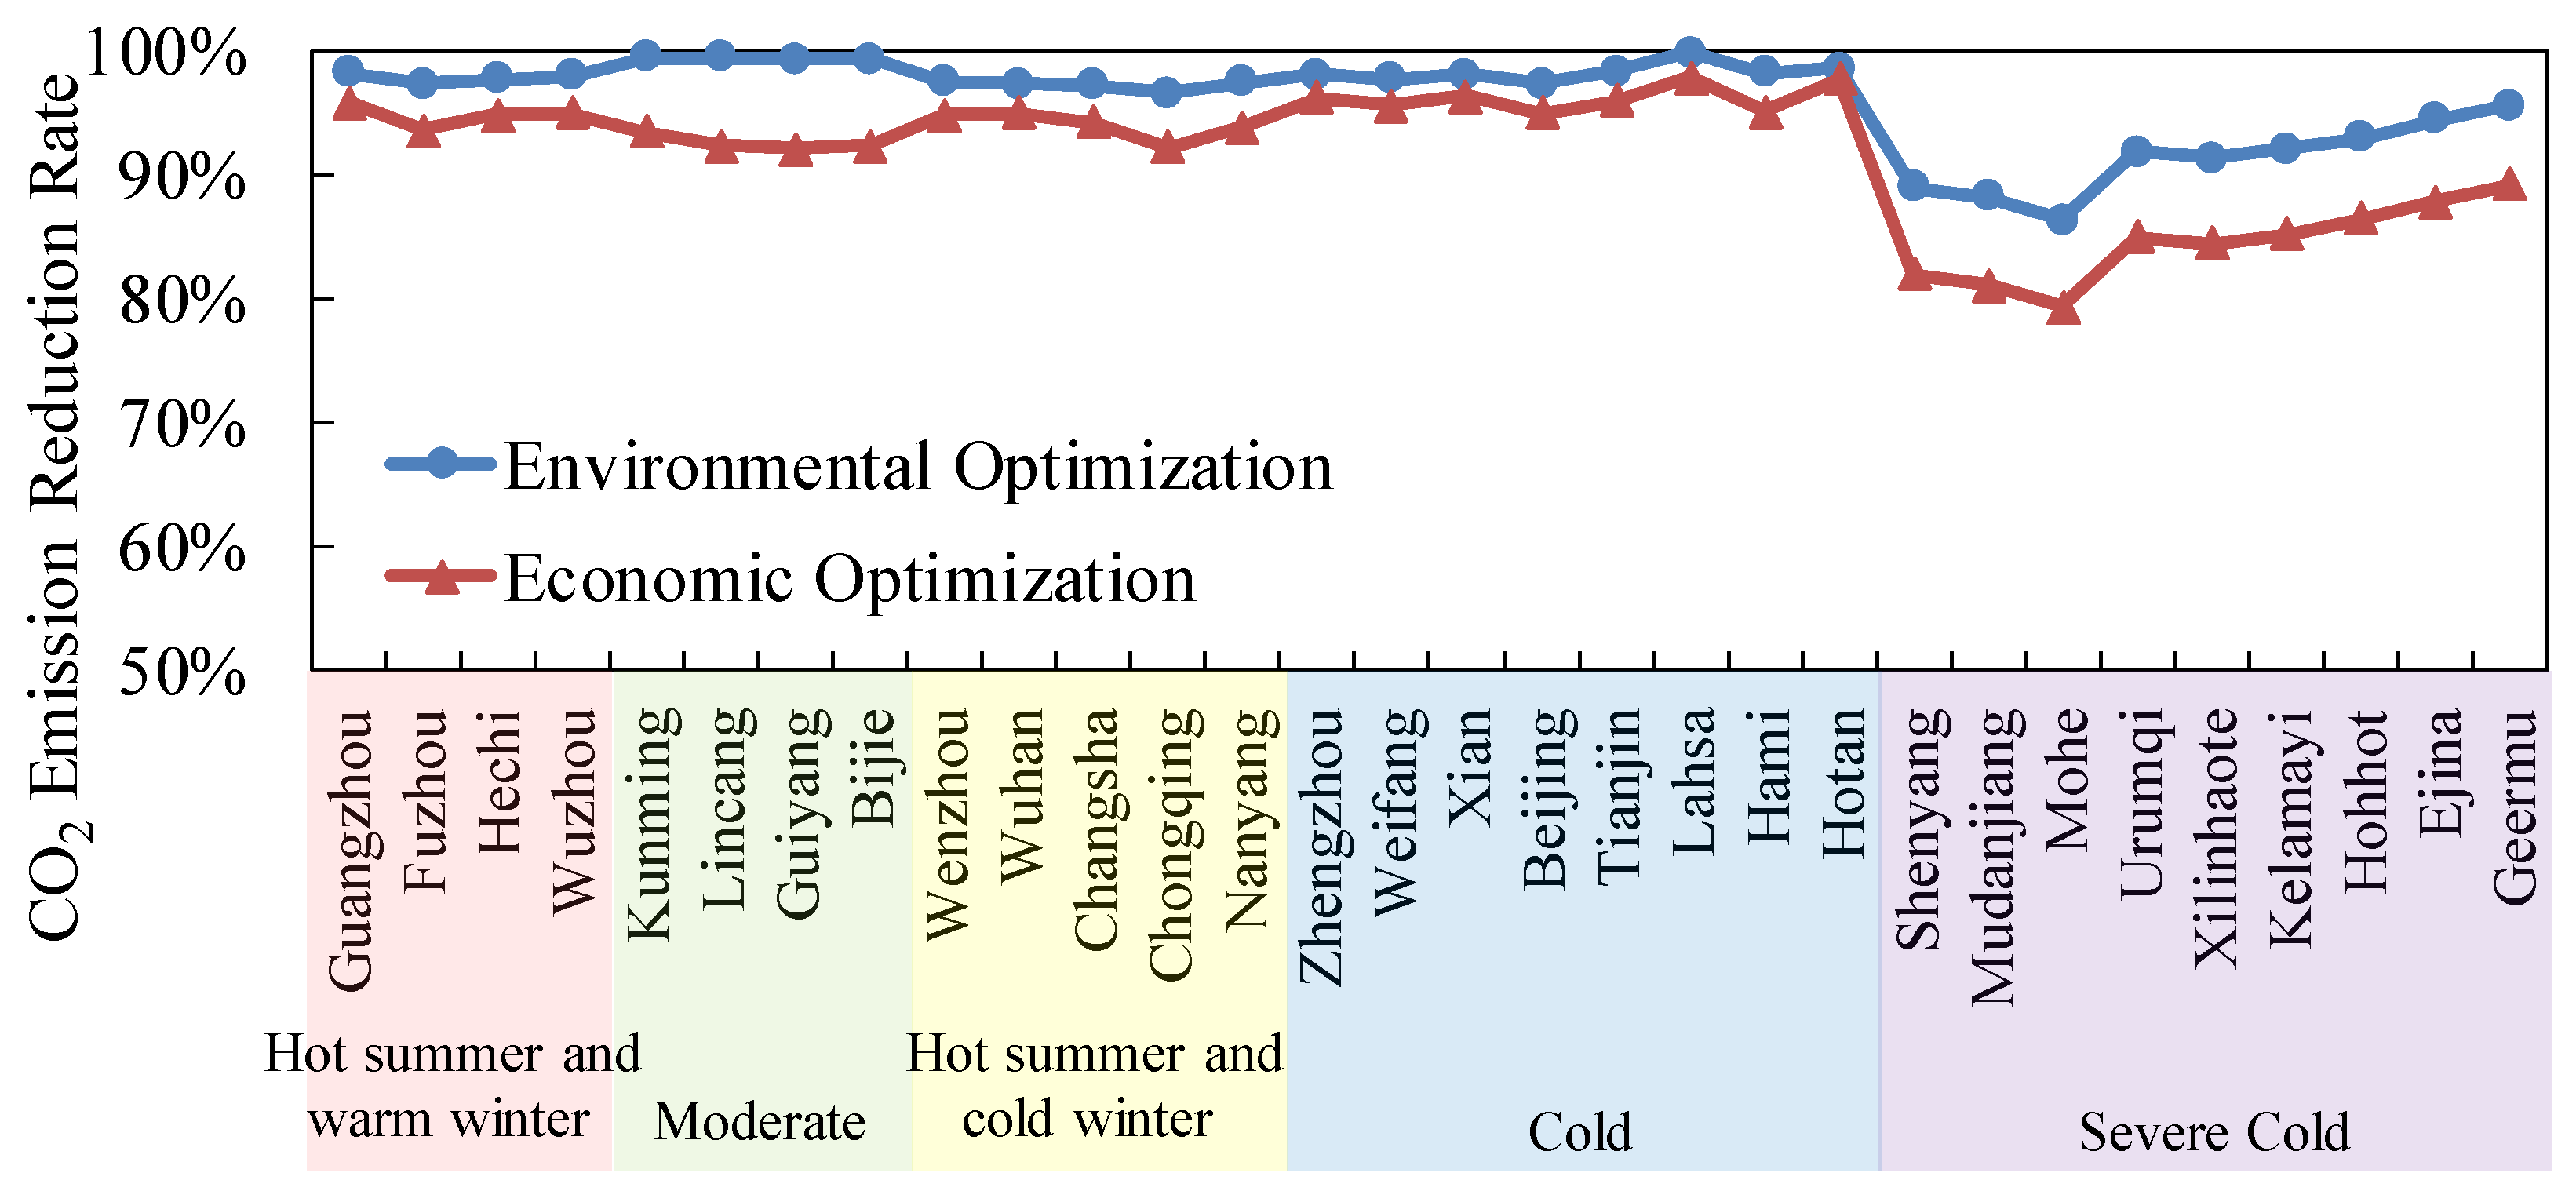
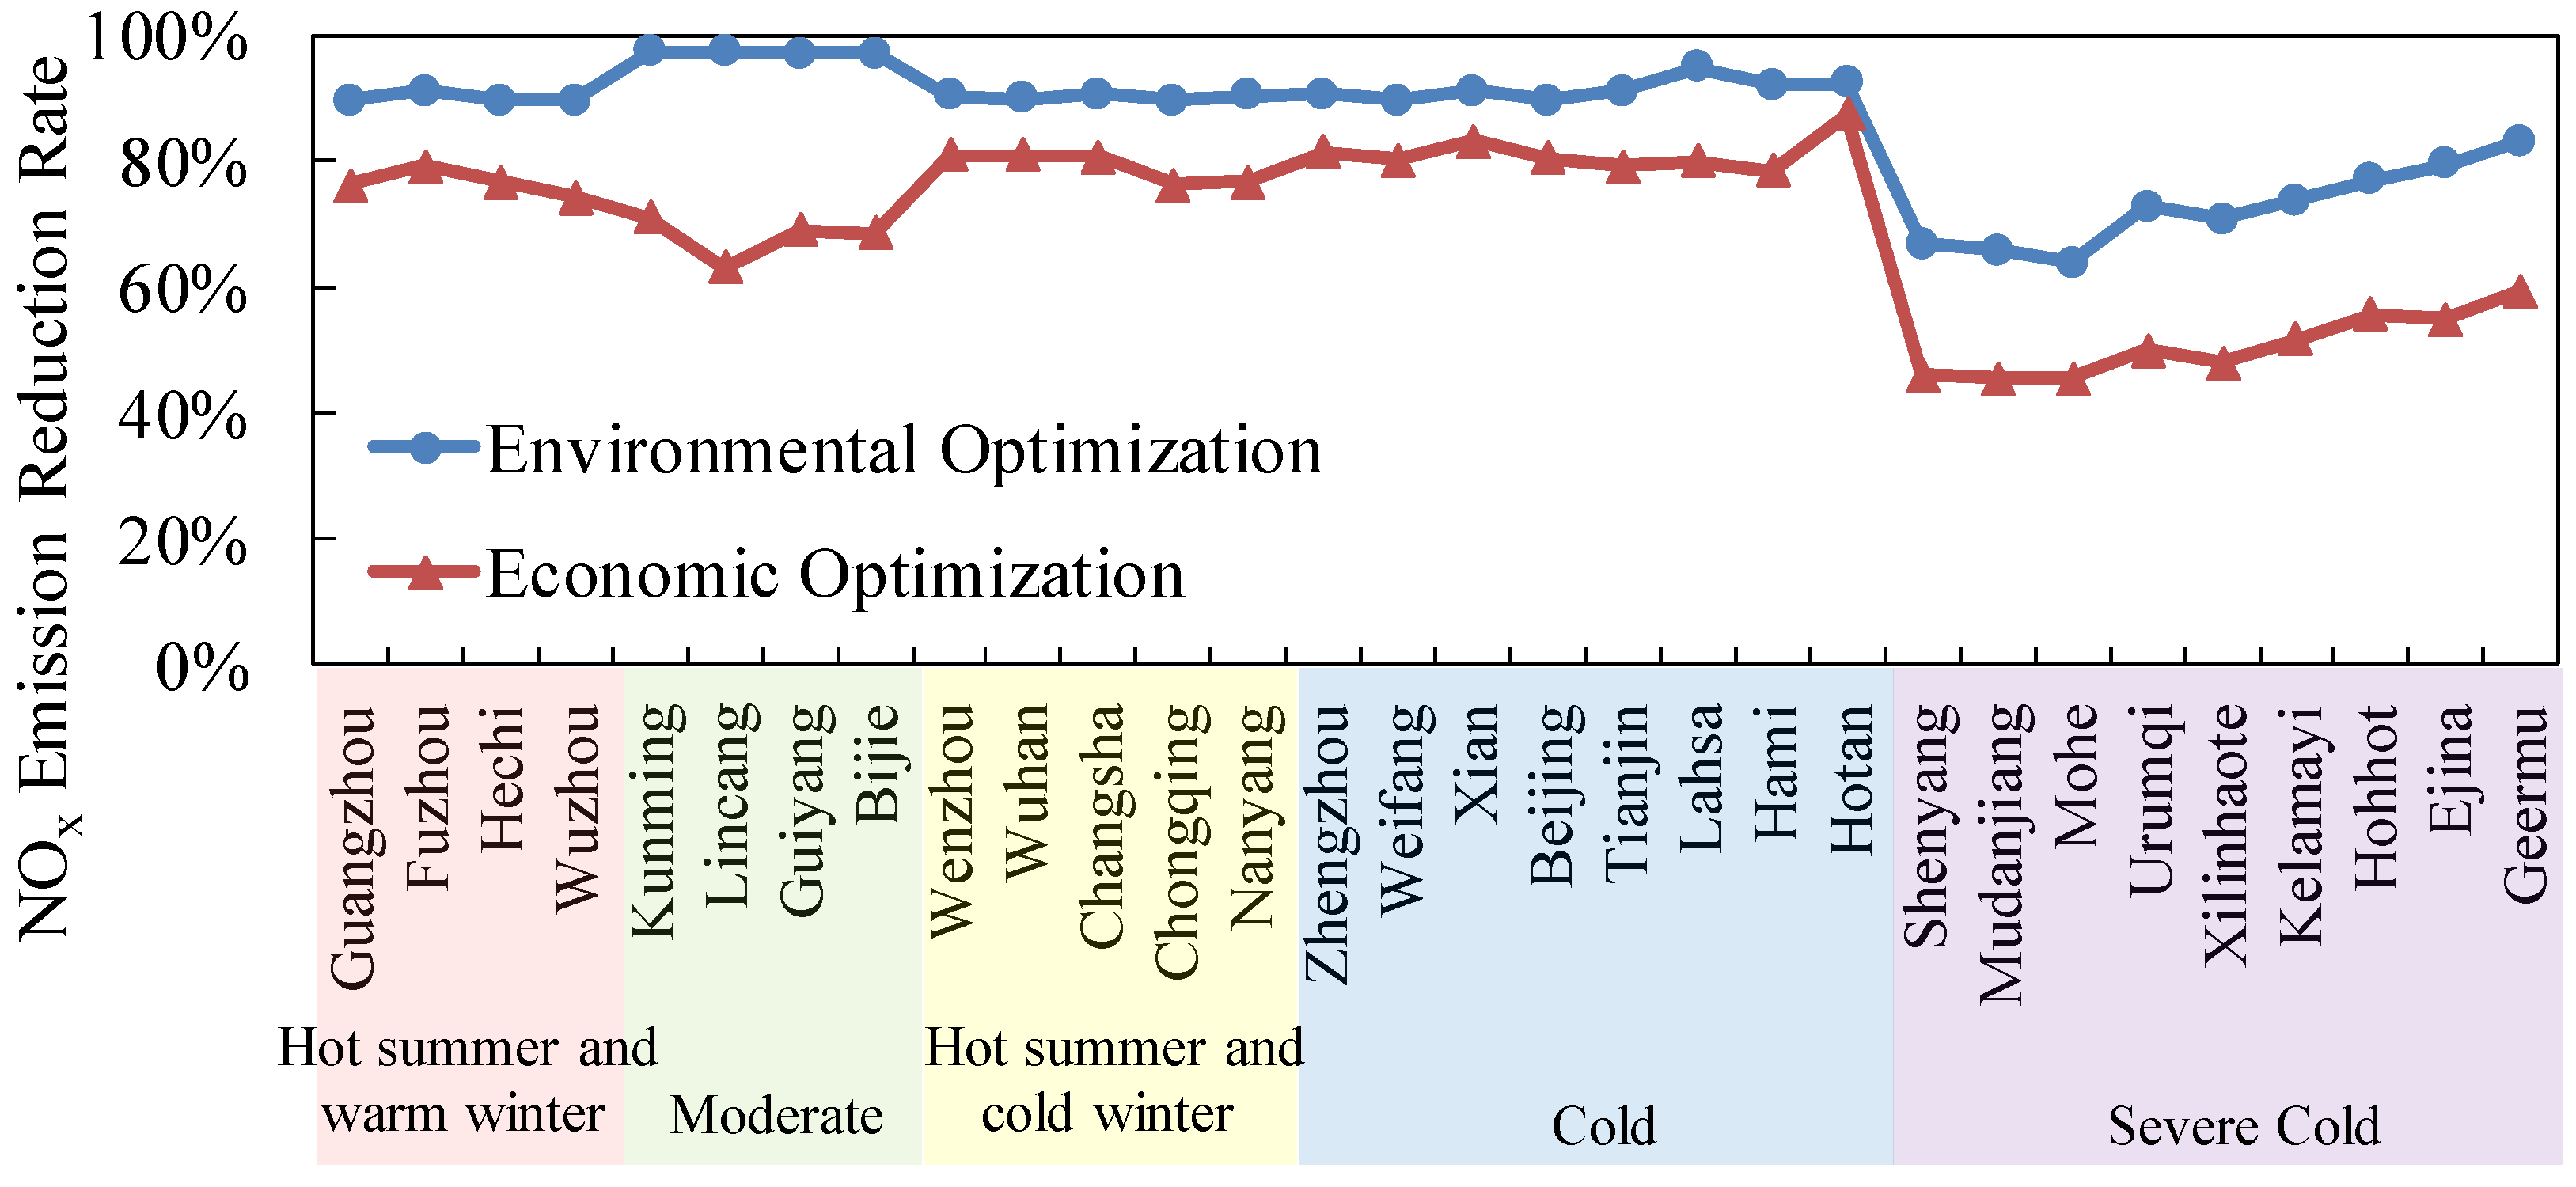
3.4. Environmental Performance of the 100% RESs

The 100% RESs can effectively reduce the emission of polluting gas, such as CO2 and NOx. The CO2 and NOx emission reduction rates of the 100% RES under economic optimization and environmental optimization are shown in Figure 14 and Figure 15. For cities in severe cold areas, such as Mohe and Mudanjiang, the emission reduction rates of CO2 and NOx were low due to a large amount of biogas burned for heating. Cites such as Kunming and Lincang had no cooling and heating loads, therefore the CO2 and NOx emission reduction rates were higher. For the environmental optimization, the CO2 and NOx emission reduction rates of the 100% RESs varied from 86–99% and 64–97%, respectively, in different regions. For the economic optimization, the emission reduction rates of CO2 and NOx were lower. The CO2 and NOx emission reduction rates of the 100% RESs varied from 79 to 97% and 45 to 88%, respectively, in different areas.

4. Discussion

The configuration, operation and performance of the 100% RESs under economic optimization and environmental optimization in different areas of China were analyzed in this study. The results show that the 100% RESs had good economic and environmental performance in most regions of China when the design optimization was based on economic performance. This conclusion was consistent with the results of the 100% RES in other countries. However, the performance in different regions varied significantly, which is relevant to the energy demand, the availability of renewable energy and local energy markets. The results in this study were obtained using a case study of a low-density residential community and the assumption that the biomass energy source was stable. Low-density residential communities had sufficient space to install PV panels or wind turbines and the users’ demand was low. Solar energy contributed a large percentage of the total supplied energy such that the economic performances of the 100% RESs were promising. For urban building areas with a high load density, the economic performance would decrease. The impacts of the load density will be considered in future research. In addition, the distribution of biomass is quite different in China. In this study, biomass was considered to be a stable source because biomass has various sources, such as forestry, agricultural, poultry and municipal solid waste, and its supply can be controlled compared with solar and wind energy. The system performance was analyzed based on biogas in this study; the results may differ between different types of biomass.

5. Conclusions

The 100% RESs could significantly reduce fossil energy consumption and pollution emissions. The economic and environmental performances of the 100% RESs in 30 typical areas of China were analyzed and compared. According to the analysis of the system configuration and performance, the following conclusions were obtained:
  • The 100% RESs for low-density residential communities in China were dominated by biomass and solar energy under current technical and economic conditions. Solar energy and biomass could account for over 95% of the energy supply in different regions.
  • When the 100% RESs were optimized based on either the economic or environmental performance, the electricity load of the 100% RES was mainly provided by PV/Ts and biomass generators. The heating demand was mainly met by boilers or heat pumps. The cooling demand was mainly satisfied by electric chillers or heat pumps. The 100% RESs that were optimized based on the environmental performance had a higher solar and wind energy utilization proportion compared with the economically optimal 100% RESs in China.
  • The use of 100% RESs for low-density residential communities was found to be feasible in most areas of China under economic optimization given the current energy markets and the assumption that the biomass energy source was stable. The payback period was less than 8 years. For the environmental optimization, the economic performances of the 100% RESs were poor, and many areas cannot recover the investment cost within 8 years.
  • The 100% RESs designed in this paper can effectively reduce the emissions of CO2 and NOx. For the environmental optimization, the 100% RESs can reduce the emissions of CO2 and NOx by 86–99% and 64–97%, respectively, in most areas of China, which was better compared with economic optimization (79–97% and 45–88%, respectively).
In general, 100% RESs serving low-density residential communities have good feasibility and advantages in most areas of China. The local energy market significantly affects the feasibility of 100% RES. Therefore, the local governments can implement incentives or policies to promote the application of 100% RESs to achieve carbon neutrality by 2050.

Author Contributions

Z.L.: conceptualization, methodology and funding acquisition; Y.C.: validation, data curation and visualization; J.Z.: resources, project administration and funding acquisition; Y.G.: formal analysis and validation; W.C.: data curation and investigation; X.C.: software, investigation and writing—original draft preparation; J.Y.: writing—review and editing and visualization; W.G.: investigation, writing—review and editing, validation and supervision. All authors have read and agreed to the published version of the manuscript.

Funding

This research was funded by the National Key Research and Development Project (no. 2018YFB1502900) and the National Natural Science Foundation of China (no. 51808238).

Data Availability Statement

The final combined dataset is available upon request.

Conflicts of Interest

The authors declare that they have no known competing financial interests or personal relationships that could have appeared to influence the work reported in this paper.

References

  1. Mathiesen, B.V.; Lund, H.; Connolly, D.; Wenzel, H.; Østergaard, P.A.; Möller, B.; Nielsen, S.; Ridjan, I.; Karnøe, P.; Sperling, K.; et al. Smart Energy Systems for coherent 100% renewable energy and transport solutions. Appl. Energy 2015, 145, 139–154. [Google Scholar] [CrossRef]
  2. Hansen, K.; Mathiesen, B.V.; Skov, I.R. Full energy system transition towards 100% renewable energy in Germany in 2050. Renew. Sust. Energ. Rev. 2019, 102, 1–13. [Google Scholar] [CrossRef]
  3. Lund, H.; Mathiesen, B.V. Energy system analysis of 100% renewable energy systems—The case of Denmark in years 2030 and 2050. Energy 2009, 34, 524–531. [Google Scholar] [CrossRef]
  4. Headley, A.J.; Copp, D.A. Energy storage sizing for grid compatibility of intermittent renewable resources: A California case study. Energy 2020, 198, 117310. [Google Scholar] [CrossRef]
  5. Feng, T.-T.; Li, R.; Zhang, H.-M.; Gong, X.-L.; Yang, Y.-S. Induction mechanism and optimization of tradable green certificates and carbon emission trading acting on electricity market in China. Resour. Conserv. Recycl. 2021, 169, 105487. [Google Scholar] [CrossRef]
  6. Hansen, K.; Breyer, C.; Lund, H. Status and perspectives on 100% renewable energy systems. Energy 2019, 175, 471–480. [Google Scholar] [CrossRef]
  7. Jägemann, C.; Fürsch, M.; Hagspiel, S.; Nagl, S. Decarbonizing Europe’s power sector by 2050—Analyzing the economic implications of alternative decarbonization pathways. Energy Econ. 2013, 40, 622–636. [Google Scholar] [CrossRef]
  8. Child, M.; Breyer, C. Vision and initial feasibility analysis of a recarbonised Finnish energy system for 2050. Renew. Sustain. Energy Rev. 2016, 66, 517–536. [Google Scholar] [CrossRef]
  9. Jacobson, M.Z.; Delucchi, M.A.; Bazouin, G.; Bauer, Z.A.F. 100% clean and renewable wind, water, and sunlight (WWS) all-sector energy roadmaps for the 50 United States. Energy Environ. Sci. 2015, 8, 2093–2117. [Google Scholar] [CrossRef]
  10. Oyewo, A.S.; Solomon, A.A.; Bogdanov, D.; Aghahosseini, A.; Mensah, T.N.O.; Ram, M.; Breyer, C. Just transition towards defossilised energy systems for developing economies: A case study of Ethiopia. Renew. Energy 2021, 176, 346–365. [Google Scholar] [CrossRef]
  11. Mensah, T.N.O.; Oyewo, A.S.; Breyer, C. The role of biomass in sub-Saharan Africa’s fully renewable power sector—The case of Ghana. Renew. Energy 2021, 173, 297–317. [Google Scholar] [CrossRef]
  12. Lopez, G.; Aghahosseini, A.; Bogdanov, D.; Mensah, T.N.O.; Ghorbani, N.; Caldera, U.; Prada Rivero, A.; Kissel, J.; Breyer, C. Pathway to a fully sustainable energy system for Bolivia across power, heat, and transport sectors by 2050. J. Clean. Prod. 2021, 293, 126195. [Google Scholar] [CrossRef]
  13. Azzuni, A.; Aghahosseini, A.; Ram, M.; Bogdanov, D.; Caldera, U.; Breyer, C. Energy security analysis for a 100% renewable energy transition in Jordan by 2050. Sustainability 2020, 12, 4921. [Google Scholar] [CrossRef]
  14. Ghorbani, N.; Aghahosseini, A.; Breyer, C. Assessment of a cost-optimal power system fully based on renewable energy for Iran by 2050—Achieving zero greenhouse gas emissions and overcoming the water crisis. Renew. Energy 2020, 146, 125–148. [Google Scholar] [CrossRef]
  15. He, C.; Jiang, K.; Chen, S.; Jiang, W.; Liu, J. Zero CO2 emissions for an ultra-large city by 2050: Case study for Beijing. Curr. Opin. Environ. Sustain. 2019, 36, 141–155. [Google Scholar] [CrossRef]
  16. Thellufsen, J.Z.; Lund, H.; Sorknæs, P.; Østergaard, P.A.; Chang, M.; Drysdale, D.; Nielsen, S.; Djørup, S.R.; Sperling, K. Smart energy cities in a 100% renewable energy context. Renew. Sust. Energ. Rev. 2020, 129, 109922. [Google Scholar] [CrossRef]
  17. Jacobson, M.Z.; Cameron, M.A.; Hennessy, E.M.; Petkov, I.; Meyer, C.B.; Gambhir, T.K.; Maki, A.T.; Pfleeger, K.; Clonts, H.; McEvoy, A.L.; et al. 100% clean and renewable Wind, Water, and Sunlight (WWS) all-sector energy roadmaps for 53 towns and cities in North America. Sustain. Cities Soc. 2018, 42, 22–37. [Google Scholar] [CrossRef]
  18. Ferreira, P.; Lopes, A.; Dranka, G.G.; Cunha, J. Planning for a 100% renewable energy system for the Santiago Island, Cape Verde. Int. J. Sustain. Energy Plan. Manag. 2020, 29, 25–40. [Google Scholar] [CrossRef]
  19. Meschede, H.; Hesselbach, J.; Child, M.; Breyer, C. On the impact of probabilistic weather data on the economically optimal design of renewable energy systems—A case study of la gomera island. Int. J. Sustain. Energy Plan. Manag. 2019, 23, 15–26. [Google Scholar] [CrossRef]
  20. Islam, M.S.; Das, B.K.; Das, P.; Rahaman, M.H. Techno-economic optimization of a zero emission energy system for a coastal community in Newfoundland, Canada. Energy 2021, 220, 119709. [Google Scholar] [CrossRef]
  21. Sokolnikova, P.; Lombardi, P.; Arendarski, B.; Suslov, K.; Pantaleo, A.M.; Kranhold, M.; Komarnicki, P. Net-zero multi-energy systems for Siberian rural communities: A methodology to size thermal and electric storage units. Renew. Energy 2020, 155, 979–989. [Google Scholar] [CrossRef]
  22. Liu, W.; Lund, H.; Mathiesen, B.V.; Zhang, X. Potential of renewable energy systems in China. Appl. Energy 2011, 88, 518–525. [Google Scholar] [CrossRef] [Green Version]
  23. Lugovoy, O.; Gao, S.; Gao, J.; Jiang, K. Feasibility study of China’s electric power sector transition to zero emissions by 2050. Energy Econ. 2021, 96, 105176. [Google Scholar] [CrossRef]
  24. Burandt, T.; Xiong, B.; Löffler, K.; Oei, P.-Y. Decarbonizing China’s energy system—Modeling the transformation of the electricity, transportation, heat, and industrial sectors. Appl. Energy 2019, 255, 113820. [Google Scholar] [CrossRef]
  25. Huber, M.; Weissbart, C. On the optimal mix of wind and solar generation in the future Chinese power system. Energy 2015, 90, 235–243. [Google Scholar] [CrossRef]
  26. Bogdanov, D.; Breyer, C. North-East Asian Super Grid for 100% renewable energy supply: Optimal mix of energy technologies for electricity, gas and heat supply options. Energy Convers. Manag. 2016, 112, 176–190. [Google Scholar] [CrossRef]
  27. Liu, H.; Andresen, G.B.; Greiner, M. Cost-optimal design of a simplified highly renewable Chinese electricity network. Energy 2018, 147, 534–546. [Google Scholar] [CrossRef] [Green Version]
  28. Chen, X.; Xiao, J.; Yuan, J.; Xiao, Z.; Gang, W. Application and performance analysis of 100% renewable energy systems serving low-density communities. Renew. Energy 2021, 176, 433–446. [Google Scholar] [CrossRef]
  29. MOHURD. Code for Building Climate Zone Division; MOHURD: Beijing, China, 1994; Volume GB 50178-93. [Google Scholar]
  30. Online Map of Biomass Energy Distribution in China. Available online: https://www.osgeo.cn/map/m2e35 (accessed on 22 February 2020).
  31. Online Map of Solar Energy Distribution in China. Available online: https://www.osgeo.cn/map/ma381 (accessed on 22 February 2020).
  32. China, O. Online Distribution of Wind Energy Resources in China. Available online: https://www.osgeo.cn/map/m60b8 (accessed on 22 February 2020).
  33. Tsinghua University. DesT. Available online: https://www.dest.net.cn/ (accessed on 1 September 2021).
  34. MOHURD. Code for Planning of Urban Electric Power; MOHURD: Beijing, China, 2014; Volume GB/T 50293-2014. [Google Scholar]
  35. MOHURD. Code for Thermal Design of Civil Building; MOHURD: Beijing, China, 2016; Volume GB 50176-2016. [Google Scholar]
  36. Zhang, B.; Cai, L. Simultaneous coefficient of set of residential air conditioning load calculation. Build. Energy Environ. 1999, 1, 14–17. [Google Scholar]
  37. Yuan, J.; Xiao, Z.; Zhang, C.; Gang, W. A control strategy for distributed energy system considering the state of thermal energy storage. Sustain. Cities Soc. 2020, 63, 102492. [Google Scholar] [CrossRef]
  38. Mago, P.J.; Chamra, L.M. Analysis and optimization of CCHP systems based on energy, economical, and environmental considerations. Energy Build. 2009, 41, 1099–1106. [Google Scholar] [CrossRef]
  39. Feng, L.; Dai, X.; Mo, J.; Ma, Y.; Shi, L. Analysis of energy matching performance between CCHP systems and users based on different operation strategies. Energy Convers. Manag. 2019, 182, 60–71. [Google Scholar] [CrossRef]
  40. Chen, H.; Li, Z.; Xu, Y. Evaluation and comparison of solar tri-generation systems based on photovoltaic thermal collectors for subtropical climates. Energy Convers. Manag. 2019, 199, 111959. [Google Scholar] [CrossRef]
  41. Yona, A.; Senjyu, T.; Funabashi, T. Application of Recurrent Neural Network to Short-Term-Ahead Generating Power Forecasting for Photovoltaic System. In Proceedings of the Power Engineering Society General Meeting, Tampa, FL, USA, 24–28 June 2007. [Google Scholar]
  42. Wang, W. Research on Optimization of Multi-Energy Complementary Distributed Energy System. Master’s Thesis, North China Electric Power University, Beijing, China, 2019. [Google Scholar]
  43. Sorgulu, F.; Dincer, I. Development and assessment of a biomass-based cogeneration system with desalination. Appl. Therm. Eng. 2021, 185, 116432. [Google Scholar] [CrossRef]
  44. Zhao, P.; Wang, J.; Dai, Y. Capacity allocation of a hybrid energy storage system for power system peak shaving at high wind power penetration level. Renew. Energy 2015, 75, 541–549. [Google Scholar] [CrossRef]
  45. Zhang, Y.; Akkurt, N.; Yuan, J.; Xiao, Z.; Wang, Q.; Gang, W. Study on model uncertainty of water source heat pump and impact on decision making. Energy Build. 2020, 216, 109950. [Google Scholar] [CrossRef]
  46. Xingjie, R.; Yuezhou, L. Design of a Two-Stage Intergal Chiller for the Cogeberation System. Energy Res. Inf. 1999, 14, 24–29. [Google Scholar]
  47. Yuan, J.; Cui, C.; Xiao, Z.; Zhang, C.; Gang, W. Performance analysis of thermal energy storage in distributed energy system under different load profiles. Energy Convers. Manag. 2020, 208, 112596. [Google Scholar] [CrossRef]
  48. Li, B.; Miao, H.; Li, J. Multiple hydrogen-based hybrid storage systems operation for microgrids: A combined TOPSIS and model predictive control methodology. Appl. Energy 2021, 283, 116303. [Google Scholar] [CrossRef]
  49. Holland, J.H. Adaptation in Natural and Artificial Systems; MIT Press: Cambridge, MA, USA, 1992. [Google Scholar]
  50. Zeng, R.; Li, H.; Jiang, R.; Liu, L.; Zhang, G. A novel multi-objective optimization method for CCHP–GSHP coupling systems. Energy Build. 2016, 112, 149–158. [Google Scholar] [CrossRef]
  51. Barbieri, E.S.; Dai, Y.J.; Morini, M.; Pinelli, M.; Spina, P.R.; Sun, P.; Wang, R.Z. Optimal sizing of a multi-source energy plant for power heat and cooling generation. Appl. Therm. Eng. 2014, 71, 736–750. [Google Scholar] [CrossRef]
Figure 1. Schematic diagram of a 100% renewable energy system.
Sustainability 13 10590 g001
Figure 2. Building climate zones (top), solar (left) and wind energy (right) distributions in China.
Sustainability 13 10590 g002
Figure 3. The annual cooling and heating loads of typical areas.
Sustainability 13 10590 g003
Figure 4. The framework of the 100% RES in this study.
Sustainability 13 10590 g004
Figure 5. The process of the GA.
Sustainability 13 10590 g005
Figure 6. The subsystem capacities of the electricity cycles of 100% RESs under economic optimization and environmental optimization: (a) biomass generator capacity of the 100% RESs; (b) PV/T capacities of the 100% RESs; (c) wind turbine capacities of the 100% RESs.
Sustainability 13 10590 g006aSustainability 13 10590 g006b
Figure 7. The subsystem capacities of the cooling cycles of the 100% RESs under economic optimization and environmental optimization: (a) electric chiller capacities of the 100% RESs; (b) heat pump capacities of the 100% RESs; (c) absorption chiller capacities of the 100% RESs.
Sustainability 13 10590 g007
Figure 8. The heating subsystem capacities of the 100% RESs under economic optimization and environmental optimization: (a) biomass boiler capacities of the 100% RESs; (b) waste heat boiler capacities of the 100% RESs.
Sustainability 13 10590 g008
Figure 9. Electricity supply breakdown of the 100% RESs under economic optimization and environmental optimization: (a) biomass generator supply breakdown of the 100% RESs; (b) PV/T supply breakdown of the 100% RESs; (c) wind turbine supply breakdown of the 100% RESs.
Sustainability 13 10590 g009
Figure 10. Cooling supply breakdown of the 100% RESs under economic optimization and environmental optimization: (a) electric chiller supply breakdown of the 100% RESs; (b) heat pump supply breakdown of the 100% RESs; (c) absorption chiller supply breakdown of the 100% RESs.
Sustainability 13 10590 g010aSustainability 13 10590 g010b
Figure 11. Heating supply breakdown of 100% RESs under economic optimization and environmental optimization: (a) biomass boiler supply breakdown of the 100% RESs; (b) heat pump supply breakdown of the 100% RESs; (c) PV/T heat supply breakdown of the 100% RESs; (d) waste heat boiler supply breakdown of the 100% RESs.
Sustainability 13 10590 g011aSustainability 13 10590 g011b
Figure 12. The total annual cost of 100% RESs under economic optimization and environmental optimization.
Sustainability 13 10590 g012
Figure 13. The payback period of the 100% RESs under economic optimization and environmental optimization.
Sustainability 13 10590 g013
Figure 14. The CO2 emission reduction rates of the 100% RESs under economic optimization and environmental optimization.
Sustainability 13 10590 g014
Figure 15. The NOx emission reduction rates of the 100% RESs under economic optimization and environmental optimization.
Sustainability 13 10590 g015
Table 1. The selection of typical cities and local energy market conditions.
Climate ZoneWind EnergySolar EnergyTypical CityElectric TariffNatural Gas Price
(CNY/kWh)(USD/kWh)(CNY/m3)(USD/m3)
Severe coldAbundantAbundantEjina0.4850.0751.820.282
Relatively abundantXilinhot0.4850.0751.820.282
AvailableMudanjiang0.510.0792.80.434
Relatively abundantAbundantHohhot0.4850.0751.820.282
Relatively abundantKalamayi0.390.0601.370.212
AvailableShenyang0.50.0782.950.457
AvailableAbundantGeermu0.370.0571.60.248
Relatively abundantUrumqi0.390.0601.370.212
AvailableMohe0.510.0792.80.434
ColdRelatively abundantAbundantHami0.390.0601.370.212
Relatively abundantBeijing0.480.0742.280.353
AvailableWeifang0.550.08530.465
AvailableAbundantHotan0.390.0601.370.212
Relatively abundantTianjin0.490.0762.40.372
AvailableZhengzhou0.560.0872.250.349
PoorAbundantLahsa0.370.0571.20.186
AvailableXian0.490.0761.980.307
Hot summer and cold winterRelatively abundantAvailableWenzhou0.540.0843.10.481
AvailableAvailableWuhan0.560.0872.530.392
PoorChangsha0.590.0912.450.380
PoorAvailableNanyang0.560.0872.250.349
PoorChongqing0.520.0811.720.267
Hot summer and warm winterRelatively abundantAvailableFuzhou0.50.0782.860.443
AvailableAvailableWuzhou0.530.0823.220.499
PoorAvailableGuangzhou0.530.0823.220.499
PoorHechi0.530.0823.220.499
ModerateAvailableRelatively abundantKunming0.450.0703.310.513
AvailableBijie0.450.0703.050.473
PoorAvailableLincang0.450.0703.310.513
PoorGuiyang0.450.0703.050.473
Table 2. Economic parameters and coefficients of components used in this study.
DeviceCostCoefficient
PowerCoolingHeatingHot Water
Wind turbine1800 CNY/unit(279 USD/unit)
PV/T2400 CNY/m2(372 USD/m2) η pv ,   power 0.16 η pv ,   thermal 0.45
Battery2400 CNY/kWh(372 USD/kWh)
Generator9000 CNY/kW(1395 USD/kW) η generator 0.4 η wh 0.3 η water 0.2
Absorption chiller2000 CNY/kW(310 USD/kW) COP ab 1.1
Water tank400 CNY/kW(62 USD/kW)
Electric chiller1400 CNY/kW(217 USD/kW) COP ch 4.5
Heat pump2000 CNY/kW(310 USD/kW) COP hp , c 3.3 COP hp , h 3.3
Boiler800 CNY/kW(124 USD/kW) η boiler 0.9
Biogas0.35 CNY/kWh(0.054 USD/kWh)
Publisher’s Note: MDPI stays neutral with regard to jurisdictional claims in published maps and institutional affiliations.

