Abstract
The improper illumination of cultural heritage buildings and monuments can be a source of enormous light pollution, which can have a major impact on the overall environment of the illuminated area. Such lighting can be the result of carelessness or a poorly designed lighting system. This paper presents one of the methodologies that can significantly reduce light pollution, especially spilt light out of building façades. The methodology is based on using luminaires with specially made shutters and an appropriate silhouette of the object. The shutters are designed with the help of photos of the object and the location’s sizes measured. The methodology was tested during the renovation of the lighting systems of different churches in Slovenia and is described using the example of the Church of St. Thomas near Ptuj, Slovenia (N 46°28.9554′, E 16°0.7416′). The results show that the methodology is effective and can significantly reduce light pollution that occurs when such buildings are incorrectly lit.
1. Introduction
In Slovenia, as elsewhere in Europe [1], it is a common practice to illuminate the exterior of cultural heritage buildings at night. Floodlights directed upward (Figure 1) with wide beam angles are usually chosen for this purpose [2,3,4] and this practice is a significant source of light pollution within the surrounding area [2]. Current lighting designs using powerful unshielded luminaires present two sources of light pollution. The first one is stray light, which is a luminous flux that does not reach the illuminated object and is lost in the sky. Up to 85% of luminous flux can be lost in space with the use of the current lighting method [5]. The second source of light pollution is the high luminance values of illuminated surfaces. The illuminated surfaces, which are often bright colours, reflect at least half of the light upwards. With the measurements taken by [2], it was proven that luminance values can reach 10 cd/m2. The upper limit in Slovenia is 1 cd/m2.
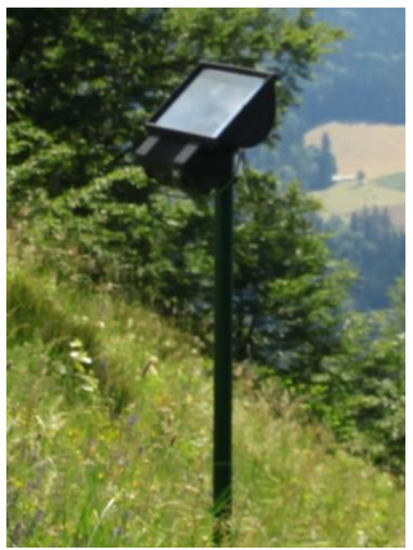
Figure 1.
Upward directed 400 W HID floodlight—a typical lighting solution.
Light pollution is a by-product of industrial civilization and it causes health problems, disturbs ecosystems, wastes energy, and interferes with astronomical observations. It is mainly caused by the mass use of unshielded luminaires, which are used in various lighting applications. Such luminaires emit a significant amount of luminous flux into the sky, unlike shielded luminaires, which limit light only to the areas where illumination is needed [2].
One of the consequences of light pollution is the negative impact it has on mammal animals [6,7], insects [8,9] and human health. Studies have shown a link between light pollution, disturbed human biorhythms, and increased numbers of patients with certain cancers, particularly breast and colon cancer [10,11]. It is shown that the proportion of patients with direct exposure to artificial light from unsuitable lighting systems is higher if they are exposed to it during typical sleep times and/or when working night shifts.
The first lights that humans began to use after the invention of the incandescent light bulb in 1879 did not have such pronounced negative effects because they were low wattage and the light emitted was warm, with virtually no emission of the blue part of the light spectrum. As lighting technology evolved, brighter light sources were developed that emitted light enriched with the blue part of the spectrum (cold white). Blue light has a strong influence on the function of the pineal gland, which regulates sleep, and the production of the protective hormone melatonin [10,12,13,14], which is highest between 12:00 a.m. and 4:00 a.m. When we are awake or under the influence of artificial light, production of the sleep hormone is greatly reduced, which decreases the body’s protection against the formation of cancer cells [15].
Light pollution has harmful effects on many species of animals and, thus, damages ecosystems. The effects of light pollution include the loss of orientation due to attraction or repulsion, as well as negative changes in feeding, migration, and reproduction, especially in nocturnal bats and some birds. Light pollution affects not only nocturnal animals but also phototactic animals, such as butterflies, beetles, and most insects [15,16].
When considering light sources, we must not forget about photobiological safety [17]. Photobiological safety describes the side effects of light on human tissues, especially on the skin and eyes. The effects of light depend on the type of tissue, the radiation spectrum, the intensity of the radiation, and the time of the exposure. LED light sources, which are extremely small and have very high luminance values, can have negative effects on the eyes. Luminaires used to illuminate cultural heritage buildings are usually installed on high poles or adjacent buildings. Because they are additionally shaded with shutters, it is practically impossible to look directly at light source, or the distance between the observer and the lamp is so great that the lamp does not pose a risk. Light sources of warm white light (3000 K or less) have a small proportion of blue light and therefore do not cause blue light hazard. Due to all these characteristics, the luminaires used belong to Risk Group 0.
An additional negative effect of light pollution is that it affects our ability to study the sky and celestial bodies in two ways. The first is that all unshielded light sources that emit light in any direction directly into the atmosphere cause the sky to glow, much like the sun does during the day. At night, the glow of the sky caused by improper lighting reduces the contrast between stars, galaxies, and the sky itself, making it more difficult to see less bright bodies. Another effect of light pollution is noticeable when astronomers measure the colour spectra of observed bodies. Each line of the spectrum is a clear indicator of the presence of a particular chemical element. By examining the strength of the coloured lines, astronomers can determine the chemical composition, temperature, and rate of motion of an observed body. As such, spectroscopy is one of the most effective tools for astronomers, but light pollution can directly affect the results of spectroradiometers [18].
In the days of low-pressure sodium lamps, it was easy to filter out skyglow from light pollution because these lamps were monochromatic with only two lines in the spectrum (589.0 and 589.6 nm). However, in the days of HID lamps and LEDs with broadband spectra, it is virtually impossible to remove the skyglow caused by light pollution from nighttime images or spectral scans.
Light pollution is the portion of emitted luminous flux that does not fall upon the desired surface, wasting energy and financial resources. According to a study on the impact of light pollution regulation on the renovation of street lighting in Slovenia [19,20], which covered 29% of all municipalities with a total of almost 50% of the country’s population, it was found that in 2015, the annual electrical energy consumption per capita was too high in 36% of municipalities, which was about 50% higher, on average, than the permitted amount of annual electrical energy consumption per capita according to the regulation. The light pollution decree in Slovenia defines the maximum value of energy consumption for municipality roads at 44.5 kWh per capita per year and for state roads at 5.5 kWh per capita per year. The use of more economical luminaires and luminaires with the possibility of reducing their luminous flux (dimming) could lead to energy savings in public lighting and a significant reduction in light pollution.
In Slovenia, where the population is less than 2 million, there are nearly 2000 churches [21] and other cultural heritage buildings. Because of this, the use of a more environmentally friendly and economical type of luminaire would help to reduce light pollution and costs for the illumination of the façades of cultural heritage buildings and monuments. Chip-on-board (COB) light-emitting diode (LED) technology is relatively new to the market and is offered as an alternative to HID lamps (high-intensity discharge lamps) for indoor and outdoor lighting. The main purpose of the work presented in this paper was to develop and test a luminaire with a shutter as part of the design of an exterior lighting system for the façade lighting of cultural heritage buildings. A similar solution was also presented in [2], but no explanations were given on the mask design and no measurements of stray luminous flux were performed or calculated. The shutter presented was developed based on photographs of the object for which we designed the lighting. This paper provides details about the method of defining the size of the object silhouette on the shutter using sizes measured on-site and a practical method of production using the software that was used. In summary, the field results of the developed luminaires with shutters for the outdoor lighting of heritage buildings using the described methods are presented. Finally, the conformity of the presented approach with the legislation is demonstrated by a simulation. In this last step, a 3D model of the considered church and high precision photometric data of individual luminaires with a shutter was used to simulate the functionality and environmental impact of the refurbished lighting.
2. Materials and Methods
For the appropriate design of the church lighting, we combined two solutions—the use of COB technology and the design of appropriate shutters, shaped in the silhouette of the church.
2.1. COB Technology
Light sources based on the COB LED principle represent an alternative to the more widespread metal halide and high-pressure sodium lamps in headlamps or reflectors. LED technology has existed for more than 60 years. LEDs emit light when a current flows through a semiconductor. Over time, the use of this type of lighting has greatly expanded, especially in the field of interior lighting. However, since the principal technology of LEDs does not allow the luminous flux of a single diode to be increased to the point where a small number of diodes would be sufficient for outdoor lighting applications, technologies have been developed to bundle a large number of LEDs or modules. A comparison of LED array packing densities is shown in Figure 2. Currently, DIP (dual-in-line package), SMD (surface mount device), and COB (chip-on-board) configurations are used [22].
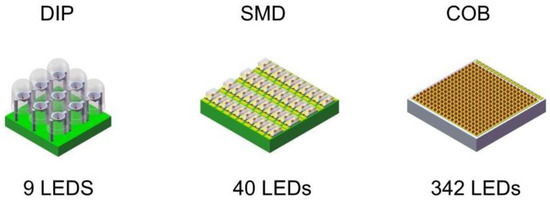
Figure 2.
Comparison of LED array packing densities Reprinted from ref. [22].
COB technology is very similar to SMD technology in that both contain multiple diodes on a single chip. One of the differences between these two technologies is the simplicity of COB technology, as COB devices require only one circuit and two contacts, regardless of the number of diodes. An advantage of COB technology is also the lumens per watt ratio, which is much higher than the ratios of the other two technologies. Alternatively, using COB LED technology can greatly reduce the footprint and energy consumption of the LED array while maintaining the same light output [9,22,23].
2.2. Shutter Development
In this section, the shutter and silhouette design process is presented. The entire process consisted of the following steps: On-site measurements, shutter sizing, taking a photo of the object with a camera, calculating the silhouette reference height, calibrating the camera, and designing the silhouette with a CAD model. The entire shutter design process flowchart is shown in Figure 3. As it can be seen, there are two ways to design the shutter with the silhouette. The camera that is used for taking the photos of the object must be first calibrated with the shutter size and silhouette calculation (Figure 3). When the camera is calibrated, the silhouette size can be defined directly from photos and no further calculations are needed (Figure 4).

Figure 3.
Shutter design process flowchart showing the calibration of the camera.
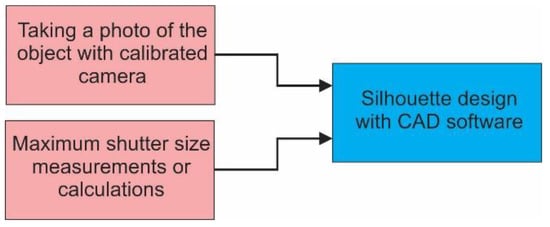
Figure 4.
Shutter design process flowchart showing the use of a calibrated camera.
2.2.1. Shutter Sizing
The shutter that will be attached to the frame of the selected luminaire must be properly sized and shaped in the silhouette of the church. The frame and shutter must be sized according to the size of the luminaire, as shown in Figure 3. The dimensions of the shutter are usually the same as the dimensions of the luminaire, but the distance between the shutter and the light source can be altered to achieve the appropriate angle of the outgoing light beam.
The entire silhouette of the church must fit on the shutter. The angle of view (Ψ) can be determined using software and a bird’s eye view of the building (Figure 5). We have assumed that we have a point light source. Thus, the distance between the source and the shutter can be calculated using Equation (1):
where
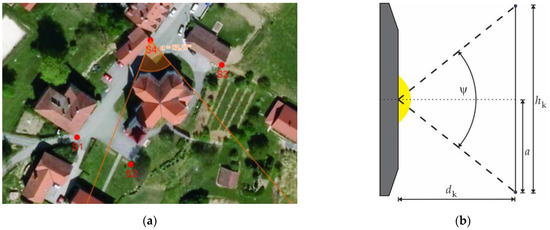
Figure 5.
The required viewing angle of the luminaire (a); distance of the shutter from the light source (b).
- dk is the distance between the light source and the shutter
- is the angle of view
2.2.2. Contour Sizing
To create a shutter with a silhouette, only the dimensions of a reference plane and an image of the object are required. In this process, it is assumed that the luminaire is above ground level and the centre of the beam is aligned with the centre of the building (centre of the azimuth as well as elevation). An arrangement sketch is shown in Figure 6. The sketch includes the following quantities used to calculate the height of the contour:
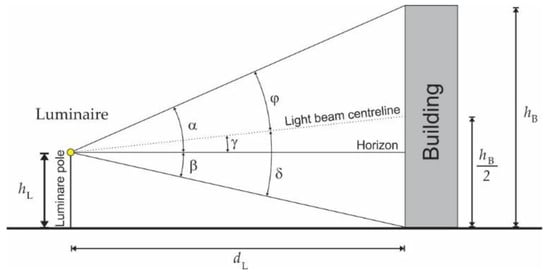
Figure 6.
Sketch of the simplified conditions with a point light source.
- building height;
- luminaire mounting height;
- distance between the luminaire and the building;
- α the angle between the horizon and the upper edge of the beam;
- β the angle between the horizon and the lower edge of the beam;
- γ the angle between the horizon and the centreline of the beam;
- δ the angle between the lower edge and the centreline of the beam;
- φ the angle between the centre and the upper edge of the beam.
Using trigonometric functions, the size of the contour is calculated at the chosen distance of the shutter from and the light source ( in Figure 5). To calculate the height of the contour and the distance of the shutter from the light source as a function of the size of the light source the angles in Figure 6 first need to be calculated. Point F (“focal point”) represents the reference point where the ideal point light source would be placed. At this point, the angles , , and are calculated using Equations (2)–(4):
Then, the angles and can be calculated using Equations (5) and (6):
Figure 7 shows how the size of the source affects the distance between the source and the shutter. As shown in Figure 7, the outer edges of the light beam intersect at the focal point, F. This point divides the desired shutter distance as the following:
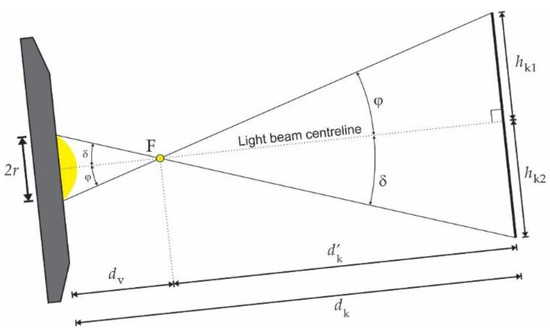
Figure 7.
Real conditions with a non-point light source.
- distance between the light source and the focal point
- distance between a focal point and the shutter
With a known size or, in this case, the diameter of the source (since the source is round), distance can be expressed by Equation (7):
where Equations (5) and (6) are used.
Equation (7) describes the transition of the focal point along the centre line. The distances and , calculated by Equations (8) and (9), now represent the location of the actual focal point of the luminaire.
where
- is the height of the focal point;
- is the distance between focal point and building.
As can be seen from Figure 7, the height of the silhouette is divided into two parts. The height of the upper () and lower () part of the desired silhouette depends on the angles and . The relationship between all these quantities can be expressed with Equations (10) and (11):
Equations (12) and (13) determine the angles and in Figure 6, taking into account the real position of the focal point:
Finally, taking into account all relations (Equations (1)–(13)), the final Equations (14) and (15) for calculating the upper and lower parts of the contour can be written as the following:
2.2.3. Taking an Image of the Building with the Camera
To design the shutter, images of the building to be illuminated are used. First, the exact mounting point of the light must be determined before construction. Once the location has been determined, the camera is placed at the mounting location, the mounting height is measured, and a photograph of the building is taken. The building must be photographed in the same direction that the luminaire will be facing. Because the centre of the light beam is directed towards the centre of the building, it should also be the centre of the image. In our study, we used the Canon EOS 50D with the Sigma DC 18–250 mm 1:3.5–6.3 HSM lens. The lens had a fixed focal length of 18 mm and the same settings should always be used. If the lens viewing angle is too narrow to fit the whole building in one single image (Figure 8a,b), more photos are taken and merged with appropriate software (Figure 8c). Photos taken with an 18 mm lens, which are relatively wide, are geometrically distorted. Before the photos are used for the CAD model, corrections of abnormalities, such as barrel distortion (straight lines appearing bowed), have to be made. Geometric distortion is automatically corrected with the merge function in software (Adobe Photoshop) if more than one photo is used. If only one photo is used, a lens correction filter can be applied manually. When applying a lens correction filter, Photoshop reads the camera and lens properties from the EXIF metadata of the photo. Photoshop supports the commonly used camera/lens combination we used, and the geometrical distortion was removed with “Auto-correction”.
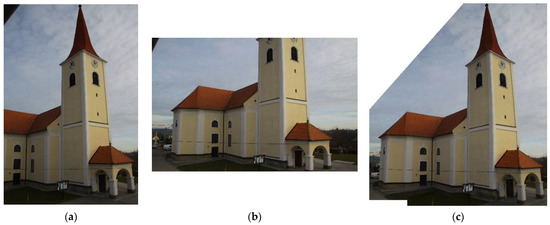
Figure 8.
Merging two images of the building; first image (a), second image (b), merged image (c).
2.2.4. Silhouette Planning with a CAD Model
It is necessary to prepare a CAD model of the silhouette of the building. The CAD model is designed based on the photo(s) of the building. With the help of software and a photo of the building, a vector image of the silhouette is created. The vector image should be scaled to the desired size. To determine the scaling ratio, the image height must be calculated.
Because the calculation is performed on a plane, it is sufficient to know only the height of the sensor of the camera used and the focal length of the lens used to determine the height of the image taken by the camera at a given distance . With the help of the sketch in Figure 9, Equation (16) can be derived:
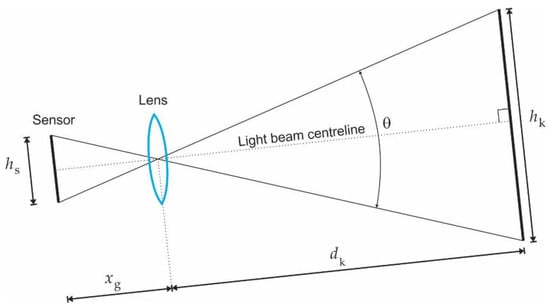
Figure 9.
Defining the height of the image.
Then, Equation (17) defines the scaling ratio:
where is image height.
The scaling ratio depends on many quantities, but if the same camera setting, the same luminaries, and the same distance between the shutter and the light source are always used, then the scaling ratio will remain the same. In our case, the calculated scaling ratio was 214 and this ratio was used when a photo was imported into Autocad. In this way, we calibrated the camera. When the camera is calibrated, the scaling ratio will only change if the size of the silhouette is too large to fit into the size of the shutter. In this case, the distance between the shutter and the light must be decreased and thus, the scaling ratio will also become smaller.
Once the scaling ratio is defined, the image is used as a base on which a silhouette can be manually drawn (Figure 10). When drawing a silhouette, only parts of the building with high reflectance (bright colours) should be included in the silhouette. The reflectance of the dark parts of the building such as the roof, windows, and doors is usually low enough that the luminance would be too low to be noticeable even when illuminated. In addition, if birds or bats are nesting in any part of the building (bell tower), that part should be removed from the silhouette.
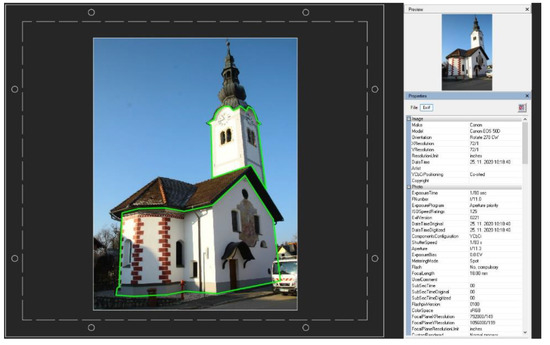
Figure 10.
CAD interface in Autocad with the EXIF metadata of the photo.
When the shape and size of the silhouette along with a shutter is finalised in the CAD software, it is exported to 3D printer software and the shutter is 3D printed in black ABS material for photometric measurements with a goniophotometer.
2.2.5. DIALux Simulation
By measuring the spatial luminous intensity distribution of a luminaire with a shutter using a calibrated goniophotometer, an LDT or IES file is created for lighting simulations. Photometric measurements were performed with a spatial resolution of 2.5 degrees in C planes and 1 degree in gamma angles. With the photometric file, the luminance of the building can be calculated with the help of lighting simulation software, and the part of the luminous flux reaching the building as well as the part passing the building can be defined.
In the light calculation program DIALux, the building and its surroundings were modelled in 3D (Figure 11). If the calculations show that the silhouette does not fit the building perfectly, a shutter with a bigger or smaller silhouette can be printed with a 3D printer, measured, and used for the simulation again.
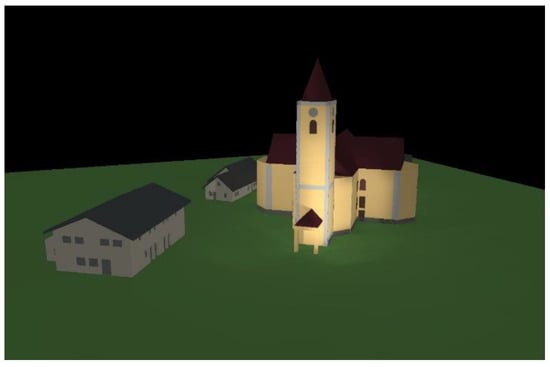
Figure 11.
3D simulation of the façade lighting of the building under consideration with surroundings.
3. Results
Using the presented methodology, we renovated the exterior lighting system of the Church of St. Thomas. The church was illuminated with four luminaires placed at four mounting locations around the church, as seen in Figure 12.
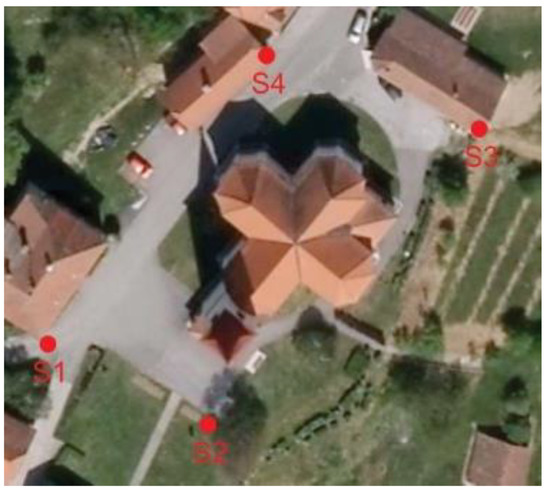
Figure 12.
Luminaire mounting locations.
First, we prepared shutters for each luminaire mounting point, as described in previous sections. One of the designed shutters with a silhouette can be seen in Figure 13b.
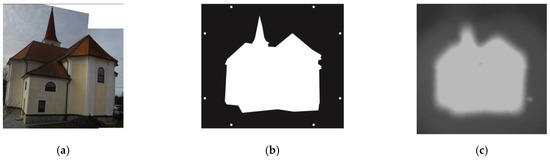
Figure 13.
A merged photo of the building (a), the designed silhouette (b), and the shape of the simulated illuminated surface (c).
3.1. Legal Requirements
In creating the appropriate solution, the following legal requirements were considered:
- The average luminance of the illuminated part of the façade shall not exceed 1 cd/m2.
- The light cones of the luminaires must be directed in such a way that the outer edge of the illuminated surface of the cultural monument is at least 1 m below the eaves.
- A maximum of 10% of the luminous flux may pass by the façade of a cultural monument.
- The nominal electrical power of all used luminaires must be less than 180 W.
3.2. Proposed Solution
The existing exterior lighting consisted of four HID luminaires with a total wattage of 800 W. The luminaires and installation did not meet the code and needed to be disconnected and replaced. We proposed to replace the existing HID luminaires with four LED COB luminaires, each with an electrical power of 43 W and a correlated colour temperature of 3000 K. The luminaires could be replaced with new luminaires equipped with a shutter and a silhouette in the shape of a church façade. The same mounting locations could be used. The proposed luminaires with the shutters are shown in Figure 14. The shutters block any stray light that may pass the building.
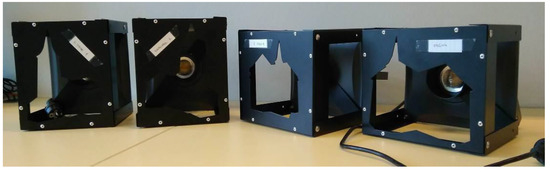
Figure 14.
Luminaires with shutters.
3.3. Analysis
The proposed solution was simulated in the DIALux software. The goniophotometer was used to measure the spatial luminous intensity distribution of the luminaire as well as the luminous flux. The total luminous flux of all four luminaires is 2827 lm.
In the simulation program, an accurate 3D model of the building and surrounding buildings, which could affect the lighting of the building itself, was made. The surfaces where illuminance was calculated were added to all the illuminated surfaces of the building. To ensure the most accurate calculations possible, 76 calculation surfaces were added. From the known size of the calculation surface and the average illuminance on that surface, the luminous flux reaching the surface was calculated. By summing the partial luminous fluxes that reach all individual surfaces, we obtained the total luminous flux that reaches the illuminated building.
The analysis shows that the total luminous flux reaching the façades of the church is 2554 lm. The luminous flux reaching the façades of the church accounts for 90.4% of the total measured luminous flux of the luminaires. This means that less than 10% of the total luminous flux strays to the surroundings. The results of the measurements with a luminance meter after the installation of the new luminaires show that the average luminance of the façade does not exceed 1 cd/m2. The total power of the luminaires after refurbishment is 170 W, which is only 21% of the power prior to the renovation.
All four new luminaires were also measured with a goniophotometer before the shutters with silhouettes were installed. The average total luminous flux of a 43 W COB LED raw luminaire is 4829 lm. This is the luminous flux of an unshielded LED COB luminaire, which has a similar spatial luminous intensity distribution as the old luminaires but significantly reduced power. The new COB LED luminaires with shutters with silhouettes, which prevent stray light from passing the buildings, have much a lower luminous flux. Measured luminous fluxes for the first, second, third, and fourth luminaires are 599 lm, 682 lm, 823 lm, and 723 lm, respectively. These are the luminous fluxes that reach the illuminated surfaces. The difference between 4829 lm (each unshielded luminaire) and the above-mentioned fluxes would be lost in the sky as well as illuminating the ground between the luminaire and the building. As we can see, on average, only 14.6% of the emitted luminous flux of the unshielded luminaire reaches the illuminated surface. With the new proposed method and luminaires, we successfully blocked 16.489 lm. We can conclude that with the usage of unshielded luminaires with a wide beam, about 85% of the emitted light is lost in the sky.
Figure 15 shows a photo of the renovated church exterior lighting and a computer simulation of the lighting. The images show an appropriately lit church. As can be seen, the parts of the heritage building with low reflectance (roof) are not illuminated. Since the lighting meets all the previously defined requirements, we can conclude that our methodology is appropriate for façade lighting, as the stray light is well controlled and limited.
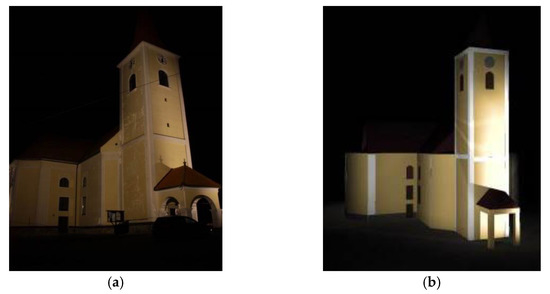
Figure 15.
Photo of the church after renovation (a); computer simulation of the same church with measured LDT files (b).
3.4. Light Pollution Observation with Satellites
Light pollution and its reduction are difficult to measure. One possibility for measurement is to use satellite instruments. From 2012, the best available source of global nighttime light observations from space comes from the NASA/NOAA Visible Infrared Imaging Radiometer Suite (VIIRS) day/night band (DNB) [24,25]. Unfortunately, as well as with satellite images, there are some limitations, including the spatial resolution [2,26] and the time of the observation. The satellite with VIIRS DNB passes over the location of the mentioned building around 1:30 a.m. [26]. If the façade lighting is switched off during late-night hours, the reduction in light pollution is not noticeable on satellite images.
In the case of the Church of St. Thomas, the luminaires were switched off during late-night hours before the renovation and, therefore, it is impossible to see the reduction in light pollution in the images, which were taken at 1:30 a.m. (Figure 16) when the luminaries were switched off. The light pollution seen in Figure 16 is a consequence of street lighting in the village of St. Thomas and not the façade lighting of the church.
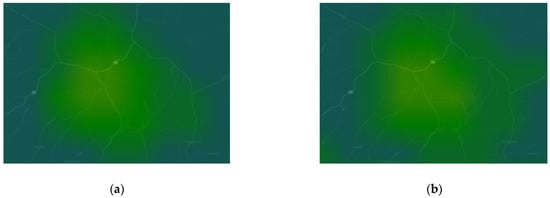
Figure 16.
Screenshot from https://lighttrends.lightpollutionmap.info (accessed on 15 July 2021) showing the light pollution in the village of St. Thomas observed from space by the VIIRS DNB; before the renovation in 2018 (a) and after the renovation in 2020 (b).
4. Discussion
This study addresses the problem of light pollution caused by the illumination of façades of cultural monuments and buildings. Light pollution can affect human well-being, ecosystems, astronomical research, and more. With the presented development methodology of using luminaires with shutters, we can illuminate such buildings in a more efficient and environmentally friendly way. The entire process of making a shutter with a suitable silhouette of the building has been presented. Images of the building and on-site measurements are used. The use of the CAD interface has also been described. The methodology was used in the reconstruction of the exterior lighting of the Church of St. Thomas. After designing and printing the shutters, we performed photometric measurements of the new luminaires with shutters, which were then used in a simulation using DIALux software. We also compared the obtained results with the actual situation after reconstruction and verified the conformity of such lighting with legal requirements. When the outdoor lighting of the Church of St. Thomas was renovated, the installed power was reduced from 800 W to 170 W. This means that the power has been reduced to less than 25% of the existing power, which is a significant result for sustainability. Reducing installed power was a small part of our goal, but reducing light pollution is much more important. Unfortunately, light pollution and its reduction are, as previously mentioned, difficult to measure, especially if luminaires are switched off during late-night hours when the satellite passes over the location.
Unfortunately, we were unable to compare satellite images to evaluate the reduction in light pollution, but when we compared 400 W unshielded HID lamps to 43 W LED luminaires with shutters that emit less than 10% of the luminous flux into the sky, it was evident that a significant improvement was achieved.
If luminaires are not switched off during late-night hours, additional energy savings and a significant reduction in light pollution can be achieved by switching off the facade lighting during late-night hours. Traffic volume, along with the number of people who admire the illuminated building during the late-night hours, is extremely low; thus, it makes little sense to illuminate facades. Only 6.5% and 15% of daily traffic was measured between the overnight hours of 10 p.m. and 6 a.m. (eight hours), and between 6 p.m. to 10 p.m. (four hours), respectively. [27]. Traffic density during the evening hours is approximately five times higher than during the late-night hours, and therefore, there is no need to illuminate façades during late-night hours. In Vienna, a decrease of approximately 10% in the light pollution level was measured at midnight when the curfew begins [28].
The proposed method is applicable to other buildings and monuments as well. When the camera is calibrated, the process of shutter and silhouette design should be straightforward and efficient. With several measurements of different buildings and others made in the laboratory, we gained new knowledge, and it is now possible to quickly modify the shutter and silhouette to fit different sizes and shapes of different objects.
We started with the development of the shutters in 2018 and have encountered various problems. The major challenge has been a supply of luminaires. Soon after the renovation of the Church of St. Thomas, we were asked to renovate the lighting of another church. At that time, we were thrilled to receive a new project which would partly cover the expenses we had with the development of the method and first luminaires. Unfortunately, we soon realised that we have a new problem. Raw luminaries (Kapego Flood Eye COB) are no longer on the market, and thus, we had to find new luminaries and new suppliers. With the new luminaries, which have different sizes, it was necessary to re-check all of the equations and to recalculate the SR. In addition, with the new size of the luminaries, the maximum size of the silhouette is different, and to avoid further problems with different sizes of luminaries, we are now considering a new method of fixing the shutter to the raw luminaire.
With the first project, we learned that in some cases, the silhouette should block only the light that would go into the sky and not all the light that passes the surface of the illuminated building. In the case of the Church of St. Thomas, two luminaries are mounted on the neighbouring building and there is a road between the building and the church. The old luminaries had such a wide beam angle that the street was also adequately illuminated. After the renovation of the church lighting, when all the “stray” light was blocked, the street was nearly dark. With this project, we learned that in some cases, the silhouette should block only the upper part of the luminous flux.
For future work, two factors are especially important to investigate. First, the merging of several photos results in high geometrical distortion, especially if the luminaire is located close to the illuminated object. To avoid mistakes when applying a lens correction filter, we plan to calibrate a wider lens. So far, we have attempted to use a fish-eye lens Sigma DC HSM 4.8 mm 1:2.8., but without success; the geometrical distortion is too extensive to be corrected in Photoshop. The other problem is the time spent travelling to the location of the illuminated object. Although Slovenia is a small country, one would quickly need 2 h or more to get to an object to photograph, which takes only a few minutes. The idea is to calibrate a small and inexpensive compact camera that could be sent to the person who maintains the existing lighting or is carrying out the renovation to take photos and send the camera with the photos back. This way, it would be possible to design shutters with silhouettes for buildings in other countries as well.
Author Contributions
Conceptualization, M.B.K. and G.B.; methodology, M.B.K.; validation, M.E. and M.B.K.; writing—original draft preparation, M.B.K.; writing—review and editing, M.B.K.; visualization, M.B.K.; supervision, G.B.; funding acquisition, G.B. All authors have read and agreed to the published version of the manuscript.
Funding
This research was funded by Slovenian Research Agency, grant number P2-0356.
Conflicts of Interest
The authors declare no conflict of interest.
References
- Kuechly, H.U.; Kyba, C.C.M.; Ruhtz, T.; Lindemann, C.; Wolter, C.; Fischer, J.; Hölker, F. Aerial survey and spatial analysis of sources of light pollution in Berlin, Germany. Remote Sens. Environ. 2012, 126, 39–50. [Google Scholar] [CrossRef]
- Kyba, C.C.M.; Mohar, A.; Pintar, G.; Stare, J. Reducing the environmental footprint of church lighting: Matching façade shape and lowering luminance with the EcoSky LED. IJSL 2018, 20. [Google Scholar] [CrossRef] [Green Version]
- Kobav, M.B. Meritve Svetlosti Fasad Sakralnih Objektov V Občini Dravograd; Presoja Skladnosti z Uredbo o Mejnih Vrednostih Svetlobnega Onesnaženja Okolja; University of Ljubljana: Ljubljana, Slovenia, 2018. [Google Scholar]
- Kobav, M.B. Meritve Svetlosti Fasad Cerkve Svetega Tomaža; Presoja Skladnosti z Uredbo o Mejnih Vrednostih Svetlobnega Onesnaženja Okolja; University of Ljubljana: Ljubljana, Slovenia, 2018. [Google Scholar]
- Kobav, M.B. Sanacija Razsvetljave Cerkve Sv. Tomaža; University of Ljubljana: Ljubljana, Slovenia, 2019. [Google Scholar]
- Mendoza, J. Nighttime light hurts mammalian physiology: What diurnal rodent models are telling us. Clocks Sleep 2021, 3, 236–250. [Google Scholar] [CrossRef] [PubMed]
- Robert, K.A.; Lesku, J.A.; Partecke, J.; Chambers, B. Artificial light at night desynchronizes strictly seasonal reproduction in a wild mammal. Proc. R. Soc. B Biol. Sci. 2015, 282, 20151745. [Google Scholar] [CrossRef] [PubMed] [Green Version]
- Grubisic, M.; van Grunsven, R.H.A. Artificial light at night disrupts species interactions and changes insect communities. Curr. Opin. Insect Sci. 2021, 47, 136–141. [Google Scholar] [CrossRef] [PubMed]
- Owens, A.C.S.; Lewis, S.M. The impact of artificial light at night on nocturnal insects: A review and synthesis. Ecol. Evol. 2018, 8, 11337–11358. [Google Scholar] [CrossRef] [Green Version]
- Li, Y.; Li, S.; Zhou, Y.; Meng, X.; Zhang, J.-J.; Xu, D.-P.; Li, H.-B. Melatonin for the prevention and treatment of cancer. Oncotarget 2017, 8, 39896–39921. [Google Scholar] [CrossRef] [PubMed] [Green Version]
- Blask, D.E. Melatonin, sleep disturbance and cancer risk. Sleep Med. Rev. 2009, 13, 257–264. [Google Scholar] [CrossRef] [PubMed]
- Blume, C.; Garbazza, C.; Spitschan, M. Effects of light on human circadian rhythms, sleep and mood. Somnologie 2019, 23, 147–156. [Google Scholar] [CrossRef] [PubMed] [Green Version]
- CIE. S 026/E:2018 CIE System for Metrology of Optical Radiation for IpRGC-Influenced Responses to Light; International Commission on Illumination (CIE): Vienna, Austria, 2018. [Google Scholar]
- Spitschan, M. Photoreceptor inputs to pupil control. J. Vis. 2019, 19, 5. [Google Scholar] [CrossRef] [PubMed] [Green Version]
- Posledice Svetlobnega Onesnaževanja. Available online: https://svetlobnoonesnazevanje.wordpress.com/2016/02/23/posledice-svetlobnega-onesnazevanja-4/ (accessed on 11 February 2021).
- Marolt, S. Škodljivi Vplivi Svetlobnega Onesnaževanja Na Živa Bitja; University of Ljubljana: Ljubljana, Slovenia, 2006. [Google Scholar]
- Karlicek, R. Handbook of Advanced Lighting Technology; Springer: New York, NY, USA, 2016. [Google Scholar]
- How Does Light Pollution Affect Astronomers? (Intermediate)—Curious About Astronomy? Ask an Astronomer. Available online: http://curious.astro.cornell.edu/about-us/116-observational-astronomy/stargazing/professional-observers/712-how-does-light-pollution-affect-astronomers-intermediate (accessed on 11 February 2021).
- Uredba o Mejnih Vrednostih Svetlobnega Onesnaževanja Okolja. Available online: http://www.pisrs.si/Pis.web/pregledPredpisa?id=URED4520 (accessed on 5 May 2021).
- Bokal, M. Vpliv Uredbe o Mejnih Vrednostih Svetlobnega Onesnaževanja Okolja na Razvoj Javne Razsvetljave v Sloveniji do Leta. 2015. Available online: https://repozitorij.uni-lj.si/IzpisGradiva.php?id=83597 (accessed on 11 February 2021).
- Register Kulturne Dediščine (RKD). Available online: https://gisportal.gov.si/portal/apps/webappviewer/index.html?id=df5b0c8a300145fda417eda6b0c2b52b (accessed on 5 May 2021).
- What Are “COB” LEDs and Why Do They Matter? Available online: https://siliconlightworks.com/resoures/what-are-cob-leds (accessed on 11 February 2021).
- Differences between LED Technologies: DIP/SMD vs. COB vs. MCOB—Documents—Nomo Group Co., Limited. Available online: https://www.smart-solar-lights.com/info/differences-between-led-technologies-dip-smd-20110769.html (accessed on 11 February 2021).
- Miller, S.; Straka, W.; Mills, S.; Elvidge, C.; Lee, T.; Solbrig, J.; Walther, A.; Heidinger, A.; Weiss, S. Illuminating the capabilities of the suomi national polar-orbiting partnership (NPP) visible infrared imaging radiometer suite (VIIRS) day/night band. Remote Sens. 2013, 5, 6717–6766. [Google Scholar] [CrossRef] [Green Version]
- Elvidge, C.D.; Hsu, F.-C.; Zhizhin, M.; Ghosh, T.; Taneja, J.; Bazilian, M. Indicators of electric power instability from satellite observed nighttime lights. Remote Sens. 2020, 12, 3194. [Google Scholar] [CrossRef]
- Kyba, C.C.M. Radiance Light Trends. Available online: https://lighttrends.lightpollutionmap.info (accessed on 11 February 2021).
- Kobav, M.B.; Bizjak, G. Meritve Svetlobnotehničnih Razmer na Prehodih za Pešce in Kolesarje v Križišču na Cesti R3-646, Odsek 1444 Cikava—Grosuplje, v km 0.900; University of Ljubljana: Ljubljana, Slovenia, 2020. [Google Scholar]
- Puschnig, J.; Posch, T.; Uttenthaler, S. Night sky photometry and spectroscopy performed at the Vienna University Observatory. J. Quant. Spectrosc. Radiat. Transf. 2014, 139, 64–75. [Google Scholar] [CrossRef] [Green Version]
Publisher’s Note: MDPI stays neutral with regard to jurisdictional claims in published maps and institutional affiliations. |
© 2021 by the authors. Licensee MDPI, Basel, Switzerland. This article is an open access article distributed under the terms and conditions of the Creative Commons Attribution (CC BY) license (https://creativecommons.org/licenses/by/4.0/).