Abstract
The protection of a water resource’s ecological environment is one of the most important tasks in the watershed in China. The evaluation of water resources carrying capacity (WRCC) is the foundation for the suitability of territorial space development. It is necessary to further analyze the weaknesses of the coordinated development of various dimensions of WRCC and explore the basis of territorial space development and optimization. This paper considers Chinese unique policy tasks, namely, “three water management together”, the types of main function areas, “red lines” control, and national spatial suitability evaluation, to construct the evaluation index system of WRCC. Monomial evaluation, integrated evaluation, and coupling coordination analysis methods are used separately to evaluate the carrying index, comprehensive carrying index, and coupling coordination degree of WRCC in the Qingjiang River Basin. The results show that: (1) As far as monomial evaluation is concerned, water resource supplies are often overloaded on the overall economy, industrial, and agricultural development; (2) The comprehensive indices of WRCC of the counties in the southwest are obviously better than that of the counties in the northeast; (3) The degree of coupling coordination of WRCC in the Qingjiang River Basin is not high, and is essentially in the primary or barely coordinated level; (4) the short board of WRCC in the Qingjiang River Basin presents obvious spatial characteristics, which from west to east are water environment, water resources and water ecology lagging, respectively. This paper measures WRCC for industry, agriculture, life, and ecology, which is helpful in promoting the suitability evaluation of land space development. Meanwhile, the case study of the Qingjiang River Basin provides reference for other regions to implement the “double evaluation”.
1. Introduction
Water resource restriction has become an important factor to be considered in the economic development of human society in the 21st century [1]—the demand for water has increased nearly eightfold in the past 100 years [2] and its exploitation and utilization have also caused great damage to the ecological environment [3]. China has taken a number of measures towards the sustainable development and utilization of water resources and the construction of water ecological civilizations, and has raised the protection of the water ecological environment to an unprecedented level.
As an effective tool for solving the problems of resources and environment, the carrying capacity has been favored by domestic and foreign governments and scholars. Through manual screening and sorting of literature on water resources carrying capacity (WRCC) in China National Knowledge Infrastructure (CNKI) and Web of Science (WOS) databases, it has been found that the quantity of literature on WRCC has been increasing since 2001 (Figure 1). There is no unified view on the concept of resource carrying capacity, which can be divided into three categories: First, the maximum development and utilization capacity of regional resources [4]; Second, the maximum population supported by regional resources [5]; Third, the sustainable development of economic, social, and ecological systems supported by regional resources [6,7]. Similarly, the concept of WRCC is roughly divided into the above three categories, the third of which is favored by the Chinese government and scholars. The concept of dynamic WRCC is proposed based on The Technical Guide for Assessment of Carrying Capacity of Resources and Environment and Suitability of Land and Space Development issued by the Ministry of Natural Resources of China in 2020. It means that water resources within a certain region can support the largest scale of agricultural production, urban construction, and other human activities. It should be noted that the largest scale here needs to take into account not only background conditions and surpluses, but also quota targets under national strategies and future potential.
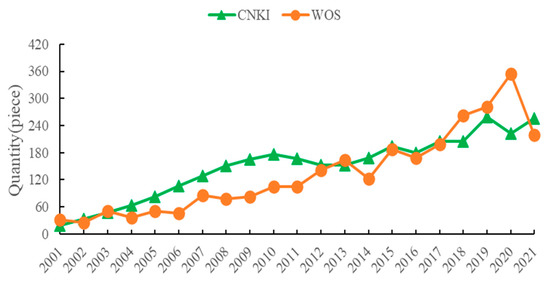
Figure 1.
Research on WRCC of CNKI and WOS databases from 2001 to 2021.
Since the report of the 18th National Congress of the Communist Party of China put forward the construction of ecological civilization, the water ecology of the river basin has been paid more attention to [8,9,10] and has entered the stage of paying attention to the “three water management together” of water environment, water ecology, and water resources. With the development of the content of water resources management, the index system of WRCC is becoming more and more abundant, and many scholars are gradually taking water environment and water ecology into consideration [11,12,13]. Mingbo Chi et al.’s construction includes geological factors, a mining system, ecosystem, and water-resources systems to measure the WRCC of mining areas [14]. Xi-Yin Zhou et al. established the water-environment carrying-capacity research system based on multiagent systems to study and present the water environment carrying capacity of Changzhou City from four dimensions, including scale, structure, pattern, and space [15]. Jian Zhang et al. constructed a 16-index WR-WECC evaluation index system, including the three subsystems of water resource system, socioeconomic system, and ecological environment system, to analyze the changing trend of water environment carrying capacity in Yuetang District [16]. However, few scholars consider the carrying capacity of water resources in industrial production, agricultural production, urban construction, and ecological protection based on “three water management together”.
Coupling-coordination degree can be used to reflect the coordination quality and relationship of interaction between different systems [17,18]. Therefore, the coupling coordination model has been applied by many scholars to study the relationship between systems in various fields and their change rules. For example, the coupling relationship between urbanization and natural disasters [19], between China’s new urbanization and ecological environmental pressure [20], and between production, living, and ecological functions are studied [21]. Similarly, on the basis of the construction of the evaluation index system of WRCC, many scholars use the coupling-coordination degree model to study the coordinated development state of different systems and distinguish the types of backward development [22,23]. Li et al. (2021) estimated the coupling-coordination degree of production, living, and ecological spaces in the Yellow River Basin [24]. Li et al. (2021) evaluated coupling coordination and spatiotemporal heterogeneity between urbanization and natural disasters in the Pearl River Delta, China [19].
From the point of view of the study area, WRCC of the basin is common [19,25,26,27]. Ruining Jia et al. evaluated WRCC of Ganzhou, Gaotai, and Linze counties in the middle reaches of Zhangye City in the Heihe River Basin, which are the main agricultural production areas, and put forward suggestions for improvement [28]. LiangJie Yang studied the variation of WRCC in the spatial and temporal dimensions of water resources in Shiyang River Basin based on the influencing factors of detecting WRCC with geographical detectors [29]. Dan Dai et al. evaluated the water use of Yongding River Basin in Beijing under different conditions and assessed and predicted the water resource carrying capacity under different schemes [30]. Jian Kang et al. evaluated the WRCC of Shanxi, Inner Mongolia, Liaoning, Beijing, Tianjin, Hebei, Henan, Shandong, and other areas throughout the Haihe River Basin and proposed an optimization model to optimize the effective irrigation areas and groundwater exploitation [9]. Su Xianbao calculated the comprehensive WRCC in combination with water resources and water environment thresholds by adopting their own water use standards for each basin in Gansu Province [31], this study not only takes the river basin as the research object, but also well reflects the different threshold values used to evaluate the level of carrying capacity. However, there are few studies on the county level of the river basin. Some other studies on WRCC evaluation indicators and research areas are shown in Table 1.

Table 1.
Some literatures on WRCC evaluation indicators and research areas.
Looking at the existing research, scholars have made great progress in the study of WRCC and have constructed a detailed and comprehensive index system. However, there is still room for further research on the construction of an index system of WRCC, the “short board” of critical or overloaded WRCC, and the research scale. Therefore, this article has the following two advantages: First, this paper adopted a new research method that is from the perspective of “double evaluation”, the regional water resources policy “three lines and one order” and “three water management together” and regional positioning differences. Second, the evaluation of WRCC is mainly based on the large scale of provinces and cities and lacks research on the microscale of specific basins. In this paper, WRCC is studied on the scale of the ten counties through which the Qingjiang River Basin flows.
Qingjiang River, as the first major tributary of the Yangtze River after exiting the Three Gorges, is also the second largest tributary in Hubei Province after Hanjiang River. According to The Regulations on Water Ecological Environment Protection of Qingjiang River Basin in Hubei Province issued in 2019, the Qingjiang River Basin includes the main stream and tributaries of Qingjiang River in Lichuan city (county-level city), Enshi city (county-level city), Jianshi county, Badong county, Xianfeng county, Xuanen county, Hefeng county, Changyang Tujia Autonomous County, Wufeng Tujia Autonomous County, and Yidu city (county-level city) (Figure 2). The total amount of water resources in the basin is abundant and the overall water quality is in good condition. However, the water resources, water environment and water ecology of Qingjiang River should not only consider its own carrying capacity, but also consider WRCC of Qingjiang River Basin in Hubei Province, the Yangtze River Economic Belt and even the whole country.
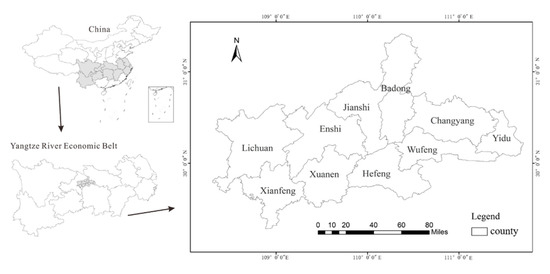
Figure 2.
Location of the Qingjiang River Basin.
Therefore, this paper aims to fill the gaps by developing an index system based on Chinese unique policy task to evaluate WRCC of the Qingjiang River Basin from the perspective of counties. It has important reference to various main functional areas of basins, especially for restricted development areas in China. In the Chinese Yangtze River economic belt, 131 counties belong to optimized development areas, 210 counties belong to key development areas and 442 counties belong to restricted development areas which include 293 main agricultural product-producing areas and 149 key ecological-functional areas [44]. No matter what kind of main functional areas WRCC is evaluated in, “three water management together”, main functions and spatial suitability should be taken into account.
2. Theoretical Framework
When constructing the evaluation index system of WRCC in the Qingjiang River Basin, Chinese unique policy tasks, namely, “three water management together”, the types of main function areas, “red lines” control, and national spatial suitability evaluation should be taken into consideration. The general idea is shown in Figure 3.
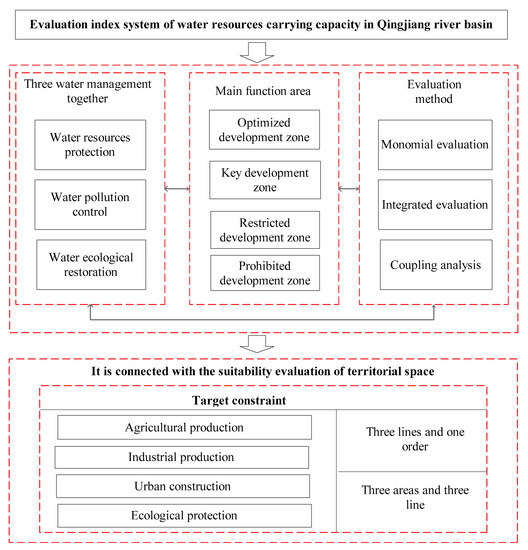
Figure 3.
General idea of building an evaluation index system of WRCC in the Qingjiang River Basin.
2.1. The Task of “Three Water Management Together”
At the 19th National Congress of the Communist Party of China, it was put forward that “we should pay attention to great protection instead of great development”. At the same time, it was required that the Yangtze River Basin should vigorously promote ecological environment protection and restoration and continue to promote the “three water management together” of water resources protection, water pollution control, and water ecological restoration. Based on the goal of “three water management together”, this paper constructs the evaluation index system of water resources, water environment, and water ecological carrying capacity from three dimensions: water resources protection, water pollution control, and water ecological restoration.
2.2. Diverse Focus of Different Main Functional Areas
Chinese Main Functional Area Planning divides the land space into four types of main functional areas: optimized, key, restricted, and prohibited development areas. Different development areas have different evaluation emphases, so we can consider adding indicators dynamically to adapt to different main functional areas and establish a more flexible indicator system to meet the differentiated needs of different main functional areas (Figure 4). However, the Qingjiang River Basin studied in this paper belongs to Chinese restricted development areas, among which there are a few key areas, such as Hubei Qingjiang National Forest Park, Hubei Chaibuxi National Forest Park, and Hubei Wufeng Houhe National Nature Reserve, which belong to the national prohibited development areas. From the administrative areas of the Qingjiang River Basin, Enshi, Lichuan, Jianshi, Badong, Xuanen, Xianfeng, Hefeng, Changyang, and Wufeng all belong to the ecological functional areas of restricted development areas, and Yidu belongs to the main agricultural products producing areas of restricted development areas. Therefore, the evaluation index system of WRCC in the Qingjiang River Basin should reflect the evaluation focus of restricted development areas.
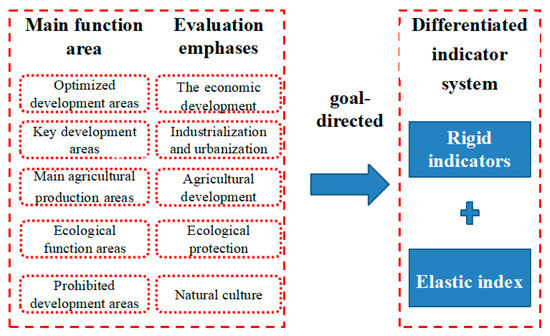
Figure 4.
Construction of differentiated index systems based on the evaluation focus of main functional areas.
2.3. The Land-Space Suitability Evaluation
The evaluation of WRCC is the basis of water-resource suitability evaluation, which contributes to the spatial planning of “three areas” (town, agriculture, and ecological space) and promotes the optimal allocation of water resources. Conversely, the optimal allocation of water resources improves WRCC and forms a circular process (Figure 5). In the spatial planning of watershed counties, the main functions should be positioned according to the proportion of “three areas”, and the bottom-line control requirements of the main functions should be improved by “three lines” (an ecological protection red line, permanent basic farmland, and an urban development boundary). Therefore, when constructing the three-dimensional index system of water resources, water environment, water ecological carrying capacity, and the carrying capacity of watershed water resources for the development of “three areas” should be specifically refined.
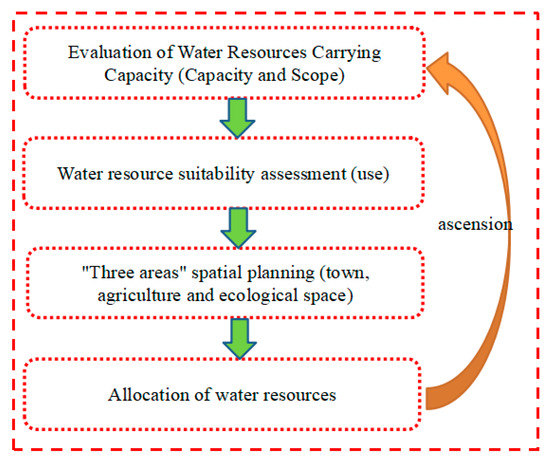
Figure 5.
Circular process of WRCC improvement.
3. Research Method
3.1. Establishment of Evaluation Index System of WRCC
Based on the above ideas, this paper constructs an index system from three dimensions: water resources, water environment and water ecology. In the index system, it focuses on the evaluation of major agricultural production areas and ecological functional areas and sets up more indicators of agricultural development and ecological construction. At the same time, it reflects the connection with “three lines and one order” in the calculation formula detailed in the single evaluation method later and considers the connection with the suitability of land space in agricultural development and urban construction. The index system is shown in Table 2.

Table 2.
Circulation process of WRCC improvement.
3.2. Evaluation Method of WRCC
The single index of WRCC is helpful for objectively calculating the carrying capacity of water resources to agricultural production, urban construction, and ecological spaces. Therefore, when constructing the index system, it is necessary to select irrigation water consumption, irrigation area, arable land scale, urban water consumption and the maximum scale of construction land. In order to evaluate the carrying capacity of water resources in various local areas of the Qingjiang River Basin as a whole, it is necessary to consider the integrated evaluation of individual indicators, so an appropriate method should be adopted to calculate the integrated evaluation index of WRCC. By analyzing the coupling degree, the shortcomings of WRCC can be identified.
3.2.1. Single Evaluation Method of WRCC
The evaluation of WRCC based on “three lines and one order” is helpful in controlling the remaining carrying space of water resources, water environment, and water ecology in the Qingjiang River Basin. In this paper, the calculation formulas of WRCC evaluation are as follows:
- (1)
- When the indicator is a positive indicator, the “red line” is usually the bottom line
Calculate the carrying capacity of water resources:
Calculate water resources carrying rate:
- (2)
- When the index is negative, the “red line” is usually the upper limit
Calculate the carrying capacity of water resources:
Calculate water resources carrying rate:
where represents the water resources carrying rate, represents the index of WRCC, represents the “red line” of each index, and represents the present value of each index. When is less than 0, it indicates overload. When is greater than 0, it indicates that it is in a loadable state.
Water consumption per 10,000 yuan of GDP, water consumption per 10,000 yuan of industrial added value, effective irrigation area rate, industrial total nitrogen discharge, industrial total phosphorus discharge, industrial wastewater discharge, nitrogen fertilizer application amount, phosphate fertilizer application amount, compound fertilizer application amount, domestic sewage treatment rate, water quality compliance rate of water sources, and ecological water use rate are all referred to in the above calculation process. The calculation processes of other indicators are shown in the calculation formula in Table 1, such as available water for irrigation, scale of cultivated land, irrigation scale, town available water, and area of urban construction land.
3.2.2. Integrated Evaluation Method of WRCC
- (1)
- Using range method to standardize data
For the positive index, the processing method is:
For negative indicators, the treatment method is:
- (2)
- Using coefficient of variation method to calculate the weight
Calculate the standard deviation of each index:
Calculate the coefficient of variation:
Calculate weights:
- (3)
- The weighted TOPSIS method is used to calculate the comprehensive evaluation value
Calculate the specification matrix:
Calculate the weighted gauge matrix: .
Calculate the distance between each scheme and the ideal solution as the evaluation value:
The ideal solution is:
The negative ideal solution is:
3.2.3. Evaluation Method of Coupling Coordination Degree of WRCC
Calculate the coupling degree:
Among them, is the evaluation value of water resources, water environment and water ecology obtained by weighted TOPSIS method.
Calculate the coupling coordination degree:
Among them, the expression indicates the importance of water resources, water environment and water ecology, respectively. Under the strategic background of “paying great attention to protection, not developing” and giving priority to ecological environment protection, the importance of water environment and water ecology is stronger than that of water resources, but the contribution between the three is required by coordinated development and cannot be too unbalanced, so this paper will set them as 0.3, 0.35 and 0.35.
3.3. Data Sources
The data on GDP come from Economic and Social Development Bulletins of the ten counties.
The data on total water resources, irrigation water consumption, industrial water consumption, ecological water consumption, and other indicators come from Enshi Tujia and Miao Autonomous Prefecture, Yichang Water Resources Bulletin.
The data on industrial wastewater discharge, agricultural nitrogen fertilizer application, agricultural phosphorus fertilizer application, and agricultural compound fertilizer application are derived from Enshi Tujia and Miao Autonomous Prefecture, Yichang Statistical Yearbook in 2018.
Part of the quota standard data refer to GB50137-2011 for urban land classification and planning and construction land, Hubei Water Resources Bulletin, etc. The reference value and source of “red line” are shown in Table 2.
4. Results and Discussion
4.1. Monomial Evaluation
4.1.1. Water Resources Dimension
- (1)
- Carrying status of water supply to the overall economy
Only Enshi and Badong belong to the bearable area of water resources for the overall economy, while eight counties, including Lichuan, Jianshi, Xuanen, Xianfeng, Hefeng, Yidu, Changyang, and Wufeng, are overloaded areas, i.e., the intensity of water consumption per unit of GDP is higher than the “red line” standard (Figure 6). Lichuan and Wufeng have the highest overload rates, reaching 43.6% and 123.4%, respectively, while Enshi and Badong do not have much space left, reaching 8.6% and 6.1%, respectively.
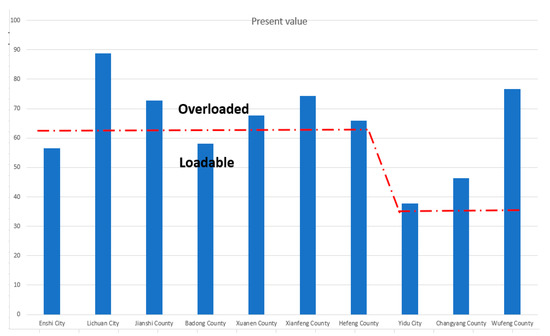
Figure 6.
Carrying capacity of the water resources dimension for the overall economy.
- (2)
- Carrying status of water resources to industrial development
Badong, Yidu, Changyang, and Wufeng belong to the bearable area of water resources for industrial development, while five counties, including Enshi, Lichuan, Jianshi, Xuanen, Xianfeng, and Hefeng, belong to the overloaded area of water resources for industrial development, i.e., the water consumption per unit of industrial added value is higher than the “red line” standard (Figure 7). Hefeng has the highest overload rate of water resources for industrial development, reaching 60.56%, while Wufeng has the largest remaining carrying space, about 23.8%.
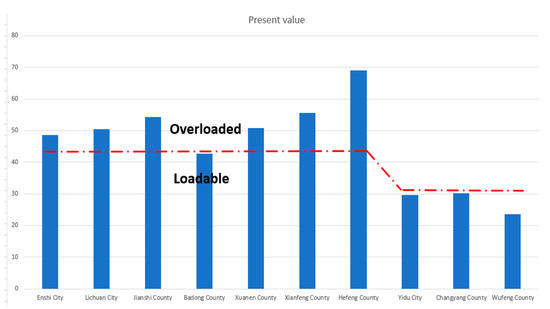
Figure 7.
Carrying capacity of the water resources dimension for industrial development.
- (3)
- Carrying status of water resources to agriculture
Yidu belongs to the bearable area of water resources for agricultural development, while Enshi, Lichuan, Jianshi, Badong, Xuanen, Xianfeng, Hefeng, Changyang, and Wufeng belong to the overloaded area of water resources for agricultural development, i.e., the effective irrigated area rate is lower than the “red line” standard (Figure 8). Among them, Changyang has the highest overload rate of water resources for agricultural development, reaching 89.52%.
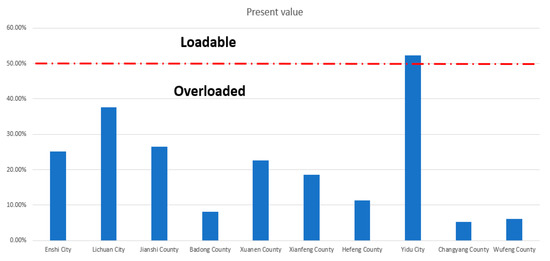
Figure 8.
Carrying capacity of the water resources dimension for agricultural development.
- (4)
- Carrying status of water resources to industrial and agricultural development space
Lichuan has the highest water resources development and utilization carrying capacity of more than 200 million cubic meters, followed by Enshi (Table 3). The lowest water resources development and utilization carrying capacity is Yidu, because its industrial water consumption far exceeds that of other areas, with the total water consumption reaching more than 25% of the water resources, therefore its water resources development and utilization carrying capacity is −0.56 million cubic meters. As its water consumption has exceeded the “red line” its irrigation water availability is −0.11 million cubic meters. Furthermore, because of the high proportion of urban domestic and industrial water consumption, the available water consumption in urban areas is much higher than that in other areas, reaching 128 million cubic meters. In other counties such as Lichuan, where industry is less developed and industrial water consumption is low, the amount of water available for urban use is relatively small. From the indicators of the scale of bearable irrigation, the scale of arable land, and the maximum scale of construction land, Lichuan, as the area with the highest total water resources, has the highest three indicators, while Yidu has the smallest scale of bearable construction land, at 230,800 acres, due to the high proportion of industrial water consumption. The remaining two indicators in Yidu are also at the lowest level in Qingjiang River Basin.

Table 3.
Assessment values of water resources for industry and agriculture in the Qingjiang River Basin.
4.1.2. Water Environment Dimension
- (1)
- The carrying status of water environment to industry
Enshi, Lichuan, Badong, Xuanen, Hefeng, Yidu, Changyang, and Wufeng within Qingjiang River Basin are in the carrying area for industrial total nitrogen discharge, while Jianshi and Xianfeng are in the overloaded area (Figure 9). For total industrial phosphorus and wastewater discharges, all counties in the Qingjiang River Basin are within the bearable range, with Enshi, Hefeng, and Yidu at the bearable critical value. All counties in the Qingjiang River Basin have industrial wastewater discharges within the carrying range.
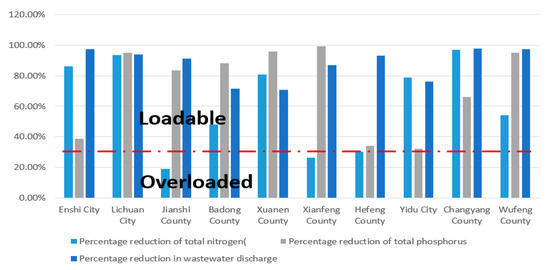
Figure 9.
Carrying capacity of the water environment dimensions for industrial development.
- (2)
- Carrying status of water environment to agriculture
The carrying status of the water environment to agricultural development is reflected by the carrying capacity of agricultural surface source pollution, specifically by the increase in the application of phosphate fertilizer, nitrogen fertilizer, potassium fertilizer and compound fertilizer (Figure 10). The carrying capacity of water environment for phosphorus fertilizer in Enshi, Lichuan, Badong, Xuanen, Yidu, Changyang, and Wufeng counties is within the carrying capacity, among which Badong, Xuanen, Yidu, and Changyang counties are at the critical value of carrying capacity, while Jianshi, Xianfeng, and Hefeng counties are the overloaded areas. The carrying capacity of water environment for nitrogen fertilizer in Enshi, Lichuan, Jianshi, Badong, Xianfeng, Yidu, Changyang, and Wufeng counties is within the carrying capacity, while Hefeng is the overloaded area. The discharge of nitrogen fertilizer in Hefeng and Xuanen is in the overloaded condition. For potassium fertilizer, all counties in the Qingjiang River Basin are within the carrying range, with Yidu nearing the carrying threshold. Enshi, Lichuan, Jianshi, Xianfeng, Hefeng, Changyang, and Wufeng are within the carrying range for compound fertilizer in the water environment, while Xuanen, Badong, and Yidu are in the overload condition.
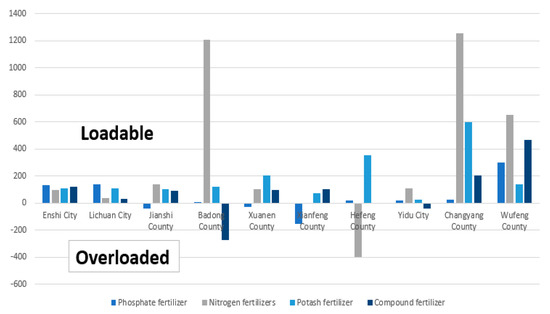
Figure 10.
Carrying capacity of the water environment dimensions for agricultural development.
- (3)
- Carrying status of the water environment to life
The domestic wastewater treatment rate and the drinking water source water quality compliance rate can reflect the carrying status of water resources for living. Enshi, Badong, Xuanen, Xianfeng, and Hefeng are loadable for living, while Lichuan and Jianshi belong to the overloaded areas (Figure 11), that is, the domestic sewage treatment rate is lower than the “red line” standard. The overloaded rate of water resources for living development in Lichuan is 30.14%.
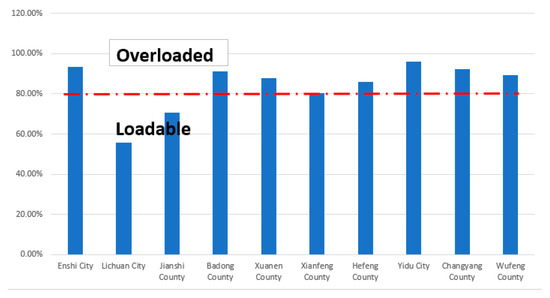
Figure 11.
Carrying capacity of the water environment dimensions for domestic wastewater treatment.
The drinking water quality standards of water sources in the Qingjiang River Basin, such as the water source of Dalongtan Reservoir, the water source of Lichuan First Water Plant, Qunfeng Reservoir, and the water source of Wanfu River, are all 100%, and they have all met the standards. According to The Hubei Province Three Lines and One Order Report, in Enshi Tujia and Miao Autonomous Prefecture, Yichang City, the drinking water sources in 2020 met the standard rate of 100% and 95%, so drinking water sources have a surplus of carrying capacity potential in Yidu, Changyang, and Wufeng.
4.1.3. Water Ecological Dimension
The ecological water-use rates of Enshi, Jianshi, Badong, Xuanen, Xianfeng, and Hefeng is loadable, while the ecological water use carrying capacity of Yidu, Changyang, and Wufeng is all overloaded (Figure 12).
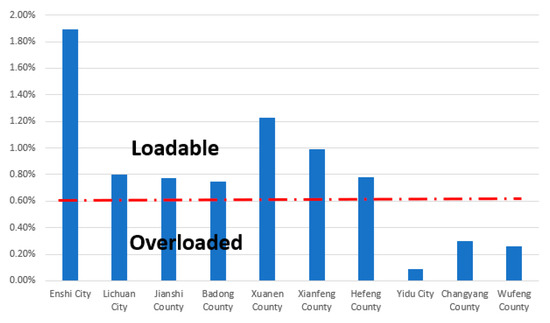
Figure 12.
Ecological water use-rate carrying status.
The ecological red line in the Qingjiang River Basin covers an area of 13,959 km2, and the city and county with the largest ecological protection red-line area is Hefeng, accounting for 1837.8 km2, 64.08% of the administrative area of Hefeng, and 13.16% of the ecological red-line area of the entire Qingjiang River Basin. The ecological red-line area is the smallest in Yidu, accounting for 128.7 km2, 9.48% of the administrative area of Yidu, and 0.92% of the ecological red-line area of the entire Qingjiang River Basin. The ecological red-line area of Jianshi, Yidu, and Changyang counties showed a deficit in the carrying capacity potential of the administrative area (Figure 13), with Yidu having the largest deficit of 67.30%.
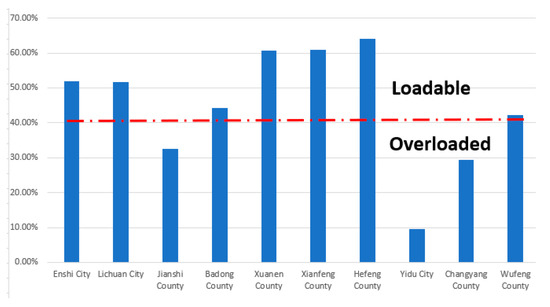
Figure 13.
Ecological protection red-line area share carrying status.
4.2. Integrated Evaluation
Overall, the comprehensive carrying capacity of water resources in Enshi is the strongest, followed by Lichuan, and Yidu is the weakest (Table 4). Water resources, water environment, and water ecology have different performance characteristics in each dimension of carrying capacity.

Table 4.
Integrated Evaluation of WRCC of the Qingjiang River Basin.
In terms of the carrying capacity of the water resources dimension, Lichuan has the strongest carrying capacity and is much higher than other counties, while Wufeng and Hefeng have the weakest carrying capacity. Although the efficiency of water resources development and utilization in Lichuan is not high, the amount of water resources still available is large, so its water resources have a strong carrying capacity for agricultural irrigation scale and urban construction land scale. The lowest carrying capacity of the water resources dimension in Wufeng is mainly due to the low efficiency of agricultural water use and the weak carrying capacity for agricultural development, while the main reason in Hefeng comes from industrial development.
In terms of the carrying capacity of the water environment dimension, the three counties of Changyang, Wufeng, and Yidu in Yichang, have the strongest carrying capacity, while Jianshi and Enshi have the weakest carrying capacity. The three counties of Yichang are within the carrying capacity of all indicators in the water environment dimension, among which the Yidu water environment shows a stronger carrying capacity for life, and Changyang and Wufeng show stronger carrying capacities for industry and agriculture. The water environment carrying capacity of Jianshi and Xianfeng is overloaded for industrial development, mainly for industrial total nitrogen discharge. The water environment carrying capacities of Badong, Hefeng, and Xuanen are overloaded for agricultural development for compound fertilizer, phosphate fertilizer, and nitrogen fertilizer, respectively. The water environment carrying capacities of Lichuan and Jianshi are overloaded for life.
From the carrying capacity of the water ecological dimension, Enshi far exceeds other counties, while Yidu has the weakest water ecological capacity. As the main functional area of agricultural products, Yidu will be in serious disorder if it is included in the key protection category of ecological functions of the Qingjiang River Basin, which also reflects that the evaluation of the carrying capacity of resources must be combined with the characteristics of the main functional positioning. However, combined with the current developments of the modern service industry, ecological agriculture, and ecological tourism, it is indeed necessary for Yidu to improve its water ecological carrying capacity and promote the organic combination of agriculture and water ecological tourism. The other nine counties all belong to the key ecological function areas, and the water ecology and water use rates in Changyang and Wufeng of Yichang City both need to be improved.
4.3. Evaluation of the Coordinated Development
All nine counties in the Qingjiang River Basin are at a high level of coupling and above, and only Yidu is at a low level of coupling. In order to better reflect the degree of synergy among the elements of water resources, water environment, and water ecology in the development process, the degree of coupling coordination is used for further analysis. The overall level of coupling coordination in the Qingjiang River Basin is low, and all of the counties are at the level of primary coordination or below (Table 5). Among them, 40% of the counties are in primary coordination level 50% of the counties are in the barely coordinated level, and 10% of the counties are in the serious dissonance level. From the spatial scale, the counties with high coupling coordination are located in the western part of the Qingjiang River Basin, and the coordination of counties in the central part toward the east and the north toward the south shows a decreasing trend (Figure 14).

Table 5.
List of coupling degree and coupling-coordination degree levels of the Qingjiang River Basin.
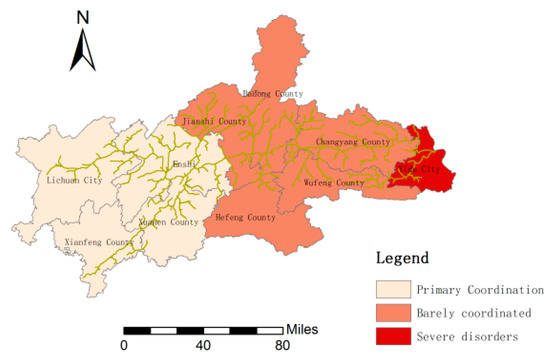
Figure 14.
Distribution of coupled coordination states of WRCC in the Qingjiang River Basin.
The shortage of water resources in the process of socioeconomic development of the Qingjiang River Basin also shows obvious spatial characteristics, from west to east, they are water environment lagging type, water resources lagging type, and water ecology lagging type. The western counties in the Qingjiang River Basin, such as Enshi, Lichuan, Jianshi, and Xianfeng, show water environment lagging type. Badong, Xuanen, and Hefeng show water resources lagging type. The eastern counties, such as Yidu, Changyang and Wufeng, show water ecology lagging type (Figure 15).
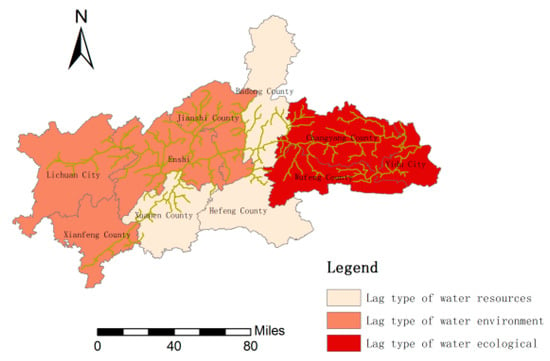
Figure 15.
Distribution of lagging types of coupled coordinated development of WRCC in the Qingjiang River Basin.
5. Conclusions and Recommendations
This paper takes into account factors such as the types of main functional areas, the multidimensional refinement index of “three water management together”, the “red line” control and the convergence of the spatial suitability evaluation of the national land, etc., and constructs an index system for evaluating WRCC of the Qingjiang River Basin from monomial evaluation, integrated evaluation, and coupled coordination analysis. This system provides reference for the evaluation of WRCC of other river basins, as well as the evaluation of the carrying capacity to industrial development, agricultural development, ecology, and life, etc. It also provides reference for the evaluation of the spatial suitability of the country and the optimal allocation of water resources. The main conclusions are as follows:
- (1)
- In terms of the individual indicators of each dimension, in the water resources dimension more than half of the areas in the Qingjiang River Basin are in a state of overload, among which Yidu has the lowest WRCC potential and is in an overdraft state, while Lichuan has the highest water resources carrying potential. In the water environment dimension, all areas in the Qingjiang River Basin have a good carrying capacity for industry, agriculture, and life, and the discharge of wastewater and its pollutants are within the carrying capacity except for some counties. The carrying capacity of agricultural surface pollution is within the carrying range except for in some counties, and the drinking water quality has reached the standard. It can be seen that although the Qingjiang River Basin is rich in water resources, it is still insufficient in terms of the development of the Yangtze River economic belt and even the whole country. The water environment and water ecology of the Qingjiang River Basin are generally good, which is consistent with the fact that the water quality has always maintained class two.
- (2)
- The comprehensive water resources carrying index has obvious spatial characteristics, that is, the comprehensive water resources carrying indices of the five counties in the southwest are significantly better than those of the five counties in the northeast. The lowest comprehensive water resources carrying index among the five counties in the southwest is 1.193 in Hefeng, which is higher than that of Wufeng (1.180), the highest comprehensive water resources carrying index among the five counties in the northeast, and the counties with better comprehensive WRCC are concentrated in the southwest area of the Qingjiang River Basin. The Qingjiang River Basin originates from Lichuan and flows through Enshi, Xuanen, and other regions. In terms of flow direction, the carrying capacity of water resources in the upstream region is better than that in the downstream region, which also reflects the importance of China’s implementation of cross-border pollution control policies to avoid unclear responsibilities.
- (3)
- The coordination degree of water resources carrying coupling of the ten counties in the Qingjiang River Basin is not high, essentially in the primary coordination or barely coordinated levels. Among them, Yidu, as the main functional area of agricultural products, will be in a state of disorder if it is included in the key protection of ecological functions in the Qingjiang River Basin. This also reflects that the evaluation of resource carrying capacity must be combined with the characteristics of the main functional positioning. In terms of spatial layout, areas with high coupling degree are distributed in the northwest, while areas with high coupling-coordination degree are located in the southwest. The distribution of coupling and coordination development types is more even, showing a 3:4:3 distribution among the three types of water resources lagging, water environment lagging, and water ecology lagging.
According to the results of monomial evaluation, integrated evaluation, and coupled coordination analysis of WRCC of the ten counties in the Qingjiang River Basin, the following recommendations are made in terms of “three water management together” and spatial layout.
- (1)
- Water resources lagging counties. Determine the upper limit of resource utilization and improve the level of resource utilization. Strengthen the management of total water consumption and utilization efficiency. Strengthen water resources planning management and demonstration, strictly manage water quotas, control the total amount of water used in agriculture and industry, reasonably adjust water resources fee-collection standards, and gradually market the paid use of water resources.
- (2)
- Water environment lagging counties. Adhere to the bottom line of water environment quality and promote the integrated prevention and control of water pollution. Establish a bottom-line management system for water environment quality, adhere to the integrated prevention and control strategy for point sources, surface sources, and mobile sources. Comprehensively rectify heavy-pollution industries; centrally manage industrial park water pollution; prevent and control livestock breeding. For aquaculture pollution, control agricultural surface pollution; accelerate the construction and renovation of urban sewage treatment facilities, comprehensively improve the rural environment, and strengthen the construction of supporting pipeline networks.
- (3)
- Water ecology lagging counties. Increase ecological protection and restoration and construct an ecological barrier in the Qingjiang River Basin. Promote ecological restoration in the watershed to ensure that biodiversity is not reduced, mitigate the ecological impact of hydroelectric power stations and other water conservancy projects, and take engineering and project-based measures to promote the river connectivity system. Increase ecological compensation for ecological function areas in the watershed, accelerate the reform of the ecological and environmental damage compensation system, and establish an industrial transfer payment system for nature reserves.
- (4)
- Optimize the spatial layout of the basin and reduce layout risks. Delineate the ecological protection red-line area, strengthen the graded and classified control of the red-line area, strengthen the management of general ecological space in the basin, and implement the negative list system for ecological and environmental access, establish Qingjiang River Basin National Park, and strengthen the protection of the originality and integrity of the natural ecosystem, optimize the industrial layout of the basin, and strengthen the prevention and control of environmental pollution at the source.
There are limitations to this analysis. For example, the data of some red-line indicators of counties are referred to in the Three Lines and One Order Report of Hubei Province, such as 10,000 yuan per GDP water consumption, which may not be particularly accurate to 10 counties. In addition, we used data from 2018 and did not consider the changes over a timeline. In the future, the dynamic simulation of WRCC under different scenarios of “three lines and one order” needs to be further studied.
Author Contributions
Conceptualization, Y.W. and R.W.; methodology, Y.W. and R.W.; validation, Y.W. and X.Z.; formal analysis, X.Z.; investigation, Y.W. and X.Z.; data curation, X.Z. and H.F.; writing—original draft preparation, R.W., Y.W. and X.Z.; writing—review and editing, Y.W. and R.W.; visualization, Y.W. and H.F.; supervision, R.W.; project administration, R.W.; funding acquisition, Y.W. All authors have read and agreed to the published version of the manuscript.
Funding
This research was funded by Ministry of Education Philosophy and Social Sciences Fund (No.19YJZH168), China Geological Survey (No. DD20190824), and the Fundamental Research Funds for the Central Universities, China University of Geosciences (Wuhan).
Institutional Review Board Statement
Not applicable. Our study did not involve humans or animals.
Informed Consent Statement
Not applicable. Our study did not involve humans or animals.
Data Availability Statement
The data on GDP come from Economic and Social Development Bulletins (http://www.enshi.gov.cn/sj/xstjgb/201908/t20190822_392416.shtml; http://www.lichuan.gov.cn/xxgk/gkml/tjxx/202101/t20210119_1092580.shtml; http://www.hbjs.gov.cn/xxgk/gkml/tjxx/tjgb/202010/t20201024_698454.shtml; http://www.enshi.gov.cn/sj/xstjgb/201908/t20190822_392424.shtml; http://www.enshi.gov.cn/sj/xstjgb/201908/t20190822_392427.shtml; http://www.enshi.gov.cn/sj/xstjgb/201908/t20190827_392437.shtml; http://www.enshi.gov.cn/sj/xstjgb/201908/t20190822_392432.shtml; http://www.enshi.gov.cn/sj/qztjgb/201904/t20190422_392338.shtml; http://www.yichang.gov.cn/content-61166-1009119-1.html) The data on total water resources, irrigation water consumption, industrial water consumption, ecological water consumption, and other indicators come from Enshi Tujia and Miao Autonomous Prefecture, Yichang Water Resources Bulletin (http://slj.enshi.gov.cn/xxgk/fdzdgk/qtzdgk/gsgg/201911/P020200708610834799092.pdf; http://shj.yichang.gov.cn/content-53126-956261-1.html) The data on industrial wastewater discharge, agricultural nitrogen fertilizer ap-plication, agricultural phosphorus fertilizer application, and agricultural compound fertilizer application are derived from Enshi Tujia and Miao Autonomous Prefecture, Yichang Statistical Yearbook in 2018 (http://tjj.hubei.gov.cn/tjsj/sjkscx/tjnj/gsztj/ess/202004/P020200428570343063955.pdf; http://tjj.hubei.gov.cn/tjsj/sjkscx/tjnj/gsztj/ycs/202004/P020200428521489448782.pdf). Part of the quota standard data refer to GB50137-2011 for urban land classifica-tion and planning and construction land, Hubei Water Resources Bulletin, etc. (https://baike.baidu.com/item/%E5%9F%8E%E5%B8%82%E7%94%A8%E5%9C%B0%E5%88%86%E7%B1%BB%E4%B8%8E%E8%A7%84%E5%88%92%E5%BB%BA%E8%AE%BE%E7%94%A8%E5%9C%B0%E6%A0%87%E5%87%86/1450420?fr=aladdin#2; http://slt.hubei.gov.cn/bsfw/cxfw/szygb/201911/P020191129404684816630.pdf). All website accessed on 26 August 2021.
Conflicts of Interest
The authors declare no conflict of interest.
References
- Bao, C.; Chen, X.J. The driving effects of urbanization on economic growth and water use change in China: A provincial-level analysis in 1997–2011. J. Geogr. Sci. 2015, 25, 530–544. [Google Scholar] [CrossRef] [Green Version]
- Veldkamp, T.I.E.; Wada, Y.; Aerts, J.C.J.H.; Döll, P.; Gosling, S.N.; Liu, J.; Masaki, Y.; Oki, T.; Ostberg, S.; Pokhrel, Y.; et al. Water scarcity hotspots travel downstream due to human interventions in the 20th and 21st century. Nat. Commun. 2017, 8, 15697. [Google Scholar] [CrossRef]
- Lu, S.; Zhang, X.; Bao, H.; Martin, S. Review of social water cycle research in a changing environment. Renew. Sustain. Energy Rev. 2016, 63, 132–140. [Google Scholar] [CrossRef] [Green Version]
- Hui, Y.H.; Jiang, X.H.; Huang, Q.; Xue, X.J. On System Dynamic Simulation Model of Water Resources Bearing Capacity in Duality Mode. Geogr. Res. 2001, 20, 191–198. [Google Scholar]
- Feng, S.Y.; Liu, G.Q. Frame of sustainable water resources utilization. Adv. Water Sci. 1997, 8, 301–307. [Google Scholar]
- Wang, G.; Xiao, C.L.; Qi, Z.W.; Meng, F.N.; Liang, X.J. Development tendency analysis for the water resource carrying capacity based on system dynamics model and the improved fuzzy comprehensive evaluation method in the Changchun city, China. Ecol. Indic. 2021, 122, 107232. [Google Scholar] [CrossRef]
- Peng, T.; Deng, H.W.; Lin, Y.; Jin, Z.Y. Assessment on water resources carrying capacity in karst areas by using an innovative DPESBRM concept model and cloud model. Sci. Total Environ. 2021, 767, 144353. [Google Scholar] [CrossRef] [PubMed]
- Xu, M.; Chen, M.; Li, Y.F.; Jiang, Y.G. Analysis of Water Resources Carrying Capacity of Coastal Cities along the Yangtze River Based on PSR Model. J. Coast. Res. 2020, 109, 110–113. [Google Scholar] [CrossRef]
- Kang, J.; Zi, X.; Wang, S.F.; He, F.Y. Evaluation and Optimization of Agricultural Water Resources Carrying Capacity in Haihe River Basin, China. Water 2019, 11, 999. [Google Scholar] [CrossRef] [Green Version]
- Wu, L.; Su, X.L.; Ma, X.Y.; Kang, Y.; Jiang, Y.N. Integrated modeling framework for evaluating and predicting the water resources carrying capacity in a continental river basin of Northwest China. J. Clean. Prod. 2018, 204, 366–379. [Google Scholar] [CrossRef]
- Cheng, K.; Fu, Q.; Meng, J.; Li, T.X.; Pei, W. Analysis of the Spatial Variation and Identification of Factors Affecting the Water Resources Carrying Capacity Based on the Cloud Model. Water Resour. Manag. 2018, 32, 2767–2781. [Google Scholar] [CrossRef]
- Bu, J.; Li, C.; Wang, X.; Zhang, Y.; Yang, Z. Assessment and prediction of the water ecological carrying capacity in Changzhou city, China. J. Clean. Prod. 2020, 277, 123988. [Google Scholar] [CrossRef]
- Jia, Z.; Cai, Y.; Chen, Y.; Zeng, W. Regionalization of water environmental carrying capacity for supporting the sustainable water resources management and development in China. Resour. Conserv. Recycl. 2018, 134, 282–293. [Google Scholar] [CrossRef]
- Chi, M.B.; Zhang, D.S.; Fan, G.W.; Zhang, W.; Liu, H.L. Prediction of water resource carrying capacity by the analytic hierarchy process–fuzzy discrimination method in a mining area. Ecol. Indic. 2019, 96, 647–655. [Google Scholar] [CrossRef]
- Zhou, X.Y.; Zheng, B.H.; Khu, S. Simulation platform of human-environment systems for water environment carrying capacity research. J. Clean. Prod. 2019, 250, 119577. [Google Scholar] [CrossRef]
- Zhang, J.; Zhang, C.L.; Shi, W.L.; Fu, Y.C. Quantitative evaluation and optimized utilization of water resources-water environment carrying capacity based on nature-based solutions. J. Hydrol. 2019, 568, 96–107. [Google Scholar] [CrossRef]
- Liu, B.; Liu, S. Coupling Analysis between Urban Green Space and Urban Development: A Case Study of Wuxi. Chin. Landsc. Archit. 2010, 26, 14–18. [Google Scholar]
- Xu, D.; Hou, G. The Spatiotemporal Coupling Characteristics of Regional Urbanization and Its Influencing Factors: Taking the Yangtze River Delta as an Example. Sustainability 2019, 11, 822. [Google Scholar] [CrossRef] [Green Version]
- Li, H.W.; Xu, E.Q.; Zhang, H.Q. Examining the coupling relationship between urbanization and natural disasters: A case study of the Pearl River Delta, China. Int. J. Disaster Risk Reduct. 2021, 55, 102057. [Google Scholar] [CrossRef]
- Yao, L.; Li, X.L.; Li, Q.; Wang, J.K. Temporal and Spatial Changes in Coupling and Coordinating Degree of New Urbanization and Ecological-Environmental Stress in China. Sustainability 2019, 11, 1171. [Google Scholar] [CrossRef] [Green Version]
- Wei, C.; Lin, Q.; Yu, L.; Zhang, H.; Ye, S.; Zhang, D. Research on Sustainable Land Use Based on Production–Living–Ecological Function: A Case Study of Hubei Province, China. Sustainability 2021, 13, 996. [Google Scholar] [CrossRef]
- Wang, M.; Wang, K.X. Exploring Water Landscape Adaptability of Urban Spatial Development Base on Coupling Coordination Degree Model A Case of Caidian District, Wuhan. Sustainability 2021, 13, 1475. [Google Scholar] [CrossRef]
- Zhao, Y.; Wang, C.L.; Yang, J.Q.; Bi, J. Coupling Model of Groundwater and Land Subsidence and Simulation of Emergency Water Supply in Ningbo Urban Area, China. J. Hydrol. 2021, 594, 125956. [Google Scholar] [CrossRef]
- Li, J.; Sun, W.; Li, M.; Meng, L. Coupling Coordination Degree of Production, Living and Ecological Spaces and its Influencing Factors in the Yellow River Basin. J. Clean. Prod. 2021, 298, 126803. [Google Scholar] [CrossRef]
- Wang, Y.M.; Zhou, X.D.; Bernard, E. Water environment carrying capacity in Bosten Lake basin. J. Clean. Prod. 2018, 199, 574–583. [Google Scholar] [CrossRef]
- Lu, Y.; Xu, H.; Wang, Y.; Yang, Y. Evaluation of water environmental carrying capacity of city in Huaihe River Basin based on the AHP method: A case in Huai’an City. Water Resour. Ind. 2017, 18, 71–77. [Google Scholar] [CrossRef]
- Li, N.; Yang, H.; Wang, L.C.; Huang, X.J.; Zeng, C.F.; Wu, H.; Ma, X.X.; Song, X.T.; Wei, Y.N. Optimization of industry structure based on water environmental carrying capacity under uncertainty of the Huai River Basin within Shandong Province, China. J. Clean. Prod. 2016, 112, 4594–4604. [Google Scholar] [CrossRef]
- Jia, R.N.; Jiang, X.H.; Shang, X.X.; Wei, C. Study on the Water Resource Carrying Capacity in the Middle Reaches of the Heihe River Based on Water Resource Allocation. Water 2018, 10, 1203. [Google Scholar] [CrossRef] [Green Version]
- Yang, L.-J.; Yang, X.-R.; Wei, W.; Pan, J.-H. Spatio-temporal evolution and influencing factors of water resource carrying capacity in Shiyang River Basin: Based on the geographical detector method. Water Supply 2020, 20, 1409–1424. [Google Scholar] [CrossRef] [Green Version]
- Dai, D.; Sun, M.D.; Lv, X.B.; Lei, K. Evaluating water resource sustainability from the perspective of water resource carrying capacity, a case study of the Yongding River watershed in Beijing-Tianjin-Hebei region, China. Environ. Sci. Pollut. Res. 2020, 27, 21590–21603. [Google Scholar] [CrossRef] [PubMed]
- Su, X.B.; Li, X.G.; Zhao, J.F. Research on the carrying capacity of water resources.system under the coupling of water resources and water environment threshold. Resour. Sci. 2018, 40, 1016–1025. [Google Scholar]
- Feng, L.H.; Zhang, X.C.; Luo, G.Y. Application of system dynamics in analyzing the carrying capacity of water resources in Yiwu City, China. Math. Comput. Simul. 2008, 79, 269–278. [Google Scholar] [CrossRef]
- Li, G.; Jin, C. Fuzzy Comprehensive Evaluation for Carrying Capacity of Regional Water Resources. Water Resour. Manag. 2009, 23, 2505–2513. [Google Scholar]
- Zhang, Z.; Lu, W.X.; Zhao, Y.; Song, W.B. Development tendency analysis and evaluation of the water ecological carrying capacity in the Siping area of Jilin Province in China based on system dynamics and analytic hierarchy process. Ecol. Model. 2014, 275, 9–21. [Google Scholar] [CrossRef]
- Yang, J.; Lei, K.; Khu, S.; Meng, W. Assessment of Water Resources Carrying Capacity for Sustainable Development Based on a System Dynamics Model: A Case Study of Tieling City, China. Water Resour. Manag. 2015, 29, 885–899. [Google Scholar] [CrossRef]
- Wang, T.; Xu, S. Dynamic successive assessment method of water environment carrying capacity and its application. Ecol. Indic. 2015, 52, 134–146. [Google Scholar] [CrossRef]
- Ren, C.; Guo, P.; Li, M.; Li, R. An innovative method for water resources carrying capacity research e Metabolic theory of regional water resources. J. Environ. Manag. 2016, 167, 139–146. [Google Scholar] [CrossRef]
- Wang, R.; Cheng, J.; Zhu, Y. Evaluation on the coupling coordination of resources and environment carrying capacity in Chinese mining economic zones. Resour. Policy 2017, 53, 20–25. [Google Scholar] [CrossRef]
- Wang, C.; Hou, Y.; Xue, Y. Water resources carrying capacity of wetlands in Beijing: Analysis of policy optimization for urban wetland water resources management. J. Clean. Prod. 2017, 161, 1180–1191. [Google Scholar] [CrossRef]
- Zhang, M.; Liu, Y.; Wu, J.; Wang, T. Index system of urban resource and environment carrying capacity based on ecological civilization. Environ. Impact Assess. Rev. 2018, 68, 90–97. [Google Scholar] [CrossRef]
- Cui, Y.; Feng, P.; Jin, J.; Liu, L. Water Resources Carrying Capacity Evaluation and Diagnosis Based on Set Pair Analysis and Improved the Entropy Weight Method. Entropy 2018, 20, 359. [Google Scholar] [CrossRef] [PubMed] [Green Version]
- Yang, Z.; Song, J.; Cheng, D.; Xia, J.; Li, Q.; Muhammad, I.A. Comprehensive evaluation and scenario simulation for the water resources carrying capacity in Xi’an city, China. J. Environ. Manag. 2019, 230, 221–233. [Google Scholar] [CrossRef] [PubMed]
- Fu, J.; Zang, C.; Zhang, J. Economic and resource and environmental carrying capacity trade-off analysis in the Haihe River basin in China. J. Clean. Prod. 2020, 270, 122271. [Google Scholar] [CrossRef]
- Wu, D.; Zou, C.X.; Lin, N.F.; Xu, M.J. Characteristic Analysis of Ecological Status in the Yangtze River Economic Belt Based on the Plan for Major Function-oriented Zones. Resour. Environ. Yangtze Basin 2018, 27, 1676–1682. [Google Scholar]
Publisher’s Note: MDPI stays neutral with regard to jurisdictional claims in published maps and institutional affiliations. |
© 2021 by the authors. Licensee MDPI, Basel, Switzerland. This article is an open access article distributed under the terms and conditions of the Creative Commons Attribution (CC BY) license (https://creativecommons.org/licenses/by/4.0/).