Abstract
The world is facing economic, as well as social, crisis due to the COVID-19 pandemic. Implementing sustainable practices is one of the possible ways to address these issues. Adopting circular oriented techniques throughout the supply chain not only guarantees economic profitability, but also provides an edge to the organization in the market of fierce global competition. The concept of implementing circularity in the supply chain is novel and dynamic in nature, and it involves certain risk. In this study, a Bayesian Network methodology is adopted to analyze how the risk propagation takes place in a circular supply chain network of an automobile organization. The circular supply chain network consists of a group of manufacturers, retailers and recyclers, located in the Delhi–NCR region. Economic, environmental, social, technological, waste management, agile vulnerability, and risk of cannibalization are the major risk categories that were identified through an extensive literature review. Further, the impact of risk on the performance of the circular supply chain is analyzed by considering performance parameters such as lost sales, impact on supply chain revenue, and inventory holding cost. Risk exposure index is incorporated into the study to analyze the vulnerability of each node. The findings of the study reveal that the reverse side of the circular supply chain can be a source of risk propagation during the implementation of the circularity concept. This work is carried out under a single industry domain. In the future, risk propagation analysis can be examined in the supply chain of other sectors. The findings of the study can assist the supply chain managers and the risk experts to focus on the areas that are more vulnerable to risk.
1. Introduction
The world is moving towards digitization in this pandemic era [1]. Digitization is good in many senses, but whether it is sufficient to meet the needs of the customer is unknown [2]. Customers require resources. This pandemic has majorly hit the logistics services all over the globe [3]. Logistic services are not only affected at a major global level, but at the domestic level too. Due to this, there is an imbalance created between the supply and demand of resources [4]. This imbalance has led to the evolvement of several risks occurring throughout the complete supply chain cycle [5]. One of the major risk occurring is the shortage of resources, thereby leading toahigh selling price [6]. In some situations, production and consumption is normal, but the finished product inventory still has a rising graph, due to missing logistics [7]. Disruptions in the supply of the right quantity of raw material, at the right time, having the right quality may lead to a delay in production, which may affect the entire supply chain cycle [8]. The global crisis of COVID-19 has ravaged the world economy, and has created an atmosphere of fear and panic buying among customers [3].
A pandemic is a period of uncertainty [9]. It is difficult to predict the occurrence and severity of the disruption in the supply chain during the pandemic phase [10]. Looking at the uncertain environment, there is a need of prior planning for the measurement and mitigation of risks occurring at every stage of the supply chain. Sustainability is one of the solutions to deal with these disruptions. Sustainability should not only be adopted during the product development phase, but it should also be an indispensable part of consumption [7]. The shortage of resources, and high demand and high prices of products during the pandemic phase has taught us how to use resources in hand wisely. So, there is need to incorporate such a business model that can optimize the usage of input resources, and simultaneously reduce the wastage [11,12]. A circular economy (CE) is one such business approach that can minimize the wastage of input resources and increase the life of products [13]. CE is based on the ideology of reduce, reuse, and recycle [14]. After its end-of-life, the product needs to be disposed of, in order to extract the maximum value retained after it has been discarded [15]. The process of disposition requires the involvement of supply chain (SC) partners who are expert in their respective domain [16]. CE not only requires an efficient production and logistics system, but also entails a well-organized disposition system [17]. The concept of CE, when apprehended with a supply chain, gives the building of a new term called circular supply chain (CSC).
The concept of CSC is novel, and is seen as a major research interest among the supply chain practitioners, academicians, and industry experts [18,19,20]. CSC involves the forward, as well as reverse, flow of product constituting a cycle comprising various supply chain partners [21]. Enterprises planning to switch towards CSC need to involve more partners, thus exposing the supply chain to several risks [22]. Risk is unpredictable by nature, and firms need to be aware of its occurrence and severity. It may originate at one branch of the supply chain and create a cascading effect on sub-branches, generating further risk with severe impacts [23]. This cascading phenomenon of disruption propagation along the chain of network is known as a ripple effect [24]. Failure, due to risk encountered at any node, can cause the entire system of SC to collapse [25]. Therefore, enterprises should understand the interdependency among the partners, plan for these disruptions, and redesign their SC accordingly.
Risk management is inevitable for achieving a high degree of circularity in SC. Risk management involves the identification, modeling and mitigation of risk at various levels of SC. Measuring circular supply chain (CSC) disruptions, and the impact on the sustainable performance of the CSC, is still lacking in the existing literature [26]. Therefore, a comprehensive review of the literature on supply chain risk management (SCRM), pertaining to CE, leads to the identification of gaps and a basis of research in the novel area of CSC.
Tang [27] reviewed various quantitative models for managing forward supply chain risk. The authors also related various SCRM strategies that were examined in the literature with actual practices. Jüttner et al. [28] reviewed the literature on supply chain vulnerability and the management of forward supply chain risk, and compared the findings to develop suitable SCRM strategies. Fan and Stevenson [29] provided a broad and contemporary understanding of SCRM, and presented a comprehensive definition, covering the process, pathway, and objectives of SCRM, leading to a conceptual framework. Past research reveals that risk management approaches have only been applied in the forward direction of the supply chain [30]. Risk identification and propagation in the reverse direction is still missing in the current literature of SCRM. Therefore, an effort has been made to identify and analyze the various kinds of risk, their probability of occurrence, and their impact on the SC performance in the forward, as well as in the reverse, direction. In this regard, a circular supply chain (CSC) risk framework has been developed, in order to generate risk profiles of the various partners involved. Hence, the research aims to present the holistic view of risk propagation in the circular supply chain network in the pandemic era. The following research objectives are set to achieve the desired aim:
- To develop a circular supply chain risk framework, in order to generate risk profiles of various CSC partners;
- To study the disruption caused due to the occurrence of various risk on the performance of CSC,
- To develop a risk exposure index (REI) for the identification of vulnerable nodes in the CSC network.
In this study, the Bayesian network (BN) methodology is adopted, to develop a probabilistic graphical model using the empirical data obtained from the interviews conducted with the risk experts of ten CSC partners of an Indian auto parts manufacturing company. The main reason to incorporate the BN methodology is to develop a framework of risk assessment, by generating individual risk profiles of all the CSC partners involved with the SC of the company. Most of the applications of BN have flourished in other areas of risk aversion, but in the field of supply chain risk management, only a few models are proposed [31]. Through the application of the BN methodology, the study is able to demonstrate how risk propagation takes place across the CSC network, and the disruption caused at individual SC nodes.
The remaining part of the paper is structured as follows. A review of the literature on circular economy and circular supply chain, its associated risk, and previous models of risk assessment have been provided in Section 2. Section 3 comprises the overview of the BN methodology. Section 4 includes the case illustration and data collection. Section 5 “Modeling and discussion” consists of the formulation and analysis of the BN model, and the analysis of the risk impact on the various performance parameters of the CSC. The managerial implications of the study are discussed in Section 6. Finally, the paper concludes with the key findings, limitations, and future scope of the research in Section 7.
2. Literature Review
This section discusses the literature related to the studies conducted in the area of the circular economy, circular supply chain, risk associated with its implementation, and proposed criteria of measurement.
2.1. Circular Economy and Circular Supply Chain
Boulding [32] first introduced the meaning of circularity in the supply chain. The author explained that for the maintenance of sustainability on the planet Earth, it is necessary to build a circular system, in which material can flow in a closed loop to avoid wastage of useful resources. Pearce and Turner [33] compared the shifting of a conventional open-ended system into a circular system, with the results of the second law of thermodynamics. Thierry et al. [34] proposed the concept of product recovery management, in which various aspects of reverse logistics are integrated into the SC model.
Circular economy (CE) is a systematic approach that optimizes the utilization of resources, thereby decoupling the economic growth and environmental damage [35]. Su et al. [36] elucidated that the focus of the circular economy gradually extends beyond issues related to material management, and covers other aspects, such as energy efficiency and conservation, land management, soil protection, and water conservation. The report of Ellen MacArthur [37] recalls circular economy as “an industrial system that is restorative or regenerative by intention and design’’. European Commission [38] also entails CE as an economy “where the value of products, materials, and resources is maintained in the economy for as long as possible, and the generation of waste is minimized’’.
The CSC is also sometimes referred to as a closed-loop production and consumption model that restrains the externalities of environmental-related activities. Ghisellini et al. [39] argued that reformation of all the processes encompassing the life cycle of a product can extract the maximum possible material and energy, thereby improving the economic, environmental and social condition. Farooque et al. [40] performed a structured literature review in order to categorize different supply chain sustainability concepts that conceptualize a unique definition of circular supply chain management (CSCM). Bressanelli et al. [41] identified some of the challenges in redesigning the supply chain for CE, and it took multiple case studies to examine how these challenges appear in practice and how companies tackle them. Lahane et al. (2020) highlighted research trends, gaps, and potential research directions for future studies in the field of CSCM. Chhimwal et al. [42] identified and analyzed the sustainability-based challenges that are faced during the implementation of the circularity concept, in context to developing economies.
The quest for circularity is acknowledged as a useful strategy in order to deal with the sustainability-related challenges that are faced by the global supply chain [43]. It enhances the competitiveness among the global companies, and also bestows them an economic advantage [44]. CSCs are more vulnerable to risk than conventional linear supply chains, as these have more points of possible disruption, due to an extended chain of partners. Therefore, identification, analysis, and mitigation of risk is necessary, in order to improve CSC performance.
Through the analysis of several research and review articles in the field of CSCM, an attempt has been made to distinguish between typical SC risk and CSC risk.
2.2. Typical Supply Chain Risk vs. Circular Supply Chain Risk
Supply chain-related risk and risk management approaches have been extensively explored in the past [45]. Typical supply chain risk involves disruption from the supplier side, which includes supply delay, quality-related problems, limited capacity of raw material, dependency on selected suppliers, frequent changes in the design of products, and liquidity of material from the supplier side [46]. Apart from supplier risk, there is procurement risk, which involves volatility in currency exchange rates, piling up of inventories due to the bullwhip effect [47], and stock-out due to logistics failure [48]. Also, there are demand-related risks that arises due to an inaccuracy in forecasting, and frequent variations in the demand and distortion of information during communication [49]. Most of the literature related to supply chain risk management (SCRM) is focused on the forward aspect, rather than considering the reverse side of the supply chain [50]. In order to understand how the implementation of circularity in the supply chain can expose it to a variety of risks, the existing literature on SCRM does not address this question.
However in the recent time, the identification of risk during the implementation of circular economy in SC is gaining attention among the researchers, because of its huge economic advantage and less environmental damage [51]. Keeping in view the current pandemic situation, this study aims to explore the literature related to risk management for the maintenance of sustainability throughout the SC. There are several other CSC risks, such as waste management risk that involves health-associated risk to society [52], and heavy penalties imposed on the organization, due to the improper disposal of waste [53].
In the circular supply chain, the 6R (reuse, repair, refurbish, remanufacture, recycle, redesign) operations can be performed in house or outsourced to a specialized outsourcing partner. Outsourcing of these operations involves a variety of risks, which include disruptions of other internal activities, loss of the competitive base, opportunistic behaviors, rising transaction and coordination costs, and higher procurement costs. Since in a CSC there are numerous SC partners that are involved in achieving circularity of the flow of material [54], a high level of coordination has to be maintained in order to achieve improved circularity [55]. The CSCs are exposed to a variety of coordination risks that may include distortion during the sharing of valuable information, issues of trust among the partners, commitment failure, and a lack of risk sharing among the partners. He and Zhang [56] stated that a particular degree of relationship should exist among the SC members, as a means to share risk that results in a higher business performance than would be achieved by the firms individually.
With the introduction of a circular business model, the demand of new and long-lasting products increases, and it may lead to reduced sales of the previous products, which is commonly referred to as the risk of cannibalization [57]. Being unable to respond to agile changes is another potential issue while introducing a circular business model. This is also sometimes termed as agile vulnerability [58].
The major categories of supply chain risk that have been identified in the past are summarized and enlisted in Table 1. Only those categories of risk that are critical, from the aspect of achieving circularity in the supply chain, are further utilized in developing a CSC risk framework. Risk identification is the first step where all the possible CSC risks are identified with taxonomies, checklists, and mapping of conventional risk. These identified risks are then assessed, in terms of their likelihood of occurrence and their impact on CSC performance. The next subsection provides a review of the various types of statistical models that have been used for the assessment of typical SC risk in the past.

Table 1.
Risk Topology.
2.3. Risk Assessment Model
In the past, many authors have worked in the area of risk measurement, and various methodologies have been proposed to measure uncertainty and risk in the supply chain. Most of the risk assessment techniques have been applied for the selection of suitable suppliers, and, in several cases, the analytical hierarchy process (AHP) has been employed, for the effective decision making to evaluate various kinds of risk [59]. The AHP is utilized specifically in those decision-making processes in which each decision is assigned a risk score, which is calculated by multiplying the likelihood of its occurrence with the risk impact [60]. Chen and Wu [61], in their study, suggested the modified failure mode and effect analysis (MFMEA) method for the evaluation of new suppliers, and utilized the AHP method to determine the weights of each criterion and sub-criterion during supplier selection. Giannakis and Papadopoulos [62] identified thirty risks across three main pillars of sustainability (environmental, social, and economic), and thereafter applied failure mode and effect analysis (FMEA) to assess the relative importance of selected risks, and also to find the potential correlation between them. Tuncel [63] investigated disruption factors of the SC network, using failure mode effect and critical analysis, and integrated the procedures of risk management using the Petri net-based simulation.
The concept of fuzzy logic has also been applied in various risk models, to ease the decision-making process in an uncertain environment [64]. Paksoy et al. [65] proposed a new fuzzy linguistic risk assessment approach, to assess supplier risk during the outsourcing of lean and green activities. Hu et al. [66], in their study, utilized FMEA and fuzzy AHP to evaluate the risk of green components in compliance with the European Union restriction of hazardous substances. Hosseini et al. [67] utilized the discrete-time Markov chain (DTMC) and dynamic BN methodology for the modeling and simulation of propagation behavior of supplier disruption in SC.Faisal et al. [68] utilized an interpretive structural modeling (ISM)-based model, in order to determine the relationship among various enablers of supply chain risk mitigation. Table 1 enlists the various categories of risk identified, the areas in which these risk occur, and the methodology adopted to identify and assess these risks.
Although risk models developed in the past are an attempt to solve the problem of measuring risk in the supply chain, there are still some gaps left in the existing literature, which need to be addressed [69]. The existing models of risk assessment are used on a narrow scale, which are localized to a specific industry or specific sector. Most of the supply chain risk models did not consider the outcome of risk propagation to other sectors. This leads to the local optimization of problems within the supply chain. Another important gap in the existing literature is that the risk models are not implanted in a wider framework of risk assessment, for the purpose of generalizing and adding different risk measures, which are to be deployed for a specific situation. The CSC demands a much wider look of risk assessment, in which various partners are involved, from different sectors that play a crucial role in achieving circularity in the whole system oftheSC network.
Through the exhaustive survey in the area of SCRM, this study is able to enlist various categories of risk, and broadly classify them into typical SC and CSC risk. Literature pertaining to the past application of various risk assessment models in the area of SCRM has also been studied and discussed. It is observed that the BN methodology has a few applications in the area of SCRM [31,74,75]. The BN methodology can be applied for the assessment ofthecascading effect of disruptive events [76,77]. The unique ability of this approach to model the network of risk in an interconnected structure of complex SC system, encourages its adaptation as a preferred research methodology forthemodeling of CSC risk.
3. Bayesian Network Methodology
The Bayesian network (BN) model was first proposed by Pai et al. [78], who employed this model in solving the issues of uncertainty and risk in the supply chain. This modeling technique has been in existence for the last two decades, and many researchers have used this technique to model risk in different fields of the SC. For example, there are numerous studies that make use of this technique in decision support systems [79]. Chen [80] demonstrated how the BN can be used to manage supply chain uncertainty. The BN has also been used in the field of operation management, to model risk that is related to the threat of IT infrastructure [81], business lines, construction project schedules [82], and due-date assignments [83].The BN is also used with some of the forecasting techniques, to mitigate risk in the SC [84]. Risk mitigation analysis in the marketing sector has also seen the application of the BN technique [85]. Service sectors that are exposed to risk, owing to weak profit dissemination throughout their chain of workers, utilize the BN model for improving their coordination mechanisms [86]. While the application of the BN has flourished in diverse areas of risk management, in the field of CSC only a few models are proposed. Most of the SCRM studies utilizing BN models were not able to map specific risk at specific locations throughout the network of SC, and did not clearly demonstrate the dependencies, proliferation and consequences of these risks.
The BN can be understood as a directed graphical model or a probabilistic dependency model, illustrating a causal relationship among variables and key factors, which finally leads to one or more outcomes in a system [75]. The BN model consists of finite nodes that are connected through directed arcs, which show the conditional probability dependence of individual factors on the dependent variable. An arc connects an independent variable X to a dependent variable Y, and is represented as (X,Y), which implies the direction of the arc from X to Y. In this causal relationship, the independent variable X is also sometimes called the parent node, and the dependent variable Y is termed as the child node. Nodes are considered to be an independent random variable, as their value depends on the situation (system state) in which they arise. An independent variable may consist of any number of possible states. It is advisable to use as few as possible to make the computation of the problem simpler. The node can be a latent variable or it may be hypothetically derived.
BN analysis may be qualitative, quantitative, or both, depending on the scope of analysis. The BN typically consists of the following two primary components: a subjective causal relationship and objective conditions that are fulfilled using probability distribution. Continuous probability distribution can also be used in a Bayesian network, but it will make the problem more complex.
An important advantage of using Bayesian methodology is the flexibility to update the subjective probability with the increase in the number of evidences. Subjective probability is a measure of an individual belief in the occurrence of an event. This probability is divided into two phases, and is given the name prior probability and posterior probability. Let us assume that the subjective probability of the occurrence of an event E is represented as Pr(E). This is called the prior probability of occurrence, or degree of belief of an event E before the analyzer gets access to additional data D1. On gaining access to the data D1 that contains information pertaining to event E, the analyzer can quote the updated probability by using Baye’s formula.
This updated subjective probability of occurrence, which is represented as Pr(E|D1), is called posterior probability. The main reason to incorporate the Bayesian methodology into the study of risk analysis is to model the network of influencing factors, which can lead to a single outcome that will help in generating an individual risk index for the various partners involved in a circular supply chain.
4. Case Illustration
This section comprises the application of the proposed technique in solving sustainability issues for an automobile manufacturing company located in Delhi–NCR in India. In this section, a detailed description of the case study, problem formulation, and data collection is provided.
4.1. Company Profile and Problem Description
This study constitutes a case example of an automobile manufacturing companythat is involved in the manufacturing and assembling of farm tractors, with all its plants located in the Delhi–NCR region. The company is a leading manufacturer of farm tractors, with a manufacturing capacity of 98,940 tractors/annum, which is the highest in Asia at one location. The manufacturing operations are divided into the following three plants: component plant, tractor assembly plant, and crankshaft and hydraulic plant. This study considers gear manufacturing as a major sustainability concern for the company, as it involves some intricate machining processes, and the company is facing some serious challenges related to wastage minimization and optimizing resource input. The complex industrial environment demands a manufacturing system to rapidly adjust itself to uncertainties and changes. Therefore, this study aims to provide sustainability-based CE solutions to minimize the uncertainties that are faced by the company, due to rapid product innovations and scarcity of resources during the pandemic phase.
The process of the manufacturing of gears involves some intricate manufacturing processes. For the purpose of economic and environmental benefits, the reusability of production waste is highly desirous to overcome sustainability-related challenges during manufacturing operations. The interconnected flow of material in the day-to-day manufacturing and SC operations is one of the CE initiatives to help overcome sustainability issues. The adoption of CE in manufacturing and SC operations can encourage the reuse and recycling of material, and simultaneously reduce the wastage of resources. The entire manufacturing and supply chain operation is interconnected by developing a circular loop of material flow (Figure 1) using 6Ds (design, develop, deliver, detect, dismantle, discard) and 6Rs (reuse, repair, refurbish, redesign, remanufacture and recycle). By adopting circularity into the production and supply chain operations, using 6Ds and 6Rs, the wastage of resources can be minimized, and the company can easily deal with the uncertainties arising due to economic, environmental and social issues.
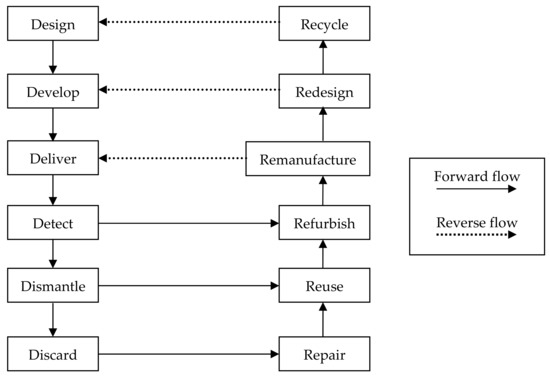
Figure 1.
Circular flow of product.
4.2. Data Collection
The data were gathered by a group of representatives of ten CSC partners, which included four manufacturers, three retailers/sellers, and three recyclers, in the Indian automobile parts manufacturing industry. These CSC partners were located in the National Capital Region (NCR) of India. These partners have a close connection, and are collectively working to improve the sustainability of production and consumption in the automobile parts manufacturing industry. The period of data collection was from November 2020 to March 2021. The data collection was conducted in three stages. In the first stage, the partners were informed about the benefits of implementing circular strategies in their SC operations. Secondly, a self-assessment online data collection platform was created and distributed among the partners through e-mail. The third stage of data collection consisted of conducting interviews with the supply chain managers of the manufacturing company working in the area of risk management. These interviews were conducted online, in order to cross-verify with the data that were collected through the supply chain experts. Finally, a five-point Likert scale was used to rate the different risk measures that were taken into consideration in the study, and, thereafter, a risk profile was generated for each of the partners involved in the CSC operations.
5. Modeling and Discussion
This section is divided into three sub sections. The first sub section consists of the formulation and analysis of the BN model that was used to generate the risk profiles of various CSC partners. The next sub section consists of the effect analysis of these risks on the various performance parameters of the CSC. The last sub section comprises the risk exposure index (REI) that indicates the extent to which an individual CSC partner is exposed to various categories of risk.
5.1. Risk Measurement Model
The risk assessment model consists of a cluster of measures and scales, used to compute the probability of the occurrence of each risk construct. The measures of each risk category were incorporated, taking the key events that could have a direct impact on the risk into consideration. Further, these risk measures and scales are utilized to generate the risk profile of individual CSC partners. The risk profile represents the disruption caused by a particular CSC partner when a cluster of risk events occurs under a certain condition. The disruption not only affects the individual partner, but has an impact on the complete supply chain. In the case of the circular supply chain, all the partners are connected through a cycle. Therefore, if any disruptive event occurs, it will affect each of the partners that are involved in the cycle. In the study, certain parameters that may be used to check the performance of the CSC are considered, with regards to the risk assessment model under consideration. These are the partners risk impact on SC revenue, lost sales, and inventory holding cost. The probability of risk impact of an individual partner is used to analyze the effect on these performance parameters. Each individual partner has a distinctive effect on these parameters that illustrate the performance of the CSC.
For the purpose of risk analysis, the BN methodology is used to generate a risk profile of each of the CSC partners. This network model is used to compute the probability of risk impact that an individual partner could have on the complete supply chain. Economic, environmental, social, technological, waste management, agile vulnerability, and risk of cannibalization are some of the risk categories that were identified through the extensive literature review that is provided in Table 2. The level of risk for each risk category was computed using the prior probabilities of individual risk events. Finally, the estimated subjective probability of each category of risk was used to generate the risk profile of the CSC partners. A schematic diagram of the BN model is shown in Figure 2.
Table 2.
CSC risk hierarchy for Bayesian analysis.
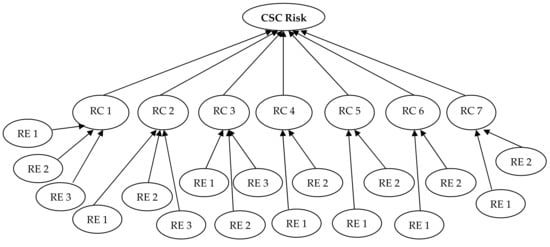
Figure 2.
CSC risk network framework.
The first and foremost task in the development of the Bayesian model is to identify the end nodes in a clear and explicit way. These end nodes contain the various categories of risk that have been identified through a comprehensive literature survey. Each category of risk is a function of certain risk events. These risk events are further dependent on the risk measure. These risk measures are the backbone of the BN model, and are sometimes referred to as the parent node. Table 2 depicts the hierarchal structure of the BN model, comprising various categories of risk, their individual risk events, and the risk measuring factors.
When the state of every individual node is defined, the arc needs to be drawn, connecting the nodes, and the probability should be assigned to the individual node. The process of assigning probability should start from the root node. After the root nodes are completely assigned, the process of assignment should move to the next level. The conditional probability table (CPT) of these nodes is computed, with the help of the probabilities assigned to the parent node. This process continues until all the nodes of each level are assigned with a conditional probability. With the establishment of all the CPTs of each node, this process gets completed. The value of the CPT that is assigned to the root node may come from an expert judgment, from an external data source, or a combination of both.
5.2. Results and Discussion
The priori probability for each of the risk events depends on the value of the individual risk measure. These risk measures are assigned values, through various experts and supply chain managers.The probabilities for 17 supply chain risk events that affect economic, environmental, social, technological, waste management, agile vulnerability, and risk of cannibalization, are presented in Table 3, for each CSC partner. The values of the probability of individual risk events are used to generate the risk profile, using the Bayesian network. Table 4 provides the occurrence probability of each of the categories of risk for the individual CSC partners.
Table 3.
A priori probabilities for 17 circular supply chain risk events.
Table 4.
CSC partner risk profiles.
The occurrence probability of each risk is based upon the scenario in which the events of risk occur. The combination of parent risk events associated with a child node is called a scenario. The total number of scenarios associated with a node is 2n, where n represents the total number of risk events that are linked to the node. For example, in order to compute the occurrence probability of the economic risk associated with manufacturer 1 (M1), the total number of possible scenarios is 23, i.e., eight, since there are three risk events that define economic risk. Therefore, a combination of eight scenarios (000, 001, 010, 011, 100, 101, 110, 111) is possible, which is used to compute the probability of the occurrence of economic risk. These eight scenarios can be represented as a combination set, comprising of zero and one. Zero denotes that the event of risk has not occurred, while one denotes that the risk event has occurred. This study incorporates the scenario in which all the risk events have occurred simultaneously, pertaining to a particular category of risk. This combination is chosen in order to compute the maximum possible disruption a particular type of risk could cause to a supply chain. The probability of the occurrence of economic risk for manufacturer 1 can be computed using the following formula:
This formula can also be used to compute the probability of the occurrence of other categories of risk that are associated with different CSC partners. Table 4 reveals that manufacturer 3 (M3) and recycler 1 (Re1) have the highest overall probability of risk impact on the performance of the CSC; while retailer 1 (Rt1) has the lowest probability of risk impact. From Table 4, it can be concluded that recyclers have a greater risk impact on the overall performance of the CSC, and therefore, they need special attention from the perspective of risk mitigation.
5.3. Effect Analysis and Discussion
This subsection includes the effect analysis of the risk encountered during the implementation of the concept of circularity, on various performance parameters of the supply chain of the Indian automobile organization that was considered as the case illustration. For the purpose of analysis, a multi-echelon system is chosen, consisting of a group of manufacturers, retailers, and recyclers that are part of circular supply chain of a leading automotive organization in India. The following parameters are analyzed for the comprehensive understanding of the disruption caused due to various risk on CSC performance.
5.3.1. Inventory Holding Cost
In a conventional multi-echelon system, having linear flow of material, the inventory holding cost increases as we move downstream in the supply chain [47]. The holding cost of raw material or work in process inventory is lesser than the cost incurred in holding finished goods inventories; while in the circular supply chain, the holding cost of recycled raw material on the reverse side is comparatively more, as it includes the cost of the collection and sorting of material from used products, and the cost of recycling operations. Any disruption caused on the reverse side of the supply chain will affect the production of recycled raw material, ultimately leading to a shortage of raw material for the manufacturer. Therefore, the bottleneck (at recycler end) has a higher backup of inventory (used products), as disruption propagates from the recycler to the manufacturer and the retailer. In the case of the CSC, the inventory holding cost for each of the retailers is found to be minimum (Figure 3a), because they have the least disruption impact on the overall performance, and, therefore, the requirement of an inventory is also low at the retailer end. Let us take an example of retailer 2. It can be seen from Table 4, the ‘overall probability of risk impact’ for retailer 2 is 0.45. Now, taking the values of the ‘annual demand rate’ and ‘inventory holding cost per unit’ for ‘Retailer 2’, from the risk register of the organization, is considered as the case illustration. The total inventory holding cost (TIHC) per year for ‘Retailer 2’ can be computed as follows:
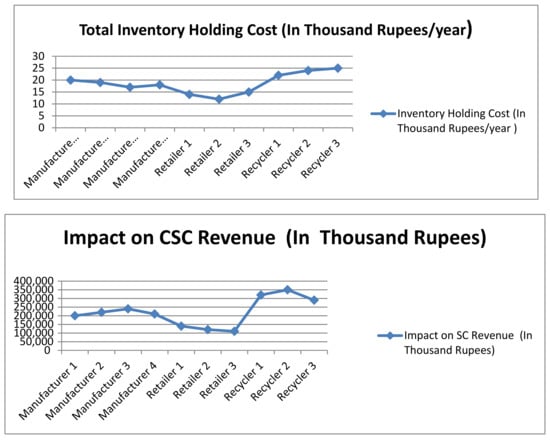
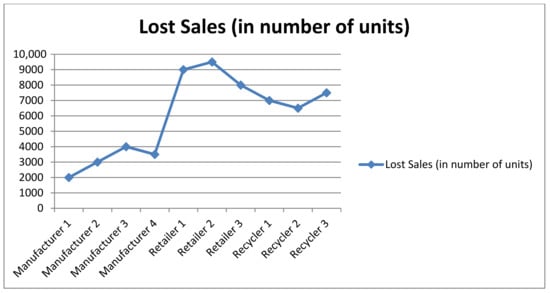
Figure 3.
(a) Holding cost for CSC partner. (b) Impact of partners on CSC revenue. (c) Lost sales in CSC.
TIHC = overall disruption probability of retailer 2 × annual demand rate × inventory holding cost per unit;
TIHC = 0.45 × 10,000 × 2.7;
TIHC = 12,150.
Similarly, the value of TIHC for other CSC partners can be obtained by applying the same formula. The value of TIHC for each of the CSC partners is shown in Figure 3a. A similar method can be applied to compute the values of the other two performance parameters thatare discussed in the subsequent section.
5.3.2. Impact of Partners on SC Revenue
The impact of partners on supply chain revenue can be defined as the expected increase in the cost of the SC when an uncertain event or a group of events occurs [47]. The disruptions in the networks, which are more localized, often have less impact on the SC revenue. Since in a CSC, the disruption propagates from the reverse to the forward side, so any disruption caused to the recycler may have a huge impact on the total SC revenue. Since the impact of the partners on the SC revenue is dependent on the probability of disruption, it does not vary much with the change in the inventory level. It can be seen from Table 4 that the disruption probability of the recyclers for each of the categories of risk is greater as compared to the manufacturers and retailers; therefore, any disruption occurring on the recycler side can have a huge impact on the revenue of the CSC (Figure 3b).
5.3.3. Lost Sales
A loss in sales may take place due to the disruption occurring at the individual nodes. A loss in the sale of the product is mainly because of the imbalance between supply and demand. Firstly, if the demand of the product in the market is high, and the company’s SC is not able to meet the required demand, then it leads to a loss in the expected sales. A loss in sales may also happen if the demand of the product in the market is low, while comparing it to the production capacity of the company. In both the cases, there is a loss in the net SC revenue. These results can be well attributed to the smooth functioning of the CSC. In the case of the CSC, the demand of a product is not only related to the generation of recycled raw material, but it also has a major contribution to the circular flow of economy. In the case of the circular flow of a product, the dependency in fresh raw material is minimized, so the chance of a shortage of raw material for the production is also less. This, in turn, creates a balance between supply and demand. The risk propagation of the loss in sales is, again, from the recycler to the manufacturer and retailer. Any disruption occurring at the recycler will affect the production of recycled raw material, which will further affect the manufacturer’s performance, due to a shortage of input material. This will lead to a shortage of finished products at the retailer, thereby leading to a loss in sales. So, a high inventory of used products should be kept by the recycler, in order to reduce the disruption over the entire cycle. The level of inventory may decrease from the reverse to the forward side (Figure 3c).
5.4. Risk Exposure Index
The risk exposure index (REI) is used to identify the particular nodes that need special attention from the SC managers and the risk experts. In the above considered BN model, REI is evaluated based upon the risk impact of individual partners on the CSC revenue. The impact on the revenue is expressed in terms of the average of the disruption probability of each individual risk associated with the CSC partner. The value of REI lies between zero and one, since it is the mean of the probabilities. The CSC partner, having the highest value of REI, has the maximum impact on the revenue of the CSC. REI, here, implies the partner’s exposure to the extent of the risk encountered during the implementation of the concept of circularity in the supply chain. Figure 4 shows the risk exposure index of each individual partner that is associated with the company’s SC.
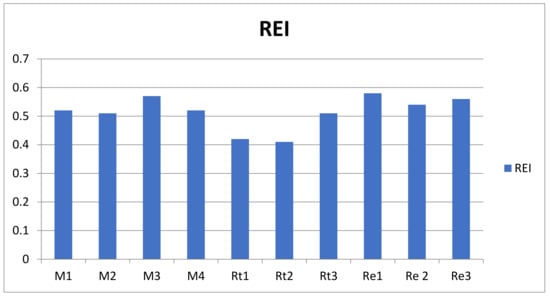
Figure 4.
Risk exposure index of CSC partners.
It is observed, from graphical results (Figure 4), that the risk exposure index of the three recyclers Re1, Re2 and Re3 are comparatively more than the rest of the partners involved in the CSC. This implies that the recyclers are more vulnerable to the disruptions caused by these CSC risks, or in other words it can be stated that the reverse side of the supply chain is more susceptible to these risks as compared to the forward side.
Figure 5 shows a bar graph representing the probability of disruption of each of the categories of risk faced by the partners of the CSC.
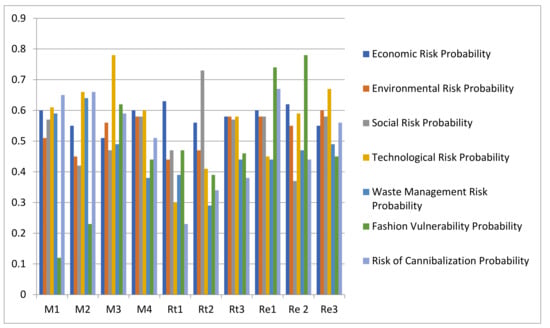
Figure 5.
Disruption probability of CSC risk for each partner.
It is observed, from graphical results (Figure 5), that the average height of the bars of risk associated with recyclers involved in the CSC oftheIndian automobile company is greater as compared to the average height of the manufacturers and retailers. This is attributed to the fact that recyclers are more vulnerable to the risk encountered during the implementation of the concept of circularity in the SC. The disruption probability of economic risk is almost equal for all the CSC partners, which meansthatany economic downturn will be equally shared by all the partners. The disruptions caused to the activities of the CSC are high in magnitude for the recyclers, because they are bound to operate under strict environmental norms. The pillars of the disruption of social risk are high for the retailers because they have to manage and bridge the gap that exists between the customers and the rest of the partners of the CSC. Manufacturers are the ones who are mainly exposed to the effect of the occurrence of technological risk. Any technological breakdown during the manufacturing operation can seriously affect the production, which, in turn, disrupts the smooth flow of products through the chain. Also, with the incorporation of a novel concept, there is always a threat, whether the implementation of new technology will be compatible with the existing system. The risk that is associated with the management of the proper disposal of waste also plays a major role in the implementation of the CSC concept. Not only should manufacturers efficiently utilize the input resources, but the recyclers should also carry out the operations carefully, because any leakage of hazardous substance into the environment can cause serious health hazards. Any agile change in the design of a product directly affects the manufacturers and recyclers. These risks arise because of the frequent changes in customer demand from the calling population that requires the incorporation of a new complex technology. With the introduction of a novel business technique, the new long-lasting products that are more technology driven, may decrease the sale oftheproducts produced conventionally. Manufacturers are mostly susceptible to the risk of cannibalization, because technology needs to be continuously updated along with the change in market demand.
6. Managerial Implication
There are three contributions made to the theory of risk analysis and management, based upon the findings of the study. Firstly, by adopting an organized approach, certain categories of risk and their associated risk events have been explored in the context of implementation of the concept of circularity in SCM. Secondly, the BN methodology has been utilized to model the risk events and construct the risk profile for each of the partners involved in the circular supply chain. The third contribution is the analysis of the effect of these risks on the performance of the circular supply chain. To analyze the effect, certain performance parameters have been chosen, such as the risk impact of individual partners on the CSC revenue, loss inthesale of products, and rise in the total inventory cost, due to the occurrence of CSC risk. These three performance parameters provide a holistic understanding of the impact of various categories of risk on the performance of the CSC.
The findings of the study can assist the supply chain managers and the risk experts to focus on the areas of uncertainty that are more vulnerable to risks occurring during the COVID-19 pandemic phase. For the purpose of assistance, the risk exposure index (REI) is utilized, in order to quantify the exposure to disruption.This is a quantitative index, having a fractional value that demonstrates the probability of disruption. The risk exposure is expressed in terms of the impact on the performance of the CSC. The existing literature on supply chain risk management does not capture the holistic picture of risk propagation through each node and the construct used in the development oftherisk analysis model. Therefore, an effort has been made in this study to capture the maximum categories of risk, in context to COVID-19, and their propagation associated with the implementation of this novel concept of circularity in the supply chain, during the pandemic period.
7. Conclusions, Limitations and Future Scope
The research conducted to analyze the risk related to the implementation of the concept of circularity in the supply chain, helps the experts to gain deeper insights into the gaps existing in the area of risk management. The study is able to demonstrate how the risk is propagated across the CSC network, and the disruption caused at individual nodes of the network, due to COVID-19 pandemic. The BN methodology is used to model the network of risk encountered by the various partners of the CSC during the pandemic phase. Risk assessment in the supply chain is a dynamic process, so the objective of the research is to establish an index system that is dynamic in nature, reflecting every possible cause of disruption. The purpose of apprehending the word ‘dynamic’ with the index system is to show its flexible nature of adapting to the changing needs of business reality. The choice of risk measures should not only reveal the current status of the impact of CSC risk, but also predict the future changes in the trend of performance parameters. By incorporating the BN methodology for the model formulation, we are able to address this gap. An important advantage of using the BN methodology is that it gives an intuitive interpretation of the risk propagation across the network of the supply chain. Also, this methodology is based on the rigorous mathematical computational theory of determining probabilities of risk occurrence. The work of mathematical computation increases exponentially with the increase in the number of nodes.
The finding of this empirical research that was conducted in the field of circular supply chain risk management, provides interesting insights from its implementation viewpoint duringtheCOVID-19 pandemic. The results of the study reveal that the reverse supply chain is more vulnerable to risk that is encountered during the implementation of the concept of circularity [100]. The findings also reveal a lack of preparedness, in terms of the risk identification, analysis and mitigation strategies that are required for the implementation of a novel concept of circularity during the phase of the pandemic. The findings of this study also bridge the gaps identified in the past literature, which directs the application of SCRM to an extended level [20].The finding also supports the future research directions of the literature, mentioning the need of multi-tier SCRM study from the developing country context [70,101]. From the industry viewpoint, the results of the study will help the managers and the practitioners better understand the impact of risk propagation across the network of the supply chain, in the era of the COVID-19 pandemic.
Similarly to any other study, this study also has some limitations. The supply chain oftheautomobile industry is considered for analyzing risk propagation. The results generated are industry-specific and cannot be compared with the other industries, as the SC network of every industry is unique and differs in the reaction to risk exposure. Therefore, it is difficult to generalize the results for other industries. One of the major limitations of using the BN to model CSC risk is that the model can accommodate only a limited number of risks identified through the literature review. The incapability of the model to incorporate all relevant risks could restrict its effectiveness in representing a partner’s true risk profile. Data pertaining to the occurrence of risk events are gathered from a group of experts. Therefore, the CPT that is developed may vary depending upon the expert’s perception towards risk, and is more likely to depend on the different scenarios in which risk may occur.
The concept of implementing circularity in the supply chain process is novel and dynamic in nature, from the perspective of risk propagation in the pandemic phase. The pandemic has highlighted the need of implementing circularity in the supply chain, to minimize the disruptions occurring at various levels. In the future, studies that examine the risk profile may choose indicators that not only reflect the current status of CSC risk, but also throw a light on the future changes in the business trends. In this study, only a few performance parameters are chosen to study the risk impact on the performance of the CSC. In the future, more parameters could be added to obtain a holistic view of CSC performance. In this study, the scenario for maximum disruption is considered. Future studies could incorporate different scenarios to study the risk behavior in various conditions and compare the results for the purpose of bringing on a single platform. Some other modeling techniques, such as the fault tree analysis, Petri nets framework, and the Markovian model, could be included in future studies, to obtain better and fruitful results. Also, future research could be directed to manage and mitigate risk related to the outsourcing of these circular operations.
Author Contributions
Conceptualization, M.C., S.A. and G.K.; methodology, M.C. and G.K.; validation, M.C.; formal analysis, M.C., S.A. and G.K.; investigation, M.C.; resources, M.C., S.A. and G.K.; data curation, M.C.; writing—original draft preparation, M.C.; writing—review and editing, S.A. and G.K.; visualization, M.C., S.A. and G.K.; supervision, S.A. and G.K.; All authors have read and agreed to the published version of the manuscript.
Funding
This research received no specific grant from any funding agency in the public, commercial or not-for-profit sectors.
Institutional Review Board Statement
Not applicable.
Informed Consent Statement
Not applicable.
Data Availability Statement
Not applicable.
Acknowledgments
We sincerely thank the editors and anonymous reviewers for their constructive and insightful comments, which led to major improvements. We also wish to thank the automobile manufacturing company located in Delhi-NCR region for administrative and technical support.
Conflicts of Interest
The authors declare no conflict of interest.
References
- Barnes, S.J. Information management research and practice in the post-COVID-19 world. Int. J. Inf. Manag. 2020, 55, 102175. [Google Scholar] [CrossRef]
- Amit, R.; Han, X. Value creation through novel resource configurations in a digitally enabled world. Strateg. Entrep. J. 2017, 11, 228–242. [Google Scholar] [CrossRef]
- Islam, T.; Pitafi, A.H.; Arya, V.; Wang, Y.; Akhtar, N.; Mubarik, S.; Xiaobei, L. Panic Buying in the COVID-19 Pandemic: A Multi-country Examination; Elsevier Ltd.: Amsterdam, The Netherlands, 2021; Volume 59, ISBN 0086131206. [Google Scholar]
- Song, T.; Zhang, Q.; Ran, J.; Ran, W. Research on Supplier Collaboration of Daily Consumer Goods under Uncertainty of Supply and Demand. Sustainability 2021, 13, 5683. [Google Scholar] [CrossRef]
- Matos, S.; Hall, J. Integrating sustainable development in the supply chain: The case of life cycle assessment in oil and gas and agricultural biotechnology. J. Oper. Manag. 2007, 25, 1083–1102. [Google Scholar] [CrossRef]
- Hazée, S.; Van Vaerenbergh, Y.; Delcourt, C.; Kabadayi, S. Service delivery system design for risk management in sharing-based product service systems: A customer-oriented approach. Int. J. Oper. Prod. Manag. 2020, 40, 459–479. [Google Scholar] [CrossRef]
- Yu, Z.; Razzaq, A.; Rehman, A.; Shah, A.; Jameel, K.; Mor, R.S. Disruption in global supply chain and socio-economic shocks: A lesson from COVID-19 for sustainable production and consumption. Oper. Manag. Res. 2021, 1–16. [Google Scholar] [CrossRef]
- Shahed, K.S.; Azeem, A.; Ali, S.M.; Moktadir, M.A. A supply chain disruption risk mitigation model to manage COVID-19 pandemic risk. Environ. Sci. Pollut. Res. 2021, 2020. [Google Scholar] [CrossRef]
- Sharma, P.; Leung, T.Y.; Kingshott, R.P.J.; Davcik, N.S.; Cardinali, S. Managing uncertainty during a global pandemic: An international business perspective. J. Bus. Res. 2020, 116, 188–192. [Google Scholar] [CrossRef]
- Ivanov, D.; Dolgui, A. OR-methods for coping with the ripple effect in supply chains during COVID-19 pandemic: Managerial insights and research implications. Int. J. Prod. Econ. 2021, 232, 107921. [Google Scholar] [CrossRef] [PubMed]
- Ferasso, M.; Beliaeva, T.; Kraus, S.; Clauss, T.; Ribeiro-Soriano, D. Circular economy business models: The state of research and avenues ahead. Bus. Strateg. Environ. 2020, 1–19. [Google Scholar] [CrossRef]
- Geissdoerfer, M.; Savaget, P.; Bocken, N.M.P.; Hultink, E.J. The Circular Economy—A new sustainability paradigm? J. Clean. Prod. 2017, 143, 757–768. [Google Scholar] [CrossRef] [Green Version]
- Bai, C.; Sarkis, J.; Yin, F.; Dou, Y. Sustainable supply chain flexibility and its relationship to circular economy-target performance. Int. J. Prod. Res. 2020, 58, 5893–5910. [Google Scholar] [CrossRef]
- Diaz, A.; Schöggl, J.P.; Reyes, T.; Baumgartner, R.J. Sustainable product development in a circular economy: Implications for products, actors, decision-making support and lifecycle information management. Sustain. Prod. Consum. 2021, 26, 1031–1045. [Google Scholar] [CrossRef]
- Sarkis, J.; Zhu, Q. Environmental sustainability and production: Taking the road less travelled. Int. J. Prod. Res. 2018, 56, 743–759. [Google Scholar] [CrossRef]
- Agrawal, S.; Singh, R.K.; Murtaza, Q. Disposition decisions in reverse logistics: Graph theory and matrix approach. J. Clean. Prod. 2016, 137, 93–104. [Google Scholar] [CrossRef]
- Upadhyay, A.; Kumar, A.; Akter, S. An analysis of UK retailers’ initiatives towards circular economy transition and policy-driven directions. Clean Technol. Environ. Policy 2021, 1–9. [Google Scholar] [CrossRef]
- Fiksel, J.; Sanjay, P.; Raman, K. Steps toward a resilient circular economy in India. Clean Technol. Environ. Policy 2021, 23, 203–218. [Google Scholar] [CrossRef]
- De Angelis, R. Circular economy: Laying the foundations for conceptual and theoretical development in management studies. Manag. Decis. 2020, 59. [Google Scholar] [CrossRef]
- Lahane, S.; Kant, R.; Shankar, R. Circular Supply Chain Management: A State-of-art review and future opportunities. J. Clean. Prod. 2020, 258, 120859. [Google Scholar] [CrossRef]
- Genovese, A.; Acquaye, A.A.; Figueroa, A.; Koh, S.C.L. Sustainable supply chain management and the transition towards a circular economy: Evidence and some applications. Omega 2017, 66, 344–357. [Google Scholar] [CrossRef]
- Bui, T.D.; Tsai, F.M.; Tseng, M.L.; Tan, R.R.; Yu, K.D.S.; Lim, M.K. Sustainable supply chain management towards disruption and organizational ambidexterity: A data driven analysis. Sustain. Prod. Consum. 2021, 26, 373–410. [Google Scholar] [CrossRef]
- Koh, S.C.L.; Gunasekaran, A.; Morris, J.; Obayi, R.; Ebrahimi, S.M. Conceptualizing a circular framework of supply chain resource sustainability. Int. J. Oper. Prod. Manag. 2017, 37, 1520–1540. [Google Scholar] [CrossRef]
- Pan, S.Y.; Du, M.A.; Huang, I.T.; Liu, I.H.; Chang, E.E.; Chiang, P.C. Strategies on implementation of waste-to-energy (WTE) supply chain for circular economy system: A review. J. Clean. Prod. 2014, 108, 1–13. [Google Scholar] [CrossRef]
- Ethirajan, M.; Arasu, M.T.; Kandasamy, J.; Vimal, K.E.K.; Nadeem, S.P.; Kumar, A. Analysing the risk of adopting circular economy initiatives in manufacturing supply chains. Bus. Strateg. Environ. 2020, 30, 204–206. [Google Scholar] [CrossRef]
- Spekman, R.E.; Davis, E.W. Risky business: Expanding the discussion on risk and the extended enterprise. Int. J. Phys. Distrib. Logist. Manag. 2004, 34, 414–433. [Google Scholar] [CrossRef]
- Tang, C.S. Perspectives in supply chain risk management. Int. J. Prod. Econ. 2006, 103, 451–488. [Google Scholar] [CrossRef]
- Jüttner, U.; Peck, H.; Christopher, M. Supply chain risk management: Outlining an agenda for future research. Int. J. Logist. Res. Appl. 2003, 6, 197–210. [Google Scholar] [CrossRef] [Green Version]
- Fan, Y.; Stevenson, M. A review of supply chain risk management: Definition, theory, and research agenda. Int. J. Phys. Distrib. Logist. Manag. 2018, 48, 205–230. [Google Scholar] [CrossRef] [Green Version]
- Li, Y.; Zobel, C.W. Exploring supply chain network resilience in the presence of the ripple effect. Int. J. Prod. Econ. 2020, 228, 107693. [Google Scholar] [CrossRef]
- Ojha, R.; Ghadge, A.; Tiwari, M.K.; Bititci, U.S. Bayesian network modelling for supply chain risk propagation. Int. J. Prod. Res. 2018, 56, 5795–5819. [Google Scholar] [CrossRef]
- Boulding, K. The Economy of the Coming Spaceship Earth. In Environmental Quality in a Growing Economy; Johns Hopkins University Press: Baltimore, MD, USA, 1996. [Google Scholar]
- Pearce, D.W.; Turner, R.K. Economics of Natural Resources and the Environment; Johns Hopkins University Press: Baltimore, MD, USA, 1989. [Google Scholar]
- Thierry, M.; Salomon, M.; Van Nunen, J.; Van Wassenhove, L. Strategic issues in product recovery management. Calif. Manag. Rev. 1995, 37, 114–136. [Google Scholar] [CrossRef] [Green Version]
- Walter, R. Stahel Circular Economy. Nature 2015, 6–9. [Google Scholar] [CrossRef] [Green Version]
- Su, B.; Heshmati, A.; Geng, Y.; Yu, X. A review of the circular economy in China: Moving from rhetoric to implementation. J. Clean. Prod. 2013, 42, 215–227. [Google Scholar] [CrossRef]
- Ellen MacArthur Foundation. Towards the Circular Economy. 2013. Available online: https://www.ellenmacarthurfoundation.org/assets/downloads/publications/TCE_Report-2013.pdf (accessed on 20 May 2021).
- European Commission. The role of waste-to-energy in the circular economy. In Proceedings of the UNECE Ministerial Conference, Astana, Kazakhstan, 14 June 2017; Volume 11. [Google Scholar]
- Ghisellini, P.; Cialani, C.; Ulgiati, S. A review on circular economy: The expected transition to a balanced interplay of environmental and economic systems. J. Clean. Prod. 2016, 114, 11–32. [Google Scholar] [CrossRef]
- Farooque, M.; Zhang, A.; Thurer, M.; Qu, T.; Huisingh, D. Circular supply chain management: A definition and structured literature review. J. Clean. Prod. 2019, 228, 882–900. [Google Scholar] [CrossRef]
- Bressanelli, G.; Perona, M.; Saccani, N. Challenges in supply chain redesign for the Circular Economy: A literature review and a multiple case study. Int. J. Prod. Res. 2019, 57, 7395–7422. [Google Scholar] [CrossRef] [Green Version]
- Chhimwal, M.; Agrawal, S.; Kumar, G. Challenges in the implementation of circular economy in manufacturing industry. J. Model. Manag. 2021. [Google Scholar] [CrossRef]
- Bastas, A.; Liyanage, K. Setting a framework for organisational sustainable development. Sustain. Prod. Consum. 2019, 20, 207–229. [Google Scholar] [CrossRef]
- Ferronato, N.; Cristina, E.; Antonio, M.; Portillo, G.; Ionel, L.; Ragazzi, M.; Torretta, V. Introduction of the circular economy within developing regions: A comparative analysis of advantages and opportunities for waste valorization. J. Environ. Manag. 2019, 230, 366–378. [Google Scholar] [CrossRef] [PubMed]
- Hallikas, J.; Virolainen, V.; Tuominen, M. Risk analysis and assessment in network environments: A dyadic case study. Int. J. Prod. Econ. 2002, 78, 45–55. [Google Scholar] [CrossRef]
- Zsidisin, G.A.; Ellram, L.M.; Carter, J.R.; Cavinato, J.L. An analysis of supply risk assessment techniques. Int. J. Phys. Distrib. Logist. Manag. 2004, 34, 397–413. [Google Scholar] [CrossRef]
- Chopra, S.; Sodhi, M.M.S. Managing risk to avoid: Supply-chain breakdown. MIT Sloan Manag. Rev. 2004, 46, 53–61. [Google Scholar]
- Sharma, L.; Pandey, S. Recovery of resources from end-of-life passenger cars in the informal sector in India. Sustain. Prod. Consum. 2020, 24, 1–11. [Google Scholar] [CrossRef]
- Mishra, D.; Sharma, R.R.K.; Kumar, S.; Dubey, R. Bridging and buffering: Strategies for mitigating supply risk and improving supply chain performance. Int. J. Prod. Econ. 2016, 180, 183–197. [Google Scholar] [CrossRef]
- Kocabasoglu, C.; Prahinski, C.; Klassen, R.D. Linking forward and reverse supply chain investments: The role of business uncertainty. J. Oper. Manag. 2007, 25, 1141–1160. [Google Scholar] [CrossRef]
- Kazancoglu, Y.; Ozkan-Ozen, Y.D.; Mangla, S.K.; Ram, M. Risk assessment for sustainability in e-waste recycling in circular economy. Clean Technol. Environ. Policy 2020, 1–13. [Google Scholar] [CrossRef]
- Giunipero, L.C.; Eltantawy, R.A. Securing the upstream supply chain: A risk management approach. Int. J. Phys. Distrib. Logist. Manag. 2004, 34, 698–713. [Google Scholar] [CrossRef] [Green Version]
- Agrawal, S.; Singh, R.K.; Murtaza, Q. A literature review and perspectives in reverse logistics. Resour. Conserv. Recycl. 2015, 97, 76–92. [Google Scholar] [CrossRef]
- Agnusdei, G.P.; Gnoni, M.G.; Tornese, F. Modelling and simulation tools for integrating forward and reverse logistics: A literature review. In Proceedings of the European Modeling & Simulation Symposium, Lisbon, Portugal, 18–20 September 2019; pp. 317–326. [Google Scholar] [CrossRef]
- ManzariTavakoli, E.; Mirzaee, M. Coordination of a three-level supply chain under disruption using profit sharing and return policy contracts. Int. J. Ind. Eng. Comput. 2014, 5, 139–150. [Google Scholar] [CrossRef]
- He, Y.; Zhang, J. Random yield supply chain with a yield dependent secondary market. Eur. J. Oper. Res. 2010, 206, 221–230. [Google Scholar] [CrossRef]
- Monte, M.C.; Fuente, E.; Blanco, A.; Negro, C. Waste management from pulp and paper production in the European Union. Waste Manag. 2009, 29, 293–308. [Google Scholar] [CrossRef] [Green Version]
- Kull, T.J.; Talluri, S. A supply risk reduction model using integrated multicriteria decision making. IEEE Trans. Eng. Manag. 2008, 55, 409–419. [Google Scholar] [CrossRef]
- Levary, R.R.; Levary, R.R. Insight from industry Ranking foreign suppliers based on supply risk. Supply Chain Manag. Int. J. 2007, 12, 392–394. [Google Scholar] [CrossRef]
- Chan, F.T.S.; Kumar, N. Global supplier development considering risk factors using fuzzy extended AHP-based approach. Omega 2007, 35, 417–431. [Google Scholar] [CrossRef]
- Chen, P.S.; Wu, M.T. A modified failure mode and effects analysis method for supplier selection problems in the supply chain risk environment: A case study. Comput. Ind. Eng. 2013, 66, 634–642. [Google Scholar] [CrossRef]
- Giannakis, M.; Papadopoulos, T. Supply chain sustainability: A risk management approach. Int. J. Prod. Econ. 2016, 171, 455–470. [Google Scholar] [CrossRef]
- Tuncel, G. Computers in Industry Risk assessment and management for supply chain networks: A case study. Comput. Ind. 2010, 61, 250–259. [Google Scholar] [CrossRef]
- Gupta, S.; Soni, U.; Kumar, G. Computers & Industrial Engineering Green supplier selection using multi-criterion decision making under fuzzy environment: A case study in automotive industry. Comput. Ind. Eng. 2019, 136, 663–680. [Google Scholar] [CrossRef]
- Paksoy, T.; Çalik, A.; Yildizba, A.; Huber, S. Risk Management in Lean & Green Supply Chain: A Novel Fuzzy Linguistic Risk Assessment Approach. In Lean and Green Supply Chain Management; Springer: Cham, Switzerland, 2019. [Google Scholar]
- Hu, A.H.; Hsu, C.W.; Kuo, T.C.; Wu, W.C. Risk evaluation of green components to hazardous substance using FMEA and FAHP. Expert Syst. Appl. 2009, 36, 7142–7147. [Google Scholar] [CrossRef]
- Hosseini, S.; Ivanov, D.; Dolgui, A. Ripple effect modelling of supplier disruption: Integrated Markov chain and dynamic Bayesian network approach. Int. J. Prod. Res. 2020, 58, 3284–3303. [Google Scholar] [CrossRef]
- Faisal, M.N.; Banwet, D.K.; Shankar, R. Supply chain risk mitigation: Modeling the enablers. Bus. Process. Manag. J. 2006, 12, 535–552. [Google Scholar] [CrossRef]
- Radivojevi, G.; Gajovi, V. Supply chain risk modeling by AHP and Fuzzy AHP methods. J. Risk Res. 2013, 17, 337–352. [Google Scholar] [CrossRef]
- Tummala, R.; Schoenherr, T. Assessing and managing risk using the Supply Chain Risk Management Process (SCRMP). Supply Chain Manag. Int. J. 2011, 16, 474–483. [Google Scholar] [CrossRef]
- Teng, S.G.; Ho, S.M.; Shumar, D.; Liu, P.C.; Teng, S.G. Implementing FMEA in a collaborative supply chain environment. Int. J. Qual. Reliab. Manag. 2006, 23, 179–196. [Google Scholar] [CrossRef]
- Chaudhuri, A.; Mohanty, B.K.; Singh, K.N. Supply chain risk assessment during new product development: A group decision making approach using numeric and linguistic data. Int. J. Prod. Res. 2013, 51, 2790–2804. [Google Scholar] [CrossRef]
- Sinha, P.R.; Whitman, L.E.; Malzahn, D. Methodology to mitigate supplier risk in an aerospace supply chain. Supply Chain Manag. Int. J. 2004, 9, 154–168. [Google Scholar] [CrossRef]
- Garvey, M.D.; Carnovale, S.; Yeniyurt, S. An analytical framework for supply network risk propagation: A Bayesian network approach. Eur. J. Oper. Res. 2015, 243, 618–627. [Google Scholar] [CrossRef]
- Kumar Sharma, S.; Sharma, S. Developing a Bayesian Network Model for Supply Chain Risk Assessment. Supply Chain Forum 2015, 16, 50–72. [Google Scholar] [CrossRef]
- Liu, M.; Liu, Z.; Chu, F.; Zheng, F.; Chu, C. A new robust dynamic Bayesian network approach for disruption risk assessment under the supply chain ripple effect. Int. J. Prod. Res. 2021, 59, 265–285. [Google Scholar] [CrossRef]
- Hosseini, S.; Ivanov, D. A new resilience measure for supply networks with the ripple effect considerations: A Bayesian network approach. Ann. Oper. Res. 2019, 1–27. [Google Scholar] [CrossRef]
- Pai, R.R.; Kallepalli, V.R.; Caudill, R.J.; Zhou, M. Methods toward supply chain risk analysis. In Proceedings of the SMC’03 Conference Proceedings. IEEE International Conference on Systems, Man and Cybernetics, Washington, DC, USA, 8 October 2003; Volume 5, pp. 4560–4565. [Google Scholar] [CrossRef]
- Shevtshenko, E.; Wang, Y. Decision support under uncertainties based on robust Bayesian networks in reverse logistics management. Int. J. Comput. Appl. Technol. 2009, 36, 247–258. [Google Scholar] [CrossRef] [Green Version]
- Chen, M.; Xia, Y.; Wang, X. Managing supply uncertainties through Bayesian information update. IEEE Trans. Autom. Sci. Eng. 2009, 7, 24–36. [Google Scholar] [CrossRef]
- Duchessi, P.J. A methodology for developing Bayesian networks: An application to information technology (IT) implementation. Eur. J. Oper. Res. 2007, 179, 234–252. [Google Scholar] [CrossRef]
- Luu, V.T.; Kim, S.; Van Tuan, N.; Ogunlana, S.O. Quantifying schedule risk in construction projects using Bayesian belief networks. Int. J. Proj. Manag. 2009, 27, 39–50. [Google Scholar] [CrossRef]
- Yelland, P.M.; Kim, S.; Stratulate, R.; Microsystems, S. A Bayesian Model for Sales Forecasting at sun microsystems. Interfaces 2010, 40, 118–129. [Google Scholar] [CrossRef] [Green Version]
- Rahman, M.A.; Sarker, B.R.; Escobar, L.A. Peak demand forecasting for a seasonal product using Bayesian approach. J. Oper. Res. Soc. 2011, 62, 1019–1028. [Google Scholar] [CrossRef]
- Cui, G.; Wong, M.L.; Lui, H.; Wong, M.L. Machine Learning for Direct Marketing Response Models: Bayesian Networks with Evolutionary Programming. Manag. Sci. 2006, 52, 597–612. [Google Scholar] [CrossRef] [Green Version]
- Anderson, R.D.; Mackoy, R.D.; Thompson, V.B.; Harrell, G. A Bayesian network estimation of the service-profit chain for transport service satisfaction. Decis. Sci. 2004, 35, 665–689. [Google Scholar] [CrossRef] [Green Version]
- Tofighi, S.; Torabi, S.A.; Mansouri, S.A. Humanitarian logistics network design under mixed uncertainty. Eur. J. Oper. Res. 2016, 250, 239–250. [Google Scholar] [CrossRef] [Green Version]
- DuHadway, S.; Carnovale, S.; Hazen, B. Understanding risk management for intentional supply chain disruptions: Risk detection, risk mitigation, and risk recovery. Ann. Oper. Res. 2019, 283, 179–198. [Google Scholar] [CrossRef]
- Georgescu-Roegen, N. Inequality, limits and growth from a bioeconomic viewpoint. Rev. Soc. Econ. 1977, 35, 361–375. [Google Scholar] [CrossRef]
- Daly, H.E.; Townsend, K.N. Valuing the Earth: Economics, Ecology, Ethics; MIT Press: Cambridge, MA, USA, 1992. [Google Scholar]
- Gouda, S.K.; Saranga, H. Sustainable supply chains for supply chain sustainability: Impact of sustainability efforts on supply chain risk. Int. J. Prod. Res. 2018, 56, 5820–5835. [Google Scholar] [CrossRef]
- Song, W.; Ming, X.; Liu, H. Identifying critical risk factors of sustainable supply chain management: A rough strength-relation analysis method. J. Clean. Prod. 2017, 143, 100–115. [Google Scholar] [CrossRef]
- Ivanov, D.; Dolgui, A.; Sokolov, B. The impact of digital technology and Industry 4.0 on the ripple effect and supply chain risk analytics. Int. J. Prod. Res. 2019, 57, 829–846. [Google Scholar] [CrossRef]
- Kauppi, K.; Longoni, A.; Caniato, F.; Kuula, M. Managing country disruption risks and improving operational performance: Risk management along integrated supply chains. Int. J. Prod. Econ. 2016, 182, 484–495. [Google Scholar] [CrossRef]
- Maria, C.; Hua, K.; Lim, M. Green as the new Lean: How to use Lean practices as a catalyst to greening your supply chain. J. Clean. Prod. 2013, 40, 93–100. [Google Scholar] [CrossRef] [Green Version]
- Sodhi, M.S.; Tang, C.S. Research Opportunities in Supply Chain Transparency. Prod. Oper. Manag. 2019, 28, 2946–2959. [Google Scholar] [CrossRef] [Green Version]
- Gunasekaran, A. Agile manufacturing: A framework for research and development. Int. J. Prod. Econ. 1999, 62, 87–105. [Google Scholar] [CrossRef]
- Guiltinan, J. Creative Destruction and Destructive Creations: Environmental Ethics and Planned Obsolescence. J. Bus. Ethics 2009, 89, 19–28. [Google Scholar] [CrossRef]
- Llerena, D. Green Consumer Behaviour: An Experimental. Bus. Strategy Environ. 2011, 420, 408–420. [Google Scholar]
- Panjehfouladgaran, H.; Lim, S.F.W.T. Reverse logistics risk management: Identification, clustering and risk mitigation strategies. Manag. Decis. 2020, 58, 1449–1474. [Google Scholar] [CrossRef]
- Tukamuhabwa, B.; Stevenson, M.; Busby, J. Supply chain resilience in a developing country context: A case study on the interconnectedness of threats, strategies and outcomes. Supply Chain Manag. Int. J. 2017, 22, 486–505. [Google Scholar] [CrossRef] [Green Version]
Publisher’s Note: MDPI stays neutral with regard to jurisdictional claims in published maps and institutional affiliations. |
© 2021 by the authors. Licensee MDPI, Basel, Switzerland. This article is an open access article distributed under the terms and conditions of the Creative Commons Attribution (CC BY) license (https://creativecommons.org/licenses/by/4.0/).