
Acoustic Environment of Urban Historical Places: A Case Study in Kastamonu, Turkey


Abstract
:1. Introduction
2. Materials and Methods
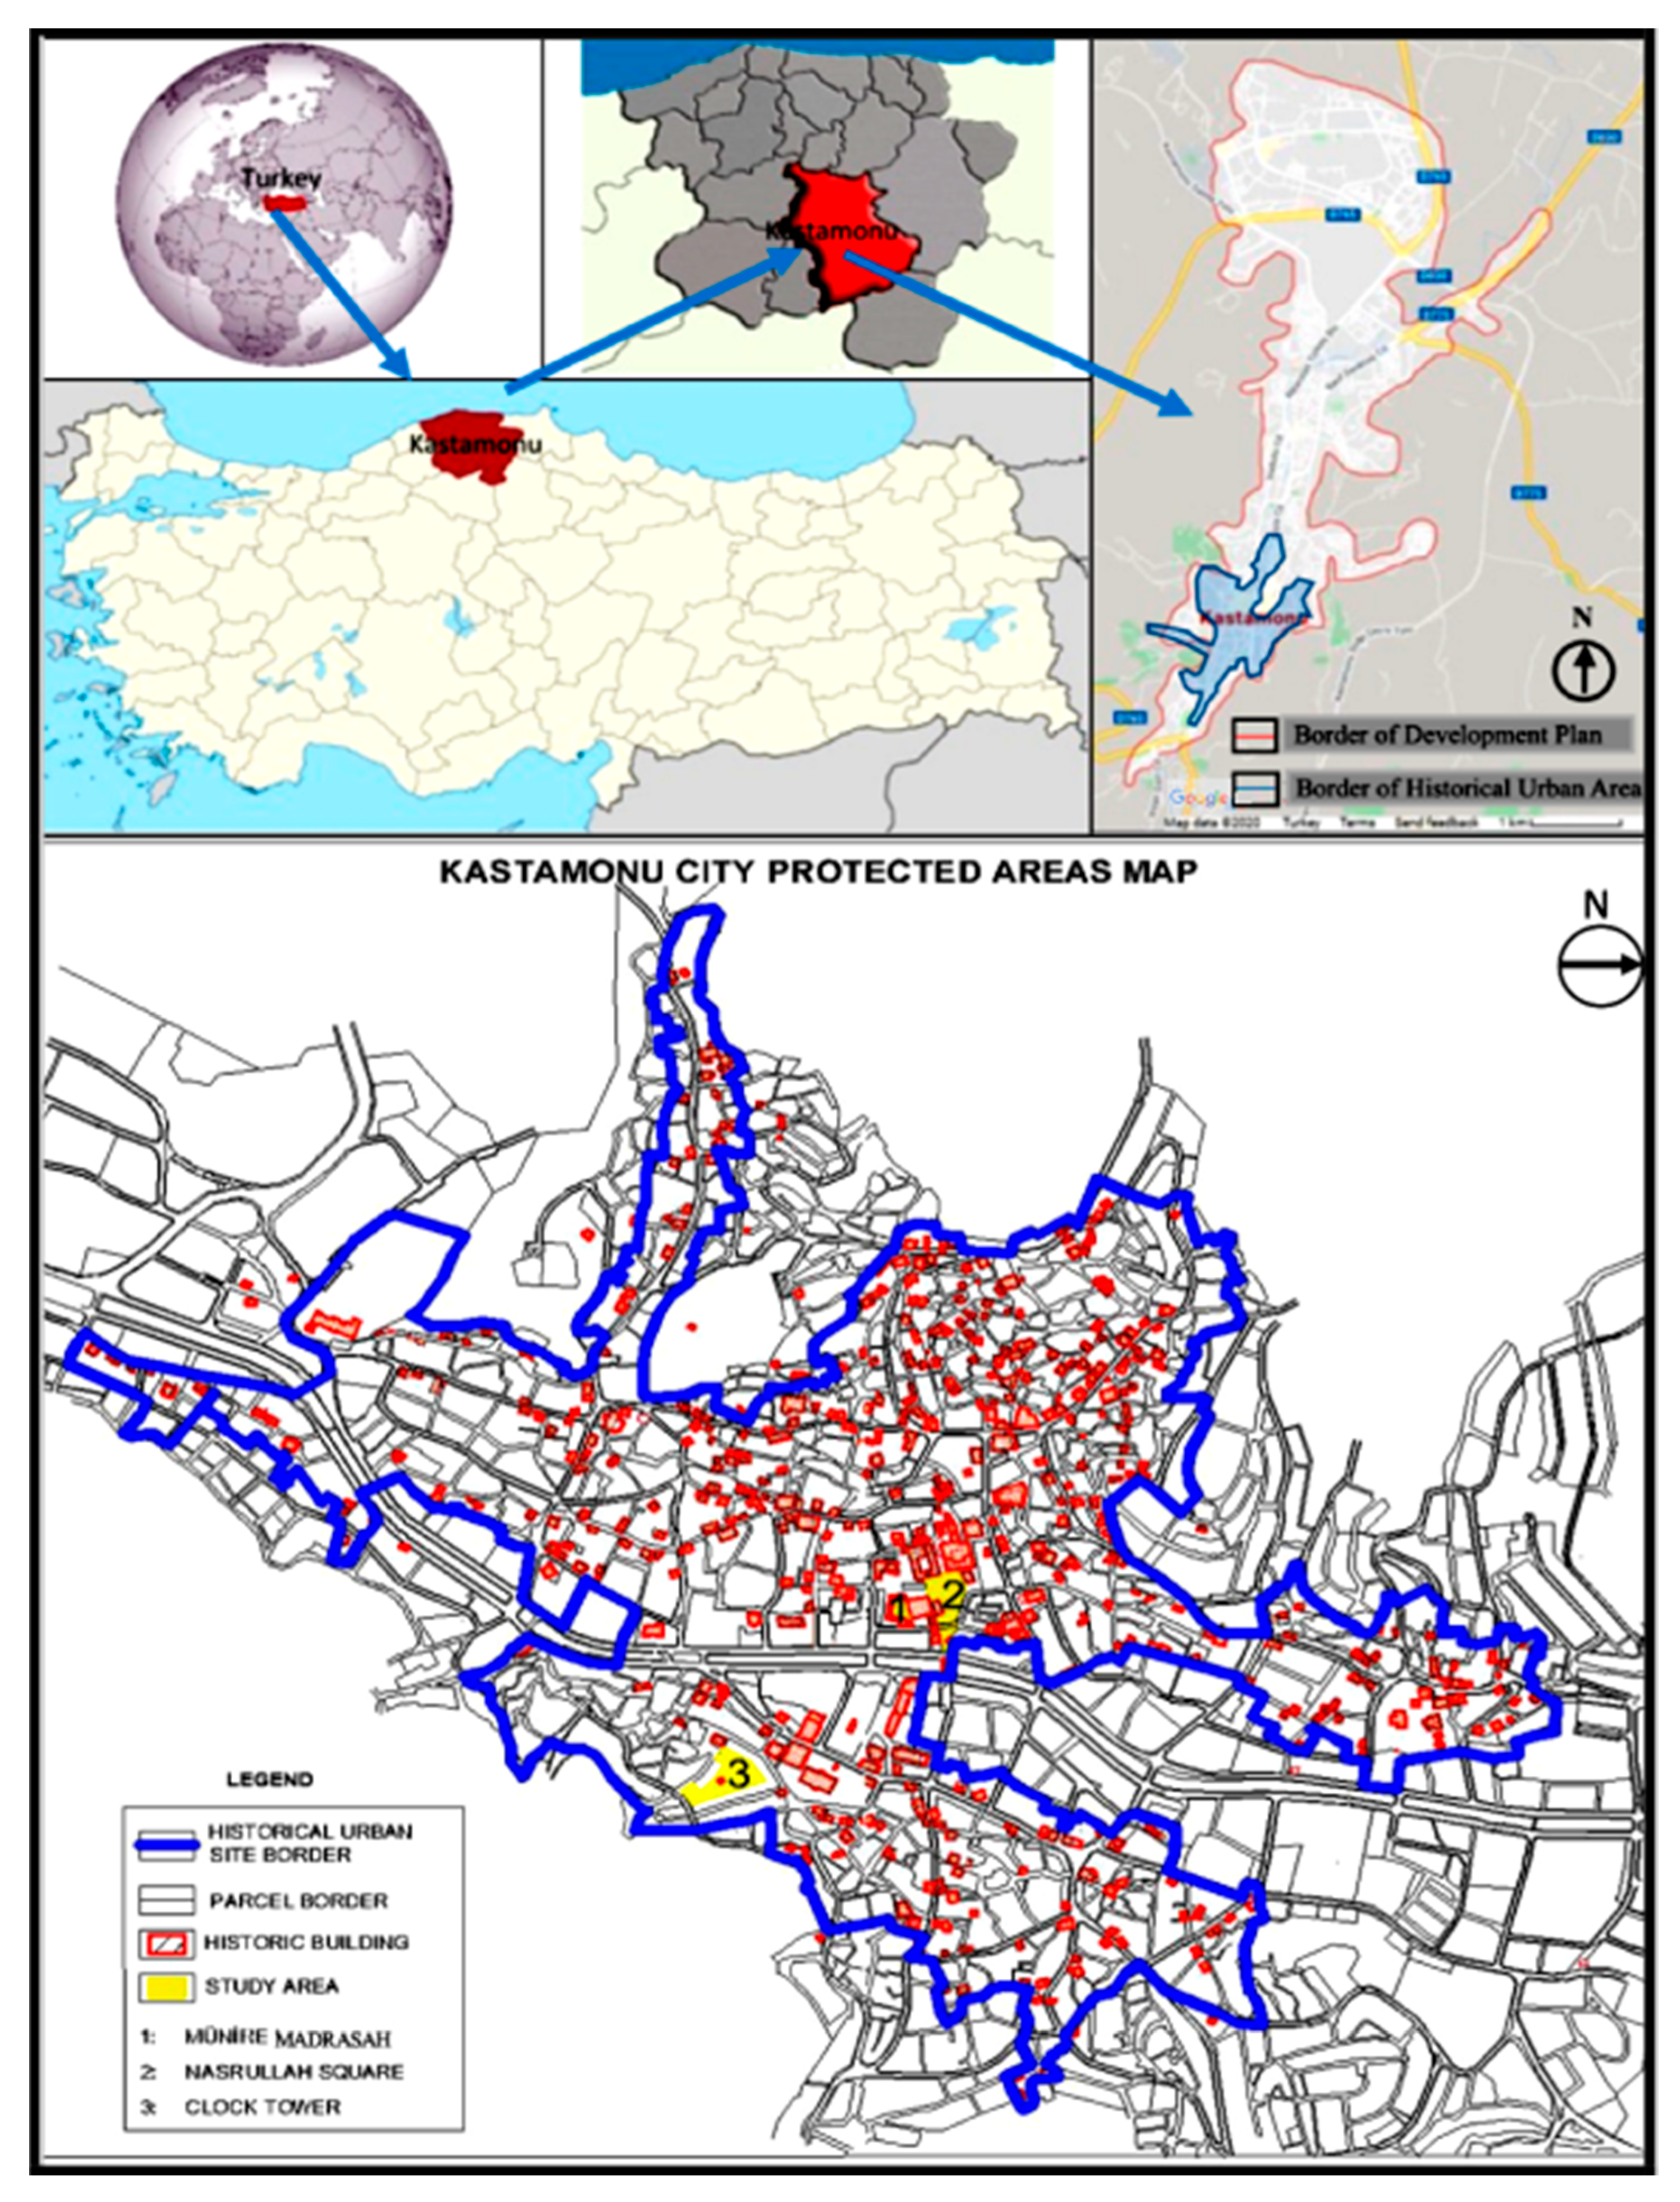
2.1. Study Area
- 1.
- Münire Madrasah
- 2.
- Nasrullah Square
- 3.
- Clock Tower

| Münire Madrasah |  Source: [34] |  | |
| Period | Past 1900s | Present 2000s | |
| Function | Education | Commercial, Tourism | |
| Nasrullah Square | 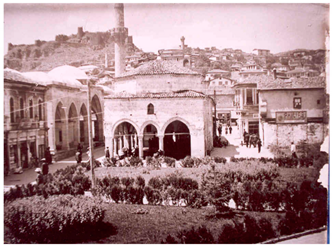 Source: [35] | 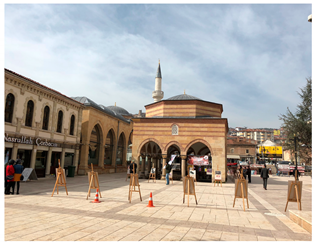 | |
| Period | Past 1900s | Present 2000s | |
| Function | Religious, Commercial, Recreation | Religious, Commercial, Recreation, Tourism | |
| Clock Tower | Past | Present | |
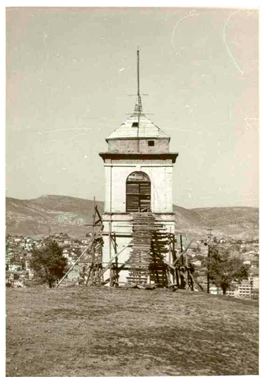 Source: [33] |  | ||
| Period | Past 1900s | Present 2000s | |
| Function | Recreation | Tourism, Recreation | |
2.2. Method
3. Results
3.1. Sound Sources
3.1.1. Münire Madrasah
3.1.2. Nasrullah Square
3.1.3. Clock Tower
3.2. Sound Pressure Level
3.2.1. Münire Madrasah
3.2.2. Nasrullah Square
3.2.3. Clock Tower
3.3. Noise Maps
3.3.1. Münire Madrasah
3.3.2. Nasrullah Square
3.3.3. Clock Tower
4. Discussion
5. Conclusions
Author Contributions
Funding
Institutional Review Board Statement
Informed Consent Statement
Data Availability Statement
Acknowledgments
Conflicts of Interest
References
- Brambilla, G.; Maffei, L. Perspective of the soundscape approach as a tool for urban space design. Noise Control. Eng. J. 2010, 58, 532–539. [Google Scholar] [CrossRef]
- UNESCO. Recommendation on the Historic Urban Landscape. Available online: https://whc.unesco.org/uploads/activities/documents/activity-638-98.pdf (accessed on 18 June 2021).
- UNESCO. Intangible Cultural Heritage. Available online: https://www.unesco.org.tr/Pages/52/19/Somut-Olmayan-K%C3%BClt%C3%BCrel-Miras-%C4%B0htisas-Komitesi (accessed on 18 June 2021).
- Garrioch, D. Sounds of the city: The soundscape of early modern European towns. Urban. Hist. 2003, 30, 5–25. [Google Scholar] [CrossRef] [Green Version]
- Liu, J.; Kang, J.; Luo, T.; Behm, H.; Coppack, T. Spatiotemporal variability of soundscapes in a multiple functional urban area. Landsc. Urban. Plan. 2013, 115, 1–9. [Google Scholar] [CrossRef]
- Huang, L.; Kang, J. The sound environment and soundscape preservation in historic city centers-the case study of Lhasa. Environ. Plan. Plan. Des. 2015, 42, 652–674. [Google Scholar] [CrossRef]
- Ge, J.; Hokao, K. Applying the methods of image evaluation and spatial analysis to study the sound environment of urban street areas. J. Environ. Psychol. 2005, 25, 455–466. [Google Scholar] [CrossRef]
- Ismail, M.R. Sound preferences of the dense urban environment: Soundscape of Cairo. Front. Archit. Res. 2014, 3, 55–68. [Google Scholar] [CrossRef] [Green Version]
- Dubois, D.; Guastavino, C.; Raimbault, M. A cognitive approach to urban soundscapes: Using verbal data to access everyday life auditory categories. Acta Acust. United Acust. 2006, 92, 865–874. [Google Scholar]
- Adams, M.; Cox, T.; Moore, G.; Croxford, B.; Refaee, M.; Sharples, S. Sustainable soundscapes: Noise policy and the urban experience. Urban. Stud. 2006, 43, 2385–2398. [Google Scholar] [CrossRef]
- Yu, L.; Kang, J. Factors influencing the sound preference in urban open spaces. Appl. Acoust. 2010, 71, 622–633. [Google Scholar] [CrossRef] [Green Version]
- Zhang, M.; Kang, J. Towards the evaluation, description and creation of soundscapes in urban open spaces. Environ. Plan. Plan. Des. 2007, 34, 68–86. [Google Scholar] [CrossRef]
- WHO. Guidelines for Community Noise, Edited by Birgitta Berglund, Thomas Lindvall, Dietrich H Schwela; World Health Organization: Geneva, Switzerland, 1995. [Google Scholar]
- Cain, R.; Jennings, P.; Adams, M.; Bruce, N.; Carlyle, A.; Cusack, P.; Davies, W.; Hume, K.; Plack, C.J. Sound-Scape: A framework for characterising positive urban soundscapes. J. Acoust. Soc. Am. 2008, 123, 3394. [Google Scholar] [CrossRef]
- Raimbault, M.; Dubois, D. Urban soundscapes: Experiences and knowledge. Cities 2005, 22, 339–350. [Google Scholar] [CrossRef]
- Brown, A.L.; Muhar, A. An Approach to the acoustic design of outdoor space. J. Environ. Plan. Manag. 2004, 47, 827–842. [Google Scholar] [CrossRef] [Green Version]
- Zuo, L.; Zhang, J.; Zhang, R.J.; Zhang, Y.; Hu, M.; Zhuang, M.; Liu, W. The transition of soundscapes in tourist destinations from the perspective of residents’ perceptions: A case study of the Lugu Lake Scenic Spot, Southwestern China. Econ. Lit. 2020, 12, 1073. [Google Scholar] [CrossRef] [Green Version]
- Schafer, R.M. The Soundscape: Our Sonic Environment and the Tuning of the World; Destiny Books: Rochester, VT, USA, 1993. [Google Scholar]
- Tsai, K.T.; Lin, M.; Chen, Y.H. Noise mapping in urban environments: A Taiwan study. Appl. Acoust. 2009, 70, 964–972. [Google Scholar] [CrossRef]
- Guastavino, C. The ideal urban soundscape: Investigating the sound quality of French Cities. Acta Acust. United Acust. 2006, 92, 945–961. [Google Scholar]
- Li, R.; Ou, D.; Pan, S. An improved service quality measurement model for soundscape assessment in urban public open spaces. Indoor Built Environ. 2020, 1420326X20925527. [Google Scholar] [CrossRef]
- Brambilla, G.; De Gregorio, L.; Maffei, L.; Can, Z.Y.; Ozcevik, A. Comparison of the Soundscape in the Historical Centers of Istanbul and Naples in Proceedings of Inter-Noise07; Institute of Noise Control Engineering: Istanbul, Turkey, 2007; pp. 2640–3477. [Google Scholar]
- Zhou, Z.; Kang, J.; Jin, H. Factors that influence soundscapes in historical areas. Noise Control. Eng. J. 2014, 62, 60–68. [Google Scholar] [CrossRef]
- Djimantoro, M.I.; Martokusumo, W.; Poerbo, H.W.; Sarwono, R.J. The historical soundscape analysis of Fatahillah Square, Jakarta. Acoustics 2020, 2, 847–867. [Google Scholar] [CrossRef]
- Kastamonu Municipality. Kastamonu Zoning Plan; Modul Planning: Kastamonu, Turkey, 1996. [Google Scholar]
- Guloglu, Y.; Bulut, A.; Altunel, A.O.; Bayramoglu, M.M. The effect of population shift on land cover change and illegal forest activities. Environ. Monit. Assess. 2021, 193, 1–13. [Google Scholar] [CrossRef]
- Turkish Statistical Institute. Kastamonu Central District Population. Available online: https://www.nufusune.com/kastamonu-nufusu (accessed on 10 June 2020).
- KDCT. Kastamonu Province Tourist Statistics. Kastamonu Provincial Directorate of Culture and Tourism. Available online: https://www.kastabil.gov.tr/veritablolari/kastamonu/kultur-ve-turizm/kultur-ve-turizm-bakanligi-na-bagli-muze-ve-oren-yerlerinin-ziyaretci-sayisi-ve-geliri (accessed on 18 June 2021).
- Yıldız, T. Kastamonu Central District Analysis; North Anatolian Development Agency: Kastamonu, Turkey, 2013. Available online: https://www.kuzka.gov.tr/Icerik/Dosya/www.kuzka.gov.tr_16_PO2G10AN_kastamonu_merkez_ilce_analizi.pdf (accessed on 10 June 2020).
- KDCT. Civil Architecture and Mansions. Kastamonu Provincial Directorate of Culture and Tourism. Available online: https://kastamonu.ktb.gov.tr/TR-63867/tarihi-evler-ve-konaklar.html (accessed on 10 June 2020).
- KDCT. Kastamonu Münire Medresesi, Kastamonu Provincial Directorate of Culture and Tourism. Available online: https://kastamonu.ktb.gov.tr/TR-95228/munire-medresesi-el-sanatlari-carsisi.html (accessed on 10 June 2020).
- KDCT. Nasrullah Square. Kastamonu Provincial Directorate of Culture and Tourism. Available online: https://kastamonu.ktb.gov.tr/TR-93960/nasrullah-kadi-kulliyesi.html (accessed on 10 June 2020).
- KDCT. Kastamonu Clock Tower. Kastamonu Provincial Directorate of Culture and Tourism. Available online: https://www.kulturportali.gov.tr/turkiye/kastamonu/gezilecekyer/saat-kules528735 (accessed on 10 June 2020).
- Koç, M. The Relationship Status in Kastamonu after World War I–II. Available online: https://www.kastamonur.com/1-dunya-savasi-sonrasi-kastamonuda-asayis-durumu-ii/ (accessed on 10 June 2020).
- Ugurlukonaklari. Past of Kastamonu. Available online: https://ugurlukonaklari.com/galeri-2/ (accessed on 10 June 2020).
- Szeremeta, B.; Zannin, P.H.T. Analysis and evaluation of soundscapes in public parks through interviews and measurement of noise. Sci. Total. Environ. 2009, 407, 6143–6149. [Google Scholar] [CrossRef]
- Stimac, A. Implementation of Directive 2002/49/EC in EU Candidate State: Experience in Croatian Noise Mapping Projects. Forum Acusticum Budapest 2005, L53–L58. Available online: https://www.researchgate.net/profile/Alan-Stimac/publication/228479304_Implementation_of_Directive_200249EC_in_EU_Candidate_State_Experience_in_Croatian_noise_mapping_projects/links/57dbce7c08aeea195934f2c1/Implementation-of-Directive-2002-49-EC-in-EU-Candidate-State-Experience-in-Croatian-noise-mapping-projects.pdf (accessed on 12 June 2020).
- Maffei, L. Urban and Quiet Areas Soundscape Preservation. In Proceedings of the VI Congreso Iberoamericano de Acustica FIA 2008, Buenos Aires, Argentina, 5–7 November 2008. [Google Scholar]
- Akpınar, N.; Belkayalı, N.; Kaymaz, I.; Turan, F.; Büyükşahin, S.A.; Oğuz, D. The Perception of Soundscape and User Preferences in Urban. Parks within the Scope of Quality of Life: Ankara Sample, Tubitak Project Result Report no.110Y186; The Scientific and Technological Research Council of Turkey: Ankara, Turkey, 2013. [Google Scholar]
- Bocher, E.; Petit, G.; Picaut, J.; Fortin, N.; Guillaume, G. Collaborative noise data collected from smartphones. Data Brief. 2017, 14, 498–503. [Google Scholar] [CrossRef]
- Schulte-Fortkamp, B.; Lercher, P. The Importance of Soundscape Research for the Assessment of Noise Annoyance at the Level of the Community, TecniAcustica, Bilbao. 2003. Available online: http://www.sea-acustica.es/fileadmin/publicaciones/Bilbao03_aam008.pdf (accessed on 12 June 2020).
- GDEM. Environmental Noise Measurement and Evaluation Guide; General Directorate of Environmental Management: Ankara, Turkey, 2011. [Google Scholar]
- Guillaume, G.; Can, A.; Petit, G.; Fortin, N.; Palominos, S.; Gauvreau, B.; Bocher, E.; Picaut, J. Noise mapping based on participative measurements. Noise Mapp. 2016, 3, 140–156. [Google Scholar] [CrossRef] [Green Version]
- Carles, J.L.; Barrio, I.L.; de Lucio, J.V. Sound influence on landscape values. Landsc. Urban. Plan. 1999, 43, 191–200. [Google Scholar] [CrossRef]
- Firstcom Music. Historical Music for Productions. Available online: https://www.firstcom.com/en-us/explore/music-for/historical (accessed on 19 June 2021).
- Barrigón Morillas, J.M.; Gómez Escobar, V.; Rey Gozalo, G. Noise source analyses in the acoustical environment of the medieval centre of Cáceres (Spain). Appl. Acoust. 2013, 74, 526–534. [Google Scholar] [CrossRef]
- Yang, W.; Kang, J. Acoustic comfort evaluation in urban open public spaces. Appl. Acoust. 2005, 66, 211–229. [Google Scholar] [CrossRef]
- Nilsson, M.E.; Berglund, B. Soundscape quality in suburban green areas and city parks. Acta Acust. United Acust. 2006, 92, 857–864. [Google Scholar]
- Tardieu, J.; Susini, P.; Poisson, F.; Lazareff, P.; McAdams, S. Perceptual study of soundscapes in train stations. Appl. Acoust. 2008, 69, 1224–1239. [Google Scholar] [CrossRef] [Green Version]
- Cassina, L.; Fredianelli, L.; Menichini, I.; Chiari, C.; Licitra, G. Audio-Visual Preferences and Tranquillity Ratings in Urban Areas. Environments 2018, 5, 1. [Google Scholar] [CrossRef] [Green Version]
- Kang, J.; Yang, W.; Zhang, M. Sound environment and acoustic comfort in urban spaces. In Design Open Spaces in the Urban Environment: A Bioclimatic Approach; Nikolopoulou, M., Ed.; Centre for Renewable Energy Sources, EESD, FP5: Attiki, Greece, 2004; pp. 32–36. [Google Scholar]
- Yi, C.; Huang, C. Residents’ perception and attitude of the tourism impact of the Global Dinosaur Town in Changzhou City. Geogr. Res. 2013, 32, 1165–1176. [Google Scholar]
- Jennings, P.; Cain, R. A framework for improving urban soundscapes. Appl. Acoust. 2013, 74, 293–299. [Google Scholar] [CrossRef] [Green Version]
- Kang, J. From environmental noise control to soundscape design. Int. J. Acoust. Vibr. 2015, 20, 62. [Google Scholar]
- Buxton, R.T.; Pearson, A.L.; Allou, C.; Fristrup, K.; Wittemyer, G. A synthesis of heaty benefits of natural sounds and their distribution in national parks. Proc. Natl. Acad. Sci. USA 2020, 118, 1–6. [Google Scholar] [CrossRef]
- Zhang, Y.; Kang, J.; Kang, J. Effects of soundscape on the environmental restoration in urban natural environments. Noise Health 2017, 19, 65–72. [Google Scholar] [CrossRef] [PubMed]


| Specific Environment | Critical Health Effect(s) | LAeq [dB(A)] | Time Base [Hours] |
|---|---|---|---|
| Outdoor living area | Serious annoyance, daytime and evening | 55 | 16 |
| Moderate annoyance, daytime and evening | 50 | 16 | |
| Industrial, commercial shopping and traffic areas, indoors and outdoors | Hearing impairment | 70 | 24 |
| Outdoors in parkland and conservations areas | Disruption of tranquility | #3 |
| Location | Season | Winter | Summer | ||||||||||
|---|---|---|---|---|---|---|---|---|---|---|---|---|---|
| Week | Weekday | Weekend | Weekday | Weekend | |||||||||
| Day | m | n | e | m | n | e | m | n | e | m | n | e | |
| Münire Madrasah | Temperature (°C) | 15 | 10 | 8 | 19 | 21 | 14 | 24 | 24 | 23 | 22 | 23 | 23 |
| Humidity (%) | 40 | 75 | 75 | 40 | 40 | 92 | 57 | 57 | 1 | 50 | 52 | 31 | |
| Wind velocity (km/h) | 18 | 8 | 8 | 5 | 5 | 4 | 11 | 11 | 8 | 4 | 7 | 6 | |
| Precipitation (mm) | 0 | 0 | 0 | 0 | 0 | 1.1 | 0.2 | 0.2 | 0.1 | 0.6 | 0.5 | 0.2 | |
| Altitude (m) | 781 ± 3 | ||||||||||||
| Nasrullah Square | Temperature (°C) | 15 | 10 | 8 | 19 | 21 | 14 | 24 | 24 | 22 | 22 | 23 | 25 |
| Humidity (%) | 40 | 75 | 75 | 40 | 40 | 92 | 57 | 57 | 1 | 50 | 52 | 42 | |
| Wind velocity (km/h) | 18 | 8 | 8 | 5 | 5 | 4 | 11 | 11 | 6 | 4 | 7 | 8 | |
| Precipitation (mm) | 0 | 0 | 0 | 0 | 0 | 1.1 | 0.2 | 0.2 | 0.1 | 0.6 | 0.5 | 0.2 | |
| Altitude (m) | 781∓4 | ||||||||||||
| Clock Tower | Temperature (°C) | 15 | 10 | 17 | 15 | 8 | 7 | 22 | 23 | 23 | 23 | 23 | 23 |
| Humidity (%) | 40 | 75 | 40 | 48 | 76 | 24 | 64 | 59 | 1 | 55 | 55 | 55 | |
| Wind velocity (km/h) | 18 | 8 | 5 | 11 | 11 | 10 | 7 | 11 | 8 | 7 | 7 | 7 | |
| Precipitation (mm) | 0 | 0 | 0 | 0 | 0 | 0 | 0.1 | 0.2 | 0.1 | 0 | 0 | 1 | |
| Altitude (m) | 816 ± 24 | ||||||||||||
| Location | Periodicity | Type | Sound Sources |
|---|---|---|---|
| 1. Münire Madrasah | Continual | Human-produced | Human sound (voice, walking, children) |
| Periodic | Human-produced | Human sound (vendors shouting) | |
| 2. Nasrullah Square | Continual | Human-produced | Traffic sound, Human sound (voice, walking, children) |
| Natural | Geophysical sound (water sound) | ||
| Periodic | Human-produced | Human sound (vendors shouting, prayer sound), Mechanical sound (music) | |
| Natural | Biological sound (birds) | ||
| 3. Clock Tower | Periodic | Human-produced | Mechanical sound (bells, music), Human sound (voice) |
| Natural | Atmospheric sound (wind) |
| Place | Season | Winter | Summer | ||||||||||
|---|---|---|---|---|---|---|---|---|---|---|---|---|---|
| Period | Weekdays | Weekend | Weekdays | Weekend | |||||||||
| SPL | m | n | e | m | n | e | m | n | e | m | n | e | |
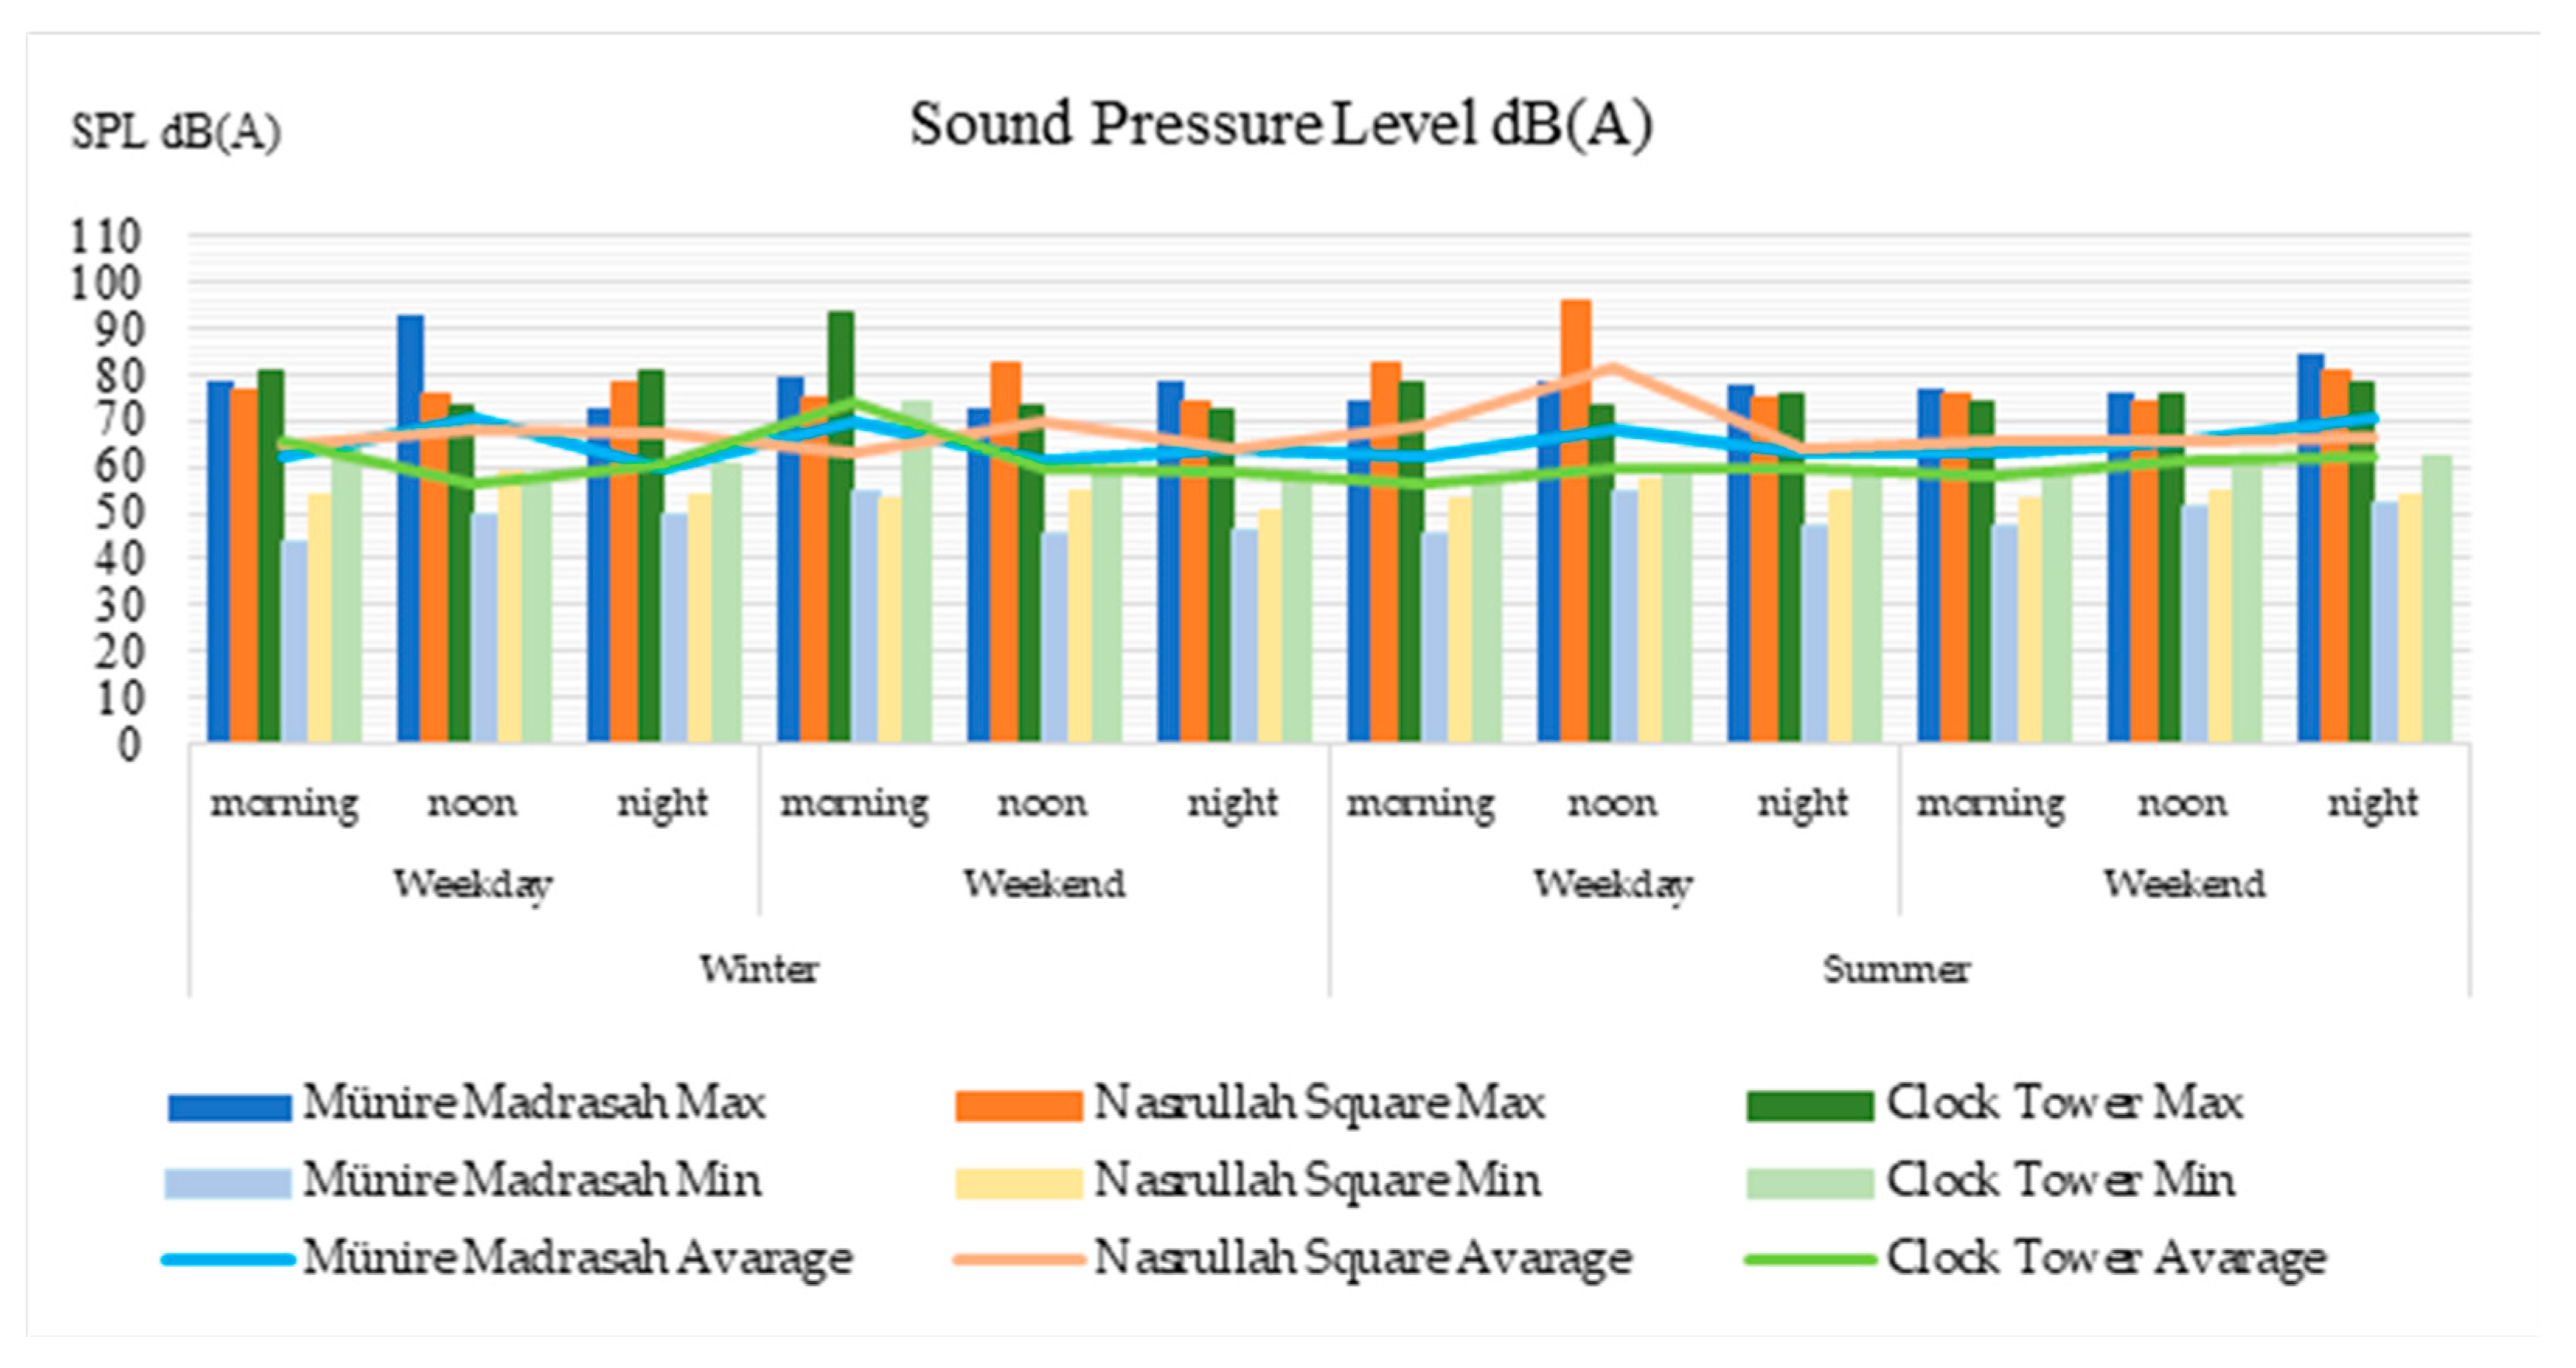
| Münire Madrasah | Leq max | 78.9 | 93.2 | 72.5 | 79.4 | 72.5 | 78.4 | 74.0 | 78.8 | 78.1 | 77.1 | 75.7 | 84.3 |
| Leq min | 44.0 | 49.8 | 49.9 | 54.2 | 45.3 | 46.5 | 45.7 | 54.9 | 47.3 | 47.2 | 51.1 | 52.4 | |
| Mean Leq | 61.8 | 70.8 | 60.0 | 70.0 | 61.7 | 64.2 | 62.3 | 67.9 | 63.0 | 63.1 | 65.2 | 70.4 | |
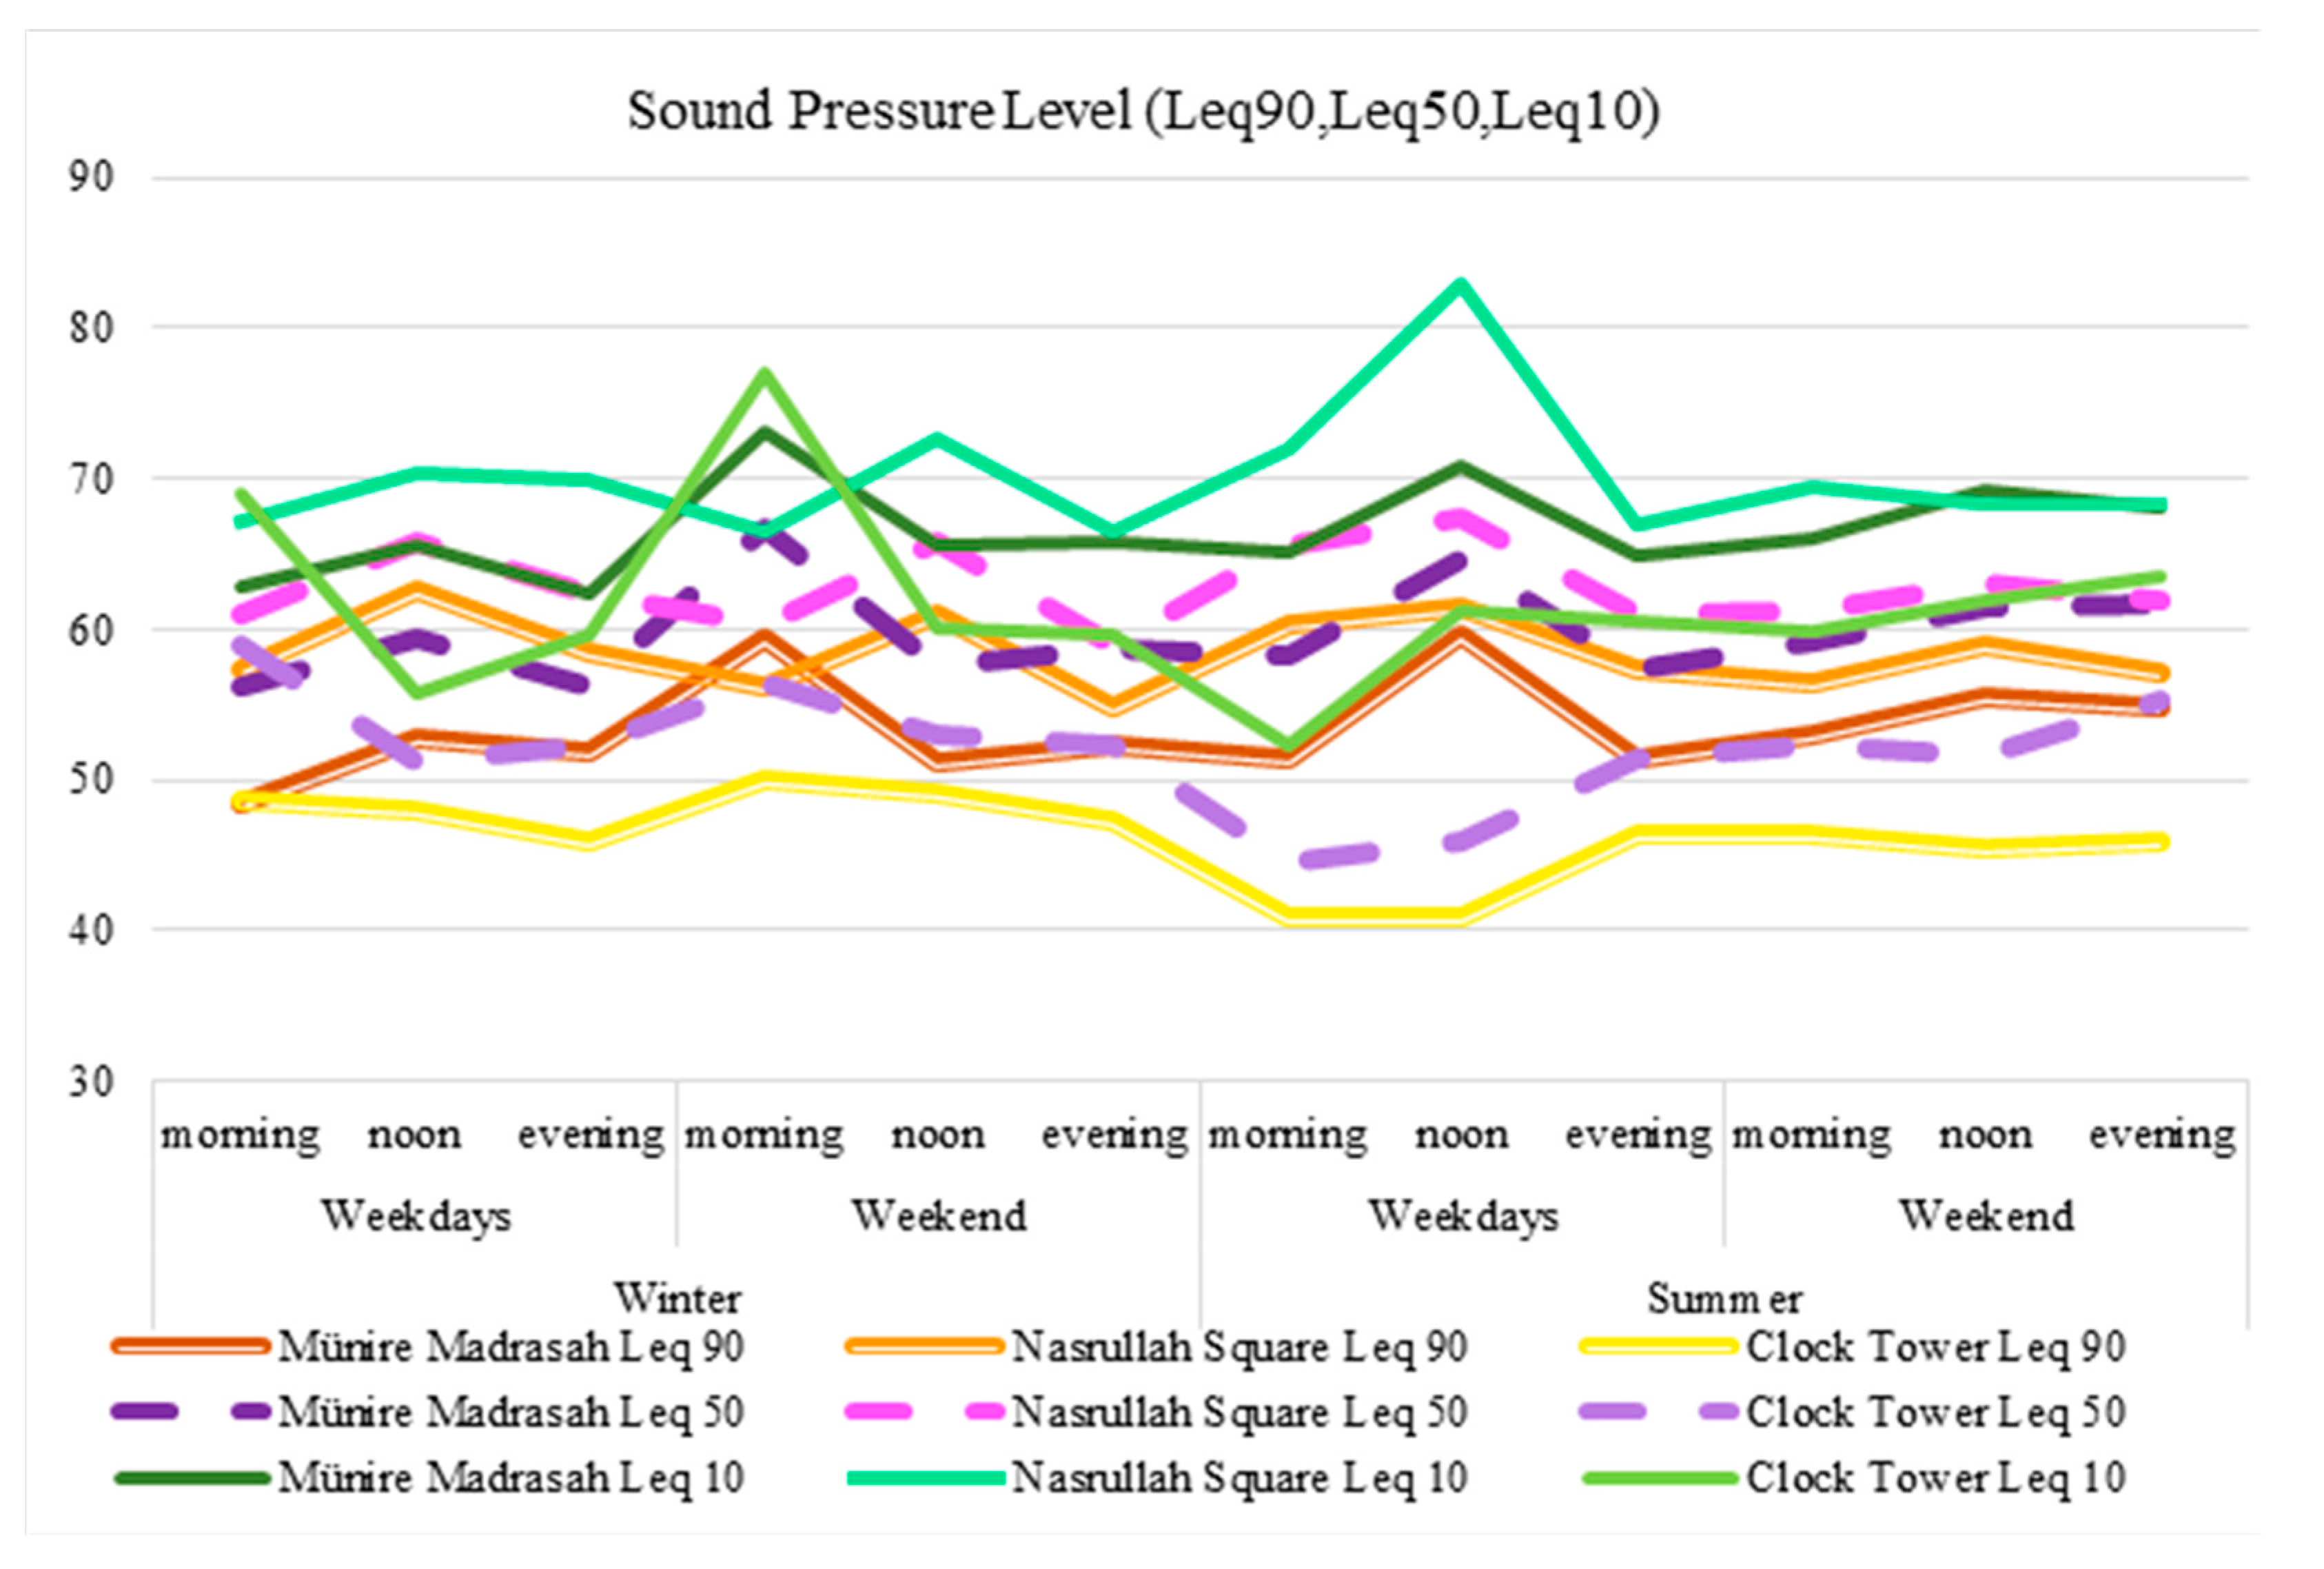
| Leq 90 | 48.5 | 52.8 | 51.9 | 59.3 | 51.1 | 52.4 | 51.5 | 59.6 | 51.3 | 53.1 | 55.6 | 54.8 | |
| Leq 50 | 56.2 | 59.4 | 56.2 | 66.7 | 57.5 | 58.8 | 58.3 | 64.6 | 57.4 | 59.2 | 61.5 | 61.7 | |
| Leq 10 | 62.8 | 65.5 | 62.3 | 73.1 | 65.6 | 65.9 | 65.2 | 70.9 | 64.9 | 66.1 | 69.3 | 68.1 | |
| Nasrullah Square | Leq max | 76.2 | 75.4 | 78.4 | 74.5 | 82.4 | 74.3 | 82.0 | 96.1 | 75.1 | 75.2 | 74.3 | 80.4 |
| Leq min | 54.0 | 58.5 | 53.6 | 52.8 | 55.0 | 50.4 | 53.1 | 56.9 | 54.9 | 52.9 | 54.7 | 53.4 | |
| Mean Leq | 64.6 | 68.0 | 67.0 | 63.3 | 69.8 | 63.5 | 68.9 | 81.1 | 64.2 | 65.4 | 65.3 | 66.2 | |
| Leq 90 | 57.3 | 62.7 | 58.4 | 56.1 | 61.0 | 54.8 | 60.2 | 61.4 | 57.3 | 56.4 | 58.9 | 57.1 | |
| Leq 50 | 60.9 | 65.7 | 62.3 | 60.4 | 65.8 | 59.0 | 65.5 | 67.4 | 60.9 | 61.2 | 63.1 | 61.9 | |
| Leq 10 | 67.2 | 70.4 | 70.0 | 66.4 | 72.7 | 66.4 | 71.9 | 82.9 | 66.9 | 69.4 | 68.4 | 68.3 | |
| Clock Tower | Leq max | 80.3 | 72.8 | 80.3 | 93.0 | 73.4 | 72.5 | 77.8 | 73.2 | 76.0 | 73.8 | 75.6 | 77.8 |
| Leq min | 45.9 | 45.3 | 41.8 | 46.8 | 44.9 | 42.7 | 38.4 | 38.7 | 43.4 | 41.4 | 41.4 | 40.7 | |
| Mean Leq | 65.3 | 56.2 | 60.3 | 74.3 | 59.6 | 58.8 | 56.5 | 59.3 | 59.5 | 58.2 | 61.5 | 62.5 | |
| Leq 90 | 48.6 | 48.0 | 46.0 | 50.0 | 49.2 | 47.2 | 40.8 | 40.9 | 46.4 | 46.3 | 45.4 | 46.0 | |
| Leq 50 | 59.0 | 51.1 | 52.4 | 56.4 | 53.0 | 52.4 | 44.5 | 46.0 | 51.5 | 52.2 | 51.6 | 55.3 | |
| Leq 10 | 68.9 | 55.8 | 59.7 | 77.0 | 60.0 | 59.6 | 52.4 | 61.2 | 60.5 | 59.9 | 61.8 | 63.5 | |
| Period | Morning | Noon | Night | |
|---|---|---|---|---|
| Winter | Weekday |  | 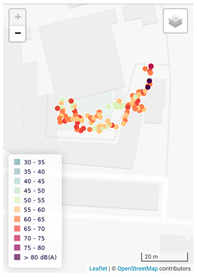 | 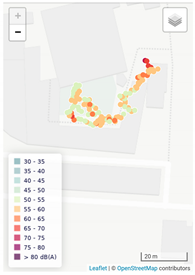 |
| Weekend | 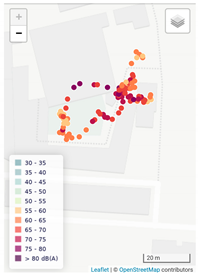 | 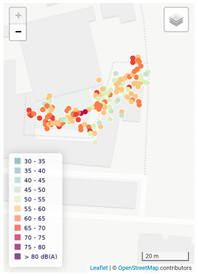 |  | |
| Summer | Weekday | 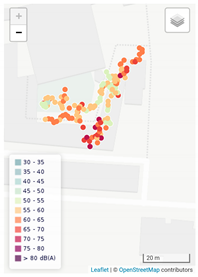 | 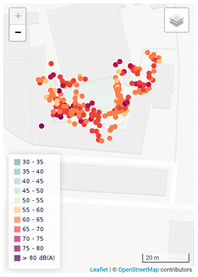 | 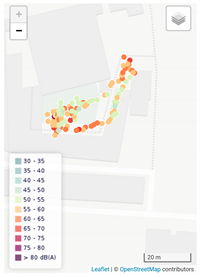 |
| Weekend | 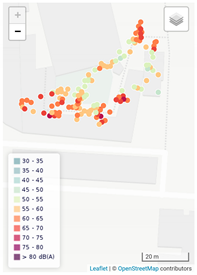 | 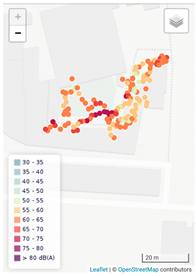 | 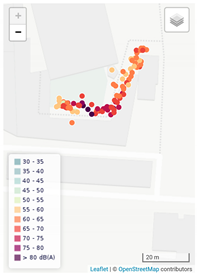 | |
| Period | Morning | Noon | Night | |
|---|---|---|---|---|
| Winter | Weekday | 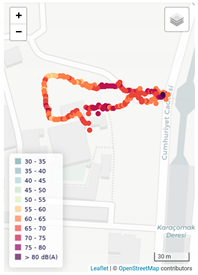 | 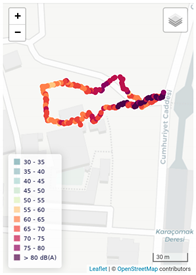 | 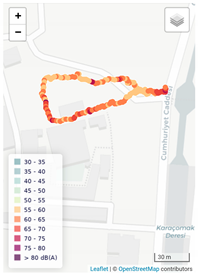 |
| Weekend |  |  | 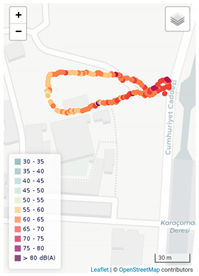 | |
| Summer | Weekday |  | 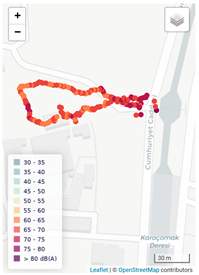 | 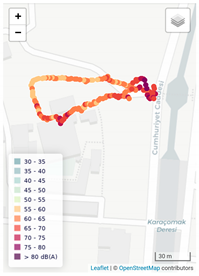 |
| Weekend |  | 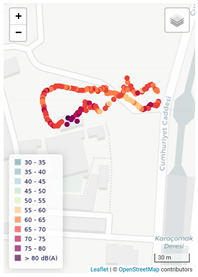 | 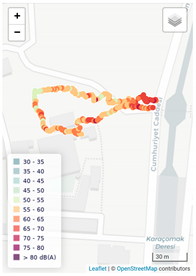 | |
| Period | Morning | Noon | Night | |
|---|---|---|---|---|
| Winter | Weekday | 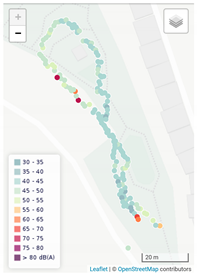 | 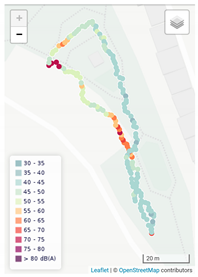 | 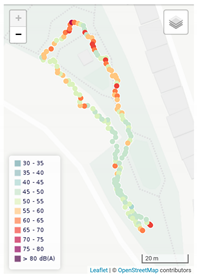 |
| Weekend | 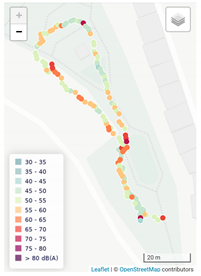 | 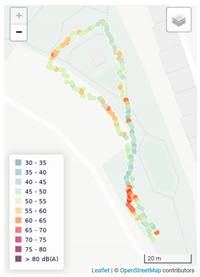 |  | |
| Summer | Weekday |  | 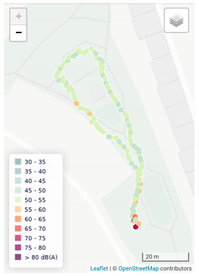 | 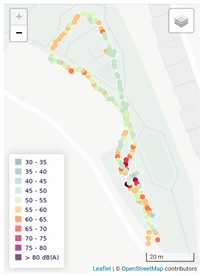 |
| Weekend | 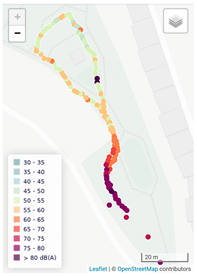 | 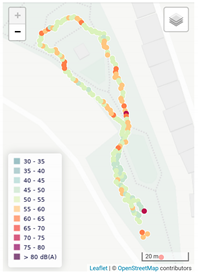 | 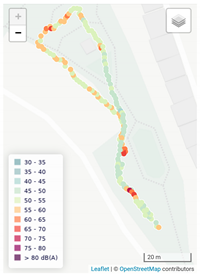 | |
Publisher’s Note: MDPI stays neutral with regard to jurisdictional claims in published maps and institutional affiliations. |
© 2021 by the authors. Licensee MDPI, Basel, Switzerland. This article is an open access article distributed under the terms and conditions of the Creative Commons Attribution (CC BY) license (https://creativecommons.org/licenses/by/4.0/).
Share and Cite
Belkayalı, N.; Kaymaz, I. Acoustic Environment of Urban Historical Places: A Case Study in Kastamonu, Turkey. Sustainability 2021, 13, 8423. https://doi.org/10.3390/su13158423
Belkayalı N, Kaymaz I. Acoustic Environment of Urban Historical Places: A Case Study in Kastamonu, Turkey. Sustainability. 2021; 13(15):8423. https://doi.org/10.3390/su13158423
Chicago/Turabian StyleBelkayalı, Nur, and Işıl Kaymaz. 2021. "Acoustic Environment of Urban Historical Places: A Case Study in Kastamonu, Turkey" Sustainability 13, no. 15: 8423. https://doi.org/10.3390/su13158423
APA StyleBelkayalı, N., & Kaymaz, I. (2021). Acoustic Environment of Urban Historical Places: A Case Study in Kastamonu, Turkey. Sustainability, 13(15), 8423. https://doi.org/10.3390/su13158423