Article

Earthquake Evacuation Choice and Management in a Developing Archipelagic Country—A Case Study of Surigao City, Philippines

by
Sherwin Roy Calumba
1,
Monorom Rith
2,3 and
Alexis M. Fillone
1,*
1
Civil Engineering Department, De La Salle University, Metro Manila 1004, Philippines
2
School of Civil Engineering and Technology, Sirindhorn International Institute of Technology, Thammasat University, Pathum Thani 12120, Thailand
3
The Joint Graduate School of Energy and Environment, King Mongkut’s University of Technology Thonburi, Bangkok 10140, Thailand
*
Author to whom correspondence should be addressed.
Sustainability 2021, 13(11), 5783; https://doi.org/10.3390/su13115783
Submission received: 14 March 2021 / Revised: 11 May 2021 / Accepted: 18 May 2021 / Published: 21 May 2021
(This article belongs to the Collection Sustainable Urban Mobility Project)

Abstract

:
The Philippines is a developing archipelagic country in Southeast Asia. The country is susceptible to multiple natural disasters, specifically earthquakes. This implies the significance of understanding earthquake evacuation choice in order to design effective planning and management of evacuation to minimize chaos, damage cost, and the loss of lives. This study investigated the determinants of earthquake evacuation and proposed earthquake evacuation planning and management in the Philippines, featuring the case study of Surigao City. The study used the primary dataset of 1055 observations gathered in 2019 and applied the nested logit model (NLM) to investigate the potential factors of earthquake evacuation decisions. We considered three output variables: evacuation choice, evacuation duration, and travel mode choice. We found that residents were more likely to evacuate their homes upon receiving an earthquake warning and move to a public shelter or open space. Additionally, respondents were more inclined to leave their homes when their houses suffered from moderate to severe/complete damage or when electricity and water supply were cut-off. Respondents were most likely to walk to evacuation centers as the majority of residents initially moved to the nearest open space immediately after an earthquake and stayed in an open space for less than 6 hours. No correlation was found between personal and household income factors with evacuation choice and travel mode choice. Furthermore, the study used the Analytical Hierarchy Process (AHP) to determine areas suitable for earthquake evacuation using insights from local government officials and planners. The areas identified for earthquake evacuation were developed to support evacuation planning and management.

1. Introduction

The Philippines is a developing archipelagic country with 7,641 islands, located in Southeast Asia [1]. The country experienced an average economic growth of 6.6% annually from 2017 to 2019 [2] with a total population of 104.9 million in 2018 [1]. According to the World Risk Report 2018, the Philippines is the world’s third-highest disaster-prone country, with an index value of 25.14% [1]. At least 60% of the country’s total land area is prone to multiple disasters, and 74% of the total population is exposed to these disaster impacts [3]. According to official data from the Philippine Institute of Volcanology and Seismology (PHIVOLCS), the Philippines is geographically located near 54 active volcanoes, and earthquakes frequently occur up to eighteen times per day, on average [4]. Its proximity to the Eurasian and Pacific tectonic plates makes it more vulnerable to seismic activities that can generate high-magnitude earthquakes in the most seismic-prone areas (e.g., Manila and Davao) [5]. An earthquake with a 5.0–6.0 M is likely to occur over most of the Philippines in the next 50 years with a near-100% probability, and an earthquake with a 7.0 M will almost certainly occur anywhere across the entire country, also with a near-100% probability [5]. Historically, three destructive earthquakes happened, on average, per year in the Philippines [4]. These earthquakes caused various degrees of damage to various structures and utilities. The epicenter of an earthquake mainly triggers tsunamis and coastal flooding, thereby causing damage to properties and infrastructure and causing human and animal deaths.
Some of these earthquakes measured greater than a magnitude (M) 6, as listed in Table 1. The earthquake in Surigao City on 10 February 2017 at 10:03 PM (Pacific Standard Time) led to the third-highest damage cost of PhP 720 million ( 51.82 PhP = 1 USD) among other earthquakes in the Philippines since 1990. This was a 6.7 M earthquake, which led to ground shaking in northeastern Mindanao, specifically in Surigao del Norte. The epicenter of the earthquake was located 16 km offshore northwest of Surigao City, and the Surigao Strait (a strait between the Bohol Sea and the Leyte Gulf of the Philippine Sea) has a depth of around 10 km in the southern Philippines [6]. Several municipalities were hit by the earthquake, though Surigao City suffered from the strongest ground shaking, with a PHIVOLCS Earthquake Intensity Scale (PEIS) of VII (Destructive). Some buildings, roads, and bridges incurred considerable damage. Official data of the Department of Public Works and Highways (DPWH) showed that four roads and five bridges suffered different levels of damage with an estimated cost of more than PhP 100M for rehabilitation and repair [7]. Figure 1 shows the locations of the damaged roads and bridges caused by the 2017 Surigao earthquake, and the types of evacuation facilities are highlighted with various colors. The number of each facility type is provided in Table 2. Schools accounted for the largest share of evacuation destination choice, which may be due to their capacity and accessibility (shorter distance). Gymnasiums/covered courts accounted for the second-largest proportion of evacuation sites due to their capacity and accessibility to barangay halls and other essential facilities.
Negative impacts of earthquakes can be mitigated through effective earthquake disaster management planning based on lessons learned from global experience for local best practices. The Republic Act or “The Philippine Disaster Risk Reduction and Management Act of 2010” was issued to develop policies and planning for risk assessment, pre-earthquake warning, capacity building, awareness-raising, risk reduction, and preparedness for effective response and prompt recovery [8]. Evacuation planning for earthquake disasters is an important component of disaster preparedness in the disaster management cycle. This component deals with necessary preparations, such as what to do, where to go, or whom to call during an emergency. Facilities and resources are also considered in the three stages of the evacuation process: (1) before evacuation (transmission of evacuation warnings and instructions), (2) during evacuation (evacuation guidance and routes), and (3) after the evacuation process (evacuation centers) [9].
A thorough understanding of the determinants of natural disaster evacuation (e.g., destination, travel mode, and evacuation duration) is needed to design disaster management and planning programs. Natural disaster evacuation (e.g., earthquakes, tsunamis, flooding, and hurricanes) is significantly affected by various factors. A received warning, a distance closer to the threat, and structural damage are statistically associated with earthquake evacuation choice [10,11,12]. A study of earthquake evacuation using the Immersive Virtual Reality (IVR) tool in Auckland showed that building occupants were influenced by other people during earthquake evacuation, specifically the authorities [13]. Only 13% of evacuees did not pay attention to the instructions of the authorities and other people around them and tended to move out of the building [13]. A similar study in rural areas showed that built-up environments and disaster risk perception were positively associated with evacuation choice behavior [14]. A behavioral study of tsunami evacuation facility choice revealed that evacuees tended to move to designated facilities close to their locations with high altitudes and floors and away from the sea [15]. A recent study of tsunami evacuation in Indonesia indicated that a strong relationship among people in local communities is a key factor to decrease the number of fatalities; 83% of respondents decided to evacuate because they saw other people evacuating [16]. A study of tsunami evacuation behavior and travel mode choice in the Cascadia subduction zone showed that two-thirds of respondents evacuated, and older citizens and females were more likely to travel by foot during evacuation [17]. A study on flooding evacuation in Quezon City, Philippines, showed that evacuation choice was mainly influenced by household characteristics (i.e., gender, educational level, presence of children, years in residence, house ownership, number of dwelling stories, and type of house material) and hazard-related factors (i.e., distance from flood source, level of flood damage, and source of warning) [18]. Another study of hurricane evacuation decisions revealed that the destination choice was most significantly caused by hazard severity, income, the type of emergency, age, ethnicity, education level, and pet ownership [19,20,21]. Distance to the evacuation destination, the population at the destination, and destination location type were the potential variables of hurricane evacuation decisions in South Carolina [22]. Another study of hurricane evacuation choice in northern New Jersey, using stated preference (SP) household survey data, revealed that not having a motorized vehicle was the strongest predictor of evacuation choice [23]. Also, low-incomes, low education levels, and high population densities were positively associated with travel modes for evacuation, other than private vehicles [23]. These findings can help policymakers and planners prepare planning and management for natural disaster evacuation. The evacuation planning should be specific to different areas and to each natural disaster, e.g., earthquakes, tsunamis, flooding, and hurricanes.
Given the need for effective earthquake evacuation planning, this study investigated the potential determinants of evacuation choice using revealed preference (RP) data and proposed specific earthquake evacuation planning in Surigao City, Philippines. This city was featured as the case study as it had one of the strongest earthquakes in recent years. Residents, therefore, would have a more intact recollection of their experiences during evacuation during the night. The Surigao earthquake also caused the third-highest damage cost in the Philippines since 1990 (see Table 1). Sociodemographic characteristics, earthquake-related damage variables, and housing utilities and assets were taken into account as explanatory variables. Evacuation choice, evacuation duration, and travel mode choice for evacuation were considered as the output variables. This study used the primary RP data of 1055 observations collected in 2019 through a face-to-face post-event survey. The nested logit model was applied for statistical data analysis. The novelty of this study is in that it took an exhaustive set of factors of earthquake evacuation choice in a developing archipelagic country into account. The findings of this study provide significant contributions to earthquake evacuation planning both in the local and national levels, thereby contributing to the mitigation of damage cost and loss of lives and the increase of community resilience and sustainability.
The rest of this paper is structured as follows. Section 2 is the methodology of the study, including the study area, research design and hypotheses, descriptive statistics of the data sample, and the conceptual frameworks for statistical data analysis. Section 3 consists of the model estimation results and discussion. Section 4 proposes earthquake evacuation planning based on the Analytical Hierarchy Process (AHP) for Surigao City. The last section summarizes the results and suggests future research directions to advance human knowledge in earthquake evacuation planning and management.
Table 1. List of noticeable earthquake-caused damages in the Philippines since 1990.
DateLocationMagnitudeDeathsAffected HousesDestroyed Houses (Units)Estimated Damage (PhP)
10 Feb 2017 1Surigao City6.7810,645565720 million
15 Oct 2013 2Bohol7.222279,21765,8152.5 billion
6 Feb 2012 3Negros Oriental6.95115,787-383 million
15 Nov 1994 3Mindoro7.178-7566-
16 Jul 1990 3Northern & Central Luzon7.82412--10 billion
1 Data from NDRRMC, DSWD [24] 2 Data from Philippines-Bohol Earthquake Action Plan (BEAP) [25] 3 Data from NDRRMC [26] The sign ‘-’ define ‘not available’.
Figure 1. The damaged roads and bridges caused by the 6.7 M Surigao earthquake [26].
Sustainability 13 05783 g001
Table 2. Types of Evacuation Facility.
Type of FacilityNo. of FacilitiesPercentage, %
School3543%
Gymnasium/Covered Court2126%
Barangay Hall1417%
Church45%
Health Center34%
Open Area45%
TOTAL81100%
Source: the authors interviewed the local authorities.

2. Methodology

2.1. Study Area and Data Source

The Philippines is an archipelagic country, with a land area of roughly 300,000 km2 [1]. The country consists of three regions: Luzon (north), Visasyas (center), and Mindanao (south). Surigao City is located in the Surigao del Norte province, the northeastern tip of Mindanao. The city consists of 54 barangays, with a total area of 245.34 km2 [27]. The population of the city was 154,137 in 2015 [28], with an average annual growth rate of 1.83% from 2010 to 2015 [27]. The study area covered the mainland part of the city, which hosts the majority of the city’s population. The mainland consists of 33 barangays (Barangay is the smallest administrative division in the Philippines.) that are clustered into rural-coastal (i.e., Cabongbongan, Capalayan, Day-Asan, Nabago, Orok, San Isidro), rural-inland (i.e., Anomar, Balibayon, Bonifacio, Danao, Mabini, Mapawa, Mat-I, Poctoy, Quezon, San Roque, Serna, Silop, Sukailang, Trinidad), sub-urban (i.e., Cagniog, Ipil, Lipata, Mabua, Punta Bilar, Rizal, Sabang, Togbongon), and urban areas (i.e., Canlanipa, Luna, San Juan, Taft, Washington) [29]. A map of the study area is illustrated in Figure 2. The study was also limited to the mainland area as it is situated near the active Surigao Fault, thereby making this area prone to earthquake events, as illustrated in Figure 2. This study covered an area of 139.746 km2 or 57% of the city’s total land area [29].
This study hypothesized that earthquake-related damage variables, dwelling utilities and assets, and socioeconomic characteristics affected evacuation choice, travel mode choice, and evacuation duration. For the earthquake-related damage variables, severe house damage and water and electricity cutoffs might force residents to evacuate from their homes to an open space or a public shelter to get various supplies and help. For the dwelling utilities and assets, people living in concrete-made houses might not evacuate and instead decide to stay home. For the socioeconomic characteristics, people with small children, elderly people, and PWDs might decide to stay home or evacuate to an open space near their homes.
The sampling technique used a combination of stratified and convenience sampling. After determining the sample size, the samples were clustered based on the clustering of barangays within the mainland of Surigao City: urban, sub-urban, rural-inland, and rural-coastal. Convenience sampling was used during the actual data collection as explained in the succeeding section. These sampling techniques were found to be economical, fast, and simple to conduct. The sample size was computed using Equation (1) [30]:
n = z 2 p q e 2
where n is the sample size; z is the z-score corresponding to the desired level of confidence (probability of error); p is the estimated proportion of the population which might be based on prior research, pilot study, estimates from an experienced researcher(s); q = 1 − p; and e is the tolerable margin of error or precision of the estimate.
For a level of confidence of 95%, the corresponding z score is 1.96. The margin of error was selected to be e = 0.03 in our study. Given no prior studies, the most conservative estimate of 0.50 for p was used [30]. Therefore, the sample size was at least n = 1067 based on Equation (1). The survey took place for 10 days from 1 to 11 February 2019. The actual sample size collected was 1079. The proportion of respondents by barangay was determined on the basis of the population distribution. Of the sample data, 74 observations were collected in rural-coastal areas, 226 in rural-inland areas, 210 in suburban areas, and 569 in urban areas. The distribution of the sample data is listed in Table 3. Some questionnaire forms with incomplete information were deliberately removed to avoid data inconsistency. After data polishing, there were 1055 observations used for data modeling.

2.2. Descriptive Statistics

Table 4 illustrates the earthquake evacuation choice caused by the 6.7M 2017 Surigao earthquake. Of all the respondents, 62% decided to leave home, while 38% stayed home. Of those in the leave-home choice group, 52% of the respondents evacuated to open spaces, and 10% of the respondents moved to public shelters for evacuation. Of the evacuees in open spaces, 37% of respondents stayed for less than 6 h, while 15% stayed for at least 6 h. Of the evacuees in public shelters, 7% decided to stay there for less than one day, and 4% stayed for at least one day. Table 5 shows the travel mode choice during the evacuation. As mentioned, 62% of the respondents left home during the evacuation. The majority of evacuees traveled by walking (53%), followed by two-/three-wheeler modes (6%) and the other modes (2%). These survey results are consistent with a study of submarine landslide earthquake evacuation in Indonesia [16].
Table 6 presents the descriptive statistics of variables related to damage caused by the 2017 Surigao earthquake and dwelling utilities and assets. The majority of respondents (75%) did not receive any earthquake warning to evacuate. About 16% of residents received a warning through megaphones made by the local authorities or through word-of-mouth from other residents, and 9% received a warning through telecommunication. According to the data sample, 47% of houses did not suffer from the earthquake, 46% of houses suffered moderate damage, and only 7% of houses sustained severe/complete damage. The majority (67%) could not access electricity after the earthquake hit, while 36% of houses incurred the water supply cut-off.
For dwelling utilities and assets, about nine-tenths of respondents lived in their own houses. The majority of houses are one-story houses (84%) and are made of concrete (66%). Most respondents have access to safe water (95%), electricity (97%), and toilets (98%). Based on survey data, 97% of residents have no generator set (genset). The majority of households have no motorcycles (59%), cars (95%), multicabs (98%), trucks (100%), or other vehicles (93%).
Table 7 presents the sociodemographic characteristics of the respondents. The majority of them were female (62%), married (65%), and 18–29 years old (26%). At least 80% of the respondents had a high school diploma or higher. In terms of occupation category, 37% of the respondents were retired/unemployed/student, 31% were employees, and 32% were self-employed. Just over half (56%) of respondents were not household heads. Most of the respondents belonged to families with four members (24%), followed by five-member families (20%), and three-member families (16%). Based on the data sample, the majority of residents belonged to households with no children aged ≤ 5 years (65%), no elderly citizens (81%), no PWDs (96%), and no pets (46%). One-fourth of the respondents lived in Surigao City for 20–29 years, and three-fifths of them had a personal income of less than 5000 PhP per month. About three-fifths of the households had a combined income of less than 15,000 PhP per month.

2.3. Nested Logit Model

The multinomial logit model (MNL) is widely applied for discrete choice modeling because of its simplicity, ease of estimation, availability of estimation software, and potential to add new alternatives [31]. However, it implies proportional substitution across alternatives due to its performance of independence from irrelevant alternatives (IIA) [31]. The nested logit model can handle this limitation. The nested logit model is generalized from the standard logit model, which was initially proposed by McFadden in 1978 [32]. ‘Nests’ indicate that some alternatives may be joined in several groups or clusters. Error terms in the same nest present some correlation, but error terms of different nests are not correlated. The nested logit model is a member of the generalized extreme value (GEV) family that provides a variety of substitution patterns. The nested logit model has been applied in various fields, such as energy, transportation, housing, and telecommunication, among others [31]. We applied the nested logit model for statistical data analysis in this study because it is preferable to partition the finite set of alternatives into subsets, called ‘nests’. The probability of a chosen alternative by an individual for a two-level nested logit model can be written as [31]:
P n i = e V n i / λ k ( j B l e V n j / λ k ) λ k 1 l = 1 K ( j B l e V n j / λ k ) λ l
where i (i    B k ) is the index of a chosen alternative; B k is a chosen nest; λ k is a measure of the degree of independence in observed utility among the alternatives in nest k, and K is the finite number of nests. j is a set of alternatives in a nest B l . The measure of independence is used for a measure of correlation (1 λ k ). V n i   ( V n i   = β i x n i ) is the observed term of a utility function of a chosen alternative i made by an individual n. x n i is a column vector of variables (including a constant, earthquake-related damage, dwelling utilities and assets, and socioeconomic characteristics), and β i is a column vector of the corresponding coefficients.
The nested logit probability of a chosen alternative can be written as a product of two standard logit probabilities: a marginal probability (the probability of a chosen nest B k ) and a conditional probability (the probability of a chosen alternative i within a nest B k ), as expressed below [31]:
P n i = ( P n i | B k ) (   P B k )
P n i = ( e Y n i / λ k j   B k e Y n j / λ k ) ( e W n k + λ k I n k l = 1 K e W n l + λ l I n l )  
where W n k   ( W n k   = β k x n k )   is a variable that varies over a nest k, but not over alternatives within the nest. β k is a column vector of parameter estimates of a nest k. I n k is the inclusive value or inclusive utility of nest B k . The inclusive value ( I n k = l n j   B k e Y n j + λ k ) is used to link the upper and lower models by bringing information from the lower model to the upper model. A measure of the degree of independence λ k can be excluded if all the coefficients are not generic (common) over nests because λ k in each nest is used to differentiate coefficients over nests [33]. λ k was excluded in our study because all variables are generic for all alternatives. Therefore, all parameter estimates are alternative-specific. The parameters of the nested logit model can be estimated using the standard maximum likelihood technique [31].
The evacuation and duration choice model in this study was a three-level nested logit model, as illustrated in Figure 3. The top model described the nest of evacuation choices: stay home and leave home. The middle model was the sub-nest of location types of evacuation within the nest of leave home: open space and public shelter. The bottom model described the choice of alternative within each nest, i.e., less than 6 h and at least 6 h for the sub-nest of open space and less than one day and at least one day for the sub-nest of the public shelter. The two-level nested logit model of evacuation and travel mode choice is shown in Figure 4. The upper model is the nest of evacuation choices: stay home and leave home. The lower model describes the travel mode choice within the nest of leave home.
The explanatory variables of household car number, household motorcycle number, household multicab number, household truck number, the number of other vehicles in the household, household size, the number of children aged less than 5 years, the number of elderly people aged at least 65 years, the number of people with disabilities, the number of pets, individual income, and household income were arranged as the continuous variables. The other variables were arranged as categorical variables. The dummy coding technique was used to investigate the impacts of the category variables on the alternatives.
R programming scripts were written to estimate the parameters of the two nested logit models. The package “maxLik” was used to estimate the parameters based on the standard maximum likelihood technique [34]. Two estimation approaches were used to estimate the parameters: sequential and simultaneous estimation approaches. The former is consistent, though not as efficient as the latter [31]. The former is used when problems arise in the simultaneous estimation approach, and parameter estimates in the sequential estimation approach are used as the starting values in the simultaneous estimation approach [31]. The forward selection approach was applied to deliberately remove parameters that were not statistically significant at the 0.10 significance level.

3. Results and Discussion

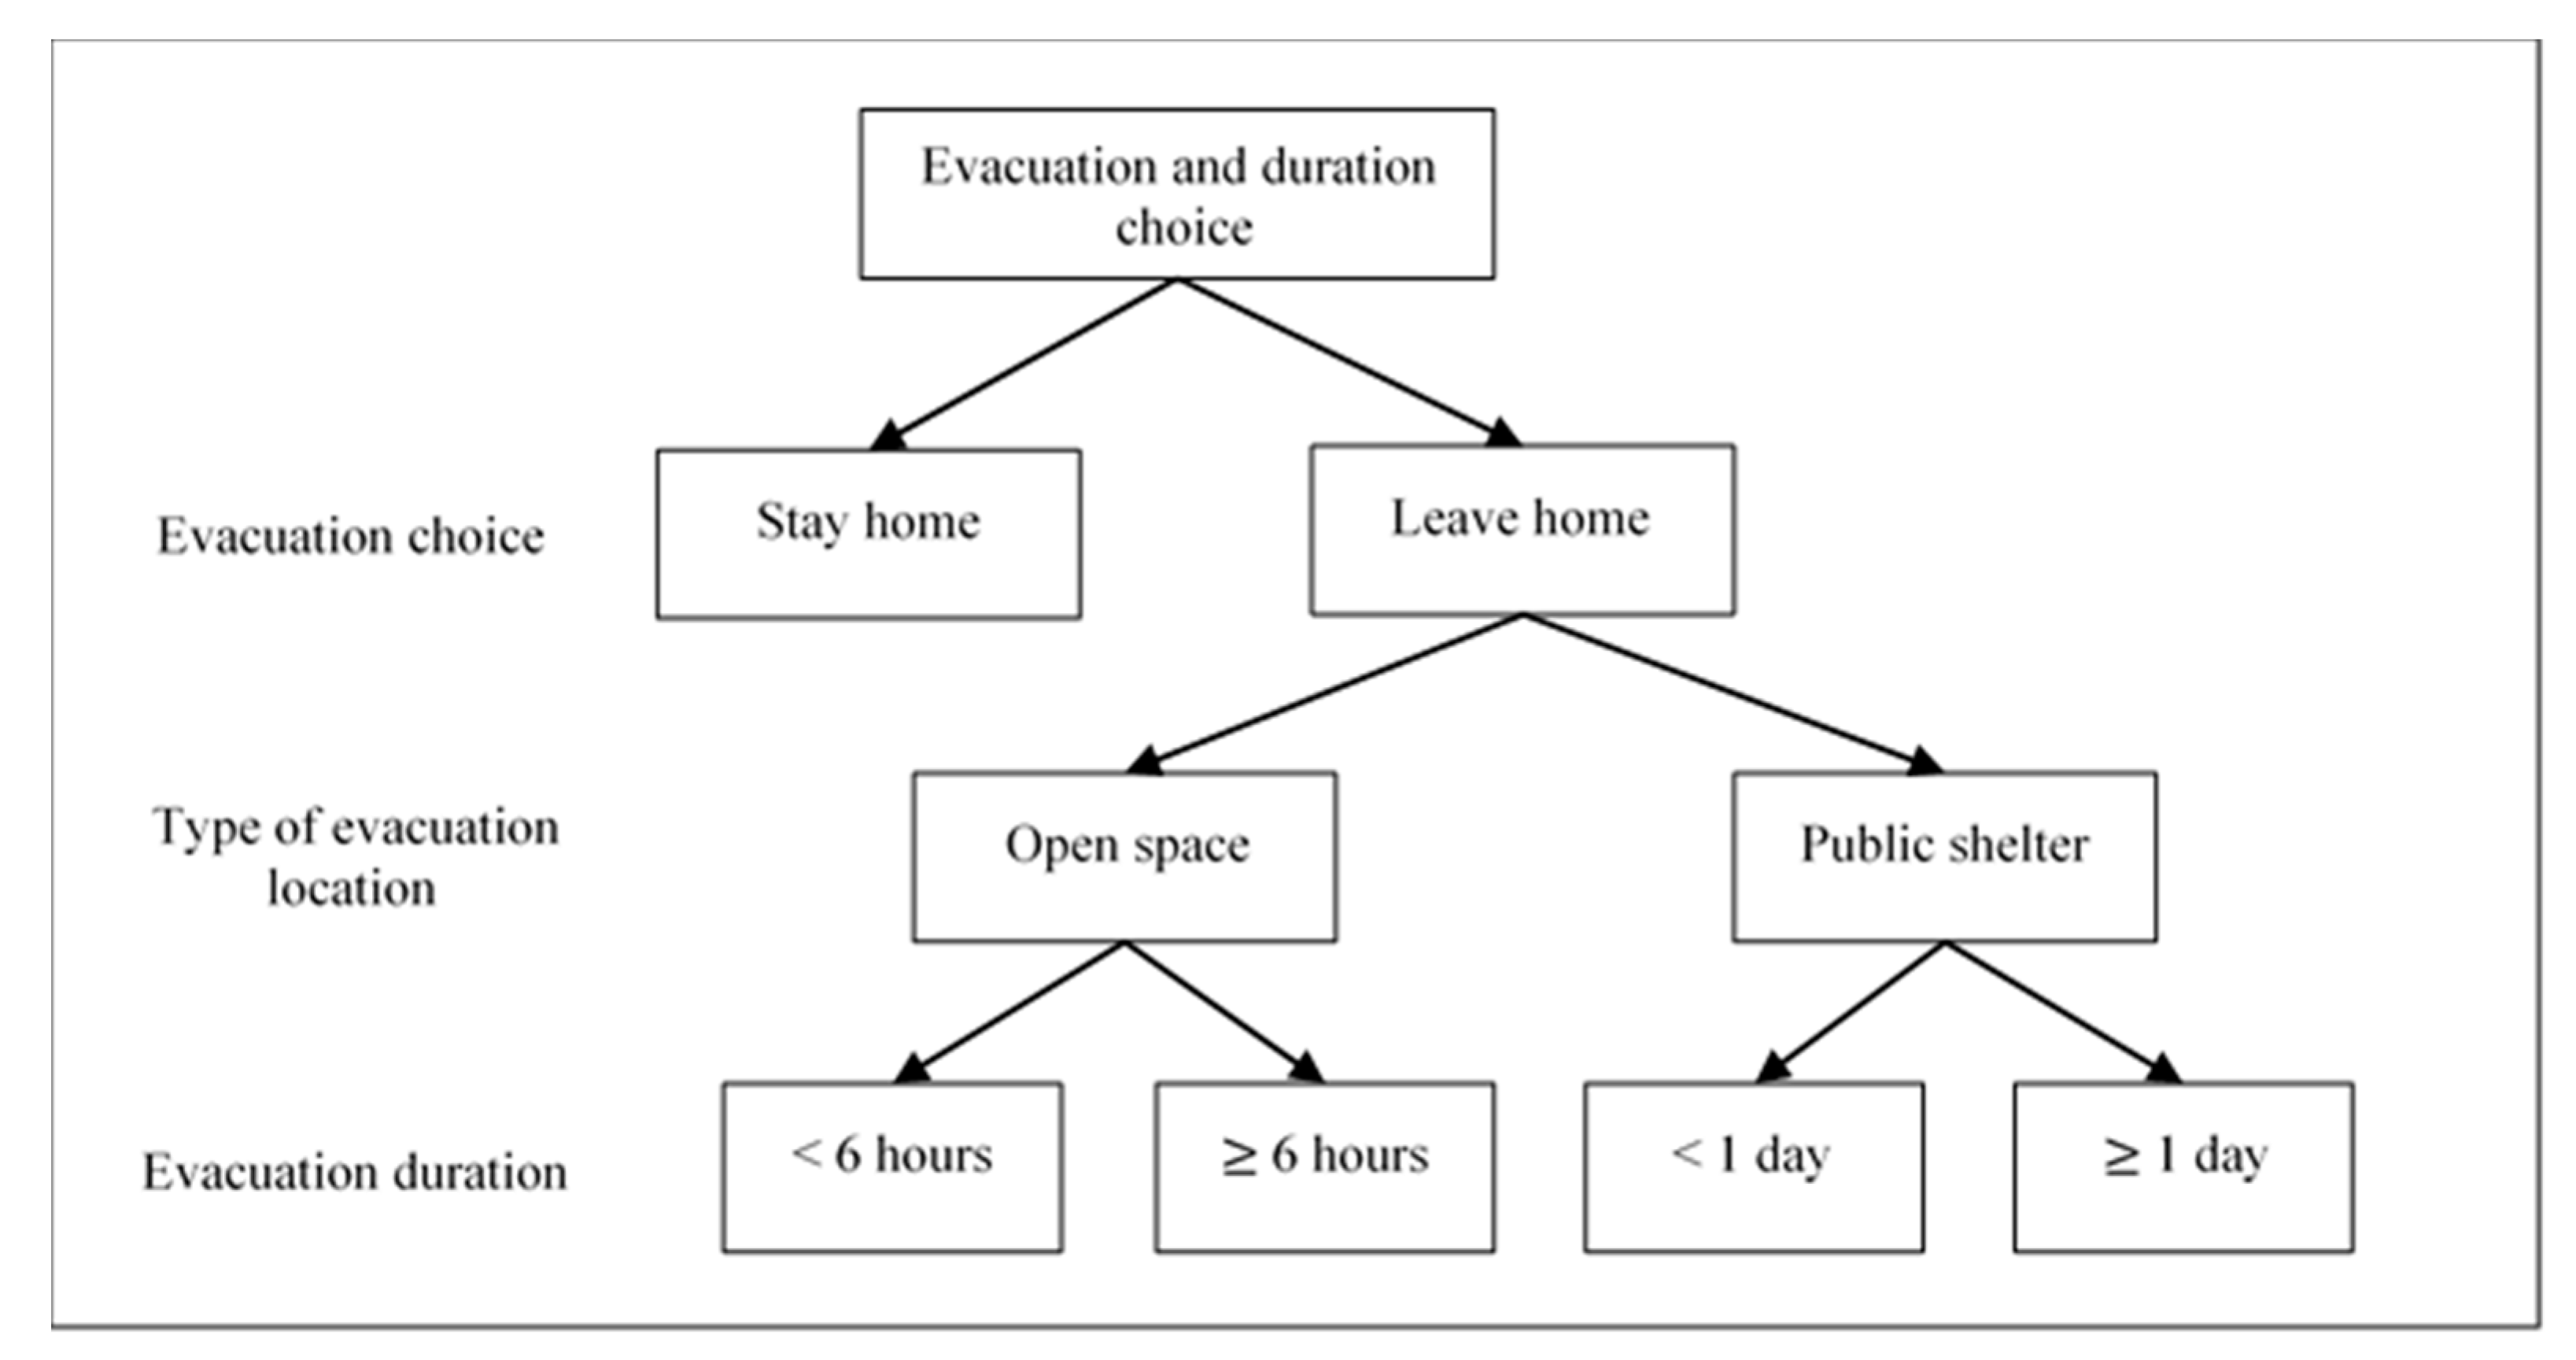
3.1. Earthquake Evacuation and Duration Choice

The three-level nested logit model of evacuation and duration choice was developed and then used to estimate the percentage shares of alternatives. The estimated percentage shares of the alternatives are listed in Table 8. The estimated and actual values were the same for the alternatives of stay home, stay in an open space for less than 6 h, and stay at a public shelter for less than one day. The estimated and actual values were comparable for the other alternatives.
The model estimation results of the three-level nested logit model are presented in Table 9. The McFadden R2 of the model was 0.009, which is much lower than a decent value. The developed model did not fit the data well. This could be due to the inclusion of the sub-nest models at the bottom level (evacuation durations at a public shelter and an open space). The first and second columns contain the explanatory variables and their corresponding categories/description. The third column contains the parameter estimates of the top model for the leave home alternative, and the stay home alternative was used as the reference. The fourth column contains the parameter estimates of the middle model for the public shelter alternative, and the open space alternative was used as the reference. The last two columns contain the parameter estimates of the bottom models. Stay at an open space for less than 6 h and a public shelter for less than 1 day were used as the references for the open space and public shelter models, respectively. The parameter estimates can be interpreted as follows. The intercept coefficients were included in the model to capture the average unobserved effect; there was no interpretable meaning [31].
As hypothesized, earthquake-related damage variables affected the decision on evacuation choice and duration. It is worth noting that earthquake warnings via telecommunications led residents to leave home and evacuate to a public shelter rather than an open space. However, evacuees to an open space were more likely to stay for at least 6 h. However, this factor had no impact on the decision to stay for a certain duration at a public shelter. It is interesting to note that residents warned via the megaphone were more prone to evacuate to a public shelter rather than an open space. Evacuees to the open space, however, were more likely to stay for at least 6 h. Similar to residents informed via telecommunications, the megaphone method did not affect the decision of staying for a certain duration at the public shelter.
Coefficients of the home damage levels caused by the earthquake indicated that residents were more prone to leave home when it was severely damaged. Under a severe home damage case, people had a higher baseline likelihood to stay at the open space for at least 6 h and the public shelter for at least one day. A similar finding showed that the housing damage factor had a considerable impact on evacuation in rural areas [14]. Severe home damage was not statistically significant for the decision on evacuation location type. Under a moderate home damage case, residents were more likely to evacuate to the public shelter than the open space, and those evacuating to the open space were more likely to stay for longer than 6 h. However, this damage level did not affect the duration decision of staying at the public shelter. A similar study using the stated preference (SP) data showed that home damage intensity was positively associated with evacuation choice, and that public shelters were more preferable to open spaces [12].
Coefficients of the electricity and water supply cutoff implied that people preferred leaving home when electricity and water access were cut off due to the earthquake. However, the electricity cutoff did not affect the decision on evacuation location type and evacuation duration. For the water supply cutoff case, residents were likely to evacuate to the open space rather than the public shelter and stay in the open space for at least 6 h. Similar to the electricity supply cutoff factor, the water supply cutoff did not influence the decision on the duration of staying at the public shelter.
The availability of home utilities and assets, home ownership, number of floors of the house, genset availability, number of motorcycles, number of cars, number of multicabs, and number of trucks were not statistically significant at the 0.1 significance level for all the alternatives, nests, and sub-nests. Residents living in a timber-made house evacuated to the public shelter and preferred to stay for at least one day. However, the timber house did not affect the decisions on leaving or not leaving home, the evacuation location type, and the duration of staying in the open space. Residents living in houses with safe water and electricity access were likely to leave home when there was an earthquake. People residing in houses with safe water access were likely to evacuate to open spaces rather than to public shelters, but this factor was not statistically significant for the decision on evacuation duration. Electricity access did not affect the decision on evacuation location type and duration. It is worth noting that the presence of a toilet at home influenced the residents’ decision of staying home rather than leaving home. However, evacuees were likely to evacuate to a public shelter rather than an open space. The availability of a toilet at home did not affect the decision on evacuation duration for the two evacuation location types. The presence of other vehicles in the household discouraged residents to leave home when there was an earthquake, but it did not influence the decision on evacuation duration for residents leaving home. Contrary to the tsunami evacuation behavior observed in a Cascadia Subduction Zone City, vehicle disability and lack of transportation modes discouraged residents to evacuate in an event of a tsunami [17].
In terms of sociodemographic characteristics, it is worth noting that gender, marital status, educational background, the presence of elderly people and pets, residential period, and individual income were not statistically significant for all the alternatives, nests, and sub-nests at the 0.10 significance level. The influences of the socioeconomic characteristics on evacuation choice and duration were less than the earthquake-related damage factors. A similar study empirically found that sociodemographic factors had lower impacts than subjective perception factors (i.e., built-up environments and disaster risk perception) on earthquake evacuation behavior, and gender and marital status were not statistically significant at the 0.05 significance level [14]. Contrary to the finding of Ao et al., residents with higher-education backgrounds tended to escape the building to seek refuge [14]. The 18–29 age group was less likely to evacuate to a public shelter than an open space, and those moving to the public shelter were likely to stay at least one day. Other age groups were not statistically significant at the 0.10 significance level. In terms of occupation type, self-employed residents were less likely to move to a public shelter than an open space and were likely to stay at a public shelter longer than one day. Household heads were more likely to leave home, and residents with the presence of more household members preferred an open space. Residents evacuating to a public shelter were likely to stay for at least one day. The presence of children aged less than 5 years in the household discouraged residents to evacuate, probably due to difficulties in moving small children. Households with the presence of PWDs pushed family members to evacuate to an open space and stay there for at least 6 h. People with high household income were more likely to stay at the public shelter for at least one day.

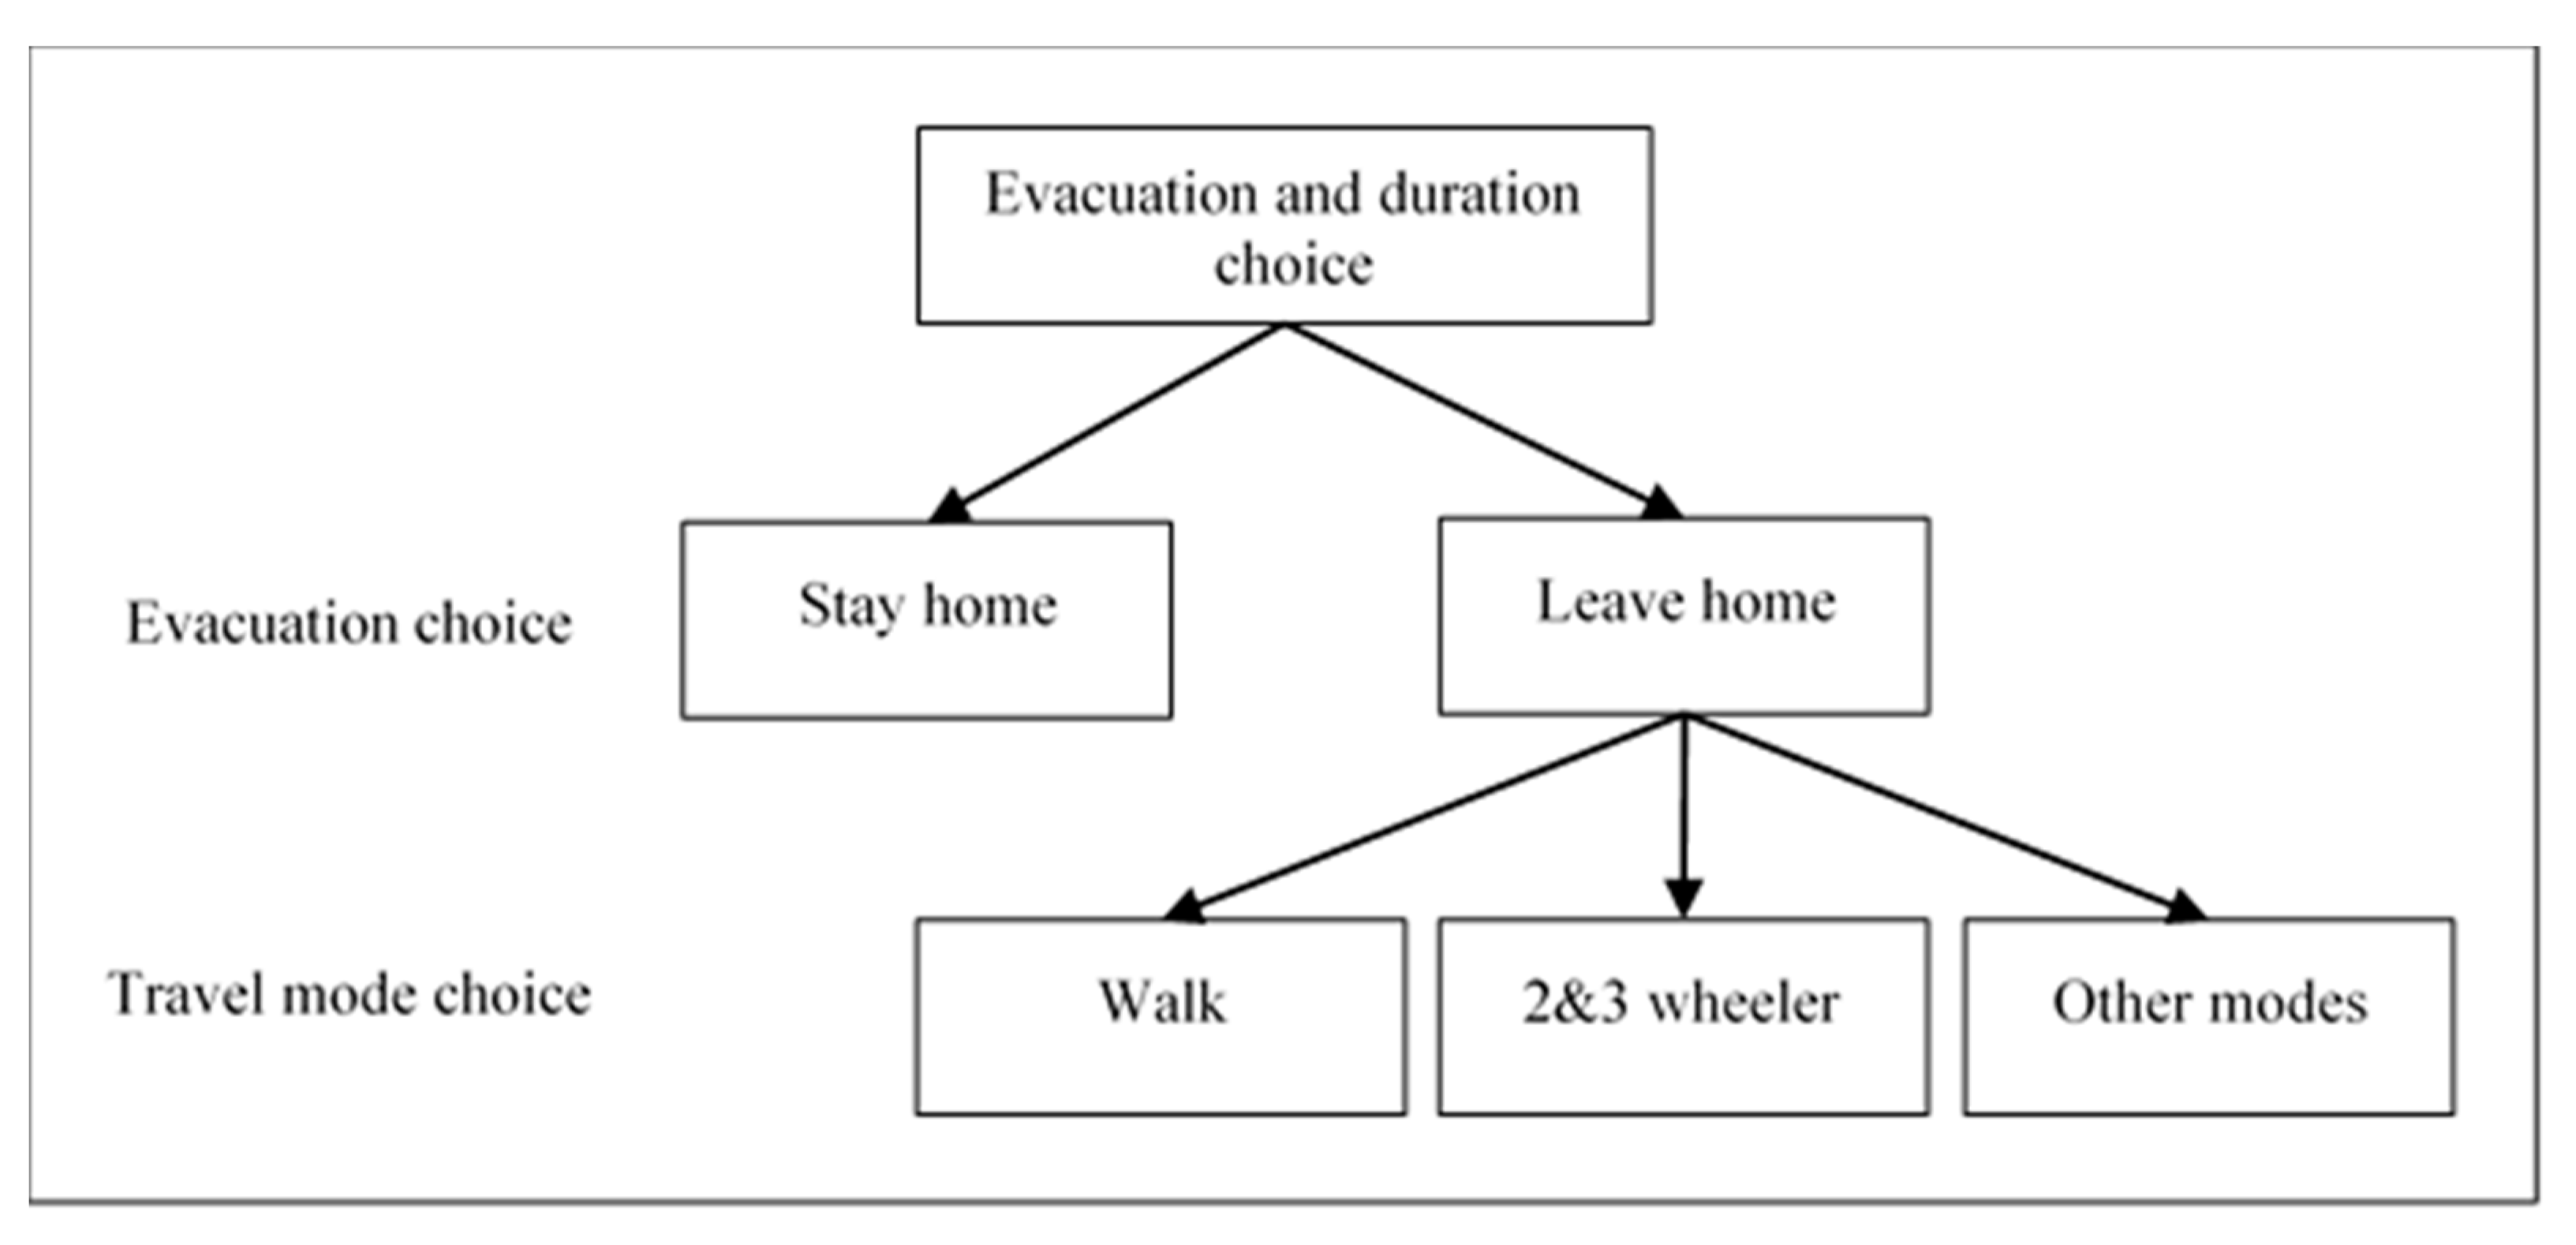
3.2. Earthquake Evacuation and Travel Mode Choice

The streamlined model of earthquake evacuation and travel mode choice based on the two-level nested logistic regression was developed. The developed model was then used to estimate the percentage shares of earthquake evacuees and travel mode types used and compare them with the actual ones, as can be seen in Table 10. The estimated and actual values were the same for the alternatives of stay home and leave home by walking and were comparable for the alternatives of leave home by two- and three-wheeler and leave home by the other modes.
The model estimation results of the two-level nested logit model are presented in Table 11. The McFadden R2 of the model was 0.481, which implied that the developed model provided a good fit for the data. The first and second columns contain the explanatory variables and their corresponding categories/descriptions. The third column contains the parameter estimates of the upper model for the leave home alternative, and the choice of stay home was used as the reference. The last two columns contain the parameter estimates of the lower model for the walking and two- and three-wheeler alternatives, respectively. The choice of the other modes was used as the reference. The parameter estimates can be interpreted as follows. Intercept coefficients have no interpretable meaning.
For earthquake-related damage variables, residents were more likely to evacuate upon receiving an earthquake warning, and warning via telecommunication was more influential than through megaphone/word-of-mouth. The telecommunication warning method did not influence the travel mode choice for evacuation, but residents who were warned via the megaphone/word-of-mouth were least likely to travel by walking. Residents were more likely to evacuate in the case of severe/complete home damage, followed by moderate damage. When homes were severely damaged, residents were least likely to evacuate by walking. Residents were more prone to evacuate when water and electricity supply were cut off. The impact of the electricity supply cutoff was statistically greater than the water supply cutoff on the decision on evacuation, i.e., stay home or leave home. In the case of water supply cutoff, the residents were most likely to leave home by two- and three-wheeler.
Home utilities and assets, home ownership, home-building material, electricity access, availability of genset and toilet, and the number of household cars, multicabs, and trucks were not statistically significant at the 0.10 significance level in affecting evacuation and travel mode choice. Residents living in one-story homes preferred not to evacuate. The number of floors did not affect travel mode choice for an earthquake evacuation. Residents with safe water access were likely to evacuate. It is surprising to note that the presence of household motorcycles and other vehicles discouraged people to evacuate but did not affect the travel mode choice decision for the earthquake evacuation.
Sociodemographic characteristics of gender, household size, number of children aged less than 5 years, presence of elderly people and pets, residential period, and individual and household incomes were not statistically significant at the 0.10 significance level in affecting the evacuation and travel mode choice. Contrary to tsunami evacuation behavior observed in Cascadia Subduction Zone City, evacuees with high income were more likely to travel by vehicle than walking, but females had a higher baseline likelihood than males to evacuate by foot [17]. Married people were least likely to evacuate by walking. The 30–39 and 50–59 age groups were more likely to evacuate than the other age groups. The 40–49 age group was most likely to evacuate by two- and three-wheeler, followed by walking. Ao et al. showed that the impact of the age factor on earthquake evacuation choice was not statistically significant [14]. A study of earthquake and tsunami evacuation behavior revealed that older people were more prone to evacuate by foot [17]. Residents with a high school degree were more likely to stay home. Employees and household heads were most likely to evacuate by walking. The presence of PWDs in households discouraged the residents to evacuate, probably due to difficulties in moving. The same finding was also confirmed: that households with the presence of PWDs may decide against evacuating [17]. Household evacuees with PWDs were most likely to travel by two- and threewheeler, followed by walking.

4. Earthquake Disaster Management and Planning

To mitigate chaos and damage cost and to enhance safety, it is important to understand the determinants of evacuation choice, which contribute to making policy and planning of areas and locations that are best suited for evacuation. The modeling results of the two nested logit modes informed us of the potential factors of evacuation choice, evacuation duration, and travel mode choice. The results showed that house damage levels and household utility cutoff (e.g., safe water supply and electricity) noticeably influenced earthquake evacuation decisions. However, these modeling results cannot rank geographic criteria for the selection of earthquake evacuation locations. The third stage of the evacuation process is knowing where to evacuate. To further support disaster management and planning, AHP was applied to understand the ideas of local government officials and planners. We considered five factors (criteria), i.e., tsunami inundation, terrain elevation, proximity to the road network, distance to the nearest fault line, and terrain slope. The factors and their corresponding sub-criteria, score, and weight are listed in Table 12. The actual values of the factors for every evacuation area were extracted from GIS and the multiple relevant government agencies. The importance weights of the factors were derived from the assessment of earthquake preparation and resource. Because Surigao City is a coastal city, it is not surprising that the important weight of the tsunami inundation factor appeared to be the highest (35%). It is followed by terrain elevation (19%), proximity to the road network (17%), distance to the nearest fault line (16%), and terrain slope (13%). These important weights were used to support designing the areas best suited for the management and planning of earthquake evacuation.
Figure 5 illustrates the identified areas for evacuation based on the criteria of various factors. Areas are highlighted according to suitability: green (most suitable), yellow (suitable), and red (not suitable). The categorized areas for earthquake evacuation based on the terrain elevation are shown in Figure 5a. About 75% of locations are most suitable for earthquake evacuation. According to the existing fault line factor as illustrated in Figure 5b, 99% of locations belong to the suitable and most suitable categories for evacuation. In terms of proximity to the road network, 98% of locations fall within the suitable and most suitable categories for earthquake evacuation, as shown in Figure 5c. In terms of the terrain slope factor, which can be seen in Figure 5d, the majority of locations are most suitable for earthquake evacuation. Figure 5e illustrates areas categorized for earthquake evacuation based on the tsunami inundation. The majority (79%) of locations are most suitable for evacuation, and the rest are not suitable. Figure 5f illustrates the location categories for evacuation based on the combined factors. The majority (84%) of locations are suitable or most suitable for evacuation. The illustrated location categories for earthquake evacuation can assist policymakers, planners, and the local authorities to manage evacuation sites and develop guidelines and practices to minimize chaos, damage cost, and risks of injuries and fatalities in Surigao city, Philippines.

5. Summary of Findings and Recommendations

The Philippines is a developing archipelagic country susceptible to earthquakes. Surigao City was hit by a 6.7 M earthquake in 2017, which caused the third-highest damage cost in the country since 1990. Lessons and experiences learned from the 6.7 M Surigao earthquake are helpful to manage and plan strategies to minimize chaos, damage cost, and loss of lives. This study investigated the determinants of earthquake evacuation choice and duration and travel mode choice during an evacuation. This study took into account earthquake-related damage, dwelling utilities and assets, and socioeconomic characteristics as the input variables. This study surveyed 1055 residents who experienced the 6.7 M Surigao earthquake based on the revealed preference approach. The survey results indicated that 62% of residents decided to evacuate, while 52% moved to open spaces and 10.14% moved to public shelters. About half of the respondents traveled by walking because the majority of residents moved to open spaces immediately after the earthquake and stayed there for less than 6 h (37%).
Nested logit modeling was applied to explore potential determinants of earthquake evacuation choice, duration, and travel mode. The results are concluded as follows. As hypothesized, the earthquake-related damage variables significantly affected the evacuation choice and duration and had greater impacts than housing utilities and assets and socioeconomic characteristics. It is interesting to note that the residents were likely to evacuate upon warning through telecommunication and preferred public shelters to open spaces. Locals were more prone to evacuate when their houses incurred moderate and severe/complete damage and when the electricity and water supply were cut off. Residents were most likely to walk, as it is conceivable that the majority of residents moved immediately after the earthquake struck to open spaces near their houses/locations (with shorter distances). Employees and household heads appeared to be most likely to evacuate by walking. On the other hand, people with a high school degree were found to be less likely to evacuate their homes. Similarly, the presence of PWDs in households discouraged the residents to evacuate; this is likely due to difficulties in moving. The residential period was not statistically associated with evacuation choice and duration and travel mode choice. It is surprising to observe that the availability of household vehicles for all vehicle types did not show a significant impact on the travel mode choice. It is also worth noting that the personal income factor did not affect earthquake evacuation choiceand travel mode choice. After interpreting the modeling results and discussion, AHP was applied to develop decision-making criteria for ranking locations and facilities to support earthquake management and planning. The importance weight of tsunami inundation became the highest (35%), followed by terrain elevation (19%), proximity to the road network (17%), distance to the nearest fault line (16%), and terrain slope (13%). According to the combined factors, about 84% of locations are suitable and most suitable for earthquake evacuation in Surigao city, Philippines. The location categories for earthquake evacuation will help policymakers and planners as well as the local authorities to manage evacuation sites and develop plans and guidelines for future earthquakes in the city.
Even though this study provided some novel findings to deal with sustainability and resiliency issues, there were some inherent limitations. First, the study used the self-reporting approach that cannot avoid a lack of bias-free, honest, and accurate reporting. Second, the study did not include psychological factors such as disaster risk perception and subjective norms. Third, the authors did not consider what should constitute significant supplies for evacuees as important factors to develop evacuation planning. Fourth, the study used the revealed preference data based on the respondents’ experience with the 2017 Surigao earthquake that struck during the nighttime at 10:03 p.m.. The impacts of determinants of earthquake evacuation during the nighttime might be different from the daytime. Future studies should focus on the exploration of the difficulties that evacuees encountered and the primary supplies they need during evacuation. Furthermore, the impacts of earthquake evacuation guidance and signs on evacuation choice and duration and travel mode choice should be investigated to make evacuation planning more exhaustive and compelling. Route choice and evacuation facility recommendations should not be ignored. The impacts of psychological, social, and risk perception factors on human evacuation behavior should be taken into account for future research. Analysis of satisfaction with the authorities’ services should be considered as a key factor to improve the effectiveness of management and planning for future earthquake evacuation to reduce damage cost and the number of injuries and deaths.

Author Contributions

Conceptualization, M.R. and A.M.F.; Data curation, M.R. and S.R.C.; Formal analysis, S.R.C. and M.R.; Funding acquisition, A.M.F.; Methodology, S.R.C., M.R. and A.M.F.; Project administration, A.M.F.; Resources, A.M.F.; Software, S.R.C. and M.R.; Supervision, A.M.F.; Writing—original draft, S.R.C. and M.R.; Writing—review & editing, A.M.F. and M.R. All authors have read and agreed to the published version of the manuscript.

Funding

This research received funding from the Engineering Research for Development and Technology (ERDT) under the Department of Science and Technology (DOST), Philippines. Also, special thanks go to DLSU Science Foundation for the publication support.

Acknowledgments

The authors would like to thank three anonymous reviewers for their voluntary efforts and expertise in giving constructive comments on the initial draft of the manuscript.

Conflicts of Interest

The authors declare no conflict of interest.

References

  1. UNDRR. Disaster Risk Reduction in the Philippines. 2019. Available online: https://www.unisdr.org/files/68265_682308philippinesdrmstatusreport.pdf (accessed on 10 March 2021).
  2. World Bank. GDP Growth (Annual %). 2019. Available online: https://data.worldbank.org/indicator/NY.GDP.MKTP.KD.ZG?end=2018&locations=PH&start=2015 (accessed on 20 May 2021).
  3. GFDRR. GFDRR: Philippines. 2017. Available online: https://www.gfdrr.org/sites/default/files/publication/GFDRR%202017%20Annual%20Report_0.pdf (accessed on 20 May 2021).
  4. Silent Gardens. Philippines Earthquakes 2019. 2019. Available online: https://www.silent-gardens.com/earthquakes.php (accessed on 15 March 2019).
  5. Pailoplee, S.; Boonchaluay, N. Earthquake Activities in the Philippines Islands and the Adjacent Areas. Geosci. J. 2016, 20, 877–889. [Google Scholar] [CrossRef]
  6. PHIVOLCS. Primer on the 10 February 2017 Magnitude 6.7 Earthquake at Surigao Del Norte. 2017. Available online: https://www.phivolcs.dost.gov.ph/index.php/news/619-primer-on-the-10-february-2017-magnitude-6-7-earthquake-at-surigao-del-norte (accessed on 30 January 2021).
  7. DPWH 1st District Engineering Office. Priority I-Damaged Infrastructure (6.7 Magnitude Earthquake); Department of Public Works and Highways: Manila, Philippines, 2017. [Google Scholar]
  8. The LAWPHiL Project. Republic Act R.A. No. 10121. Available online: https://lawphil.net/statutes/repacts/ra2010/ra_10121_2010.html (accessed on 3 February 2021).
  9. Xu, W. Development of a Methodology for Participatory Evacuation Planning and Management: Case Study of Nagata, Kobe; Kyoto University: Kyoto, Japan, 2007. [Google Scholar]
  10. Bourque, L.A.; Russel, L.B. Experiences During and Responses to the Loma Prieta Earthquake; Governor’s Office of Emergency Services, Earthquake Program: Oakland, CA, USA, 1994.
  11. Bourque, D.M.; Reeder, L.B.; Cherlin, L.G.; Raven, A.; Walton, B.H. The Unpredictable Disaster in a Metropolis: Public Response to the Los Angeles Earthquake of February, 1971; Ft. Belvoir Defense Technical Information Center: Washington, DC, USA, 1971. [Google Scholar]
  12. Calumba, S.; Fillone, A.; Rith, M. Earthquake Evacuation Choice Models based on the Stated Preference Approach for Residents in Surigao City, Philippines. J. East. Asia Soc. Transp. 2019, 13, 70–79. [Google Scholar]
  13. Feng, Z.; González, V.A.; Trotter, M.; Spearpoint, M.; Thomas, J.; Ellis, D.; Lovreglio, R. How People Make Decisions during Earthquakes and Post-earthquake Evacuation: Using Verbal Protocol Analysis in Immersive Virtual Reality. Saf. Sci. 2020, 129, 104837. [Google Scholar] [CrossRef]
  14. Ao, Y.; Huang, K.; Wang, Y.; Wang, Q.; Martek, I. Influence of Built Environment and Risk Perception on Seismic Evacuation Behavior: Evidence from Rural Areas Affected by Wenchuan Earthquake. Int. J. Disaster Risk Reduct. 2020, 46, 101504. [Google Scholar] [CrossRef]
  15. Yoshihara, H.; Kishimoto, T. Tsunami Evacuation Facility Choice Behavior Model in Flat Area and Rias Area Considering Possibility to Remain at Home. In Proceedings of the 9th International Conference on Pedestrian and Evacuation Dynamics (PED2018), Lund, Sweden, 21–23 August 2018; Volume 5, pp. 364–371. [Google Scholar]
  16. Harnantyari, A.S.; Takabatake, T.; Esteban, M.; Valenzuela, P.; Nishida, Y.; Shibayama, T.; Achiari, H.; Marzuki, A.G.; Marzuki, M.F.H.; Aránguiz, R.; et al. Tsunami Awareness and Evacuation Behaviour during the 2018 Sulawesi Earthquake Tsunami. Int. J. Disaster Risk Reduct. 2020, 43, 101389. [Google Scholar] [CrossRef]
  17. Chen, C.; Buylova, A.; Chand, C.; Wang, H.; Cramer, L.A.; Cox, D.T. Households’ Intended Evacuation Transportation Behavior in Response to Earthquake and Tsunami Hazard in a Cascadia Subduction Zone City. Transp. Res. Rec. 2020, 2674, 99–114. [Google Scholar] [CrossRef]
  18. Lim, M.B.B.; Lim, H.R.; Piantanakulchai, M.; Uy, F.A. A Household-level Flood Evacuation Decision Model in Quezon City, Philippines. Nat. Hazards 2016, 80, 1539–1561. [Google Scholar] [CrossRef]
  19. Murray-Tuite, P.; Wolshon, B. Evacuation Transportation Modeling: An Overview of Research, Development, and Practice. Transp. Res. Part C 2013, 27, 25–45. [Google Scholar] [CrossRef]
  20. U.S.A.C. of Engineers. Mississippi Hurricane Evacuation Study; U.S. Army Corps of Engineers: Washington, DC, USA, 2001.
  21. Whitehead, J.C.; Edwards, B.; van Willigen, M.; Maiolo, J.R.; Wilson, K.; Smith, K.T. Heading for Higher Ground: Factors Affecting Real and Hypothetical Hurricane Evacuation Behavior. Environ. Hazards 2001, 2, 133–142. [Google Scholar] [CrossRef]
  22. Cheng, G.; Wilmot, C.G.; Baker, E.J. A Destination Choice Model for Hurricane Evacuation. In Proceedings of the 87th Annual Meeting Transportation Research Board, Washington, DC, USA, 13–17 January 2008. [Google Scholar]
  23. Deka, D.; Carnegie, J. Forecasting Shelter Accessibility and Vehicle Availability for Hurricane Evacuation in Northern New Jersey Using Sample Enumeration. Int. J. Mass Emerg. Disasters 2012, 30, 275–300. [Google Scholar]
  24. NDRRMC. SitRep No. 19 Re Effects of Magnitude 6.7 Earthquake in Surigao City, Surigao Del Norte. 2017. Available online: https://reliefweb.int/report/philippines/ndrrmc-sitrep-no-14-re-effects-magnitude-67-earthquake-surigao-city-surigao-del#:~:text=The%20strong%20ground%20shaking%20near,some%20buildings%2C%20roads%20and%20bridges.&text=A%20total%20of%206%2C472%20families,are%20served%20outside%20evacuation%20centers (accessed on 20 May 2021).
  25. OCHA. Philippines-Bohol Earthquake Action Plan (Revised). United Nations Office for the Coordination of Humanitarian Affairs (Humanitarian Response: Philippines). 2014. Available online: https://philippines.humanitarianresponse.info/ (accessed on 14 March 2021).
  26. NDRRMC. NDRRMC Update: SitRep No. 22 Re Effects of 6.9 Earthquake in Negros Oriental—Philippines|ReliefWeb. National Disaster Risk Reduction Management Council. 2012. Available online: https://reliefweb.int/report/philippines/ndrrmc-update-sitrep-no-22-re-effects-69-earthquake-negros-oriental (accessed on 14 March 2021).
  27. C.G. of Surigao. Basic Facts|City Government of Surigao. 2015. Available online: http://www.surigaocity.gov.ph/content/basic-facts (accessed on 13 June 2019).
  28. Philippine Statistics Authority (PSA). Population of Region XIII - Caraga (Based on the 2015 Census of Population). 2016. Available online: https://psa.gov.ph/content/population-region-xiii-caraga-based-2015-census-population (accessed on 13 June 2019).
  29. City Planning and Development Office. Surigao City Ecological Profile. Surigao. 2016. Available online: http://www.surigaocity.gov.ph/content/2016-ecological-profile (accessed on 20 May 2021).
  30. Daniel, J. Sampling Essentials: Practical Guidelines for Making Sampling Choices; SAGE Publications, Inc.: California, CA, USA, 2012. [Google Scholar]
  31. Train, K.E. Discrete Choice Methods with Simulation; Cambridge University Press: Cambridge, UK, 2003. [Google Scholar]
  32. Croissant, Y. Estimation of Multinomial Logit Models in R: The Mlogit Packages. Available online: https://r-forge.r-project.org/scm/viewvc.php/*checkout*/pkg/inst/doc/mlogit.pdf?revision=19&root=mlogit&pathrev=32 (accessed on 20 May 2021).
  33. Heiss, F. Structural Choice Analysis with Nested Logit Models. Stata J. 2002, 2, 227–252. [Google Scholar] [CrossRef] [Green Version]
  34. Henningsen, A.; Toomet, O. MaxLik: A Package for Maximum Likelihood Estimation in R. Comput. Stat. 2011, 26, 443–458. [Google Scholar] [CrossRef]
Figure 2. A map of the study area.
Sustainability 13 05783 g002
Figure 3. The three-level nested logit model of evacuation and duration choice.
Sustainability 13 05783 g003
Figure 4. The three-level nested logit model of evacuation and mode choice.
Sustainability 13 05783 g004
Figure 5. Categorized areas for evacuation based on various factors: (a) terrain elevation, (b) distance from the nearest fault line, (c) proximity to the road network, (d) terrain slope, (e) tsunami inundation, and (f) combined factors.
Sustainability 13 05783 g005aSustainability 13 05783 g005b
Table 3. Distribution of Data Samples.
ClusterBarangaysHouseholds in 2015TARGETACTUAL
Units%Samples%Samples%
Rural-Coastal619206636747
Rural-Inland146440202132022621
Suburban86666212202121019
Urban517,285535715356953
TOTAL3332,31110010671001079100
Table 4. Proportions of evacuation choice and duration.
Evacuation Choice
Stay home
(401 counts = 38.01%)
Leave home
(654 counts = 61.99%)
Open space
(547 counts = 51.85%)
<6 h (387 counts = 36.68%)
≥6 h (160 counts = 15.17%)
Public shelter
(107 counts = 10.14%)
<one day (70 counts = 6.64%)
≥one day (37 counts = 3.51%)
Table 5. Proportions of evacuation and travel mode choice.
Evacuation Choice
Stay home (401 counts = 38.01%)
Leave home (654 counts = 61.99%)Walk (564 counts = 53.46%)
two- and three-wheeler (65 counts = 6.16%)
Other modes (25 counts = 2.37%)
Table 6. Descriptive statistics of the earthquake-related damage variables and dwelling utilities and assets.
VariablesCategoriesCountsPercentage
Earthquake-related damage
Warning methodNo warning79074.88%
Radio/TV/Internet999.38%
Megaphone/word-of-mouth16615.73%
House damage levelNo49647.01%
Moderate48245.69%
Severe/Complete777.30%
Electricity cutoffNo35333.46%
Yes70266.54%
Water cutoffNo67463.89%
Yes38136.11%
Dwelling utilities and assets
HomeownershipRented/live with relatives10910.33%
Owned94689.67%
House building materialTimber27626.16%
Concrete69966.26%
Other materials807.58%
No. of floorsGround floor88383.70%
≥1 floors17216.30%
Safe waterNo484.55%
Yes100795.45%
Electricity accessNo302.84%
Yes102597.16%
ToiletNo242.27%
Yes103197.73%
GensetNo101896.49%
Yes373.51%
No. of household motorcycles062158.86%
140037.91%
At least 2343.22%
No. of household cars0100695.36%
At least 1494.64%
No. of household multicabs0103297.82%
1232.18%
No. of household trucks0105299.72%
130.28%
No. of other household vehicles097692.51%
At least 1797.48%
Table 7. Descriptive statistics of the sociodemographic characteristics.
VariablesCategoriesCountsPercentage
GenderMale40338.20%
Female65261.80%
Marital statusSingle/window(er)/divorced27435.45%
Married68164.55%
Age18–29 years27225.78%
30–39 years21420.28%
40–49 years21320.19%
50–59 years17516.59%
≥ 60 years18117.16%
Educational levelElementary and lower21019.91%
High school and lower41439.24%
Higher than high school43140.85%
OccupationRetired/Unemployed/student39137.06%
Employee32630.90%
Self-employed33832.04%
Household headNo58755.64%
Yes46844.36%
Household sizeOne person222.09%
Two people666.26%
Three people16515.64%
Four people25023.70%
Five people21420.28%
Six people12011.37%
Seven people1019.57%
Eight people676.35%
Nine people171.61%
At least ten people333.13%
No. of children aged ≤ 5 yearsNo child68965.31%
One child22921.71%
Two children1029.67%
Three children272.56%
At least four children80.75%
No. of elderly people aged ≥ 65 years No elderly person85681.14%
One elderly person13512.80%
At least two elderly people646.06%
No. of PWDsNo person with disabilities100995.64%
At least one person with disabilities464.36%
No. of petsNo pet49046.45%
One pet26725.31%
Two pets11711.09%
Three pets635.97%
Four pets272.56%
Five pets918.63%
Residential period<10 years13312.61%
10–19 years16315.45%
20–29 years26725.31%
30–39 years16315.45%
40–49 years14713.93%
≥ 50 years18217.25%
Individual income (PhP/month)<500063059.72%
5000–999920119.05%
10,000–14,99911711.09%
15,000–19,999434.08%
20,000–24,999262.46%
25,000–29,999151.42%
30,000–34,999100.95%
≥35,000131.22%
Household income (PhP/month)<500023221.99%
5000–999925023.70%
10,000–14,99919618.58%
15,000–19,99914713.93%
20,000–24,999646.07%
25,000–29,999484.55%
30,000–34,999292.75%
35,000–39,999121.14%
40,000–44,999262.46%
45,000–49,99980.76%
50,000–54,999201.90%
≥55,000232.18%
Table 8. Estimated percentage shares of earthquake evacuation and duration alternatives.
Stay HomeOpen Space
(<6 h)
Open Space
(≥6 h)
Public Shelter
(<one day)
Public Shelter
(≥one day)
Actual38.01%36.68%15.17%6.64%3.51%
Estimateed38.01%36.59%15.17%6.73%3.51%
Table 9. Earthquake evacuation and duration choice-coefficients (standard error).
VariableCategoryEvacuation ChoiceEvacuation LocationOpen SpacePublic Shelter
Leave HomePublic Shelter≥6 h≥One Day
Intercept −4.708
(0.84) ***
-−3.09
(0.36) ***
−4.452
(0.72) ***
Earthquake-related damage variables
Warning method (No warning = ref.)Telecommunication3.326
(1.16) **
0.869
(0.36) *
0.827
(0.27) **
-
Megaphone/ word-of-mouth-0.775
(0.28) **
0.637
(0.24) **
-
Home damage level (No damage = ref.)Moderate-1.218
(0.32) ***
1.817
(0.33) ***
-
Severe/
complete
2.351
(1.09) *
-2.229
(0.42) ***
3.391
(0.48) ***
Electricity cutoff (No = ref.)Yes3.982
(0.3) ***
---
Water cutoff (No = ref.)Yes1.96
(0.34) ***
−1.906
(0.29) ***
0.559
(0.22) **
-
Dwelling utilities and assets
Homeownership (No = ref.)Yes----
Home-building material (Other = ref.)Timber---0.73
(0.4).
Concrete----
No. of floors (At least one floor = ref.)Ground floor----
Safe water access (No = ref.)Yes2.051
(0.55) ***
−1.322
(0.53) *
--
Electricity access at home (No = ref.)Yes1.46
(0.77).
---
Toilet availability at home (No = ref.)Yes−1.885
(0.83) *
1.014
(0.59).
--
Genset availability at home (No = ref.)Yes----
No. of household motorcycles (Continuous)Unis ----
No. of household cars (Continuous)Units ----
No. of household multicabs (Continuous)Units ----
No. of household trucks (Continuous)Units ----
No. of other vehicles in the household (Continuous)Units −0.759
(0.37) *
---
Sociodemographic characteristics
Gender (Female = ref.)Male----
Marital status (Others = ref.)Married----
Age (At least 60 years = ref.)18–29 years-−1.398
(0.54) **
-2.024
(0.68) **
30–39 years----
40–49 years----
50–59 years----
Educational level (Elementary and lower = ref.)Highschool----
Higher than high school----
Occupation type (Others = ref.)Employee----
Self-employed-−0.682
(0.33) *
-1.19
(0.5) *
Household head (No = ref.)Yes0.44
(0.25).
---
Household size (Continuous)People-−0.342
(0.08) ***
-0.385
(0.11) ***
No. of children aged ≤ 5 years (Continuous)Children−0.293
(0.14) *
---
No. of elderly people (Continuous)At least 65 years----
No. of PWDs (Continuous)People--0.886
(0.43) *
-
No. of pets (Continuous)Pets----
Residential period (At least 50 years = ref.)<10 years----
10–19 years----
20–29 years----
30–39 years----
40–49 years----
Individual income (Continuous)103 PhP per month----
Household income (Continuous)103 PhP per month---0.031
(0.02) *
Log-Likelihood: −810.3219
Akaike Information Criterion (AIC): 1688.644
McFadden R2 = 0.009
“Stay home” is used as the reference for the top model.
“Open space” is used as the reference for the middle model.
“<6 h” is used as the reference for the bottom model of opens space sub-nest.
“<one day” is used as the reference for the bootle model of public shelter sub-nest.
ref.: reference
“-“ signifies no parameter estimate or zero.
Significance codes: 0 ‘***’ 0.001 ‘**’ 0.01 ‘*’ 0.05 ‘.’ 0.1
Note: 1 USD = 51.82 PhP.
Table 10. Estimated percentage shares of earthquake evacuation and mode used.
Stay HomeLeave Home
WalkingTwo- and Three-WheelerOther Modes
Actual38.01%53.46%6.16%2.37%
Estimateed38.01%53.46%5.79%2.74%
Table 11. Earthquake evacuation and travel mode choice coefficients (standard error).
VariableCategoryEvacuation ChoiceTravel Mode Choice
Leave HomeWalkTwo- and Three-Wheeler
Intercept −6.982
(0.68) ***
3.228
(0.25) ***
-
Earthquake-related damage variables
Warning method (No warning = ref.)Telecommunication3.887
(1.09) ***
--
Megaphone/word-of-mouth2.093
(0.42) ***
−0.897
(0.25) ***
-
Home damage level (No damage = ref.) Moderate0.924
(0.29) **
--
Severe/complete3.864
(1.06) ***
−0.684
(0.32) *
-
Electricity cutoff (No = ref.)Yes3.576
(0.34) ***
--
Water cutoff (No = ref.)Yes1.975
(0.35) ***
-0.884
(0.23) ***
Dwelling utilities and assets
Homeownership (No = ref.)Yes---
Home-building material (Other = ref.)Timber---
Concrete---
No. of floors (At least one floor = ref.)Ground floor−1.087
(0.39) **
--
Safe water access (No = ref.)Yes1.575
(0.49) **
--
Electricity access at home (No = ref.)Yes---
Toilet availability at home (No = ref.)Yes---
Genset availability at home (No = ref.)Yes---
No. of household motorcycles (Continuous)Unis −0.427
(0.22).
--
No. of household cars (Continuous)Units ---
No. of household multicabs (Continuous)Units ---
No. of household trucks (Continuous)Units ---
No. of other vehicles in the household (Continuous)Units −0.901
(0.42) *
--
Sociodemographic characteristics
Gender (Female = ref.)Male---
Marital status (Others = ref.)Married-−0.598
(0.22) **
-
Age (At least 60 years = ref.)18–29 years---
30–39 years0.81
(0.36) *
--
40–49 years-0.521
(0.31).
0.785
(0.4).
50–59 years0.79
(0.37) *
--
Educational level (Elementary and lower = ref.)Highschool−0.53
(0.26) *
--
Higher than highschool---
Occupation type (Others = ref.)Employee-0.476
(0.2) *
-
Self-employed---
Household head (No = ref.)Yes-0.548
(0.19) **
-
Household size (Continuous)People---
No. of children aged below 5 years (Continuous)Children---
No. of elderly people (Continuous)Aged at least 65 years---
No. of PWDs (Continuous)People−6.719
(3.1) *
6.839
(3.15) *
7.037
(3.19) *
No. of pets (Continuous)Pets---
Residential period (At least 50 years = ref.) <10 years---
10–19 years---
20–29 years---
30–39 years---
40–49 years---
Individual income (Continuous)103 PhP per month---
Household income (Continuous)103 PhP per month---
Log-Likelihood: −527.5837
Akaike Information Criterion (AIC): 1107.167
McFadden R2 = 0.481
“Stay home” is used as the reference for the upper model.
“Other modes” is used as the reference for the lower model.
ref.: reference
“-“ signifies no parameter estimate or zero.
Significance codes: ‘***’ 0.001; ‘**’ 0.01; ‘*’ 0.05; ‘.’ 0.1
Note: 1 USD = 51.82 PhP.
Table 12. Weights of factors in the suitability mapping derived from the AHP survey.
Factors (Criteria)Sub-CriteriaAlternativesScoreWeight (Rank)
Tsunami inundation1–4 mUnsuitable135.0%  (1)
<1 mMost suitable5
Terrain elevation<1.5 mSuitable319.3%  (2)
>1.5 mMost suitable5
Proximity to the road network>500 mUnsuitable116.6%  (3)
250–500 mSuitable3
<250 mMost suitable5
Distance from the nearest fault line<1000 mUnsuitable116.1%  (4)
1000–7500 mSuitable3
>7500 mMost suitable5
Terrain slope>30°Unsuitable113.1%  (5)
15–30°Suitable3
<30°Most suitable5
TOTAL 100%
Publisher’s Note: MDPI stays neutral with regard to jurisdictional claims in published maps and institutional affiliations.

