1. Introduction
The touristic specialization of many destinations focuses on mass tourism has led to quite negative impacts on the territory where it is carried out since the economic benefits generated by the tourism activity have been obtained at the cost of the environmental and sociocultural balance of the tourism destination [
1]. This situation has resulted in the deterioration of fragile environmental resources, causing an alarming situation [
2] that has led to a decline in attractiveness and competitiveness [
3] and potentially hindering its middle and long-term competition with other tourism destinations.
Moreover, for decades now, international tourism has been experiencing a period of transformation, increasing over recent years, and requiring that measures be adopted by destination managers to improve the destinations’ competitiveness and sustainability.
On the supply side, the maturing tourism market has slowed growth rates and increased competition in the sector [
4] due to the appearance of new destinations that may satisfy similar tourist motivations [
5,
6]. Furthermore, new problems can also be considered in many destinations resulting from a disproportionately high influx of tourists—overtourism [
7], leading to overcrowding, environmental and cultural degradation and dissatisfaction, of both the tourist and the resident population [
8].
On the demand side, it is clear that the tourist profile has changed significantly over recent years. Today’s tourists are more complex and experienced, and therefore, they demand more personalization, authenticity, and memorable experiences [
9]. However, there is also a growing concern among tourists with regard to potential environmental, social and cultural impacts caused by the tourism activity [
10].
Hence, the maturity of the tourism destinations requires that challenges be met, given the changes taking place in travel habits and behavior patterns, as warned even back in the 1990s [
11]. This new scenario demands a more dynamic role on behalf of the public sector, which should attempt to promote new and more sustainable growth strategies that are based on gradual differential competitive repositioning.
In the case of Spain, competencies in the area of tourism are structured in three levels, distinct from the government, according to the country’s administrative division: central, regional and municipal. The public administrations of the territories, mainly regional, in which tourism activity has a major weight in the Spanish economy, have highlighted certain financing problems [
12].
In this sense, OECD [
13] defined tourism taxation as “
the indirect taxes, taxes and tributes that mainly affect the activities related to tourism”; and it is considered to be one of the main elements by which it is possible to “
contribute to the obtaining of taxation income, financing the protection of the environment and public investment and the development of infrastructures to improve the management of the tourism impact in sensitive areas”. Moreover, Tourism taxation has been configured, on numerous occasions, as an instrument for dealing with the problems arising from tourism development [
14]; it is an activity taxed since its inception to increase revenues, offset the costs derived from the provision of goods and services of a public nature and correct market failures or negative externalities caused by tourism activity [
15,
16]. In addition, it can also be used to achieve other purposes, such as job creation, economic development promotion, environmental protection, destination promotion, etc. [
13].
Therefore, tourism taxation becomes a tool through which to distribute the costs associated with tourism activity, through the establishment of specific taxes [
17] destined directly to the activity [
18], which pursue an extra-fiscal purpose, and whose objective is to improve the product [
17] and hence the tourist experience.
Therefore, the objective of this article is to determine the tourists’ willingness to pay (WTP) taxes and/or public fees that permit the financing of policies to offer increased sustainability in mature destinations and to simultaneously improve the tourism experience. To achieve this objective, first, a multiple correspondence analysis was performed to identify the taxes and/or public fees imposed on the tourism activity and that tourists were more willing to pay. In addition, second, a regression analysis using conditioned inference decision trees was performed to identify the sociodemographic variables and trip characteristics influencing tourists’ WTP these taxes.
The study was conducted in Andalusia, a predominantly touristic region of southern Spain that follows mainly a mature mass tourist model and which received 32.4 million tourists in 2019. For this, a survey was given to 1068 tourists at the main tourism departure points of the region.
In accordance with the proposed objectives, two hypotheses were established: (i) there are certain taxes and/or public fees that tourists visiting Andalusia are more willing to pay and, (ii) it is possible to identify certain factors—sociodemographic factors and trip characteristics—that condition the willingness of tourists to pay taxes and/or public fees when visiting this tourism destination.
The results of this study may assist policymakers and consolidated tourism destination managers in facing some of the problems related to sustainability, competitiveness and financing of tourism activities in these destinations, determining the appropriateness of establishing specific taxes that are related to tourism activity from the demand perspective. In addition, these results may be used for decision-making purposes in other destinations where tourism activity has a significant effect on the local economy.
The rest of the paper is organized as follows:
Section 2 presents the concept of WTP, contexts of WTP and factors influencing the WTP, followed by
Section 3, in which the research methodology is introduced.
Section 4 presents the empirical results of factors influencing the WTP of the dimensions identified, and
Section 5 concludes the paper with a discussion of the results, its limitations and future research themes.
2. Theoretical Framework
In the distinct works found in the scientific literature regarding tourism activity, WTP has often been used as a means of estimating the value of non-market goods according to the assumptions of rational choice and maximization of usefulness [
19]. Furthermore, tourists’ WTP can be used as compensation for the damage caused to the public welfare through the negative externalities caused by the activity, permitting them to obtain certain marginal benefits [
20].
Along these lines, tourists’ WTP has been used in many studies related to tourism activity, analyzing the tourist’s WTP with regard to the preservation and/or protection of natural areas, environmental protection, the sustainability of the tourism destination, or improvement of the tourism experience.
Table 1 reveals details from studies that have analyzed the WTP of tourists based on distinct tourism contexts.
In addition, in many of the studies on tourists’ WTP, the main determinants of this WTP have been identified since this helps offer a greater understanding of tourist demand in the face of the increased tourism product. Therefore, WTP is considered to be a dependent variable that is explained, to a greater or lesser extent, by a set of sociodemographic factors, psychographic factors [
19,
20] and trip characteristics [
52] related to tourist demand as shown in
Table 2.
Thus, it is evident that tourists’ WTP has been widely analyzed in distinct contexts related to the estimation of non-marketable goods. In addition, the sociodemographic and psychographic factors and trip characteristics that may explain this WTP have also been analyzed. However, these studies have tended to consider the individual WTP of tourists in diverse contexts related to tourism activity.
This work analyzes the tourists’ WTP, explained using distinct factors—in this case, sociodemographic factors and trip characteristics—with regard to distinct dimensions that are made up by some of the fifteen proposed taxes and/or public fees that are related to the tourism activity. Hence, this study is novel, as compared to past works, in its consideration of tourists’ WTP. The taxes and/or public fees that are considered in this work include almost all of the previously studied dimensions, so a global analysis can be performed for the WTP of the tourist demand in distinct touristic contexts, which, until now, have only been examined in an individual manner.
3. Materials and Methods
The objective of this study is to determine tourists’ WTP taxes and/or public fees that would permit the financing of policies to improve the competitiveness and sustainability of the destination and thereby improve the tourism experience. The study was conducted in Andalusia, a mass tourism destination—which, in 2018, received a total of 32,476,854 tourists, of which 12,633,644 were foreigners [
73].
To achieve this study objective, which on one hand, is to identify the existence of public taxes and/or fees with a higher WTP by the tourist demand, and on the other hand, to determine the sociodemographic variables and trip characteristics that influence the WTP of the tourists when establishing these fiscal instruments, below is a list of the analyzed tourist variables, how the data were obtained, and a specification of the statistical models that have been applied.
3.1. Composition of the Tourist Characteristics
Upon initially considering the analyzed sample, a detailed description of the characteristics of the tourists participating in this study is carried out. This initial descriptive approach makes it possible to identify the average characteristics of the tourists visiting this destination: without distinction by gender, between 25 and 65 years of age, with secondary-level education or higher, traveling in family, without a defined stay duration, with sun and beach motivations, using hotel lodging, being the first time visiting the destination, coming from another location other than Andalusia, employed in the service or industry sectors, having an annual net income of over 25,000 euros, and with a mean daily budget of 87.61 euros. Details of the analyzed sample are presented in
Table 3. The data from the said table are provided by the descriptive statistical treatment of the surveys carried out in this study.
3.2. Data Collection
Given the impossibility of identifying the study subjects (all tourists visiting Andalusia), a probability sample was carried out, in which the sole selection criteria is having spent at least one night in any of the Andalusian destinations.
The sampling process was approached through a time location sampling (TLS) design, as in [
74]. TLS attempts to recruit respondents in places and times where they would be reasonably expected to gather. The sampling framework consists of venue–day–time units (VDT)—also known as time-location units—which represent the potential universe of venues, days and times. The units of interest were represented by tourists leaving Andalusia, where we collected information related to the entire period of time spent in Andalusia. As for the TLS design, we have selected all airports and the three high-speed train stations in Andalusia. The period covered by the survey was from July to October, during which a large percentage of tourists visiting Andalusia are concentrated. The specific TLS implementation was treated as a two-stage stratified sampling design with unequal selection probabilities for the first-stage units and with constant selection probabilities for the second-stage units. Finally, first-stage units included a combination of places, days and hours, and the second-stage units were made up of tourists who were selected within the first stage units through a systematic selection procedure.
This sample consists of a total of 1068 surveys (sampling error: 3.1%; confidence level 95%;
p = q = 0.50). As seen in
Table 4, the total distribution of interviews conducted was based on the tourist’s point of exit to Andalusia criteria (Andalusian airports and Andalusian high-speed train stations), maintaining the proportionality in the number of surveys with respect to the total number of passengers received in both transport means.
Interviews were conducted between the months of July and October 2019 and consisted of two blocks of questions:
An initial block, classifying the tourist based on sociodemographic variables and trip characteristics (detailed in
Table 3);
A second block, related to the tourism experience in Andalusia (possibility of improving the tourism experience and WTP of the tourists with regard to fifteen taxes and/or public fees, both to improve the experience as well as to contribute to offering greater sustainability to the destination).
3.3. Multiple Correspondence Analysis
In accordance with the objectives established in this work, first, an attempt is made to identify those taxes and/or public fees having a higher WTP by the tourists. Along these lines, this work attempts to analyze fifteen taxes and public fees, making it necessary to reduce the sample into homogenous groups of taxes and/or public fees.
In order to reduce the dimension, numerous statistical techniques have been frequently used in other studies: the grouping of the original variables to define underlying constructs. Of these statistical techniques, two of the most commonly used are exploratory factor analysis (EFA) and multiple correspondence analysis (MCA). It is widely recognized that EFA is more appropriate for use with continuous variables, and, on the other hand, MCA is more suitable for categorical variables [
76]. However, EFA may be used at a descriptive level with dichotomous categories.
In this work, which considers fifteen dichotomous categorical variables, the MCA technique was used, given that the homogeneity of the variables makes this the ideal analysis to explain the phenomenon of interest: WTP by the tourist demand.
Finally, from a purely exploratory perspective, the results of MCA were compared with those of EFA with Varimax rotation, given that the objective of this comparison was carried out with a confirmatory purpose.
3.4. Decision Trees
Upon identifying the groups or dimensions of taxes and/or public fees imposed on tourism activity with a higher WTP by the tourist demand, the second proposed objective of this work is to identify which sociodemographic variables and trip characteristics of the tourists determine this WTP. Decision trees were used to achieve this objective.
A decision tree is a type of supervised learning algorithm that is used for classification and regression tasks based on complex databases. It may be applied to categorical or continuous variables, which are easy to understand, interpret, and visualize [
77]. With decision trees, it is possible to extract and analyze which variables in this study explain the WTP of the tourist demand with respect to the natural grouping of the data in the previously mentioned underlying dimensions. For this, the decision tree executes a recursive algorithm, minimizing a cost function—prediction cost.
The advantages of the decision trees are the clarification of the results, the understanding of the interaction between the variables and the application of this technique to massive data. In this work, conditional inference decision trees are used [
77], presenting advantages as compared to the classic decision trees.
Conditional inference decision trees estimate the relationship between variables through a recursive partition in an area of conditional inference. The algorithm functions as follows [
78]:
It tests the null hypothesis of independence between the explanatory variables and the explained variable through a permutation test for each explanatory variable. The partitioning process ends if this hypothesis cannot be rejected. Alternatively, the variable having the greatest association is selected, and this association is measured using the p-value of a partial test between each explanatory variable and the explained variable. The one with the lowest p-value is selected;
A binary partition is made for the selected variable;
Steps (1) and (2) are recursively repeated.
The implementation used for step 1 is based on the permutation test developed by [
79]. The stop criterion in step 1 is based on the
p-value adjusted by the Bonferroni method [
80].
4. Results
Of a total of 1068 tourists interviewed, 904 (84.7%) declared that there is a margin for improvement in the tourism experience that they are enjoying in Andalusia, while the remaining 15.3% believe that this experience cannot be improved. As seen in
Table 5 observing the correlations (Spearman’s Rho) between the margin of improvement of the tourism experience and the options by which it could be improved (the tourism experience), it may be concluded that the improvement of the infrastructures, in general, is the option that most conditions the opinion that it is necessary to improve the tourism experience—having the highest correlation, coefficient 0.405. That is, it is the most relevant factor of the four proposed ones, followed by tourism services and the wellbeing of the population.
As for the WTP, an additional amount, both to improve their tourism experience (more and better infrastructures, public and tourism services) and to minimize the negative impacts of the tourism activity (waste generation, pollution, overcrowding in sites of touristic interest, saturation of certain services, environmental, patrimonial and architectural degradation, etc.), as well as to expand upon the cultural and artistic offerings, 75.3% of the interviewed (803 tourists) are willing to pay an additional amount. The remaining 24.7% believes that the additional payment would only serve to increase payments to the public sector, which will spend this money as it deems more useful and will not, in fact, make any changes with regard to the tourism destination.
4.1. WTP Taxes and/or Public Fees
The next step consists of identifying the tourist demand that declares its WTP, the acceptance or not, of a series of taxes and/or public fees on tourism activity, whose objective is to improve the tourism experience and sustainability of the destination. These taxes and/or public fees were previously identified by a panel of experts [
81].
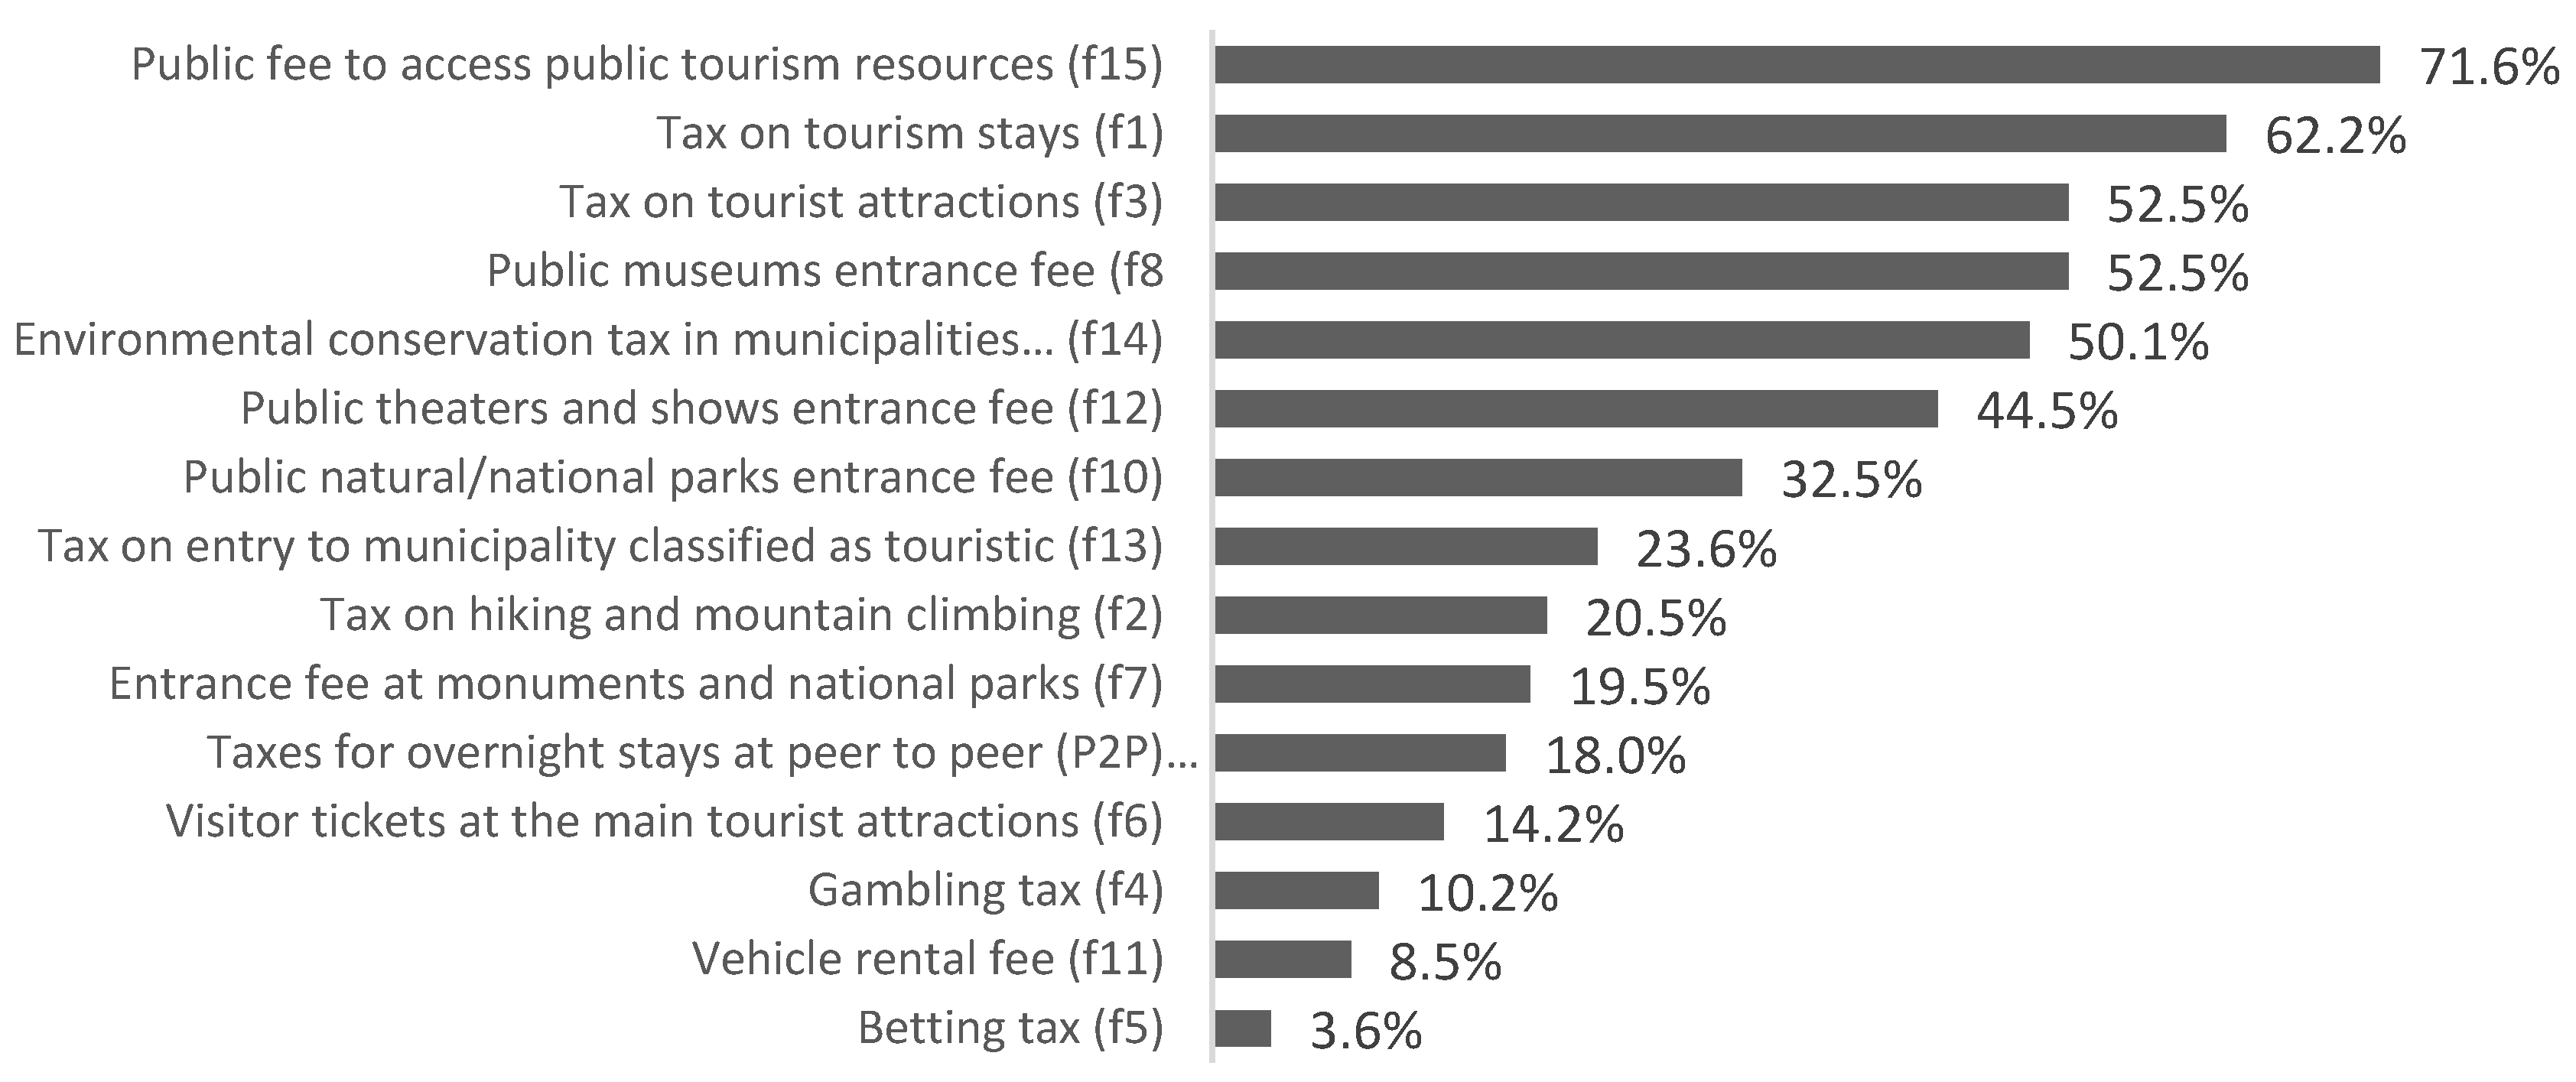
As
Figure 1 reveals, there are large differences in WTP depending on which of the fifteen analyzed taxes and fees are considered, ranging from a broad consensus to pay a public fee to access public tourism resources (71.6%) to a very small WTP a betting tax (3.6%). This difference in acceptance of the taxes and fees that have higher or lower WTP by tourists is motivated by distinct perceptions of the surveyed tourist.
In addition, it should be noted that this question was only answered by those tourists who had previously declared their WTP (75.3%). For example, in the case of the betting tax, this WTP only represents 2.7% of the overall population (75.3% × 3.6%).
However, based on this initial descriptive analysis, it may be deduced that there are certain taxes/fees having a high percentage of WTP by the tourist demand, associated with paying to enjoy tourism resources, as well as tourism, stays, confirming the results from
Table 5 with respect to the improvement options for the Andalusian tourism experience.
The issue, in this point, lies in reducing these taxes and/or public fees into homogenous taxes/public fees groups and identifying the sociodemographic features and trip characteristics that determine this WTP by the tourist, with respect to these groups of taxes and/or public fees.
4.2. Dimensions of the Taxes and/or Public Fees
4.2.1. Creation of Taxes and/or Public Fees Dimensions
Below, the fifteen taxes and/or public fees analyzed in this work have been homogeneously grouped. To do so, a multiple correspondence analysis (MCA) was used, applying this model as follows:
It is based on a complete model, including the fifteen proposed taxes/public fees. The MCA indicates the existence of five underlying dimensions that explain 68.03% of the variability—complete inertia. In this initial analysis, it is concluded that the “public fee to access public tourism resources” has a weight in the two dimensions with the greatest variability and, therefore, is quite transversal. This result is not surprising, considering that this tax fee receives the highest WTP. In addition, the “vehicle rental” fee determines one single dimension, given that the WTP for this fee does not appear to be related to the other fees/taxes, which is logical given that it is the fee with the second to lowest WTP. Finally, it appears that the “visitor tickets at the main tourist attractions” fee has no identification with any dimension and is quite transversal, perhaps because its imposition is similar to other fees (public fee to access public tourism resources, public museums entrance fee or national parks entrance fee).
Based on this initial analysis, a new MCA was created, suppressing the previously mentioned fees (public fee to access public tourism resources, vehicle rental fee and visitor tickets at the main tourist attractions fee).
Table 6 shows the results from the MCA of the contributions by categories, revealing the four dimensions of greatest explained inertia. Having extracted the previously indicated fees, the five resulting dimensions explain 69.39% of the total inertia.
Table 6 details the correlation of each tax/public fee category with the dimensions and the main coordinates of these categories in each dimension. After removing the confusion from the “access public tourism resources” and “visitor tickets at the main tourist attractions” fees, different taxes and/or public fees dimensions are detected (
Table 7). These dimensions should be considered underlying constructs formed by groups of taxes/public fees having a certain level of association.
The environmental and tourism service dimensions have an explained inertia of 22.11% and 15.58%, respectively; they are not fully independent, given that the “tax on tourism stays”, although with a lower weight, is also slightly correlated with the first dimension. Moreover, the mainstreaming of the “public fee to access public tourism resources” reveals a positive association with both dimensions.
The third dimension, recreational, having 9.88% of the total explained inertia, and the fourth dimension, tourism infrastructure, with 13.24% of the total explained inertia, associate each one to two taxes/public fees. Finally, the “vehicle rental” fee determines one sole dimension, referred to as mobility.
In addition, it should be indicated that the environmental and tourism services dimensions, as they are configured, are not independent, as will be discussed later; likewise, in this sense, there is also a certain association between the tourism services and tourism infrastructure dimensions, through the “public museums entrance fee”.
Even though, as indicated in the methodology section, EFA is more useful for continuous variables, the weights of the Varimax rotation—seeking the highest degree of non-correlation between the factors—ratifies and clarifies the associations detected by the MCA, as shown in
Table 8.
The analysis clearly detects a third (gambling tax and betting tax) and fourth (entrance fee at monuments and national parks and taxes for overnight stays in P2P accommodations) factors. This reinforces the independent study of these dimensions, as seen in
Table 7. Hence, like the MCA, a certain dependence is evident between these dimensions, through the “public museums entrance fee” and “betting tax”.
Therefore, it should be noted that both reduction studies, MCA and EFA, clearly detect an environmental construct such as a latent variable, which represents the increased explained variability; likewise, a tourism services construct is detected, not as cohesive as the previous one, but with a clear association between the taxes/public fees. Finally, both analyses indicate an association between the variables making up the recreational and tourism infrastructure dimensions.
4.2.2. Description of Taxes/or Public Fees Dimensions
In order to analyze the tourists’ sociodemographic variables and the characteristics of the trip with respect to the WTP of the distinct dimensions of the taxes and/or public fees, the latter is transformed into artificial variables that indicate a higher or lower intensity within the dimension, by adding together the amounts of its components. For example, a tourist receives a score of 0 to 4 on the first dimension (environmental), suggesting that they are in agreement with the payment of one, two, three, or four taxes/public fees making up said dimension.
Therefore, as shown in
Table 9, which includes the response frequencies, the first two dimensions will have a range of values from 0 to 4 (as they are made up of 4 taxes/public fees), while the third and fourth dimensions will have a range of values from 0 to 2 (since they consist of two taxes/public fees) and the last dimension will have a range of 0 to 1 (since it is made up of one single fee).
The second dimension (tourism services) clearly has the highest percentages of tourists that are willing to pay at least one of the taxes/public fees making up this dimension; only 8.72% do not agree with the payment of any taxes/public fees in this dimension. The first dimension (environmental) also has a high rate of acceptance, although 32.42% of the tourists are unwilling to pay any of the taxes/public fees in this dimension. As expected, for the third (recreational) and fourth (tourism infrastructure) dimensions, tourists are unlikely to be willing to pay since only 12.45% and 32.25% of the tourists are willing to pay for at least one of the taxes/public fees in these dimensions. Finally, tourists reject the fifth dimension (mobility) by over 90%.
Once again, these results confirm what is shown in
Table 5, since tourists revealed a greater WTP, mainly an additional amount, in those dimensions containing taxes/public fees that permit an improvement of both sustainability of the destination through environmental protection and an improved tourism experience through the payment of taxes and/or public fees related to tourism services (culture, shows or lodging).
4.3. Determinant Factors of WTP for Taxes and/or Public Fees
Below, the decision tree technique is applied to predict the five identified dimensions (as well as the two transversal fees: visitor tickets at the main tourist attractions and public fee to access public tourism resources) based on the tourists’ sociodemographic variables and the trip characteristics as described in
Table 3.
Thus, the analysis is carried out only to detect those variables that explain variability in the dimensions and not for predictive purposes, such that all of the data are considered as training data. The database consists of the 803 tourists with positive WTP out of the 1068 total tourists surveyed.
4.3.1. Environmental Dimension
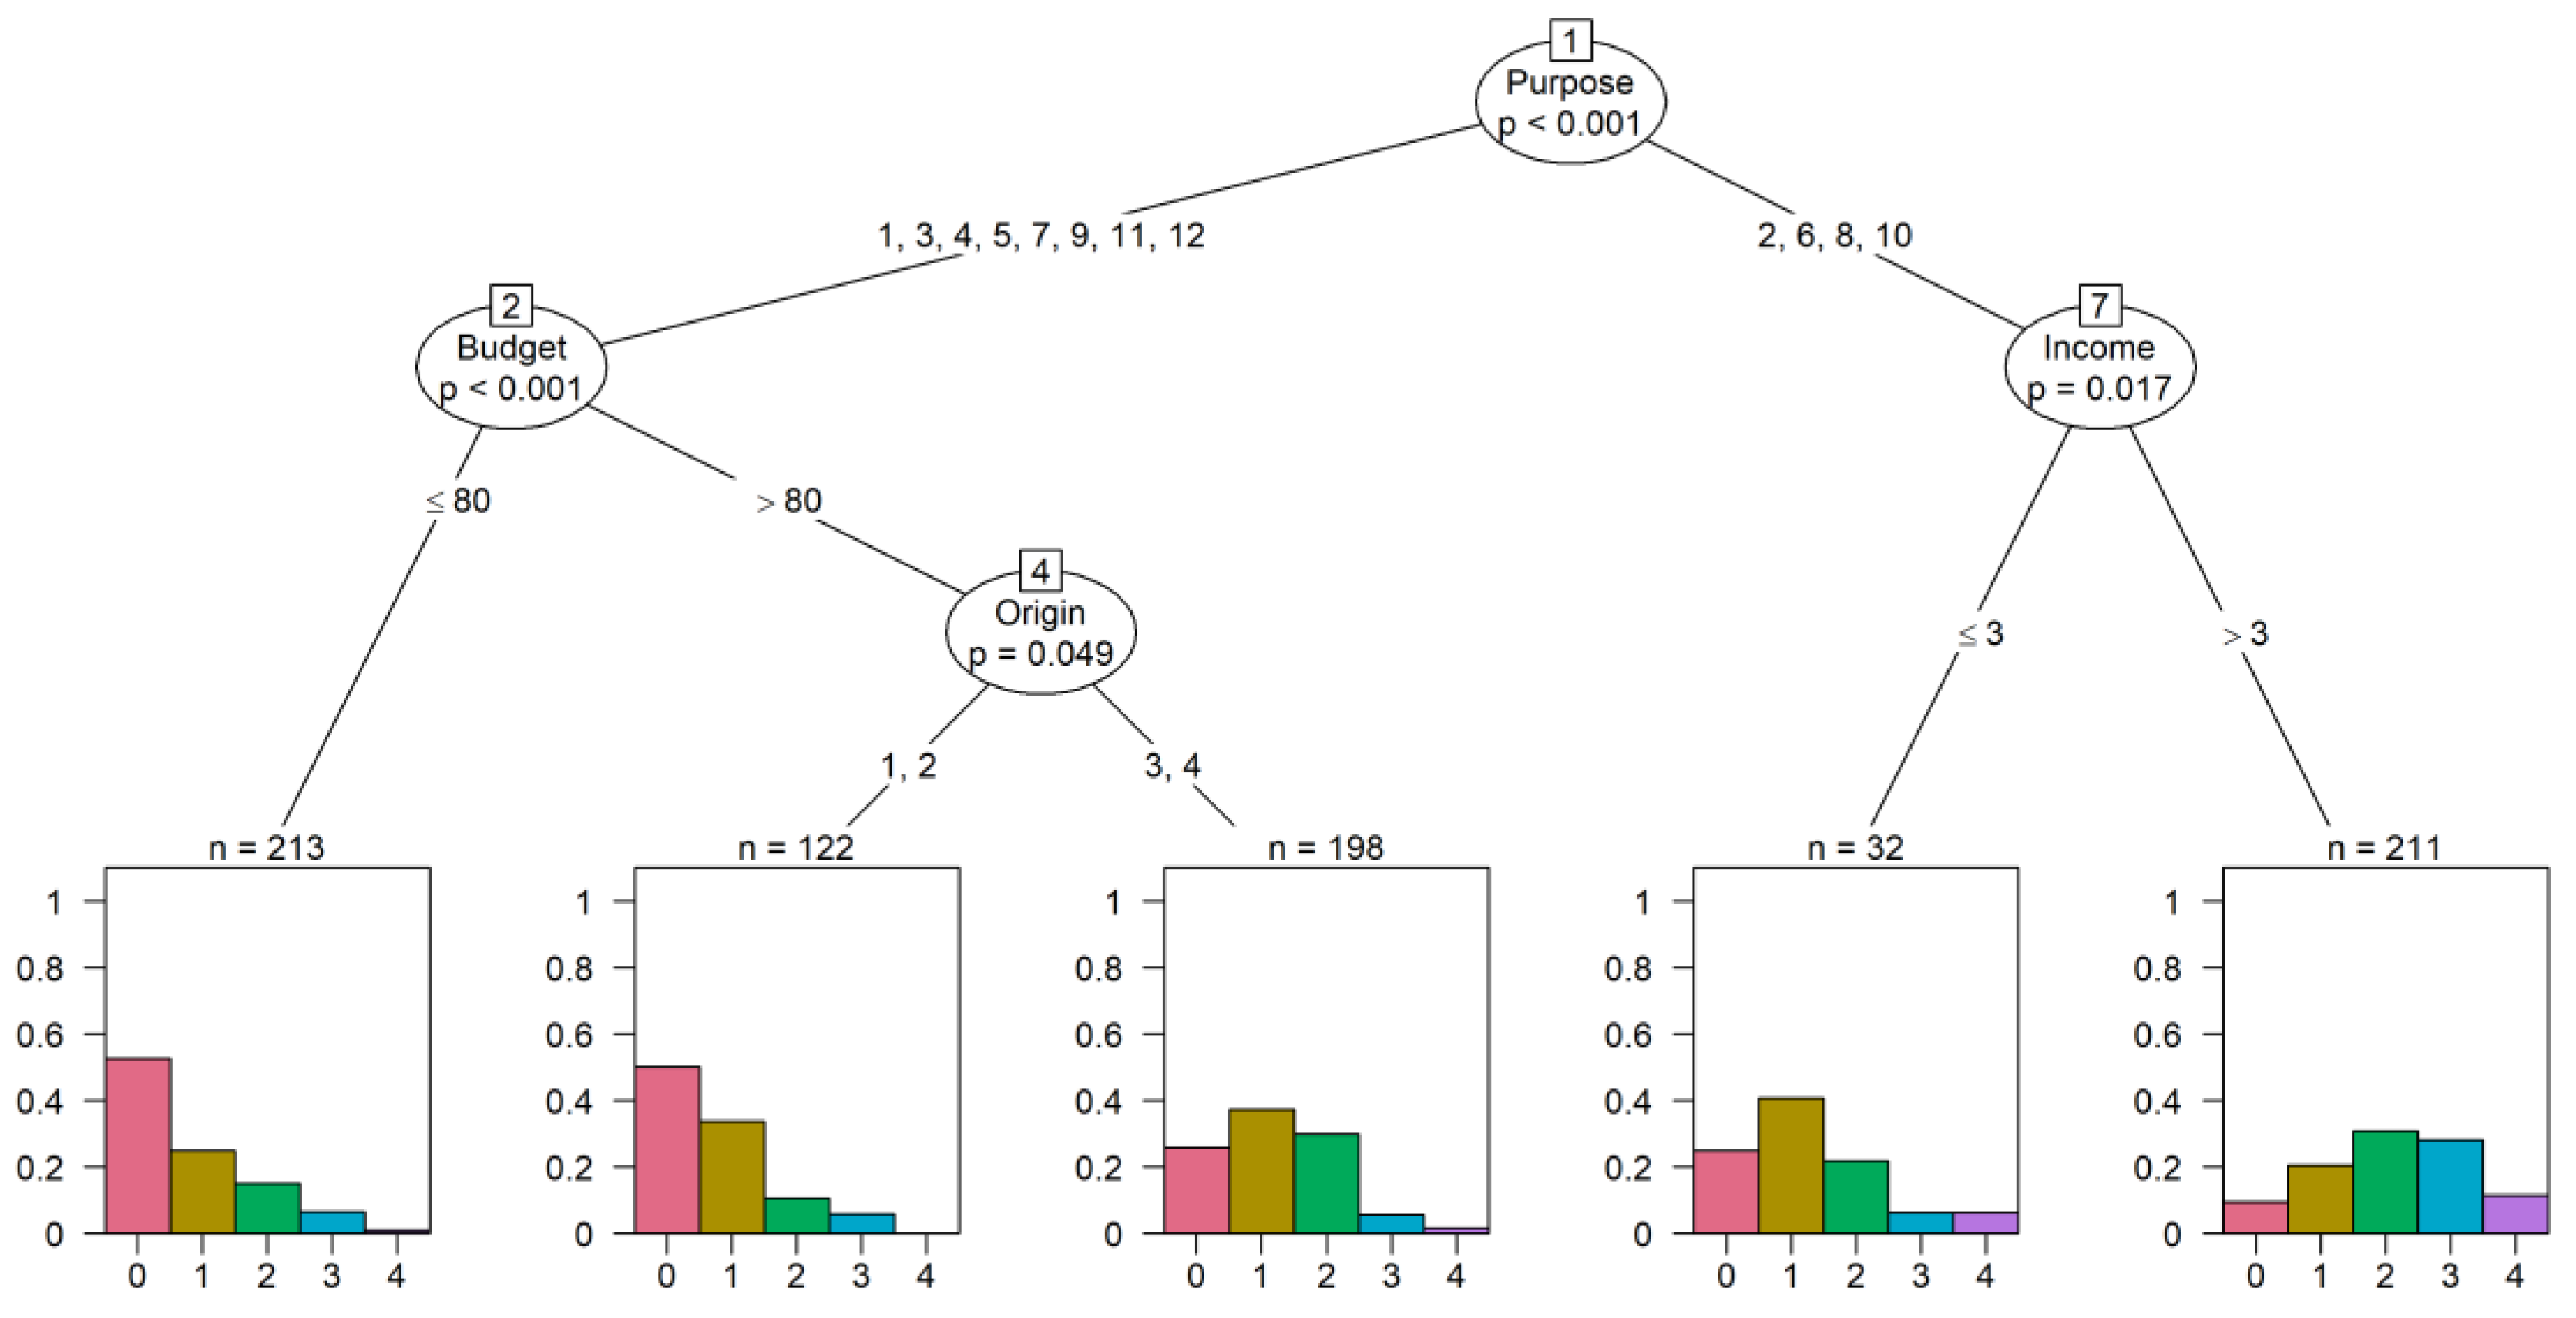
Figure 2 reveals the decision tree for the first dimension (environmental), based on the variables having the most significant association, from a statistical perspective: purpose of the trip, income, budget and place of origin.
Table 10, on the other hand, reveals the coding of the relevant variables.
The purpose of the trip variable is the root node, the variable that best groups in terms of association (dependence); and it is evident that the greater WTP is concentrated in the tourists whose purpose of the trip is interior/rural tourism, health/wellbeing, nautical/sporting marina and nature; in line with the “environmental” labeling of this dimension.
In addition, the budget and income variables are always positively associated with WTP. In addition, unlike those mentioned previously, Spanish tourists in the subgroup of other purposes have a lower WTP in the environmental dimension as compared to foreign tourists; this may be due to the fact that foreign tourists travel considerably further to reach the tourism destination (Andalusia) and therefore are willing to pay to enjoy this novel experience in the vacation destination, and because Spanish residents may be less environmentally conscientious than foreign tourists.
4.3.2. Tourism Services Dimension
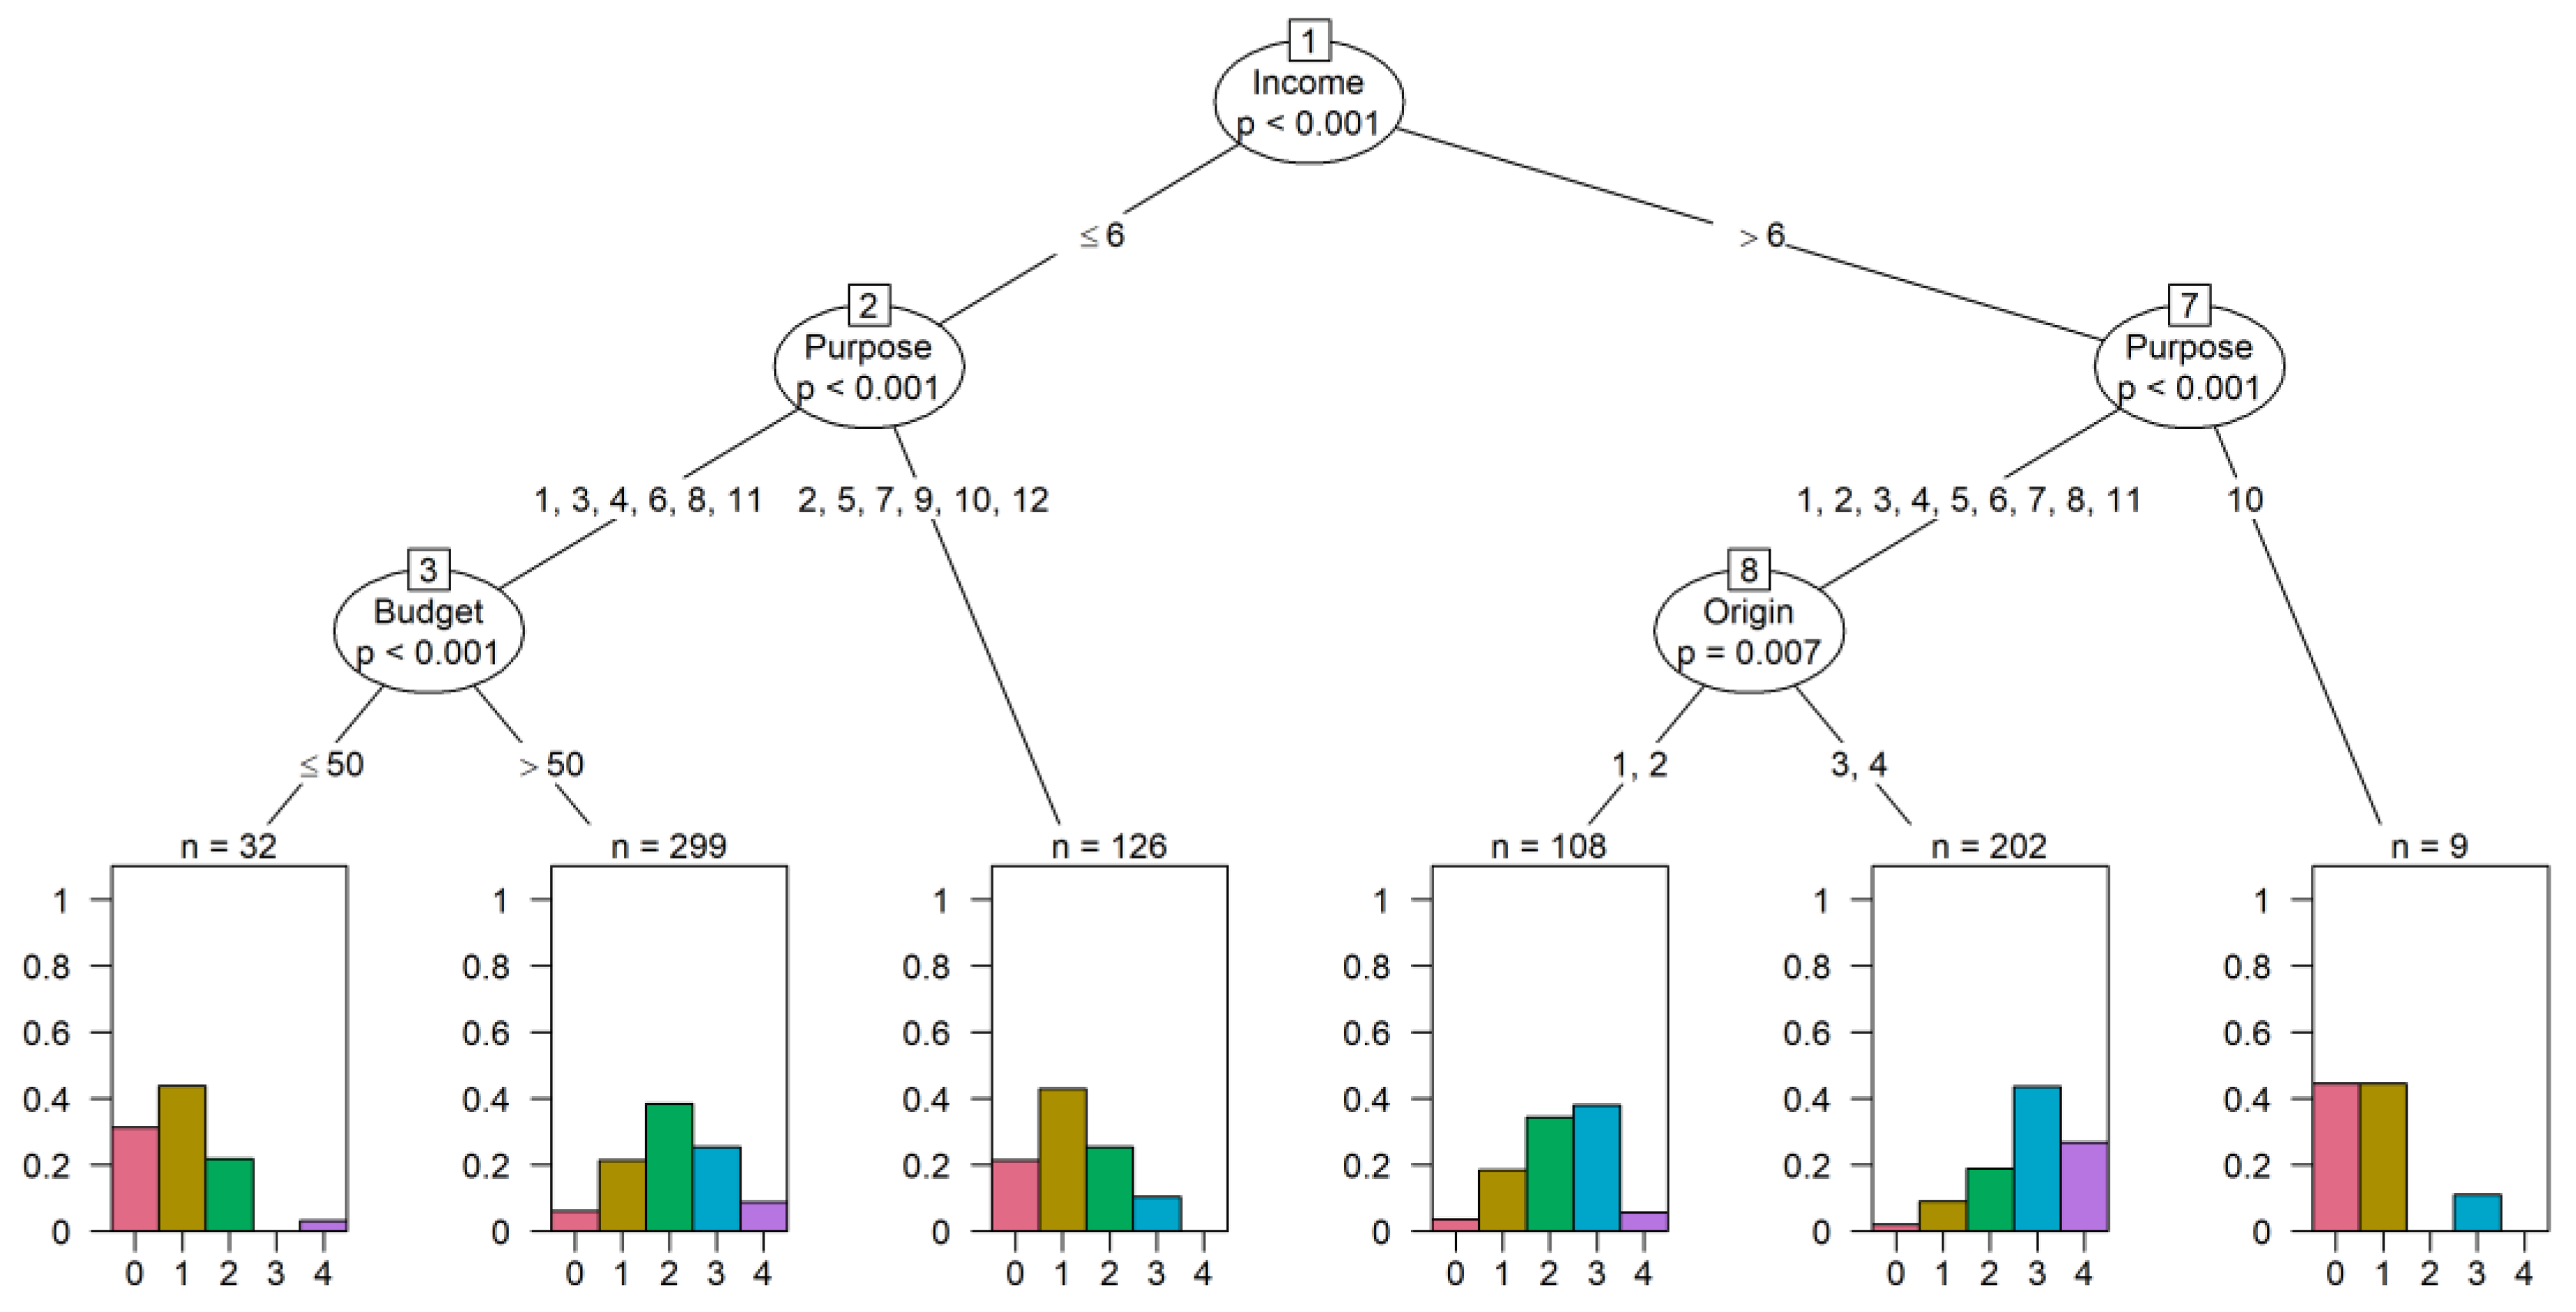
Figure 3 reveals the decision tree for the second dimension (Tourism services), based on the variables with the most significant association, statistically speaking: income, purpose of the trip, budget and place of origin.
Table 11 reveals the coding of the relevant variables.
It is seen that the root node lies in the income variable, being the one that best groups in terms of association (dependence); so, the greatest WTP is concentrated in the tourists with high budgets, in line with the economic capacity required by the taxes/public fees that make up this dimension—tax on tourism stays, taxes on tourist attractions or public theatres and shows entrance fees.
Similarly, a lower WTP was identified for Spanish tourists. In addition, as expected, a lower WTP was observed in those tourists having a low budget. There is also a segment of tourists having high incomes (over 30,000 Euros net annual income) and travel motivations linked to nature, who, although not very representative, have a behavior that is contrary to the usual one for this dimension; this is clearly due to the fact that their main travel purpose is not cultural.
4.3.3. Recreational Dimension
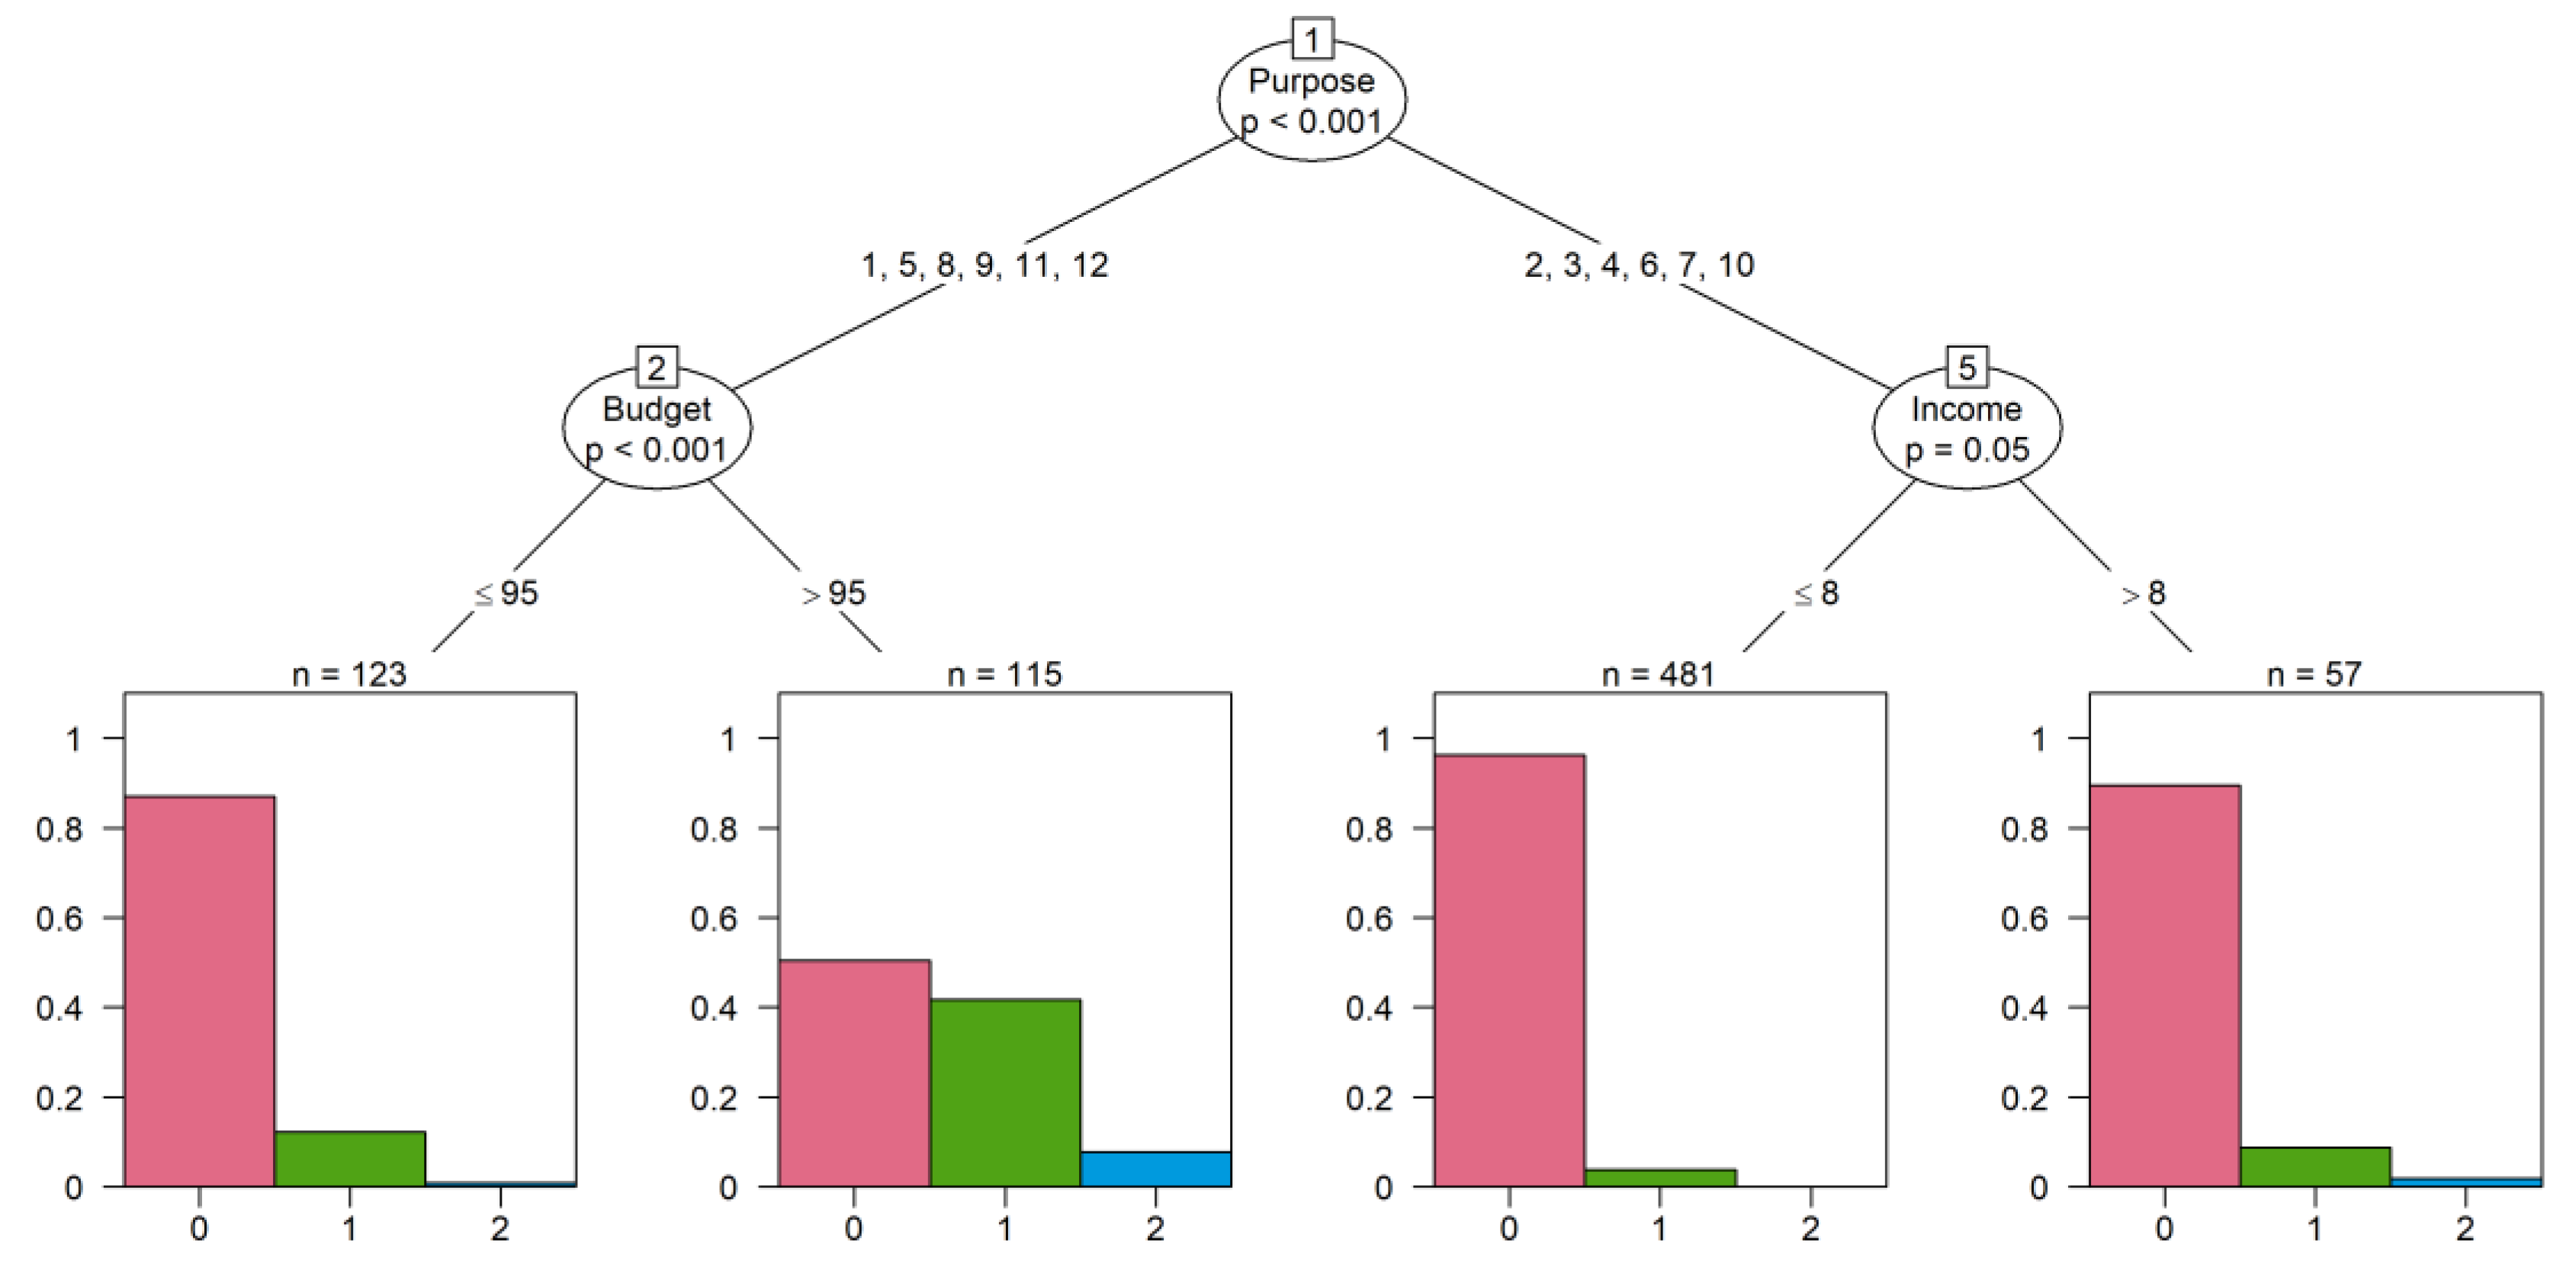
Figure 4 reveals the decision tree for the third dimension (recreational), based on variables in which there is a more significant association, from a statistical perspective: purpose of the trip, income and budget.
Table 12 reveals the coding of the relevant variables.
The third dimension reveals a very low WTP, as evidenced in
Table 9. However, the analysis via decision trees shows that the population subgroup with the greatest WTP is the group of tourists whose travel purpose is diverse, although mainly linked to the sun and beach (coastal, golf, nautical, cruise, food and wine and languages) and having a large budget (>95 euros). The remainder of the tourists is not very willing to pay either of the two taxes making up this dimension.
4.3.4. Tourism Infrastructure Dimension
The fourth dimension (tourism infrastructure) reveals a very low WTP, as seen in
Table 9. In addition, the study carried out via decision trees does not find any sociodemographic variable of the tourists or trip characteristics making up this dimension. Therefore, the WTP for this dimension is not subject to any specific profile, with its perception being transversal across the population.
4.3.5. Mobility Dimension
The fifth dimension (mobility) reveals a very low WTP, as evidenced in
Table 9. In addition, the decision tree study did not reveal any sociodemographic variables of the tourists or trip characteristics making up this dimension. Therefore, the WTP for this dimension is not subject to any specific profile, with its perception being transversal across the population.
4.3.6. Transversal Taxes/Public Fees (Not Linked to Any Specific Dimension)
As seen previously, specifically in the section devoted to the creation of dimensions (see
Section 4.2.1), there are two taxes/public fees: visitor tickets at the main tourist attractions and public fee to access public tourism resources, which are quite transversal and hence, cannot be associated with any specific dimension; therefore, they are analyzed independently.
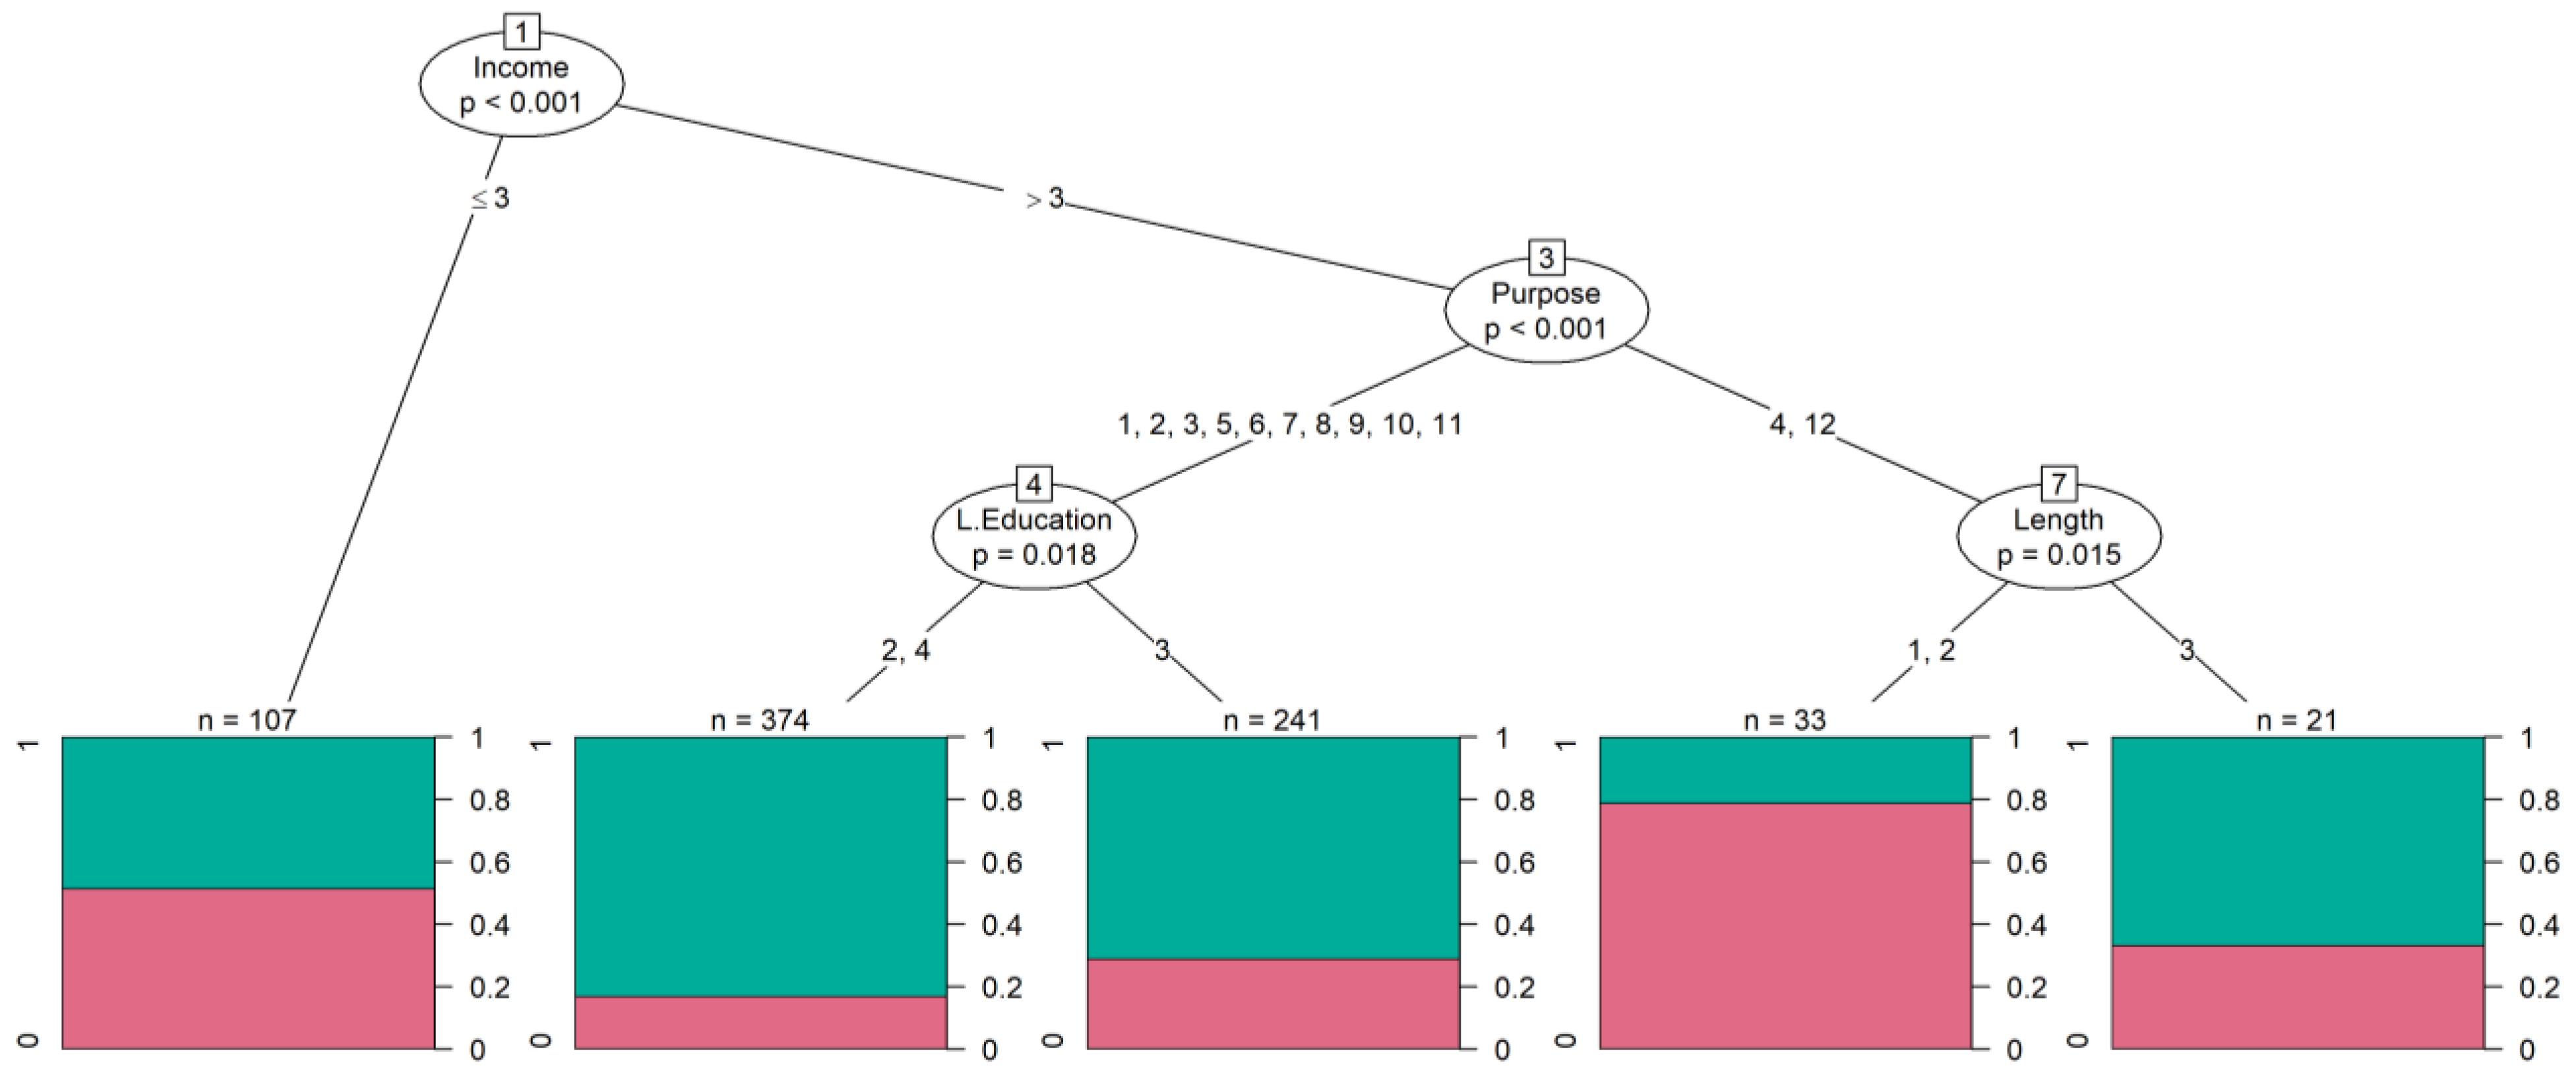
As for the former, in addition to having a very low WTP, the visitor tickets at the main tourist attractions fee revealed no sociodemographic variables of the tourists or trip characteristics in the decision trees making up this dimension. Therefore, the WTP this public fee is not subject to any specific profile, with its perception being transversal across the population. As for the second fee that was independently analyzed, the public fee to access public tourism resources, it should be mentioned that tourists have the greatest WTP for this of all fifteen taxes/public fees that were analyzed. However, in the case of tourists with average and low income, there was a large unwillingness to pay it, as observed in
Figure 5.
Table 13 reveals the coding of the relevant variables.
However, no sociodemographic features of the tourist or trip characteristics were significant; there was only one subgroup of tourists, with average-high incomes (33 tourists), not very representative, whose purpose of the trip—family tourism and languages—with average stays that had a lower WTP, as compared to the general population.
5. Discussion
This article explores the WTP of tourists in a mature destination that specialized in mass tourism. The study carried out and the results obtained confirm the two hypotheses proposed at the onset of the work, contributing to the scientific literature with regard to the WTP of tourists in various aspects.
It has been verified that a large majority of tourists visiting Andalusia would be willing to pay an additional amount to improve their tourism experience and to improve increased sustainability in the destination. Along these lines, a series of taxes and/or public fees have been identified, which tourists have been shown to be more willing to pay, mainly linked to taxation related to environmental factors (public natural/national parks entrance fee or the environmental conservation tax in municipalities whose main activity is ecotourism) or linked to the taxation of certain tourism services (taxes on tourism stays, taxes on tourist attractions or public theaters and shows entrance fees).
Tourists’ WTP for taxes/public fees in the dimension linked to environmental factors is coherent with the highly recognized environmental awareness of 21st-century tourists [
82] and with the generally unsustainable nature of mass tourism.
The dimension that taxes tourism services is seen to be the category of taxes/public fees that tourists are the most willing to pay for, confirming, in accordance with [
9], that tourists who travel long distances demand authenticity and memorable experiences and therefore, will be willing to pay for them.
Thus, given that the tourists’ WTP is a voluntary issue, it may be expected that the implementation of financial instruments by policymakers to obtain the financing needed to implement policies aimed at improving sustainability and the tourism destination experience will be in line with the tourist preferences. Otherwise, if tourists disagreed with the implementation of a specific tax, the imposition of the same may ultimately reduce the destination’s competitiveness and attractiveness.
Hence, these results confirm the first of the proposed hypotheses, since it has been verified that there are certain taxes/public fees (linked to environmental and tourism services factors) that tourists visiting Andalusia are more willing to pay; this is quite relevant information for policymakers and managers of mature tourism destinations since it may permit the implementation of taxes and/or public fees through which they can obtain a source of income to permit the financing of policies that will increase the destination’s competitiveness.
Second, we have examined how the WTP certain taxes/public fees may depend on distinct factors—sociodemographic aspects of tourists and trip characteristics. Hence, almost all of the factors, both sociodemographic and trip characteristics, are common in explaining the WTP for the distinct dimensions, mainly: the purpose of the trip, income, budget and place of origin.
The analysis of the factors that may condition the willingness to pay for to improve sustainability and the experience corroborates what has been advocated by recent literature. More specifically, the purpose of the trip and income are the variables that best groups in terms of association to the willingness to pay variable, as found by other studies [
52,
66,
67] and [
19,
53,
54], respectively. Furthermore, these variables have interaction with others that have been found to be determinant, place of origin and daily budget. The influence of place of origin on the willingness to pay for to improve sustainability and the experience verified empirically in this work was aligned with the results achieved in other studies [
19,
40,
55,
56]. The daily budget—linked, obviously, to the income variable—is a new explanatory variable of tourist behavior in terms of paying an additional amount.
Although these factors do not manifest themselves in the same way in all dimensions, for the purposes of this study, it is relevant to identify the degree of explanation of these factors for the two dimensions in which tourists were more willing to pay: environmental dimension and tourism services dimensions. Hence, the variables with the greatest explanation capability are the purpose of the trip (rural, health/wellbeing, nautical/sporting marina and nature motivations) with respect to the first dimension and income level (as of 30,000 euros net annual income) with respect to the second dimension.
To ensure the long-term existence of tourism destinations that may be considered “mature”, especially the coastal or sun and beach destinations, it is necessary to find a balance between economic advantages and sociocultural and environmental sustainability [
83], while also redesigning the mass tourism model.
Therefore, these results confirm the second proposed hypothesis, since distinct factors have been identified (sociodemographic factors and trip characteristics) that condition tourists’ WTP certain taxes/public fees, in this case, with special relevance being placed on environmental and tourism services taxes/public fees.
However, this work has certain limitations, including the fact that no interviews were conducted in other departure points, distinct from those analyzed, such as highway transport. In addition, the time limitations of the study should be noted, given that the tourists were administered the surveys over a period of less than one calendar year. Moreover, no questions addressed the identification of certain psychographic factors, such as environmental awareness or moral responsibility.
Finally, as future lines of research, it may be interesting to explore the WTP of tourist clusters, that is, groups of individuals having similar characteristics.


