Abstract
The air quality of modern cities is considered an important factor for the quality of life of humans and therefore is being safeguarded by various international organizations, concentrating on the mass concentration of particulate matter (PM) with an aerodynamic diameter less than 10, 2.5 and 1 μm. However, the different physical and anthropogenic processes and activities within the city contribute to the rise of fine (<1 μm) and coarse (>1 μm) particles, directly impacting human health and the environment. In order to monitor certain natural and anthropogenic events, suspecting their significant contribution to PM concentrations, seven different events taking place on the coastal front of the city of Limassol (Cyprus) were on-site monitored using a portable PM instrument; these included both natural (e.g., dust event) and anthropogenic (e.g., cement factory, meat festival, tall building construction, tire factory, traffic jam, dust road) emissions taking place in spring and summer periods. The violations of the limits that were noticed were attributed mainly to the various anthropogenic activities taking place on-site, revealing once more the need for further research and continuous monitoring of air quality.
1. Introduction
Air pollution is considered an increasingly important environmental issue with direct implications on human health, ecology and climate [1,2,3,4]. Various sources are responsible for the presence of a variety of air pollutants such as NOx, CO2, SOx, O3, volatile organic compounds (VOCs), polyaromatic hydrocarbons (PAHs) and particulate matter (PM). Therefore, these important air pollution components are globally recognized and widely monitored [5]. It is estimated that poor air quality is responsible for 800,000 deaths in Europe alone [2].
Air pollution by PMs is considered among the most important risk factors associated with premature mortality from cardiovascular, respiratory diseases and lung cancer [2,3,5,6,7]; it affects even COVID-19 mortality contributing to a 15% worldwide increase, while this percentage in Europe amounts to 19% and in neighbouring Greece 9% [8]. Therefore, strict legislation has been early enacted for PM levels by various international organizations, such as the European Union (EU) and the World Health Organization (WHO). In the EU-28, the levels of environmental concentrations are regulated by Directive 2008/50/EC [7]. The respective levels are set for directly informing the public at least once a day and preferably on an hourly basis, alerting those citizens with respiratory difficulties that they should restrict their outdoor activity. Specifically, for PM10 (particles with aerodynamic diameters equal to and less than 10 μm, which are characterized as coarse) the daily (24 h) limit is set at 50 μg/m3, while the daily average over a continuous year period is set at 40 μg/m3. Respectively, for PM2.5 (particles with a diameter equal to and less than 2.5 μm, which are called fine particles), only the daily average for a continuous period of one-year limit is given at 25 μg/m3, which was established for the first time in 2008. For the three consecutive years of 2013, 2014 and 2015, a mandatory indicator for the member states for PM2.5 was determined at 20 μg/m3, and until 2020 a target for further reduction to 18 μg/m3 was set. The directive then stipulates that the lower limit of 50% of the average desired concentrations, e.g., the concentrations of 20 μg/m3 and 12 μg/m3 for PM10 and PM2.5, respectively, should not be exceeded more than 35 times in a calendar year. In 2015, it was estimated that worldwide 8.9 million deaths are associated with PM2.5 exposure due to various indoor/outdoor pollution including smoking, obesity, occupation exposure, etc. [9]. Additionally, PM1 (subtypes with 1 μm and smaller diameters) are considered more harmful for public health [10,11,12].
Atmospheric air quality monitoring (regarding PMs) in Europe is carried out through terrestrial on-site or mobile stations, which are able to accurately assess the effects of air pollution on the entire continent [13]. Different techniques have been developed using various sensors and the electromagnetic spectrum through particle meters with oscillating microcells, barometric resolution, light scattering and solar meters [14,15]. In addition, for the first time, the directive 2008/50/EC has made it possible to use air quality models as complementary to assess the air quality [7].
While air quality monitoring stations provide high-quality measurements that contribute to assessing the effects of PMs and air pollution in general, in public health and in the environment, they come at a high cost, and therefore their number and their spatial resolution are limited. For complementing their observations, especially in the case of localized emission sources, which exhibit strong temporal variability, portable/cost-efficient instruments can be employed. Portable sensors are widely used in the field rather as reconnaissance supplementary devices to highlight the potential differences due to the various local sources leading to personal, indoor and outdoor exposures [16], and not to measure or monitor the exact concentrations. This task can be implemented only by reference methods, like the filter-based ones [17].
The advantages of portable sensors, which are mainly their portability, time-efficient deployment and easy operation, make them ideal instruments for probing PM concentrations. Such instruments have been used for probing particle emissions from outdoors [18,19], in urban/suburban regions [20], indoors [21,22], inside workplaces [23], in occupational settings from specific industrial processes [24] and even those originating from marine traffic [25], which is an important emission source of PMs that contributes in a harbour city air quality. On the other hand, field measurements using portable instruments lack 24 h average information offered by the fixed stations.
In any case, there are places and daily procedures where it is difficult to use conventional fixed measuring stations; therefore, alternative portable measuring devices based on portable sensors can be used for monitoring daily events, roads and construction sites. It is easier with a manual portable particle meter to detect the PM pollution source and to conduct detailed studies. There are activities and events that result in high emissions, which are much localized in both time and space (e.g., traffic jam at a specific road, local festivals, industrial procedures like sandblasting, etc.). Therefore, a number of parameters are considered important for locating and evaluating an event, as presented in Table 1.

Table 1.
Parameters considered for locating and risking a particulate matter (PM) incident.
Cyprus is an island located in the Eastern Mediterranean region in the middle of three continents (Europe, Asia, Africa). In addition to the emissions from local sources, it is often affected by pollution originating in neighbouring territories, such as from the Middle East, Europe and Asia [26]. Different studies conducted in the country/region, have shown that the number/mass concentration of particles residing in the category of PM10 and PM2.5 is higher than that of the rest of the EU or Europe in general. Such emissions can be attributed to various natural but also anthropogenic sources, located outside the island, with the industry being the highest, followed by agriculture, transport, residential and others [27].
There are already installed PM monitoring stations in specific places by the department of labour inspection (DLI, Ministry of Labour, Welfare and Social Security) in all cities of southern Cyprus to measure and monitor the air quality. On average, 44.0 ± 9.7 μg/m3, 44.3 ± 9.7 μg/m3, 45.9 ± 13.1 μg/m3, 33.9 ± 12.6 μg/m3, 35.5 ± 11.6 μg/m3 are the observed PM10 concentrations in Nicosia, Larnaca, Limassol, Paphos and Zygi, respectively. The population of all coastal areas (Limassol, Larnaca, Paphos, Famagusta) increases significantly during the summer period, due to domestic and international tourism, thus multiplying the local anthropogenic emissions. In addition, coastal cities are exposed to sea salt emissions (PM2.5) due to the winds, although this does not impact human health [15,26,28,29,30,31]. In all cities of Cyprus, the average annual marginal values and the 35 daily exceedances are commonly exceeded. Since not much can be performed to avoid the natural emissions that the area is subjected to (as sea salt and dust), at least it is better to mitigate the anthropogenic ones.
Limassol is the largest harbour on the island and one of the largest in the Eastern Mediterranean. As such, PM concentrations are initially affected by marine traffic and port installations. In addition, being a tourist attraction area and an industrial hub currently under finance and rapid construction development, various concerns are raised about the city’s air quality. The situation is enhanced by other habits such as the local festivals that are annually taking place (e.g., carnival, wine and meat festival—locally known as Tsiknopempti), which attract thousands of spectators. Despite the daily and annual efforts of the DLI to record the city’s air quality through the local PM10 station, the dynamic and rapid behaviour changes in the city make this task difficult. Parallel measurements, taken nearby an event (on-site) by portable instruments, can significantly contribute to better evaluate the effectiveness of coastal resource management and future sustainability [26,32,33].
Although many air pollution studies across Europe are focused on the physical and chemical characteristics of PMs, there is limited data on the specific sources on the coastal area of Limassol [34]. The main objective of the present work is to obtain the local fine-scale air quality and identify respective hot spots in order to reduce the eventual population and environmental exposure risks; however, this will not necessarily reduce the long-term and background air pollution. The necessity of the present study arises from the frequent occurrence of airborne PM incidents in the coastal area, as well as the broader city.
2. Experimental Part
2.1. Materials and Methods
The PM measurements were performed using a recently calibrated portable DustTrak meter (DRX Aerosol Monitor 8534). This device is a light scattering photometer able to measure the mass concentration (μg/m3) of particles. An impactor can be employed for segregating aerosols having aerodynamic diameters of maximum 10, 4, 2.5 and 1 μm. The DustTrak measures the mass concentration of particles in the range from 1 to 150,000 μg/m3, with a resolution of 1 μg/m3. The factory default calibration was used in current measurements since the type of aerosol (refractive index chemical composition, shape of particles) was difficult to be predetermined in most of the cases. More information for the calibration of DustTrak instruments can be found in [16]. The measurement error of 2 μg/m3 is provided by the manufacturer (zero stability, 24 h at 10 s time constant). The air flow rate in the system is 1 L per minute within 5% accuracy. Special attempts were made to measure concentrations of PM in all three aerodynamic diameters of 10 μm, 2.5 μm and 1 μm. Therefore, measurement durations of 10–20 min per diameter were performed.
2.2. Field Sampling
The chosen sampling points (Figure 1) were selected as suspected “hot spots” that may significantly contribute to the city’s PM concentrations. Therefore, a variety of anthropogenic activities such as industrial (cement factory, tire factory) and construction (tall building), as well as residential and transport (meat festival, traffic, dust road) were monitored. A natural dust episode, one of those that often affect the city, was also monitored for quantifying the impact of natural sources on the city’s PM concentrations. Measurements recorded after rain, in Molos pedestrian area (data not presented, sampling point 8), served as background/clean atmosphere reference. Furthermore, four more locations served as “background points” (a balcony in March and August for seasonal correlation and a cafe on a normal operating day for comparing to the anthropogenic event of incident 2-meet festival). Balcony acted as a background measurement (very close to sampling point 6) because it was not affected by traffic or other nearby sources (distance from the different sampling points varied from 50 to 5000 m). In summary, the field sampling campaign was implemented taking into consideration the following activities, incidents and events:
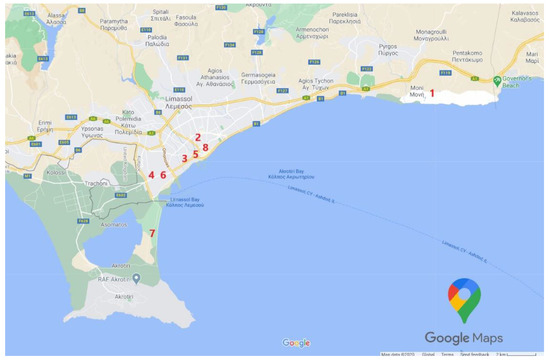
Figure 1.
The selected points for PM sampling [36].
- A cement factory (Moni area)
- A meat festival, known as a “Tsiknopempti” event (cafe restaurant in the square)
- A construction site of a tall building (Marina and old port area)
- A tire factory incident (nearby balcony, 2nd floor)
- A traffic incident (Molos area, on the coastal road)
- A dust incident (2nd-floor balcony)
- A dust road incident (coastal area at Lady’s Mile Beach)
2.3. Design of Field Study
The study was implemented on-site on the coastal front of Limassol during a six-month time period. A minimum of 2 h and a maximum duration of 4 h as a measuring activity time per location was followed; this was performed in order to be able to monitor the three aerodynamic diameters of 10 μm, 2.5 μm and 1 μm. The measuring device was not placed directly over the source of pollution, but at a reasonable distance and at an average human height near the breathing zone in order to calculate the degree of human exposure to pollutants [35].
3. Results
The significance of the localized selected events is that they may pose hazards to human health. Each event, anthropogenic or natural, was compared with the DLI values (which represent the urban background; average PM concentration over the whole city area), and thus the contribution of the “localized sources” to the nearby population or local environment could be assessed. The respective measurements can be considered as small snapshots of the local air quality at the given time. These data are all gathered in Table 2 and graphically depicted in Figure 2, respectively.
Table 2.
Presentation of the selected local sources, the respective sampling points and the PM results.
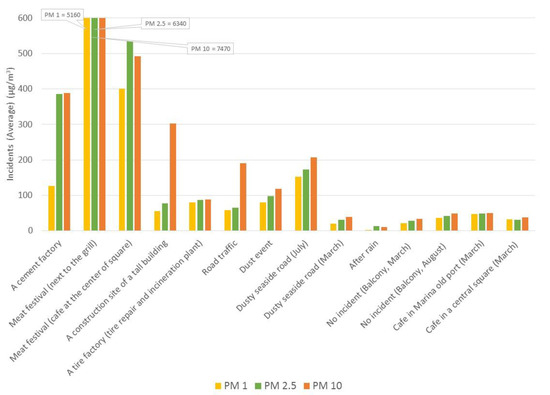
Figure 2.
PM average measurements on the coastal front of the city.
Near the cement plant, relatively high concentrations were observed reaching up to an average PM10 value of 388 μg/m3 and an average PM2.5 value of 386 μg/m3. High instantaneous readings of up to 12,200 μg/m3 (PM2.5) were recorded at the same time. Figure 3 depicts the overall PM measurements attributed to the cement plant operation. As shown, the PM concentrations in the cement plant area are mostly related to particles having aerodynamic diameters of less than 2.5 μm. This agrees with previous relevant observations [37], as it is well known that cement plants are considered an important source of PM influencing the wellbeing of people and the environment. Such emissions are related to various diseases such as chronic obstructive pulmonary, silicosis, preterm delivery, etc., according to the relevant review [38]. In Spain, in a similar study by Rovira et al. (2018), the direct effect of a cement plant on the environment was reconfirmed; PM10 and various chemicals were identified such as mineral matter, sea spray, secondary inorganic aerosols, organic matter, elemental carbon and trace elements [39]. In the current study, only a small percentage was attributed to PM1 (ratio PM1/PM2.5 = 0.33), originating obviously from other activities that took place in parallel during the respective measurements.
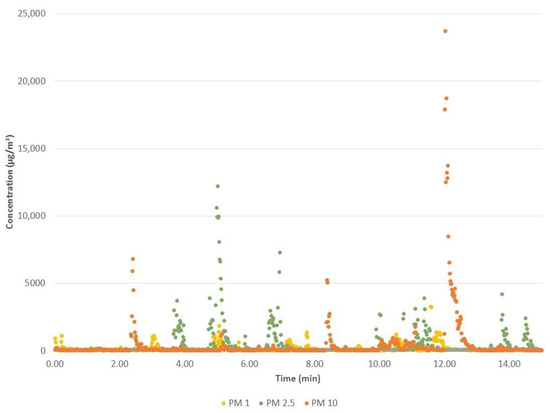
Figure 3.
Cement factory PM results per minute.
The second event, that of the meat festival, showed the highest PM concentrations from all the investigated air pollution incidents, as the results were above the permissible limits set by the EU and much higher than a normal day in the plaza (see Table 2). The majority of the emitted particles are considered especially hazardous due to the fact that they originated from open charcoal fire(s) and roasting [40,41]. Of particular concern is the aspect of human health; the fact that most of these particles resided in the fine-size range (i.e., PM2.5, PM1), thus penetrating deep into the human respiratory system, is an important issue [42]. Impacts on indoor air quality may be increased in the nearby area due to the high aerosol concentrations produced [43].
Specifically, the average PM10 concentrations next to an operated grill (4–5 m distance from the grill) were 7470 μg/m3 with maximum values (“spikes”) up to 65,700 μg/m3 (PM2.5), as shown in Figure 4. When the respective measurements were repeated in the centre of the plaza (further away from the grill), the concentrations decreased (Figure 5). Despite the greater distance from the source, the results remained concerningly high as a massive meat barbecue was taking place in the open due to the local custom of “Tsiknopempti”. At the same distance (centre of the plaza), PM2.5 average concentrations of 535 μg/m3 with maximum values (“spikes”) up to 15,800 μg/m3 were recorded. The respective measurements indicated the high potential of harmful emissions due to the high amount of fine particles (PM2.5), originated from burning coal and roasting. Similarly, the corresponding ratios for PM1/PM2.5 were 0.81 and 0.75, which showed the high percentage of PM1 in the plaza’s proximity, further increasing the hazard for the attenders. The significant contribution of this local custom of massive charcoal grilling in the deterioration of air quality and in the increase of health-related hazards on the bystanders is corroborated by comparing the measurements conducted during the festival to those conducted on a normal day (Figure 6). During the latter measurement, very low PM values were noticed.
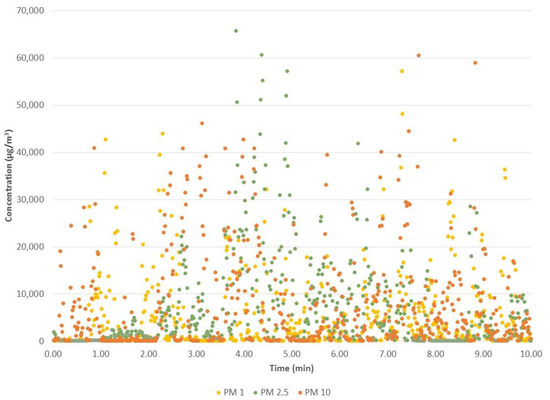
Figure 4.
Meat festival PM measurements in time (next to the grill).
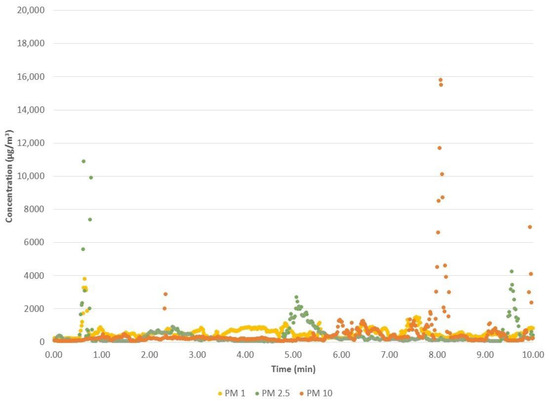
Figure 5.
Meat festival (cafe, center of plaza) PM measurements in time.
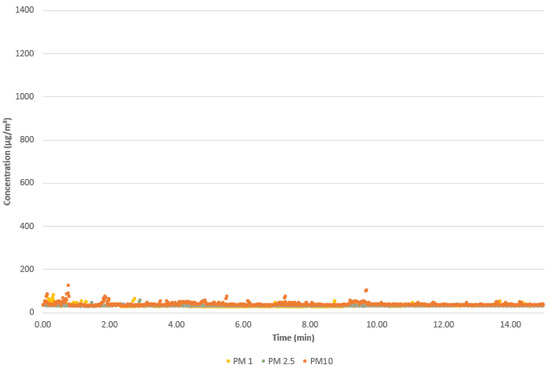
Figure 6.
Normal day PM measurements in time at the same sampling point (a cafe at the center of the plaza) on a different day.
Measurements conducted at the construction site of a tall building in the area of Marina old port revealed PM10 average concentrations of 302 μg/m3. This result indicates the predominant emission of coarse particles from the construction site. In construction sites, the emission of dust is to be expected; however, the workers need to be protected according to the local/regional legislation. The same applies to the citizens and bystanders. The radius of the nuisance and deterioration of air quality is considered significant, as the measured PM10 daily average in the DLI station was only 34 μg/m3.
The fourth incident examined the PM emissions from a repair factory, during tire burning. The results show PM10, PM2.5 and PM1 average concentrations of 88, 87 and 79 μg/m3, respectively. The respective values indicate the presence of fine particles (PM2.5) and sub-micrometre particles (PM1). Figure 7 shows three peaks at 245, 239 and 278 μg/m3 corresponding to PM10, PM2.5 and PM1, respectively. Burning tires and other similar material produces particles (e.g., heavy metals, PAHs, VOCs, etc.) that are hazardous to humans and thus making the respective emissions dangerous and toxic [44,45,46,47,48].
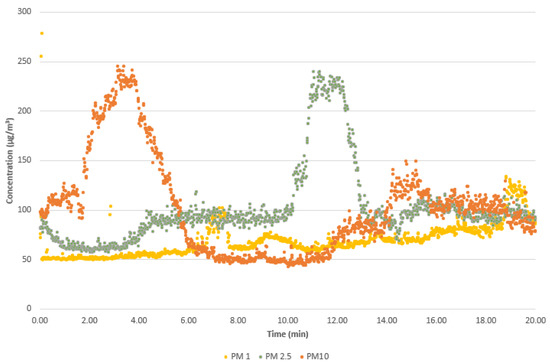
Figure 7.
Tire factory PM concentration in time.
The recording of a traffic incident on the main coastal street during rush hour in summer resulted in PM10 average concentrations of coarse particles at 191 μg/m3, which prevail in relation to those of the fine ones. Note that Limassol’s traffic station recorded a PM10 daily average concentration of only 27 μg/m3, during the current field measurements. While the urban DLI station provides the average exposure within the city, in certain areas the citizens are exposed to higher emissions.
The predominance of PM10 is indicative of dust resuspension from the road. In countries/regions with common dust presence, like Cyprus, the population is not only exposed to these natural particles during the dust events but in addition to their resuspensions at certain aspects of everyday life. This prolongs the exposure of the population to increase concentrations of PMs, beyond the dust event itself. In addition, to the best of our knowledge, the impacts of dust particles mixed with anthropogenic emissions on the human population are for the moment not well studied.
As an example of the contributions of natural emissions affecting the city, the next incident took place during a natural dust event, where the DLI station recorded PM10 values in the order of 43.12 μg/m3. At the same time, but in a different location of the city, values of PM10, PM2.5 and PM1 averaging at 118 μg/m3, 98 μg/m3 and 80 μg/m3, respectively, were recorded. While these values may be less accurate than those obtained by the reference station (i.e., 118 vs. 43.12 μg/m3), they are indicative of the contribution of the natural PM sources in the city’s air quality, raising the PM mass concentrations close to, or even above, the limits set by the European legislation. It is therefore important to highlight the need of mitigating the local/anthropogenic emissions in the city, at least under circumstances/events during which raised concentrations of natural PM are present, to reduce the exposure of the population.
According to the reported urban PM2.5 values for evaluating the air quality in European cities, the city of Limassol is mainly affected by spatial analysis transboundary, international shipping and/or natural by 86%, while the average contribution from the natural sources is 43% (from dust and sea salt). Other minor sources are that from agriculture 6% (from livestock, fertiliser use and agricultural waste burning), from road transport 2% and from residential sector 1%. Limassol’s contribution to annual PM2.5 concentrations (over all 150 cities) is on average only 8% and to the entire country 14% [27].
The seventh sampling point monitored a dust resuspension episode nearby Lady’s Mile Beach in summer with increased traffic. The PM10 average concentrations reached that of 207 μg/m3, and the measured PM1/PM2.5 ratio was 0.88. These results reveal that this anthropogenic air pollution incident was caused mainly by PM1 and PM2.5 and emphasized the exposure to similar incidents, opposed to a normal day in winter, as a result of travelling cars over the dirt road affecting the nearby swimmers.
Finally, a number of background case measurements were also undertaken from a balcony apartment, as no event was actually monitored. In particular, the average concentrations of PM2.5 in March were 28 μg/m3 and in July 42 μg/m3. Both values exceeded the permissible limits set for PM2.5. In addition, the ratio of 0.75 for PM1/PM2.5 indicated the existence of strong fine particle background in both time periods. The respective PM10 values can be correlated with that provided by the standard instrument of the DLI.
4. Discussion
Generally speaking, the optical instruments (i.e., DustTrak II) cannot be treated as reference particulate matter mass concentration instruments. A direct comparison of the portable instrument was however conducted at similar conditions (i.e., urban background) and is being reported (i.e., denoted as “no incident” conditions; cf. #8–9 in Table 2 of the manuscript). In brief, during these collocated measurements, the portable instrument exhibited a bias in the range of 22.3% to 49.6%. These results are within the same order of magnitude of biases reported in [16], which compared the reported PM values of the portable instrument with collocated gravimetric measurements and found them to reside within 40% to 60%.
The uncertainties of the DustTrak (or other instruments of the same family, e.g., DRX), which are associated with the calibration method and the type (chemical composition, refractive index, shape) of aerosols, when compared with reference mass concentration measurements are reported in the literature varying from approx. 40% and above [16,49]. Nevertheless, the respective portable instrument (i.e., DustTrak) is a Tier 2 exposure assessment instrument [50], providing indicative but meaningful measurements, for the recognition of hot spots/events with a potential contribution in deteriorating the city’s air quality, serving the main goal of this study.
The intention of the current work was not to report PM mass concentration values at the maximum possible accuracy but rather to identify emission hot spots/events with a potential contribution in deteriorating the city’s air quality while posing a potential health hazard to at least a part of its occupants. At these hot spots/events, measured values are exceeding the average urban background PM10 mass concentrations (i.e., measured by the fixed station) by more than 280%. Most importantly, in many of these cases, the locally measured (i.e., using the portable monitor) PM10 mass concentrations exceeded the urban background average by more than 10-fold (see Table 2). Therefore, while the measurements presented are susceptible to artefacts, resulting from the operational principle of the portable instrument, they clearly indicate that certain activities/hot spots impact the local air quality while posing a potential hazard to bystanders and the local population.
For the interpretation of Table 2 results (e.g., meat festival incident, emissions from cement and tire factories), one needs to take into consideration that they correspond to real field measurements, acquired outdoors, in the close vicinity of the factories (plume dilution) or events, while moving around in a crowded plaza, under a windy and dynamic smoky environment, at slightly different distances per aerodynamic diameter, based on the moving crowd, available space and related activities in time.
It is well known that cement factories emit a variety of airborne pollutants in the atmosphere (e.g., dust, SOx, NOX, CO2, CO), and thus their operation is under the microscope of researchers worldwide for their potential environmental and health risks, for instance, in Zambia [51], Jordan [52] and Spain [39]. The cement industry is considered a large primary PM source, which means it should contribute to a significant amount of particles in the coarse fraction. According to the results of Gupta et al. (2012), the majority of particles released from the cement industry were coarse, even in terms of particle number distribution cement kiln; however, the measured values referred to direct mass concentrations from the kiln. Moreover, it was also stated that around 50% of the emitted PMs are smaller than 2.5 μm [53]. This observation agrees with our findings, as current measurements were acquired in the proximity of a cement factory, at a distance from the source (plume dilution) and under the influence of the wind. The latter two environmental parameters, along with the use of exhaust filters by the factory, resulted in measuring lower coarse (PM10) concentrations in respect to those produced within the process itself (i.e., in the kiln). For instance, in a similar application in Spain, the main concentrations in two areas influenced by cement plants were attributed to PM1, although the measurements included all the aerodynamic diameters [54].
The average annual concentrations of suspended particles of 10 μm in Limassol are equal to 45.9 ± 13.1 μg/m3, while the average annual concentrations of suspended particles of 2.5 μm are 25.5 ± 3.0 μg/m3. These numbers are at the highest point of the observed annual average, not only in Cyprus but also in Central and Northern Europe, as well as in the Mediterranean region (where the annual values of PM10 are 20 to 50 μg/m3 and those of PM2.5 are below 15 μg/m3). The average annual concentrations of suspended particles of 10 μm for rural areas of the city measured at 29 ± 5.0 μg/m3, which is higher than the majority of rural areas of Central and Northern Europe and the western Mediterranean basin. It is clear that marine sprays increase PM assemblies in the city, followed by mineral dust. The problem is compounded by the interactions between pollutants and photochemical processes that can be amplified in the Mediterranean and specifically in the city of Limassol at high temperatures and humidity. There is only one station in the city that records air quality and specifically that of PM10 (for traffic, as it is located nearby a commercial street). It is worrying that there is a lack of data for several time periods and especially in severe cases of local PM pollution [15,55,56,57]. The annual averages for PM10 and the number of excesses in each station on the island for the period 2010–2015 as recorded by the air quality monitoring network in Cyprus were published in the 2018 official report, and it is clear that there are exceedances of both the annual marginal value of 40 μg/m3 for the PM10 set in the relevant legislation, as well as the allowable number of excesses set at 35 excesses per year; 157 excesses were noted at the traffic station in 2012 in Limassol [15,55].
The numbers in Cyprus are at the highest point of the observed annual median, not only in the Mediterranean region but also for Central and Northern Europe [15]. Studies conducted in remote areas (to avoid local sources) showed that the particle mass concentration in Cyprus is higher than in the rest of Europe, creating a higher particle background usually exceeding the defined limits [15]; this is attributed mainly to the island’s geopolitical position. As particle levels exceed the annual standards of the EU, dust storms are responsible for a small fraction of the daily exceedances of the PM limit values. The contribution of the Sahara desert and dust events due to deserts affect up to 90% of the Mediterranean region [57]. Other natural particle sources, such as suspended soil and sea salt, are also responsible for the high levels of PMs. The sea sprays are close to the PM concentrations of a coastal city. The problem is compounded by the interactions between PMs and the photochemical processes in the Mediterranean area [56,57]. More rarely, jet streams are naturally affecting the area by carrying forest fire components; both this phenomenon and forest fire events are accelerated in recent years due to the rapid climate changes.
The various human activities such as the combustion of conventional fuels and wood for heating purposes and transportation (e.g., cars, buses, trucks, ships, planes, trains, motorcycles) result mainly in the production of PM2.5 and PM1, which are the most harmful [12]. In particular, diesel cars are more toxic than petrol cars. Road dust resuscitation, tire and brake wear and exhaust gases are emitting PM, thus traffic is widely recognized as one of the most important local contributors of PM levels in urban areas [15,58,59]. For example, Athens is facing a serious traffic jam problem, as at peak hours the speed does not exceed 12 km per hour on average, while the large percentage of old engine technologies increases the air pollution problem. A similar study on the Rio-Antirrio bridge (connects Attica region with Peloponnese by sea) showed that the intense traffic and low speeds of transport means favour high concentrations of PMs and violations of the permitted limits. In addition, during the warm season, when dust, marine particles and photochemistry are on the rise, they favour the mixing with exhaust and road particles. On the contrary, on a clear day high speeds (over 80 km per hour) and sparse traffic result in low PM concentration levels [59]. In addition, the dirt and sandy layer of the adjacent road together with the contribution of the particles of the sea sprays contribute to erratic concentrations [60]. The intense building development in a city leads to the creation of continuous dust at the construction sites, which impacts the employees, infrastructures and nearby residents [26,32,33,61,62,63]. In addition, the development of the construction industry implies increased work of cement factories, contributing to the emission of dust particles. Furthermore, industrial emissions are also an important problem as the combustion of conventional materials is loading the atmosphere with fine particles through the chimneys [4]. In addition, research studies showed a dependence of air pollution not only on meteorological conditions but also on other parameters such as the local topography, demography and level of industrialization [26,33,64]. On the other hand, low PM concentrations are observed when northeast winds and rainfall occur. In addition, the vertical mixing of pollutants results in the reduction of their average concentration, and the whole process is called diffusion [10,65]. Strong and frequent winds favour the diffusion of pollutants and PMs [59].
Concentrations observed in the areas of European Asia and South Africa such as the Mediterranean during the summer months are higher than in winter. Seasonal variability is observed with higher concentrations of PM10 and PM2.5 during the summer period compared to the winter period up to 50 per cent. This behaviour can be explained by the increased photochemical conditions during summer, leading to secondary aerosol formation and the absence of sedimentation, which increases the lifetime of the particles, the annual winds, the existence of large fires and the local resuscitation of dust caused by arid climates and erosion of locally arable land [15,26,28,29,30]. A large difference in the particle concentrations of 10 μm in relation to 2.5 μm is due to the strong background of the predominant example of PM10 versus PM2.5 [65]. Pollutants from PM may remain in the atmosphere for a long time, burdening it even later. The farther away a source of human pollution is, the less impact it has, but not indirectly (pollution transport, climate change). The same takes place in a habitat or ecosystem, such as the marine. On the other hand, some reports suggest that air pollution is not related to the temperature-mortality ratio, while others present the opposite correlation [29,66].
5. Conclusions
A series of events taking place on the coastal front of a dynamic developed insular city were selected and monitored for their air PM contribution. Both natural phenomena and anthropogenic emissions contribute to the rise of PM balance over a city. The hot spots/events recognized in the current study can therefore be further exploited for indicating the importance of certain activities/events/procedures in emitting significant amounts of PM, highlighting the need for high-accuracy exposure measurements and assessments. The under-study sampling events were characteristic daily examples of an active dynamic city, indicating the need for field measurements along with that of fixed stations. Their contribution to the PM air emissions is much higher compared to that of natural events, indicating the need for more knowledge and precaution measures for protecting citizens’ health and the environment. Although portable PM sensors present disadvantages (not as precise as the reference instruments, limited sensitivity, affected by factors such as relative humidity, inversion, windless weather, battery operation), they can monitor the respective activity on-site, in real-time, contributing to fast assessment and actions.
Author Contributions
Conceptualization, A.A.; methodology, C.P.; software, C.P.; validation, M.S., A.A.; formal analysis, C.P. and A.Z.; investigation, C.P.; resources, A.A.; data curation, M.S. and A.Z.; writing original draft preparation, C.P.; writing-review and editing, A.A.; visualization, M.S. and A.Z.; supervision, A.A.; project administration, A.A. and A.Z.; funding acquisition, A.A. All authors have read and agreed to the published version of the manuscript.
Funding
This research received no external funding.
Institutional Review Board Statement
Not applicable.
Informed Consent Statement
Not applicable.
Data Availability Statement
Data is all contained within the article.
Conflicts of Interest
The authors declare no conflict of interest.
References
- Coelho, F.J.R.C.; Santos, A.L.; Coimbra, J.; Almeida, A.; Cunha, Â.; Cleary, D.F.R.; Calado, R.; Gomes, N.C.M. Interactive effects of global climate change and pollution on marine microbes: The way ahead. Ecol. Evol. 2013, 3, 1808–1818. [Google Scholar] [CrossRef] [PubMed]
- Lelieveld, J.; Klingmüller, K.; Pozzer, A.; Pöschl, U.; Fnais, M.; Daiber, A.; Münzel, T. Cardiovascular disease burden from ambient air pollution in Europe reassessed using novel hazard ratio functions. Eur. Heart J. 2019, 40, 1590–1596. [Google Scholar] [CrossRef] [PubMed]
- Lelieveld, J.; Pozzer, A.; Pöschl, U.; Fnais, M.; Haines, A.; Münzel, T. Loss of life expectancy from air pollution compared to other risk factors: A worldwide perspective. Cardiovasc. Res. 2020, 116, 1910–1917. [Google Scholar] [CrossRef] [PubMed]
- Michaelides, S.; Karacostas, T.; Sánchez, J.L.; Retalis, A.; Pytharoulis, I.; Homar, V.; Romero, R.; Zanis, P.; Giannakopoulos, C.; Bühl, J.; et al. Reviews and perspectives of high impact atmospheric processes in the Mediterranean. Atmos. Res. 2018, 208, 4–44. [Google Scholar] [CrossRef]
- Lelieveld, J.; Evans, J.S.; Fnais, M.; Giannadaki, D.; Pozzer, A. The contribution of outdoor air pollution sources to premature mortality on a global scale. Nature 2015, 525, 367–371. [Google Scholar] [CrossRef]
- Giannadaki, D.; Lelieveld, J.; Pozzer, A. Implementing the US air quality standard for PM2.5 worldwide can prevent millions of premature deaths per year. Environ. Health 2016, 15, 1–11. [Google Scholar] [CrossRef]
- EC DIRECTIVE 2008/50/EC of the European parliament and of the Council of 21 May 2008 on ambient air quality and cleaner air for Europe. Off. J. Eur. Union 2008. Available online: https://eur-lex.europa.eu/legal-content/en/ALL/?uri=CELEX%3A32008L0050 (accessed on 20 December 2020).
- Pozzer, A.; Dominici, F.; Haines, A.; Witt, C. Regional and global contributions of air pollution to risk of death from COVID-19. Cardiovasc. Res. 2020. [Google Scholar] [CrossRef]
- Burnett, R.; Chen, H.; Szyszkowicz, M.; Fann, N.; Hubbell, B.; Pope, C.A.; Apte, J.S.; Brauer, M.; Cohen, A.; Weichenthal, S.; et al. Global estimates of mortality associated with longterm exposure to outdoor fine particulate matter. Proc. Natl. Acad. Sci. USA 2018, 115, 9592–9597. [Google Scholar] [CrossRef]
- Lim, C.C.; Thurston, G.D.; Shamy, M.; Alghamdi, M.; Khoder, M.; Mohorjy, A.M.; Alkhalaf, A.K.; Brocato, J.; Chen, L.C.; Costa, M. Temporal variations of fine and coarse particulate matter sources in Jeddah, Saudi Arabia. J. Air Waste Manag. Assoc. 2018, 68, 123–138. [Google Scholar] [CrossRef]
- Kaluzna-Oleksy, M.; Aunan, K.; Rao-Skirbekk, S.; Kjellstrom, T.; Ezekowitz, J.A.; Agewall, S.; Atar, D. Impact of climate and air pollution on acute coronary syndromes: An update from the European Society of Cardiology Congress 2017. Scand. Cardiovasc. J. 2018, 52, 1–3. [Google Scholar] [CrossRef] [PubMed]
- Kennes, C.; Veiga, M. Fundamentals and Microbiological Aspects. Air Pollution Prevention and Control: Bioreactors and Bioenergy; Wiley: Hoboken, NJ, USA, 2013. [Google Scholar]
- World Health Organization. WHO Air Quality Guidelines; WHO: Geneva, Switzerland, 2006. [Google Scholar]
- McMurry, P.H. A review of atmospheric aerosol measurements. Atmos. Environ. 2000, 34, 1959–1999. [Google Scholar] [CrossRef]
- Pikridas, M.; Vrekoussis, M.; Sciare, J.; Kleanthous, S.; Vasiliadou, E.; Kizas, C.; Savvides, C.; Mihalopoulos, N. Spatial and temporal (short and long-term) variability of submicron, fine and sub-10 μm particulate matter (PM1, PM2.5, PM10) in Cyprus. Atmos. Environ. 2018, 191, 79–93. [Google Scholar] [CrossRef]
- Wallace, L.A.; Wheeler, A.J.; Kearney, J.; Van Ryswyk, K.; You, H.; Kulka, R.H.; Rasmussen, P.E.; Brook, J.R.; Xu, X. Validation of continuous particle monitors for personal, indoor, and outdoor exposures. J. Expo. Sci. Environ. Epidemiol. 2011, 21, 49–64. [Google Scholar] [CrossRef] [PubMed]
- Kuhlbusch, T.A.J.; Wijnhoven, S.W.P.; Haase, A. Nanomaterial exposures for worker, consumer and the general public. NanoImpact 2018, 10, 11–25. [Google Scholar] [CrossRef]
- Kumar, M.K.; Sreekanth, V.; Salmon, M.; Tonne, C.; Marshall, J.D. Use of spatiotemporal characteristics of ambient PM2.5 in rural South India to infer local versus regional contributions. Environ. Pollut. 2018, 239, 803–811. [Google Scholar] [CrossRef]
- Liu, X.; Schnelle-Kreis, J.; Zhang, X.; Bendl, J.; Khedr, M.; Jakobi, G.; Schloter-Hai, B.; Hovorka, J.; Zimmermann, R. Integration of air pollution data collected by mobile measurement to derive a preliminary spatiotemporal air pollution profile from two neighboring German-Czech border villages. Sci. Total Environ. 2020, 722, 137632. [Google Scholar] [CrossRef]
- Zogou, O.; Stamatelos, A. Analysis of data from ambient PM10 concentration monitoring in Volos in the period 2005–2010. Am. J. Environ. Eng. 2012, 2, 97–108. [Google Scholar] [CrossRef]
- Hegde, S.; Min, K.T.; Moore, J.; Lundrigan, P.; Patwari, N.; Collingwood, S.; Balch, A.; Kelly, K.E. Indoor household particulate matter measurements using a network of low-cost sensors. Aerosol Air Qual. Res. 2020, 20, 381–394. [Google Scholar] [CrossRef]
- Chen, R.; Aherrera, A.; Isichei, C.; Olmedo, P.; Jarmul, S.; Cohen, J.E.; Navas-Acien, A.; Rule, A.M. Assessment of indoor air quality at an electronic cigarette (Vaping) convention. J. Expo. Sci. Environ. Epidemiol. 2018, 28, 522–529. [Google Scholar] [CrossRef]
- Kellnerová, E.; Kellner, J.; Navrátil, J.; Paulus, F. Monitoring of indoor ultrafine particulate matter at the fire rescue brigade workplaces. Energy Procedia 2018, 153, 315–319. [Google Scholar] [CrossRef]
- Sousan, S.; Koehler, K.; Thomas, G.; Park, J.H.; Hillman, M.; Peters, T.M. Inter-comparison of low-cost sensors for measuring the mass concentration of occupational aerosols. Aerosol Sci. Technol. 2017, 50, 462–473. [Google Scholar] [CrossRef] [PubMed]
- Firlag, S.; Rogulski, M.; Badyda, A. The influence of marine traffic on Particulate Matter (PM) levels in the region of Danish Straits, North and Baltic Seas. Sustainability 2018, 10, 4231. [Google Scholar] [CrossRef]
- Sharpley, R. Tourism, modernisation and development on the island of Cyprus: Challenges and policy responses. J. Sustain. Tour. 2003, 11, 246–265. [Google Scholar] [CrossRef]
- Thunis, P.; Degraeuwe, B.; Pisoni, E.; Trombetti, M.; Peduzzi, E.; Belis, C.A.; Wilson, J.; Vignati, E. Urban PM2.5 Atlas—Air Quality in European Cities; Publications Office of the European Union: Luxembourg, 2017; ISBN 978-92-79-73876-0. [Google Scholar]
- Achilleos, S.; Evans, J.S.; Yiallouros, P.K.; Kleanthous, S.; Schwartz, J.; Koutrakis, P. PM10 concentration levels at an urban and background site in Cyprus: The impact of urban sources and dust storms. J. Air Waste Manag. Assoc. 2014, 64, 1352–1360. [Google Scholar] [CrossRef] [PubMed]
- Theophilou, M.K.; Serghides, D. Heat island effect for Nicosia, Cyprus. Adv. Build. Energy Res. 2014, 8, 63–73. [Google Scholar] [CrossRef]
- Prevenios, M.; Zeri, C.; Tsangaris, C.; Liubartseva, S.; Fakiris, E.; Papatheodorou, G. Beach litter dynamics on Mediterranean coasts: Distinguishing sources and pathways. Mar. Pollut. Bull. 2018, 129, 448–457. [Google Scholar] [CrossRef]
- Cebe, K.; Balas, L. Monitoring and modeling land-based marine pollution. Reg. Stud. Mar. Sci. 2018, 24, 23–39. [Google Scholar] [CrossRef]
- Farmaki, A. A supply-side evaluation of coastal tourism diversification: The case of Cyprus. Tour. Plan. Dev. 2012, 9, 183–203. [Google Scholar] [CrossRef]
- Kathijotes, N.; Alam, L.; Kontou, A. Aquaculture, coastal pollution and the environment. Aquac. Ecosyst. Adapt. Sustain. 2015, 139–163. [Google Scholar] [CrossRef]
- Beloconi, A.; Chrysoulakis, N.; Lyapustin, A.; Utzinger, J.; Vounatsou, P. Bayesian geostatistical modelling of PM10 and PM2.5 surface level concentrations in Europe using high-resolution satellite-derived products. Environ. Int. 2018, 121, 57–70. [Google Scholar] [CrossRef] [PubMed]
- Martuzevicius, D.; Prasauskas, T.; Setyan, A.; O’Connell, G.; Cahours, X.; Julien, R.; Colard, S. Characterization of the spatial and temporal dispersion differences between exhaled E-Cigarette mist and cigarette smoke. Nicotine Tob. Res. 2019, 21, 1371–1377. [Google Scholar] [CrossRef] [PubMed]
- Google Maps. Cyprus, Limassol. Available online: https://www.google.com/maps (accessed on 30 November 2020).
- Oguntoke, O.; Awanu, A.E.; Annegarn, H.J. Impact of cement factory operations on air quality and human health in Ewekoro local government area, South-Western Nigeria. Int. J. Environ. Stud. 2012, 69, 934–945. [Google Scholar] [CrossRef]
- Adeyanju, E.; Okeke, C.A. Exposure effect to cement dust pollution: A mini review. SN Appl. Sci. 2019, 1, 1–17. [Google Scholar] [CrossRef]
- Rovira, J.; Sierra, J.; Nadal, M.; Schuhmacher, M.; Domingo, J.L. Main components of PM10 in an area influenced by a cement plant in Catalonia, Spain: Seasonal and daily variations. Environ. Res. 2018, 165, 201–209. [Google Scholar] [CrossRef]
- Lee, S.Y. Emissions from Street Vendor Cooking Devices (Charcoal Grilling); ARCADIS Geraghty and Miller: Amsterdam, The Netherlands, 1999; pp. 6–9. [Google Scholar]
- Song, Y.; Sun, L.; Wang, X.; Zhang, Y.; Wang, H.; Li, R.; Xue, L.; Chen, J.; Wang, W. Pollution characteristics of particulate matters emitted from outdoor barbecue cooking in urban Jinan in eastern China. Front. Environ. Sci. Eng. 2018, 12, 1–8. [Google Scholar] [CrossRef]
- Shao, L.; Hou, C.; Geng, C.; Liu, J.; Hu, Y.; Wang, J.; Jones, T.; Zhao, C.; BéruBé, K. The oxidative potential of PM10 from coal, briquettes and wood charcoal burnt in an experimental domestic stove. Atmos. Environ. 2016, 127, 372–381. [Google Scholar] [CrossRef]
- Abdullahi, K.L.; Delgado-Saborit, J.M.; Harrison, R.M. Emissions and indoor concentrations of particulate matter and its specific chemical components from cooking: A review. Atmos. Environ. 2013, 71, 260–294. [Google Scholar] [CrossRef]
- Singh, A.; Spak, S.N.; Stone, E.A.; Downard, J.; Bullard, R.L.; Pooley, M.; Kostle, P.A.; Mainprize, M.W.; Wichman, M.D.; Peters, T.M.; et al. Uncontrolled combustion of shredded tires in a landfill—Part 2: Population exposure, public health response, and an air quality index for urban fires. Atmos. Environ. 2015, 104, 273–283. [Google Scholar] [CrossRef]
- Downard, J.; Singh, A.; Bullard, R.; Jayarathne, T.; Rathnayake, C.M.; Simmons, D.L.; Wels, B.R.; Spak, S.N.; Peters, T.; Beardsley, D.; et al. Uncontrolled combustion of shredded tires in a landfill—Part 1: Characterization of gaseous and particulate emissions. Atmos. Environ. 2015, 104, 195–204. [Google Scholar] [CrossRef]
- Lemieux, P.M.; Lutes, C.C.; Santoianni, D.A. Emissions of organic air toxics from open burning: A comprehensive review. Prog. Energy Combust. Sci. 2004, 30, 1–32. [Google Scholar] [CrossRef]
- Jimoda, L.A.; Sulaymon, I.D.; Alade, A.O.; Adebayo, G.A. Assessment of environmental impact of open burning of scrap tyres on ambient air quality. Int. J. Environ. Sci. Technol. 2018, 15, 1323–1330. [Google Scholar] [CrossRef]
- Ziadat, A.H.; Sood, E. An environmental impact assessment of the open burning of scrap tires. J. Appl. Sci. 2014, 14, 2695–2703. [Google Scholar] [CrossRef]
- Li, Z.; Che, W.; Lau, A.K.H.; Fung, J.C.H.; Lin, C.; Lu, X. A feasible experimental framework for field calibration of portable light-scattering aerosol monitors: Case of TSI DustTrak. Environ. Pollut. 2019, 255, 113136. [Google Scholar] [CrossRef] [PubMed]
- Asbach, C.; Kaminski, H.; Von Barany, D.; Kuhlbusch, T.A.J.; Monz, C.; Dziurowitz, N.; Pelzer, J.; Vossen, K.; Berlin, K.; Dietrich, S.; et al. Comparability of portable nanoparticle exposure monitors. Ann. Occup. Hyg. 2012, 56, 606–621. [Google Scholar] [CrossRef] [PubMed]
- Nkhama, E.; Ndhlovu, M.; Timothy Dvonch, J.; Lynam, M.; Mentz, G.; Siziya, S.; Voyi, K. Effects of airborne particulate matter on respiratory health in a community near a cement factory in Chilanga, Zambia: Results from a panel study. Int. J. Environ. Res. Public Health 2017, 14, 1351. [Google Scholar] [CrossRef]
- Abu-Allaban, M.; Abu-Qdais, H. Impact assessment of ambient air quality by cement industry: A case study in Jordan. Aerosol Air Qual. Res. 2011, 11, 802–810. [Google Scholar] [CrossRef]
- Gupta, R.K.; Majumdar, D.; Trivedi, J.V.; Bhanarkar, A.D. Particulate matter and elemental emissions from a cement kiln. Fuel Process. Technol. 2012, 104, 343–351. [Google Scholar] [CrossRef]
- Sánchez-Soberón, F.; Rovira, J.; Mari, M.; Sierra, J.; Nadal, M.; Domingo, J.L.; Schuhmacher, M. Main components and human health risks assessment of PM10, PM2.5, and PM1 in two areas influenced by cement plants. Atmos. Environ. 2015, 120, 109–116. [Google Scholar] [CrossRef]
- Achilleos, S.; Wolfson, J.M.; Ferguson, S.T.; Kang, C.M.; Hadjimitsis, D.G.; Hadjicharalambous, M.; Achilleos, C.; Christodoulou, A.; Nisanzti, A.; Papoutsa, C.; et al. Spatial variability of fine and coarse particle composition and sources in Cyprus. Atmos. Res. 2016, 169, 255–270. [Google Scholar] [CrossRef]
- Falchi, F. Light pollution. Urban Pollut. Sci. Manag. 2018, 147–159. [Google Scholar] [CrossRef]
- Titos, G.; Ealo, M.; Pandolfi, M.; Pérez, N.; Sola, Y.; Sicard, M.; Comerón, A.; Querol, X.; Alastuey, A. Spatiotemporal evolution of a severe winter dust event in the western Mediterranean: Aerosol optical and physical properties. J. Geophys. Res. 2017, 122, 4052–4069. [Google Scholar] [CrossRef]
- Liora, N.; Poupkou, A.; Giannaros, T.M.; Kakosimos, K.E.; Stein, O.; Melas, D. Impacts of natural emission sources on particle pollution levels in Europe. Atmos. Environ. 2016, 137, 171–185. [Google Scholar] [CrossRef]
- Sarigiannis, D.; Handakas, E.; Gotti, A.; Manousakas, M. Monitoring of air pollution levels related to Charilaos Trikoupis Brige. Sci. Total Environ. 2017, 609, 1451–1463. [Google Scholar] [CrossRef]
- Sarti, G.; Rossi, V.; Amorosi, A.; Luka, S. Magdala harbour sedimentation (Sea of Galilee, Israel), from natural to anthropogenic control. Quat. Int. 2013, 303, 120–131. [Google Scholar] [CrossRef]
- Garcia, C.; Servera, J. Impacts of tourism development on water demand and beach degradation on the island of Mallorca (Spain). Geogr. Ann. Ser. A Phys. Geogr. 2003, 85, 287–300. [Google Scholar] [CrossRef]
- Zorpas, A.A.; Skouroupatis, A. Indoor air quality evaluation of two museums in a subtropical climate conditions. Sustain. Cities Soc. 2016, 20, 52–60. [Google Scholar] [CrossRef]
- Zorpas, A.A.; Voukkali, I.; Navarro Pedreño, J. Tourist area metabolism and its potential to change through a proposed strategic plan in the framework of sustainable development. J. Clean. Prod. 2018, 172, 3609–3620. [Google Scholar] [CrossRef]
- Sindosi, O.A.; Katsoulis, B.D.; Bartzokas, A. An objective definition of air mass types affecting Athens, Greece; The corresponding atmospheric pressure patterns and air pollution levels. Environ. Technol. 2003, 24, 947–962. [Google Scholar] [CrossRef]
- Kushta, J.; Georgiou, G.K.; Proestos, Y.; Christoudias, T.; Lelieveld, J. Modelling study of the atmospheric composition over Cyprus. Atmos. Pollut. Res. 2018, 9, 257–269. [Google Scholar] [CrossRef]
- Heaviside, C.; Tsangari, H.; Paschalidou, A.; Vardoulakis, S.; Kassomenos, P.; Georgiou, K.E.; Yamasaki, E.N. Heat-related mortality in Cyprus for current and future climate scenarios. Sci. Total Environ. 2016, 569–570, 627–633. [Google Scholar] [CrossRef] [PubMed]


Publisher’s Note: MDPI stays neutral with regard to jurisdictional claims in published maps and institutional affiliations. |
© 2020 by the authors. Licensee MDPI, Basel, Switzerland. This article is an open access article distributed under the terms and conditions of the Creative Commons Attribution (CC BY) license (http://creativecommons.org/licenses/by/4.0/).