Article

Optimizing Land Use Allocation of Transit-Oriented Development (TOD) to Generate Maximum Ridership

by
Mohammed Ali Berawi
1,
Gunawan Saroji
2,*,
Fuad Adrian Iskandar
2,
Bernard Elpetino Ibrahim
2,
Perdana Miraj
3 and
Mustika Sari
2
1
Department of Civil Engineering, Faculty of Engineering, Universitas Indonesia 16424, Indonesia
2
Center for Sustainable Infrastructure Development, Universitas Indonesia 16424, Indonesia
3
Department of Civil Engineering, Faculty of Engineering, Pancasila University, DKI Jakarta 12640, Indonesia
*
Author to whom correspondence should be addressed.
Sustainability 2020, 12(9), 3798; https://doi.org/10.3390/su12093798
Submission received: 25 March 2020 / Revised: 23 April 2020 / Accepted: 30 April 2020 / Published: 7 May 2020

Abstract

:
Transit-oriented development (TOD) is based around transit stations, with the emphasis on high population density and multifunctional areas in promoting sustainable mobility. This study aimed to develop a TOD model that could achieve an optimum land use allocation to maximize transit ridership. A critical literature review, an analysis of value engineering through function and benchmarking studies were conducted in order to develop a baseline plan for a TOD model, which was then optimized using linear programming. A total of four light rail transit (LRT) stations located in Jakarta were used as the case study to represent model implementation, ridership evaluation and optimal design. The optimization results showed that office workers constituted the highest number of transit passengers, followed by those working in hotels and commercial/retail and residential users. It was also found that optimizing the design of the TOD can increase the number of daily LRT passengers by up to 55%.

1. Introduction

The provision of train-based mass transportation systems, also known as transit systems, is an effective way to tackle the challenges faced by cities such as traffic jams, air pollution, greenhouse gas emissions and other social problems which straightforwardly affect the quality of city life [1], as it alters the use of private vehicles [2,3]. Furthermore, those problems are intensified by the absence of land use integration and effective transportation systems [4].
Transit is an important means for improving the regional economy by providing affordable access to employment, education and health, especially for those coming from low-income homes unable to afford private transportation [5]. Nowadays, the governments of many countries in the world have made a significant investment in urban transit infrastructures such as metrorail, mass rapid transit (MRT), light rail transit (LRT) and bus rapid transit (BRT) [6]. Likewise, the Indonesian government has also prepared the development of the LRT system in Jakarta in order to alleviate its traffic congestion issues that keep worsening as the population grows.
However, the development of the mass transportation system needs huge investment, which turns out to be one of the challenges for the government, i.e., meeting the project funding demand involving the initial, operational and maintenance costs. According to Zhang and Xue [7], almost all of the operating companies of transit services in the world still depend on the subsidies provided by the government for the system operation and maintenance. The MTR Corporation that manages train transit in Hong Kong only receives 34% annually of its total income from its operations [1], which means that the income generated from the ticket sales cannot cover the total project investment. However, since the urban rail system can capture a large share of the overall public transport market [8], optimizing high rail transit ridership can increase the operating income from farebox revenue.
There are numerous factors related to the rail transit farebox revenue. A key problem-causing factor is the interaction between the transit infrastructure and its surrounding area. Bertolini introduced this notion through the node-place model [9], in which an area with land use diversity and population density can attract people to use the transit more often [10]. Transit-oriented development (TOD) as a built environment intervention is believed to be able to accommodate such interaction [3].
TOD in Hong Kong through the Rail Plus Property (R+P) program has increased the feasibility of transit projects. This is seen from the continuous rise in the number of passengers and the increase in property prices [11]. The concept of TOD has been implemented in many countries, but it is relatively new in Indonesia. However, it has started to gain popularity recently by the construction of the light rail transit (LRT) and mass rapid transit (MRT) in Jakarta, as well as its adoption as a strategy to improve project feasibility through real estate development.
Several studies have focused on TOD planning in regard to the increase of transit ridership. Li et al. [12] established the decision tree approach to forecast the number of boarding and alighting passengers based on land use acreage inputs in Chongqing, China. The correlation between the percentage of land use in areas within a 500-m radius around rail stations and diurnal rail ridership patterns in the Seoul Capital Area using the ridership-based station clustering approach has been investigated by Kim et al. [13]. In addition, Suzuki et al. [1] discussed several successful TOD cases with regard to the rail ridership in Japan, Hong Kong and China. Cervero and Murakami [11], in their analysis of Hong Kong’s rail and property development model, investigated its performance in increasing rail transit ridership. The allocation of different land arranged through increased ridership was studied by Ma et al. [2,10] and Li et al. [2,10] using a genetic algorithm to generate non-dominated alternatives of land use in a station located in China, while Lin and Li [14] utilized the grey linear programming technique for regional transit-oriented development planning. Lin and Gau [15] conducted model development to obtain alternatives to the optimum floor area ratio (FAR) as input into the policymaking process regarding the use of TOD in Taiwan. However, these studies focused only on station area-level planning, not on parcel-level, which deals with the gross floor area of land use development as its decision variable.
Linear programming has been extensively used to resolve planning and other land management problems [16,17]. Winokur et al. [18] employed it to obtain a land development strategic plan for a real estate development project by maximizing the expected present value of its future cash flows. Linear and nonlinear programming optimizations have also been utilized to determine the best strategy in a mixed-use development value [16,17]. Both studies aimed to determine the optimal area for each property type to maximize the income of the development as the highest and with the best use. However, neither was in the TOD context.
This paper intended to fill the gap of previous research by offering a linear programming-based optimization model of land use allocation at the parcel-level of rail-based TOD to maximize rail transit ridership. As mixed-use development is the main characteristic of TOD, its planning should involve several different property developments to be built in the area around the transit. Therefore, a mixed-used development in the TOD context means that it is not only a practice of residential land use development but also the provision of complementary public uses, jobs, retail and services [19].
This research is a typical choice task of a linear programming problem, aimed at obtaining an optimum gross floor area (GFA) for each property development as an alternative approach to transit operation and property development planning in order to achieve the maximum rate of passenger trips. Therefore, the explorations that will be done in this research include developing the baseline model for the development of the TOD ridership mode and finding out how mixed-use TOD optimally raises ridership by maximizing its rate.

2. Literature Study

2.1. The Concept of TOD

TOD is a developed area that focuses on transit as its basic principle, the development of which is expected to fulfill the purpose of sustainability both in transport and urban planning [8]. It occupies a dense area with multifunctional strategies concentrating on the availability of mass transportation. TOD planning does not have a definitive or particular area [20]. Calthorpe and Fulton [21] defined TOD as a mixed-use, compact and workable system that fits with mass-transit stations or centers developed to support and encourage public transport usage (transit), thus promoting sustainable mobility concerning the environment aspect by reducing traffic congestion, fuel consumption, pollution, greenhouse gas (GHG) emissions and other urban effects [22,23], as well as the financial aspect by bringing in more fare-paying passengers and increasing the land value around the transit [10,19], and also the social aspect by revitalizing the neighborhood and improving access to basic needs such as work, education and health [24,25].There are certain principles also included in the design of TOD, such as a retail shop, residential, employment, park and civilian uses within a walking distance of about 2000 feet or 10 min of transit stops, creating a pedestrian-friendly road network that directly connects local destinations, providing a mixture of housing types, densities and costs, encouraging development and redevelopment along existing transit corridors in the environment [26,27].
Cervero and Kockelman [28] divided the built environment into three main criteria, known as the ‘3D’ (density, diversity, and design), that affect transportation patterns. However, developing an area with density, land use diversity and a pedestrian-oriented design generally reduces trip rates and encourages non-auto travel in statistically significant ways. Ewing and Cervero [29] further divided these criteria into five by adding the destination accessibility and the distance to transit, thus becoming ‘5D’.
Many definitions consider TOD as a concept applied in areas with high multi-functionalities, including residential areas [30,31], retail areas [30], offices [32,33], hotels [30,34] and public facilities [35]. Wey et al. [20] arranged the focus of TOD by correlating it with sustainable development, which is known as sustainable transportation. It is divided into three purposes, namely economic efficiency, sustainable environment and social justice [36]. Even though this technique has a clear concept, its implementation should consider the specific conditions of the area involved.
Occasionally, land use development has worked in line with the transit system, yet they failed to connect morphologically. Therefore, the term ‘’oriented’’ only meant ‘’adjacent’’ (Transit Adjacent Development/TAD) [37]. Similarly, Li et al. [38] proposed an additional parameter, a ‘tie,’ in the node-place model, which became the node-tie-place. This made the identification of TOD clearer, as shown in the model displayed in Figure 1. Easy access to public facilities and commercial buildings along the road (to the station) would encourage people to utilize transit more often [38]. A robust model is capable of optimizing the tie bond between the land use and the transit needed to maximize TOD planning.
TOD can make a contribution towards the achievement of sustainable development goals (SDGs) with the improved connectivity and mobility to increase employment opportunities in order to escape poverty and end food hunger (SDG 1 and SDG 2), and increase access to education and health services (SDG 3 and SDG 4) as well [39]. Rail transit, one of the key elements in TOD, can reduce private vehicle dependence hence improving energy efficiency in transportation (SDG 7) and reducing the impacts of pollution and GHG emissions on the climate (SDG 13) [40]. Moreover, the increased mobility offered by TOD is also crucial to the achievement of sustainable cities (SDG 11) [41,42]. Furthermore, TOD is also a solution to achieve the New Urban Agenda (NUA), which emphasizes the need for well integrated transport-land-use planning to reduce travel and transport needs and enhance connectivity between areas in cities and its surroundings [43]. However, to achieve those goals, TOD planning should consider the density and the diversifying land uses so that those sustainable goals can be achieved [44].
This paper investigated three TOD properties as the benchmark, which were selected due to their relative success in implementing Cervero’s ‘D variables’ in each development, as well as their different development scales and data availability. The first was Union Square, a 13.54-hectare mixed-use development with an integrated transit station in the Kowloon area of Hong Kong. Namba Parks, located adjacent to Sekai Station in Osaka, Japan, which comprises 3.37 hectares of shopping arcades and other amenities, was the second. The third one was D’Cube City in Seoul, South Korea, that comprises a 6.36-hectare complex of amenities with direct access to Shindorim Station.

2.2. TOD Ridership

Ridership is the number of people who use the transit service, hence increasing ridership tends to also increase the transit income. There are several particular reasons why people are more interested in using transit instead of private means of transportation, such as the cost affordability [45], time and service reliability [46] and accessibility [47]. However, accessibility is considered as one of the key attributes affecting transit ridership rate since it is the main feature of TOD principles. It shows how accessible a particular area is from one station to another [48]. TOD can be used to maximize accessibility and people’s mobility from one place to another [22]. Effective implementation should include a feature whereby certain areas such as residences, offices and health services are easily accessed. Knowles [32] depicted TOD as beads connected by yarn. The beads represent the area, while the yarn depicts the transit rail service connecting the areas.
In the Minneapolis–St. Paul Metropolitan region, TOD development has reduced vehicle trips per capita by 1% to 3%, depending on the level of transit service available [27]. The development of TOD shows a more efficient pattern, with its efficiency achieved by shortening the trip duration in the area, increasing the number of pedestrians and the transit-trip rate. TOD makes a good balance of space for offices and residences. It also increases the chances for people to go walking and cycling, creating adequate density for a high level of transit service. According to Bardaka and Hersey [5], it can be seen from travel behavior that 63% of employees living in low-income housing units (in a TOD area) take transit compared to 20% in market-rate housing units. A study of Prince George’s County, Maryland (USA), showed that TOD planning would not result in any significant increase in transit ridership, assuming that the area was quite transit-oriented, only making a slight change from 19.2% to 19.6% [22].
Another study of Orenco Station, a transit-oriented development (TOD) in the Portland region, and Station Park, a transit-adjacent development (TAD) in the Salt Lake City region, showed a significant difference of the mode share of TOD, which was 45.8% walk and 16.0% rail higher than the TAD (3.6% walk and 4.1% rail). This shows that the adjacent rail station appeared to have little effect on the performance of the TAD, but a substantial effect on the performance of the TOD. This situation was caused by regional travel models which are capable of capturing some of the effects of transit service on travel demand at a particular site, but not the full effects of the D variables comprising density, land use diversity, street design, destination accessibility and distance to transit for a particular TOD [49].

2.3. Function Analysis System Technique (FAST)

Value engineering (VE) is a problem-solving technique with a multidisciplinary approach that systematically analyzes and improves the function, cost, value of a product, design, system, or the service by combining knowledge from different backgrounds organized in a team [50]. It has been widely applied in the practice of many fields such as engineering manufacturing, construction, communication, urban and transportation, due to its remarkable benefits [51].
The primary component in value engineering is the function, and it is both the basis and the catalyst of an innovative solution. The function is categorized into the primary and secondary function, in which the basic primary function is a reason for the creation of a system and the basis for the existence of a product, while the secondary function is the support for the basic functions [52]. The compilation of functions confirms the analysis of the objective functions that may or may not be needed and expands idea creation [53].
The logic diagram from the functions of an item, subsystem or facility is illustrated through the graphics generated in a tool known as the FAST diagram. There are four types of FAST diagrams that can be used to test the reliability of the identified functions [54,55], which include the classical FAST model, hierarchy function model, technical FAST model and the customer-oriented FAST model. The classical FAST model illustrated the interrelationship between the function in “HOW-WHY” logic used to identify, classify, develop and select the functions that could create higher value and benefit to the project development, while the hierarchy function model used hierarchical graphic vertically listed functions. Moreover, the technical FAST model is the classical fast model that adds an “all the time” function, “one-time” function, and a “same time” function or “caused by” function in the diagram. On the other hand, the customer-oriented FAST model is developed to reflect the customer as the one determining the value in the process of function analysis.

3. Methodology

This research adopted two stages of an approach by taking qualitative and quantitative methods into account to get the two research objectives answered, which included: (1) developing the baseline model for the TOD ridership mode; and (2) finding out how mixed-use TOD will optimally increase the transit ridership. To achieve the first objective, the function and basic proportion of the mixed land use were determined by analyzing the TOD functions, benchmarking to the TOD models through the literature study, and collecting the data of the existing TOD development plans proposed by the developer. As to attain the second objective, a linear programming (LP) approach and a comparative analysis were carried out. The workflow of the research is shown in Figure 2.

3.1. TOD Function Analysis

Function analysis, which is considered as the main process of value engineering [56,57], was used to obtain a full depiction of the TOD functions and benefits. The development of a model describing the relationship of functions in a project is important in facilitating the understanding of their correctness and analyzing the level of functions applied to obtain greater improvement [58]. Considering the benefits of using this technique in terms of functional improvement and quality enhancement, function analysis was therefore done in this study to help understand the functions of major TOD elements in order to come up with a broader consideration of alternative activities to achieve the functions. A FAST diagram that was produced during the function analysis, depicting a logic diagram from the functions of the item, subsystems, or facilities illustrated through graphics in order to test the reliability of the identified function [55,59], was also used in this study to represent the results. By using the FAST diagram that expressed verb-noun functions describing the complex TOD elements, important information regarding functions can be obtained by answering questions of how, why and when the functions should be performed.
To achieve the best practice, a benchmarking process to some relevant studies was conducted. The sources used to develop the benchmark model include journal papers, reports, websites and articles [60]. Three urban developments were utilized as the guideline, namely Union Square in Hong Kong, Namba Parks in Osaka, Japan, and D’Cube City in Seoul, South Korea [61]. The variables used in the benchmarking process were the characteristics of TOD formed by the five main criteria of the built environment that included density, diversity, design, destination accessibility and distance to transit [29], the details can be seen in Table 1 below.
The first initiation of TOD projects in Indonesia was proposed for the Jakarta LRT, the routes of which will service across Jakarta and its satellite cities such as Bogor, Depok and Bekasi. The development of these TOD projects refers to the government regulations outlined in the Jakarta 2030 Regional Spatial Plan and the regulations of Bekasi city planning office. The data of the design of these TOD projects were from the feasibility study document collected from the developer of the Jakarta LRT. The available existing design plans obtained from the shared documents and discussion meetings that were used in this study included four (Jaticempaka, Ciracas, Cibubur, Bekasi Timur) ongoing LRT station areas (see Figure 3). The collection process of the data and the feasibility study documents was conducted simultaneously with the benchmarking process, resulting in benchmark TOD and existing TOD plan models. However, benchmark TOD would become the basis for the ridership model.

3.2. Linear Programming

Linear programming (LP), as a form of mathematical programming with all its functions, i.e., the objective function and constraints in a system, was conducted [63]. Mathematical programming addressed the optimization problems concerned with the allocation of competing for needs (i.e., floor area uses) in a valuable resource (e.g., a land parcel or a site) to achieve an objective (i.e., to maximize ridership) [16]. Transit ridership in a station was modeled as a linear equation involving gross floor area and transit trip generation rate per unit area of each use [15]. Therefore, LP was a suitable technique for solving this problem.
To develop the model, three components of the LP framework, i.e., the objective function, decision variables and the constraints, must be determined. As mentioned above, the quantification of the objective, for instance, maximizing ridership, as a function of the decision variables (floor area use), was adapted from the model developed by Lin and Gau [15]. This was used to define the types of issues facing the model. The type of use was determined by the results from the best TOD benchmarking process initially conducted to achieve the first objective of the study. Considering the limited availability of studies regarding the transit trip generation rate of specific types of TOD users, the decision variables were defined in four categories, namely [38,64]: residential (x1), office (x2), hotel (x3) and retail/commercial (x4). Therefore, the objective function of the problem is modeled as:
Maximize   Z   =   T 1 x 1 +   T 2 x 2 +   T 3 x 3 +   T 4 x 4
where Z is the level of transit ridership used as the objective variable, while T1, T2, T3, and T4 are the transit trip generation rates of residential, office, retail and commercial and hotel, respectively. Furthermore, x1, x2, x3, and x4 are the decision variables of floor areas, while the minimum and maximum widths of the floor allowed in the location of the study are the constraints that depend on the GFA.
x 1 +   x 2 +   x 3 +   x 4     GFA   maximum
x 1 +   x 2 +   x 3 +   x 4     GFA   minimum
The model of the existing, benchmarked and optimized TOD developments were validated by measuring its ridership. This was followed by a depiction comparing the three models.

4. Result and Discussion

4.1. Benchmark TOD Models

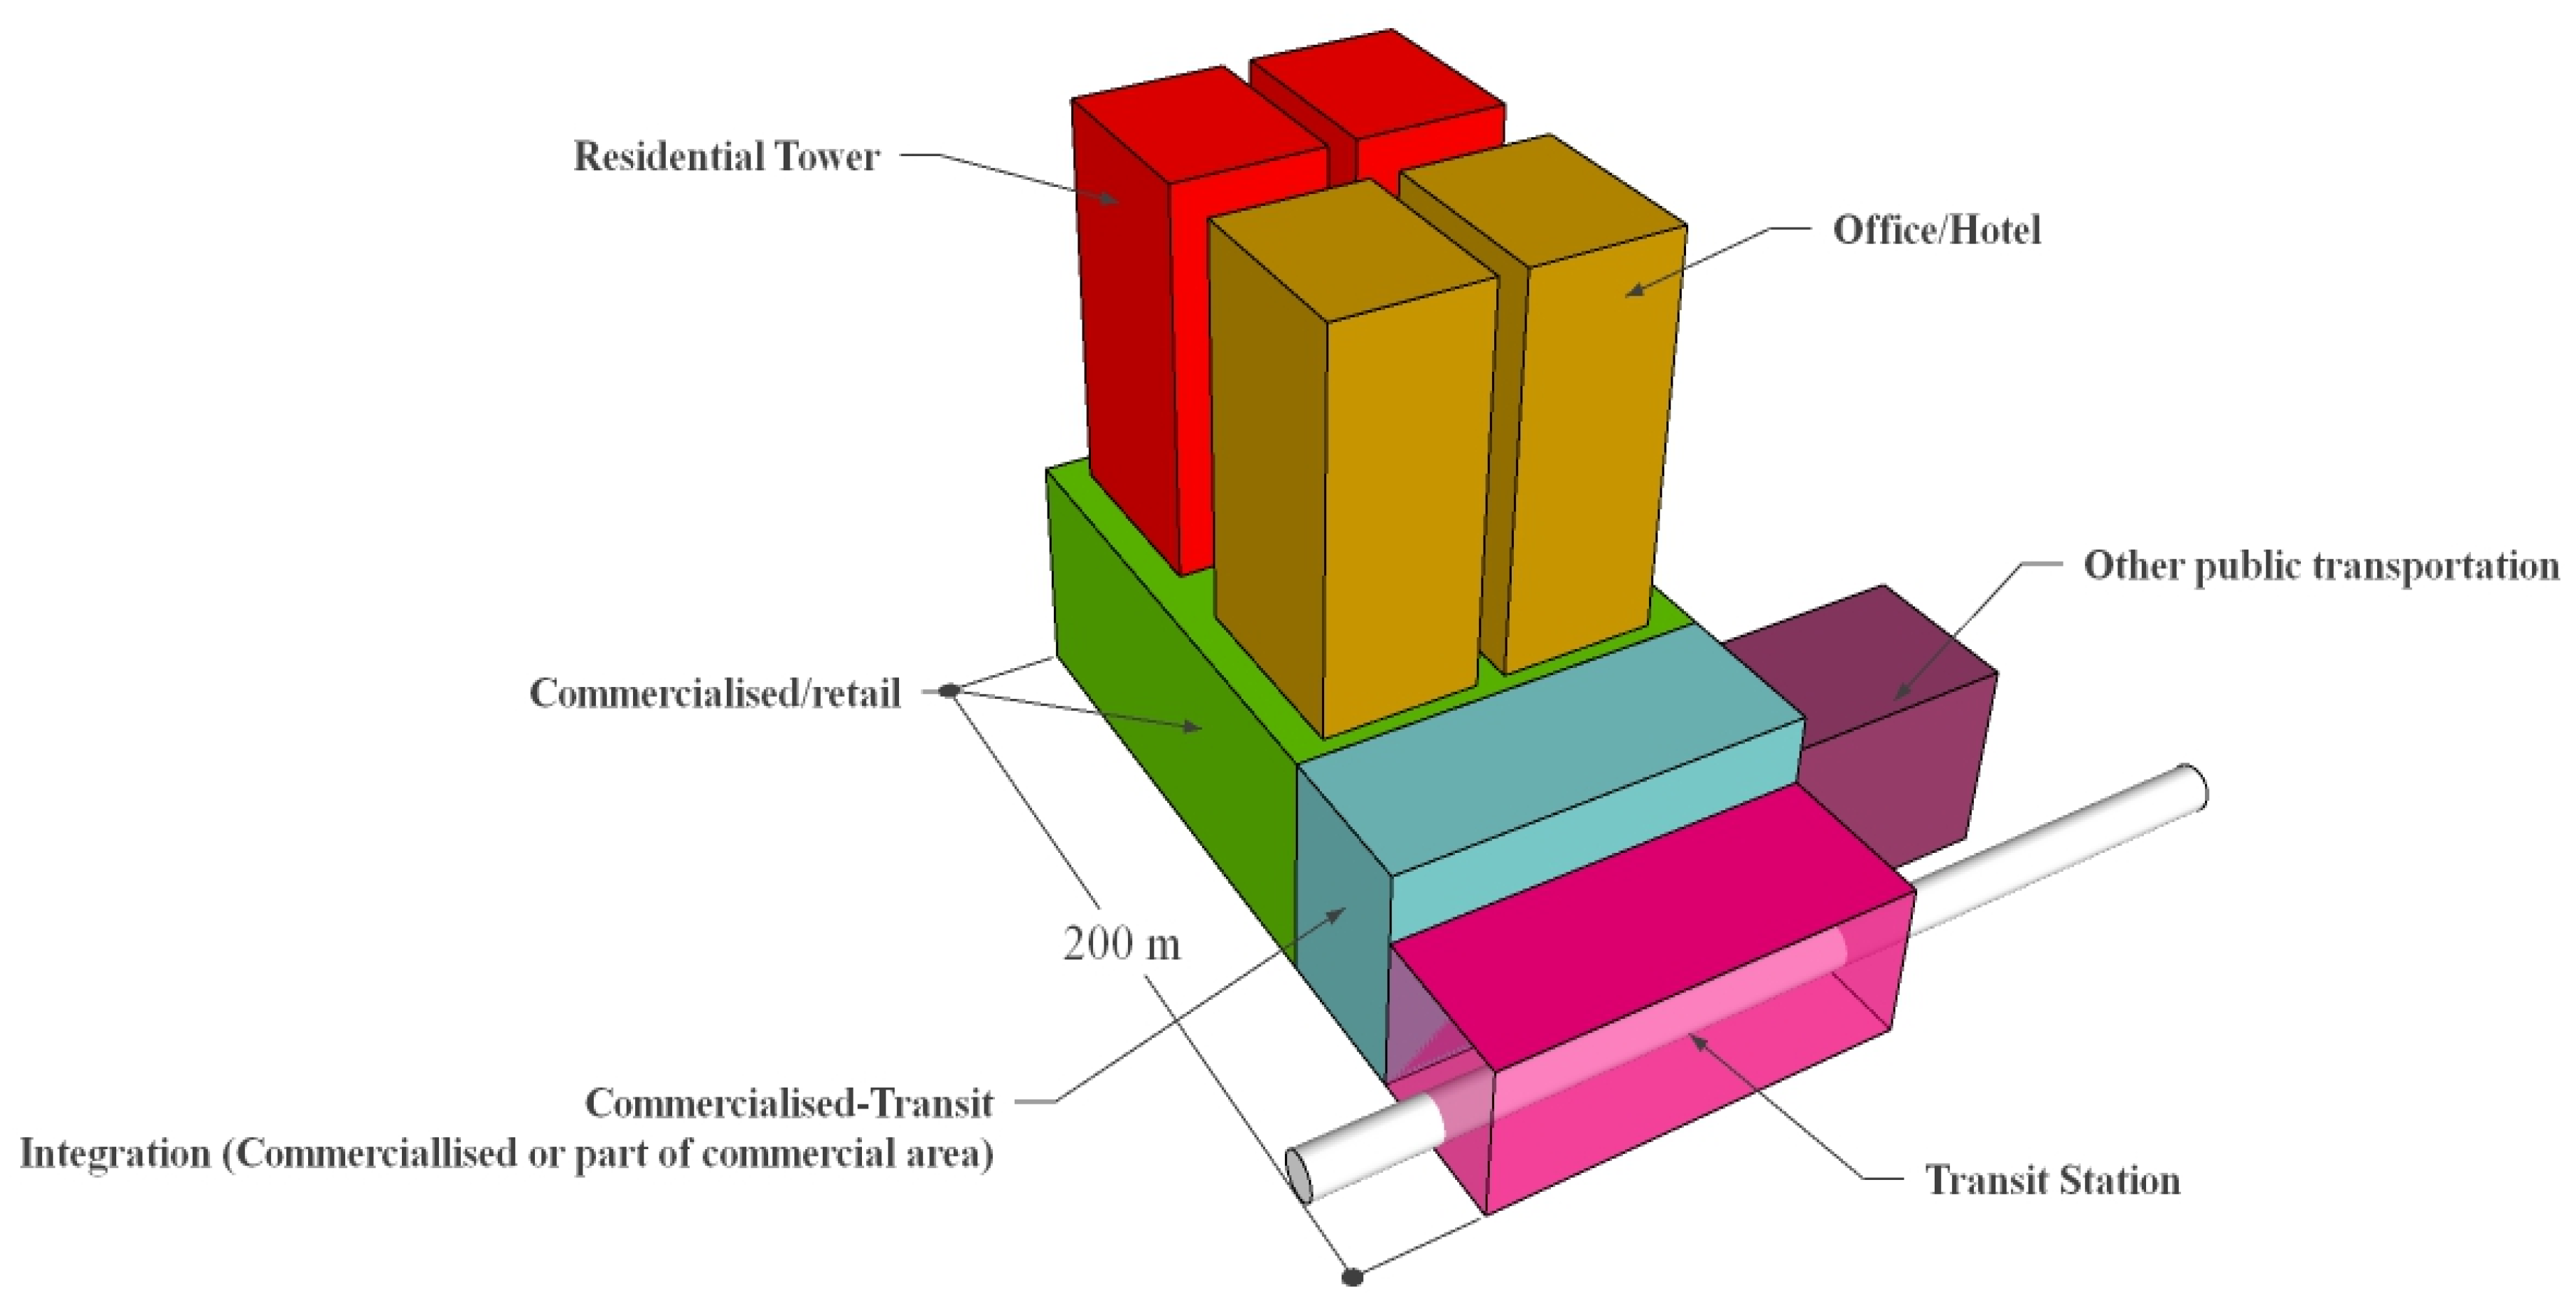
The guidelines in this benchmarking process consisted of TOD developments in three countries, which included Union Square in the Kowloon area of Hong Kong, Namba Parks near Sekai Station in Osaka, Japan and D’Cube City in Seoul, South Korea. Regarding the design and destination accessibility, Union Square seemed to be developed with the most efficient integration in which the residential, office and other buildings sat on the top of the commercial podium that houses the Kowloon station; besides, its multifunction areas located at the distance of approximately 200 m from the transit station encourage dwellers to walk in as easy and comfortable access is provided. Namba Parks, which was connected to the transit station through direct pedestrian access, was planned as an attraction so that people could visit and wander around the TOD and its signature natural terraced pedestrian-oriented design as a tourist destination. The visitors from outside the neighborhood were anticipated with the hotel built in the TOD. Moreover, since it is confined within a 400-m radius from a transit station, Namba Parks also allows pedestrians to walk through the buildings that make the distance to transit closer. On the other hand, D’Cube City was designed to be a live, work, play and stay destination in Seoul with a vibrant pedestrian-oriented district and direct access to the Shindorim Station, expected to attract tourists with all the public services within walking distance.
The benchmark model considers three square area metrics consisting of the building coverage ratio (BCR), floor aspect ratio (FAR) and the proportion of floor areas. Although the literature showed that other variables existed to create the TOD model (number of workers, property sales, employment ratio or economic landscape) [65,66], square area metrics was believed to be the core measurement to expose the TOD density and to evaluate the property and transit relationship. These three square area metrics were determined using properties mean values from existing the TODs in Union Square, Namba Parks, and D’Cube City [61] in order to make a comparison with the existing TOD plans in Indonesia.
The land use mix found in the benchmarking model was residential areas, offices, commercial/retail areas and hotels. This finding confirmed the TOD planning that has been conducted in Denver, United States, where most land use mix may consist of but not be limited to office, residential, retail, entertainment and civic uses depending on their typology [67]. The composition of land use allocation at each location is shown in Table 2, with the range being the minimum and maximum percentage floor area usage. The benchmark model has a BCR of 92% and a FAR of 7.29, with the floor area usage summarized in Figure 4.
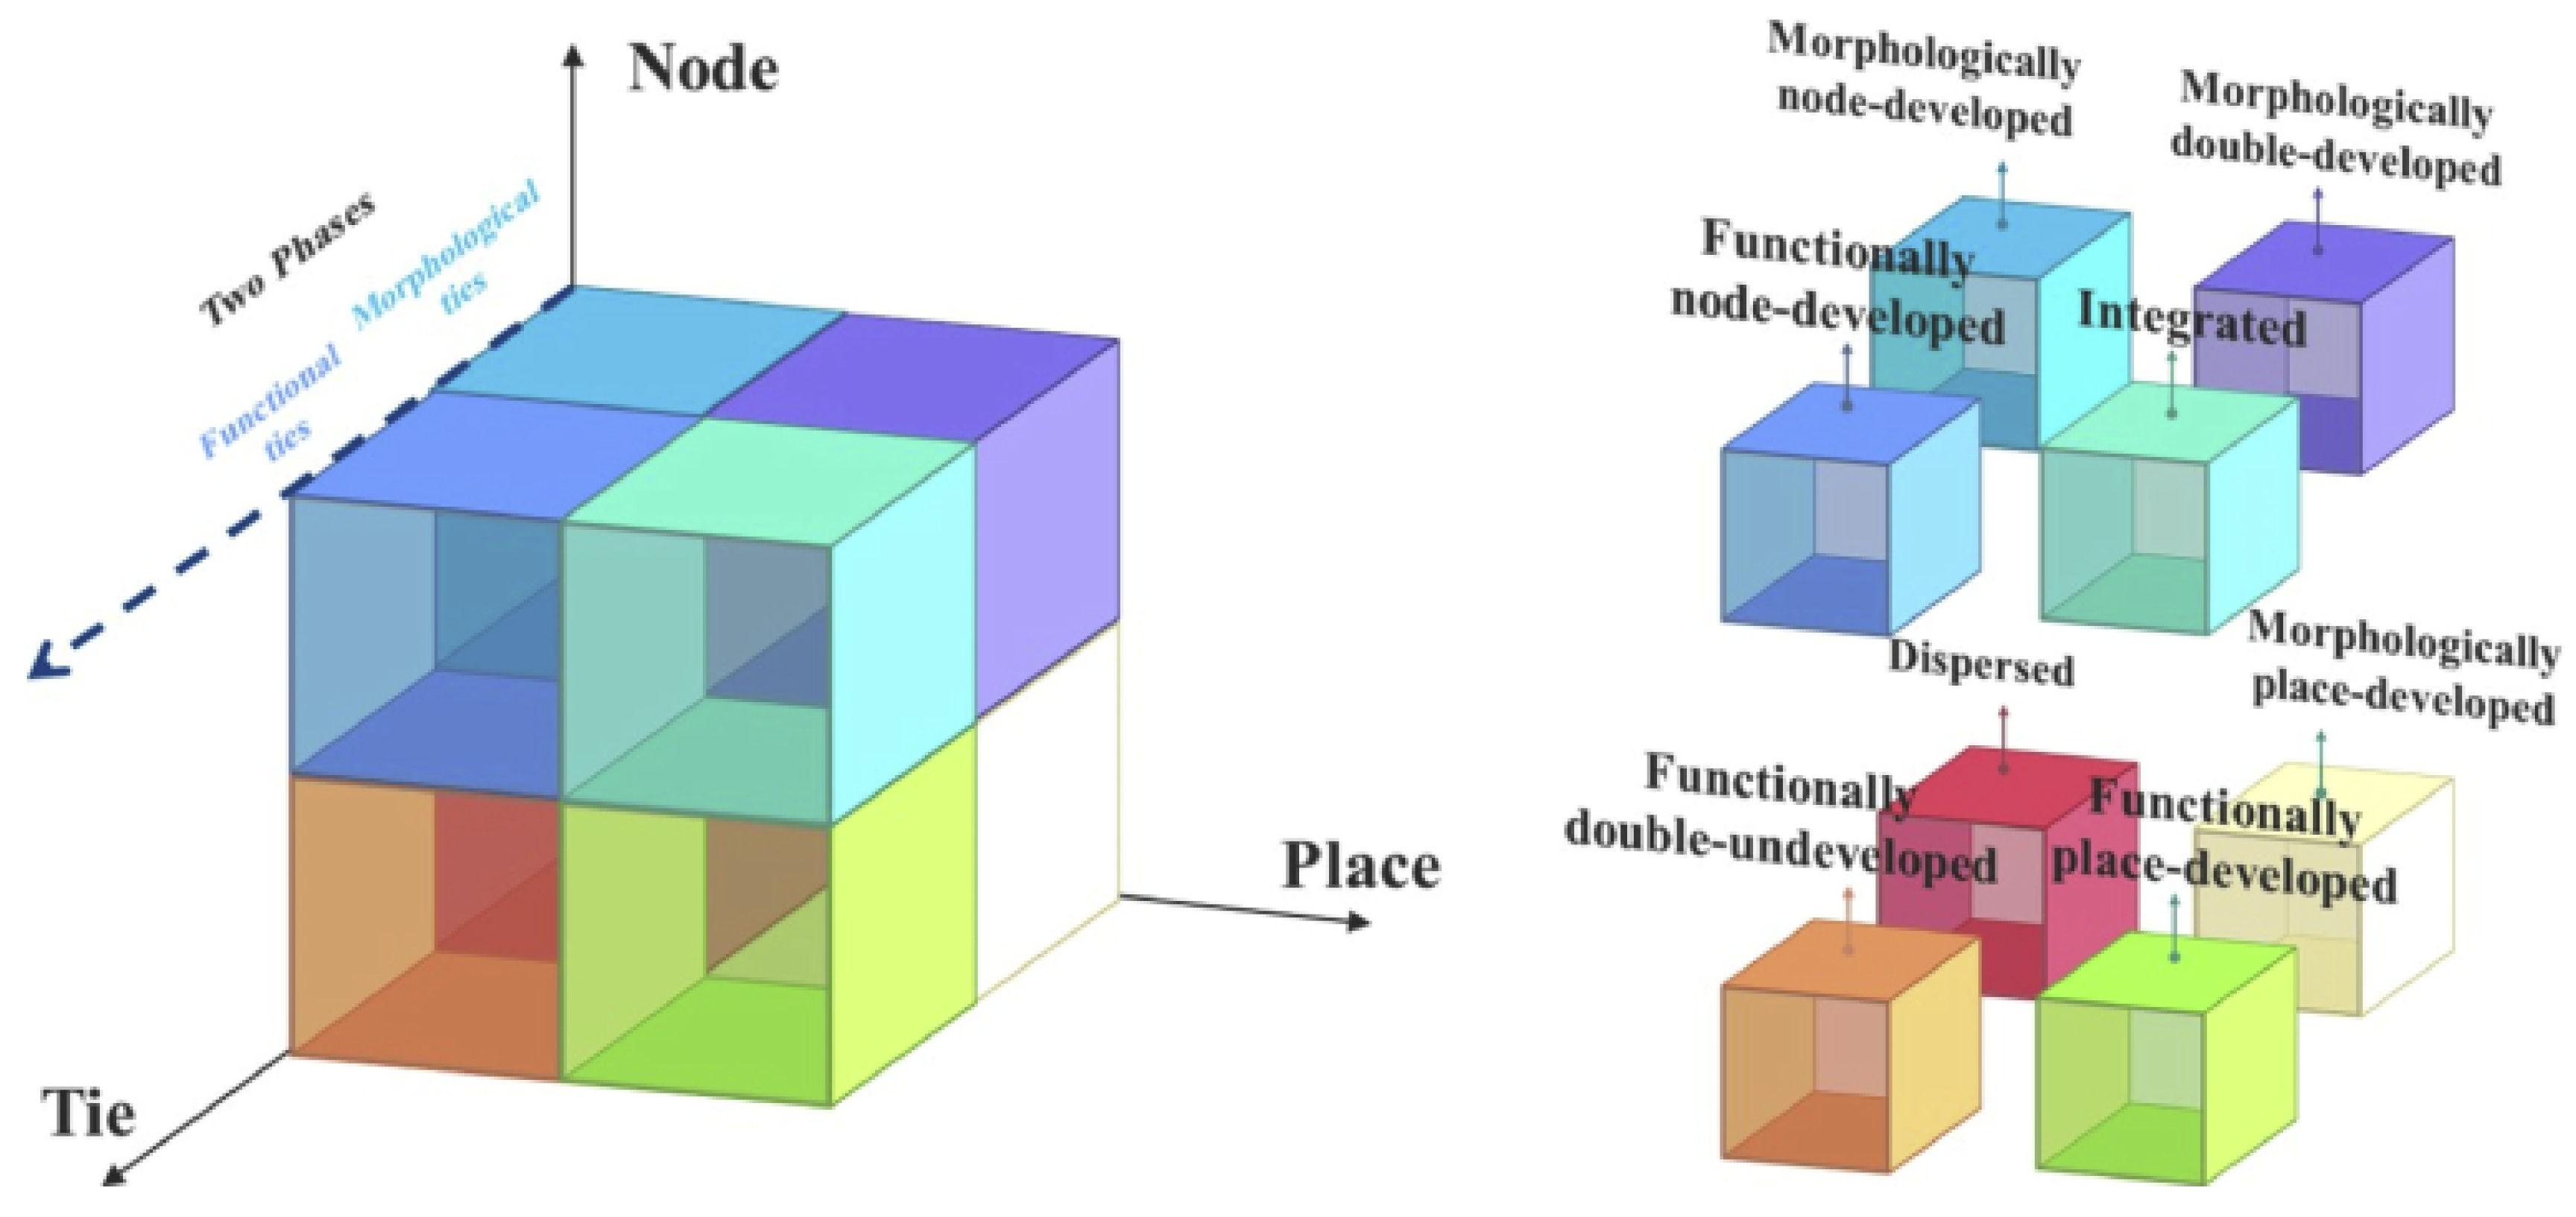
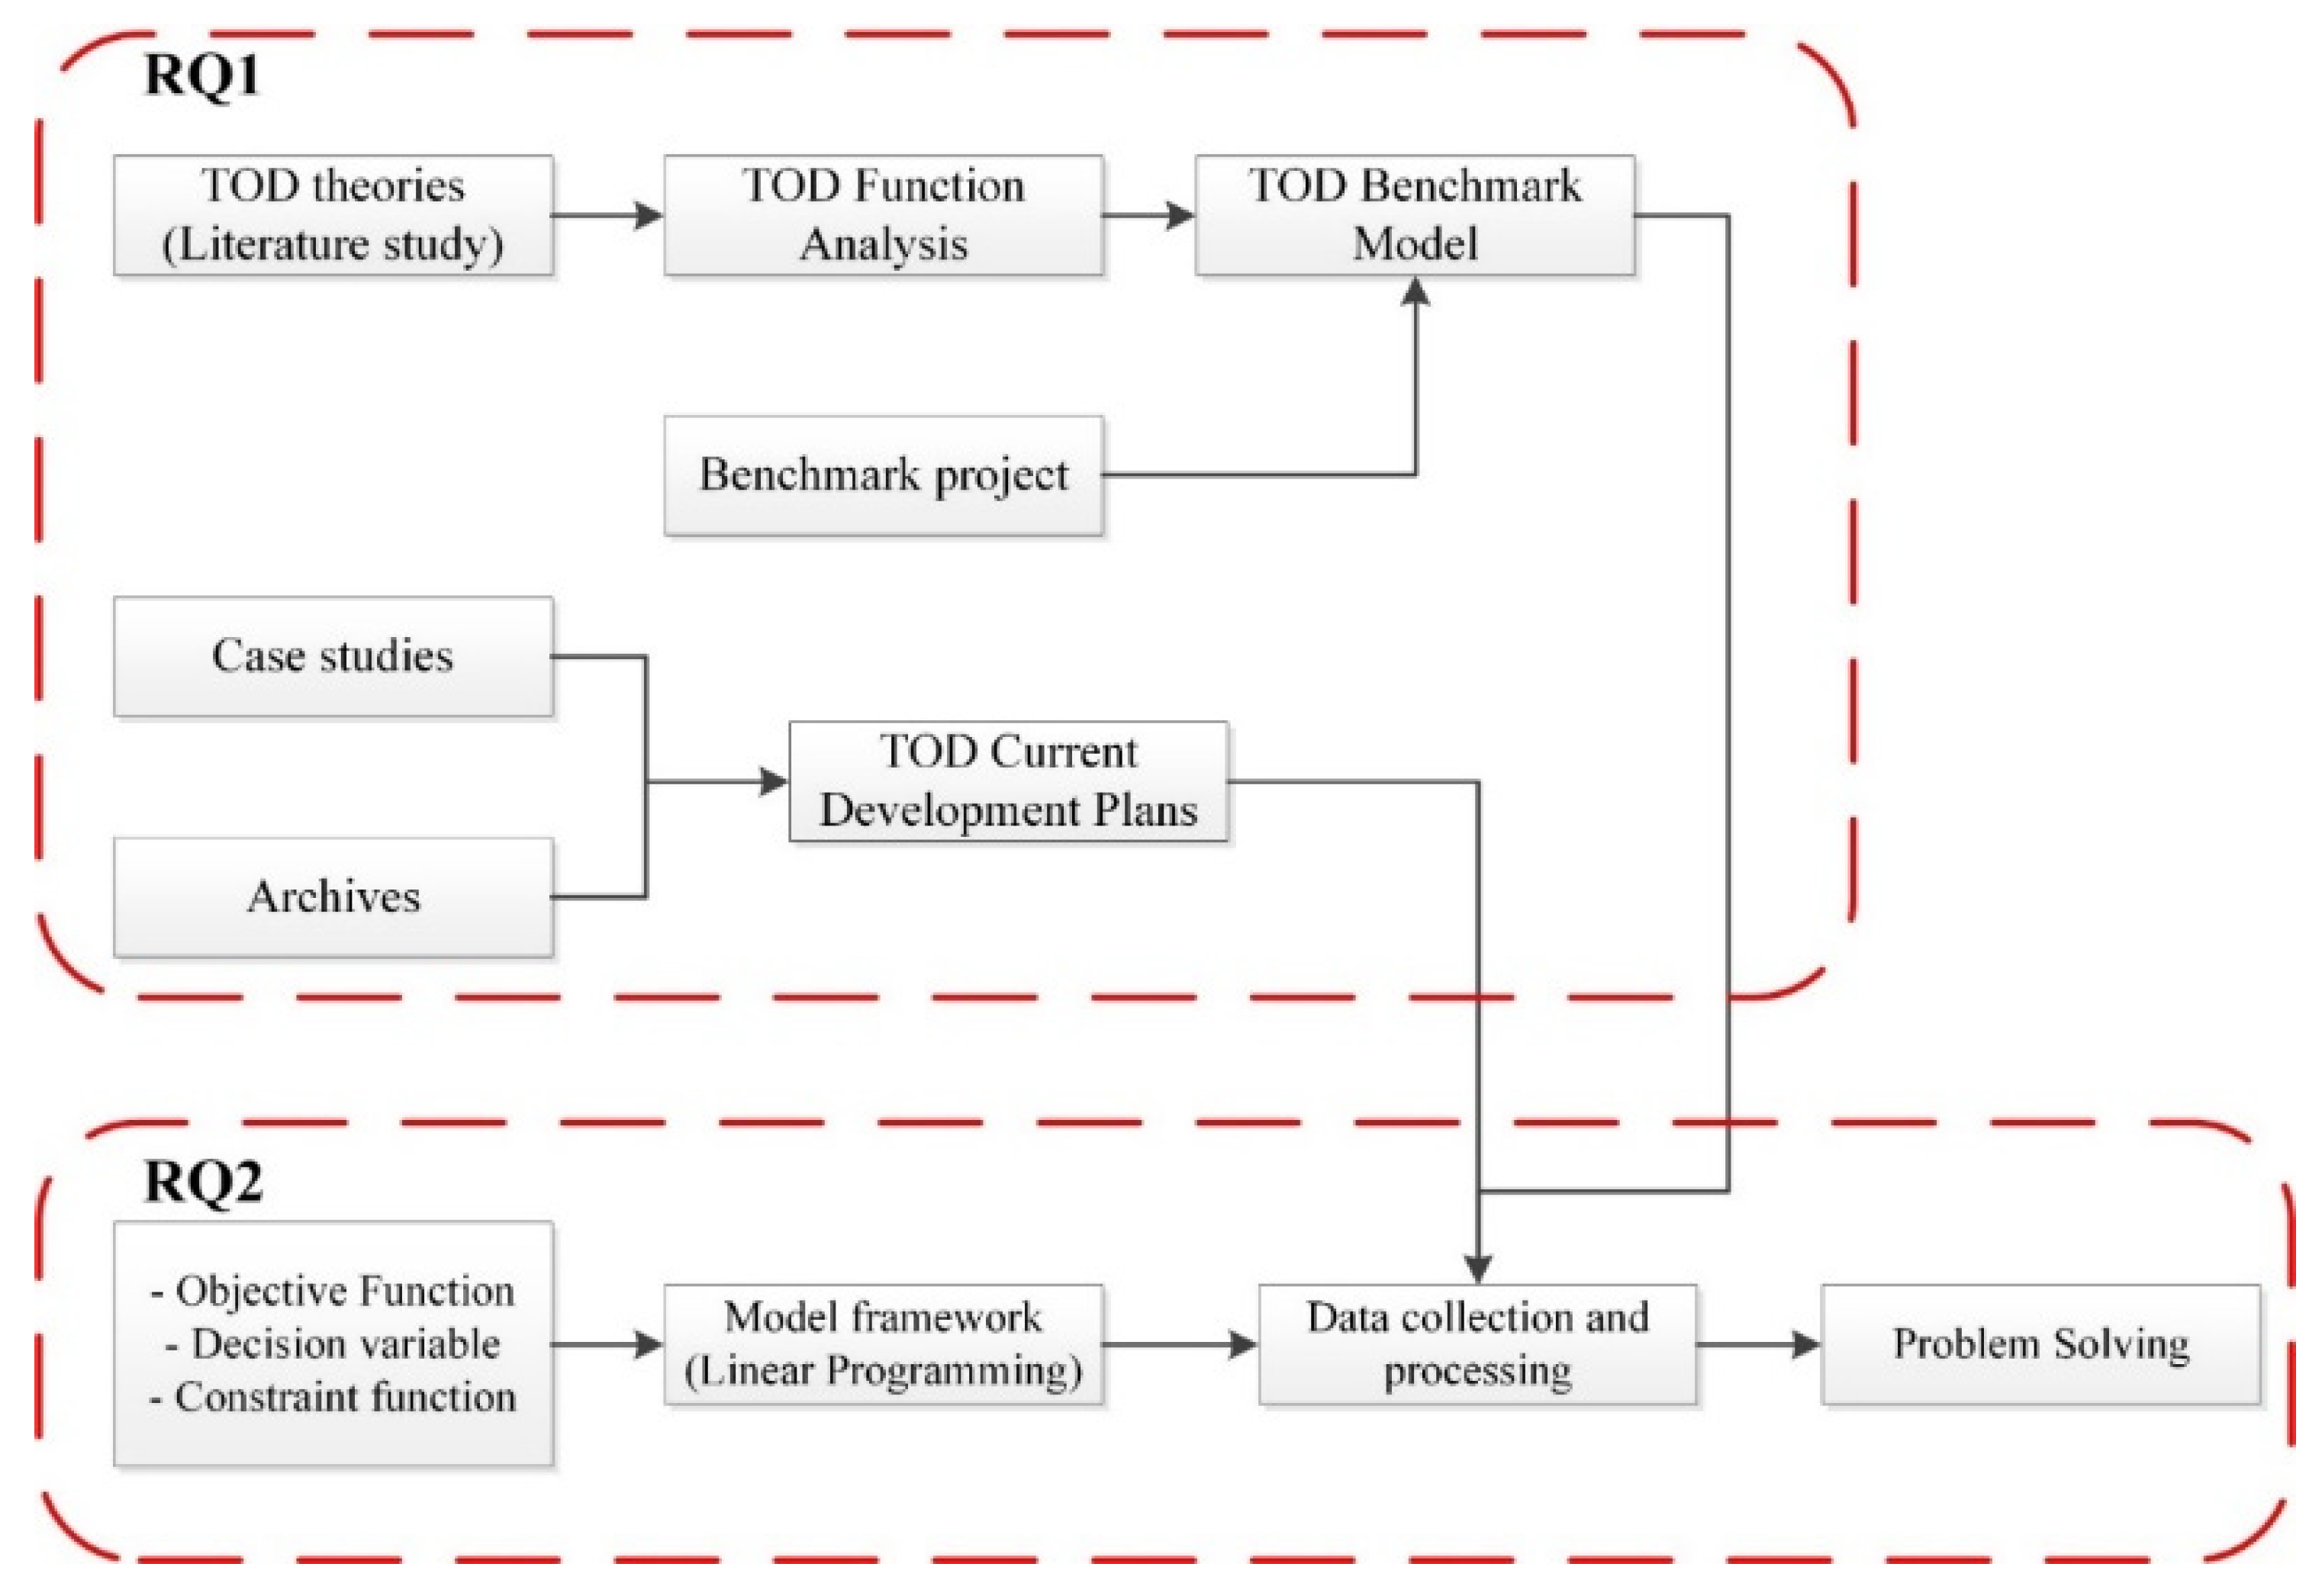
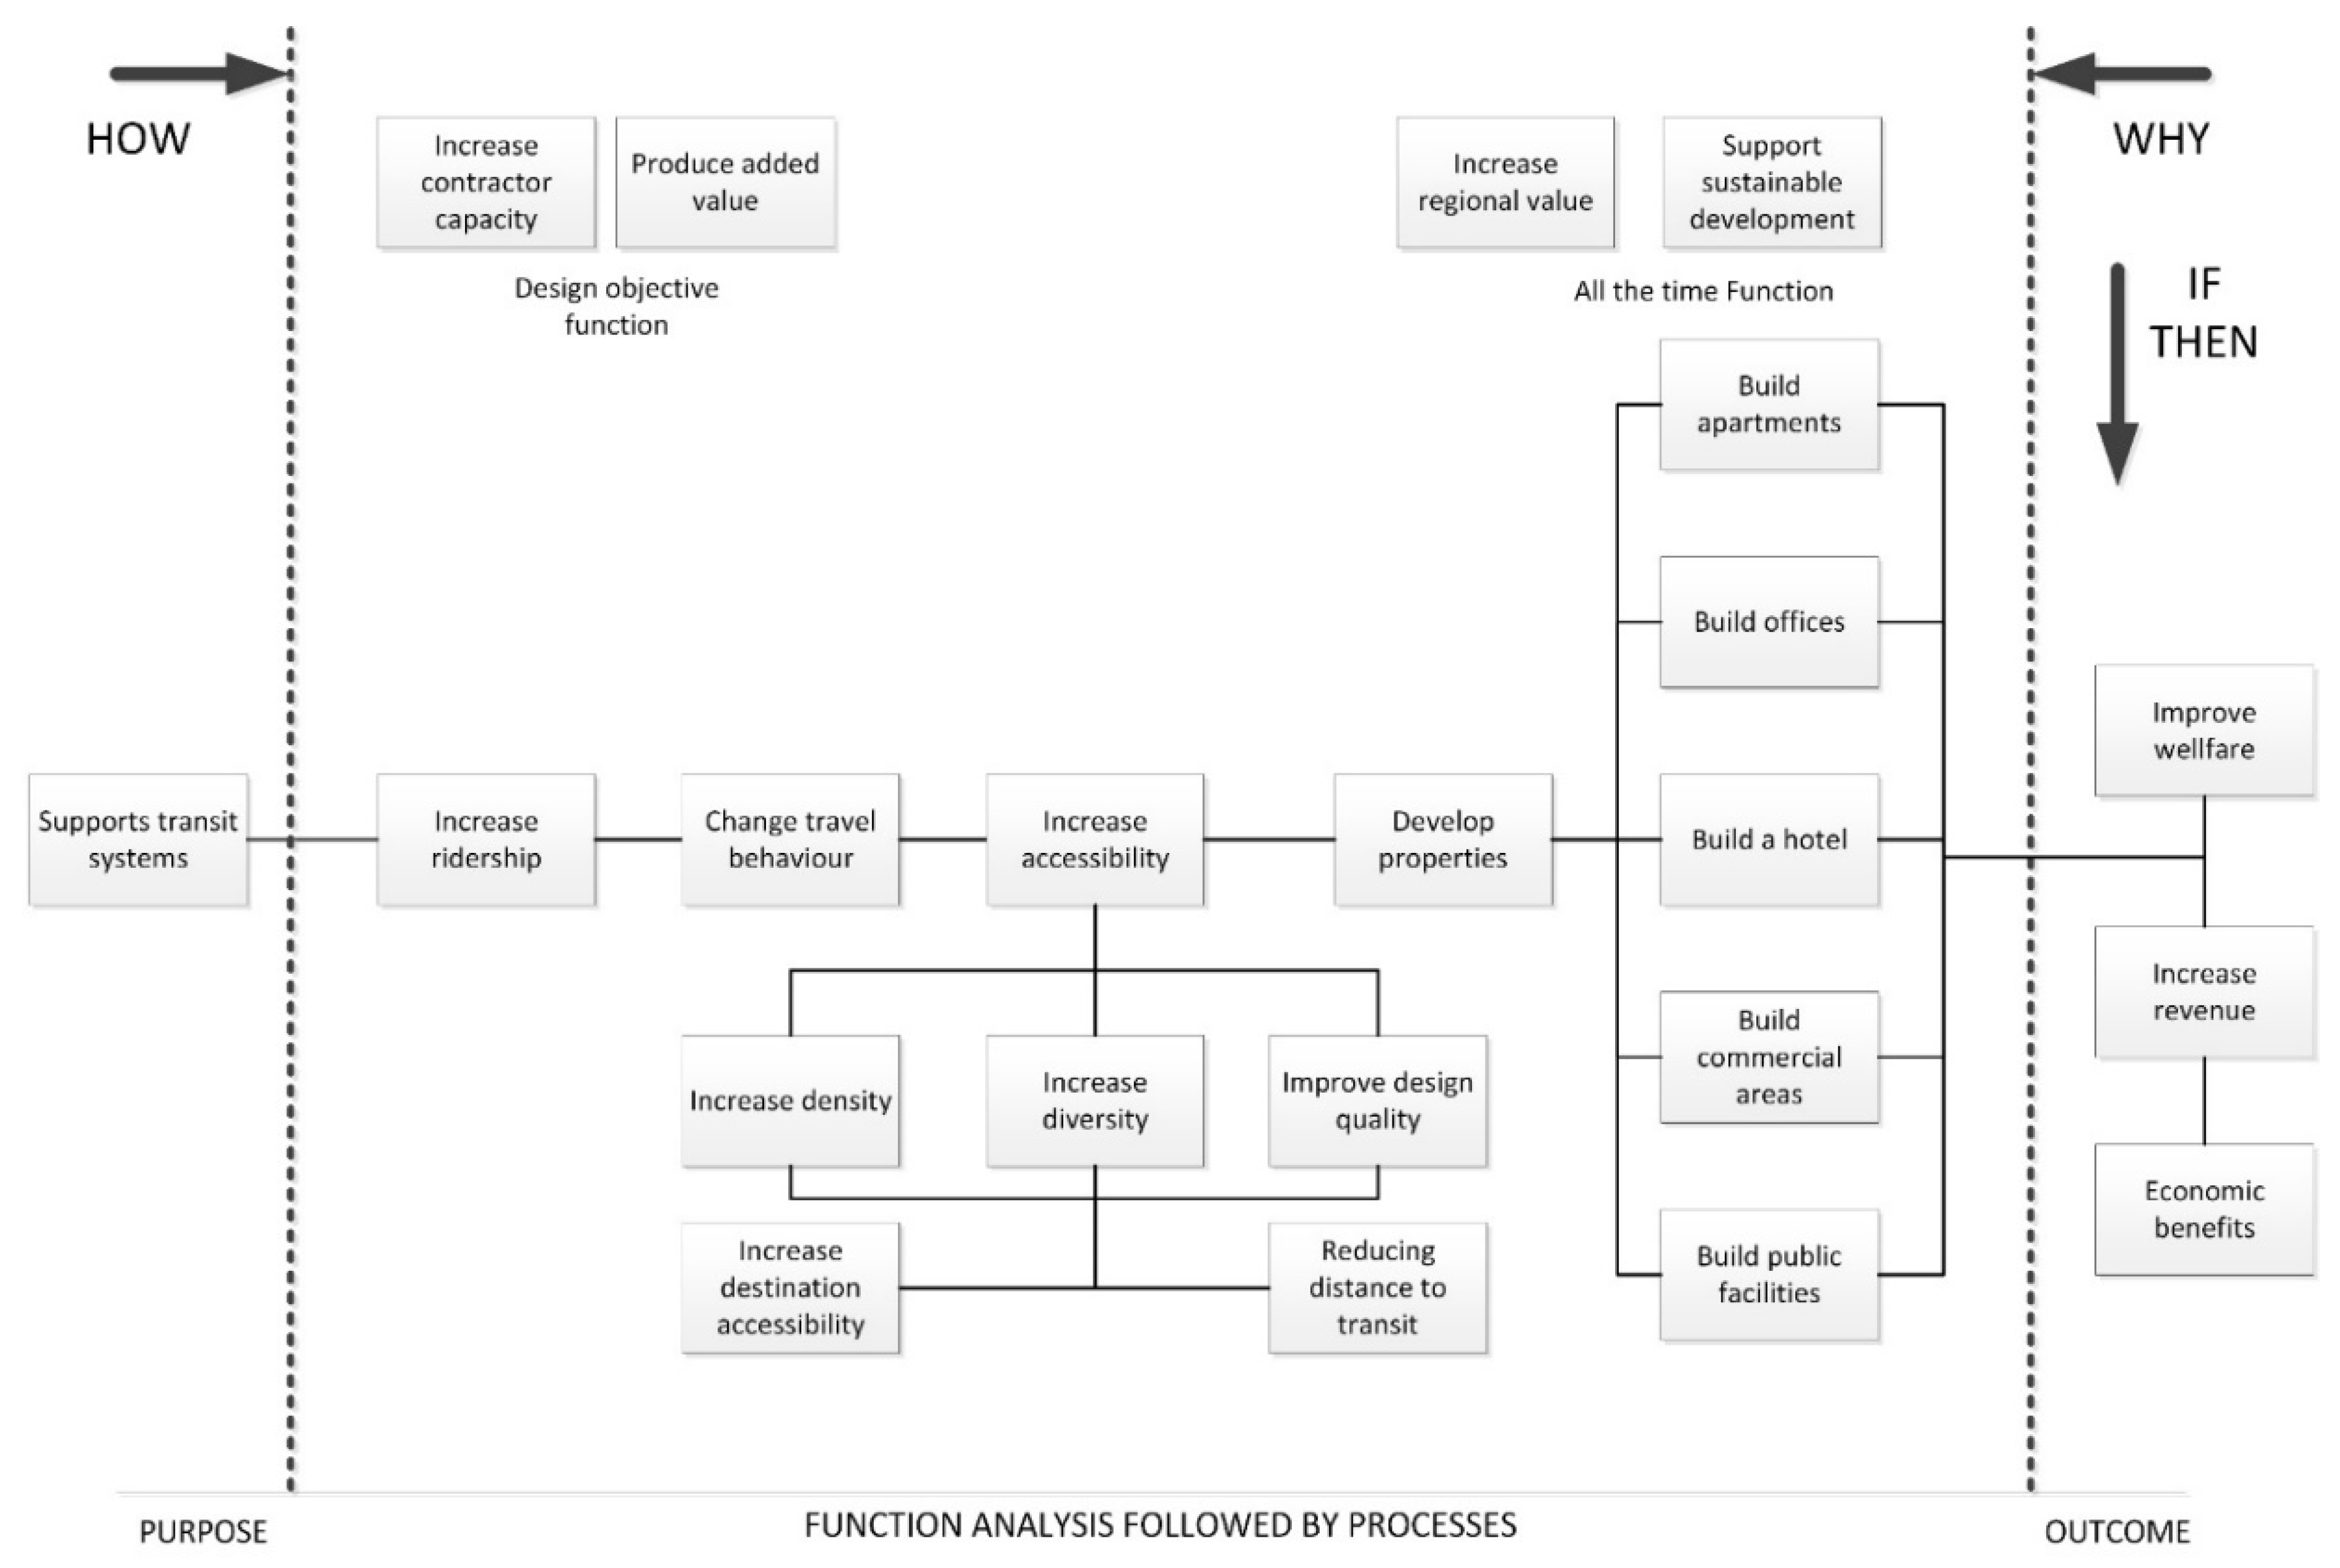
To achieve the objective of the research, this study adopted the technical FAST diagram produced from function analysis by determining the study problem, which was the benchmark TOD. This was followed by identifying its function (which was based on the theory from the literature study). Figure 5 shows the FAST Diagram of TOD with a supporting transit system as the purpose of the project while improving welfare and increasing revenue with economic benefits being the outcome. TOD would mean nothing without a change in travel behavior, increased accessibility and developed properties, which are all critical aspects of its function (with increased ridership being the main function).

4.2. Existing Jakarta TOD Development Plans: Case Study

A summary of the design development for the TOD projects in Jakarta in terms of the land use allocation and floor area proportion is presented in Table 3 and Figure 6. From the planning programs obtained from the feasibility study of the case study which included Jaticempaka, Ciracas, Cibubur and Bekasi Timur, it can be seen that the orientation of the development of the TOD areas was only focused on the residential property which took a big portion of TOD land use, while the development of retail and commercial areas was only made at about 20% of the total GFA. Nevertheless, there was no explanation for the benefit of the LRT transit Jakarta service (which was closer to the property around the area) in that feasibility study.
Based on the lesson learned from the benchmarking process involving three successful TODs as the guideline that was conducted previously, the configuration of the land use allocation for the benchmark TOD model was proposed to be conceptually designed with the commercial area as the connecting part of the transit station to other functional areas built in the TOD. In order to reduce the walking distance and make the walking activity be more efficient for pedestrians, it is recommended that areas such as residential, office and hotel are planned to stand on the podium-shaped commercial areas. That way, the commercial area can also be arranged as the circulation area within the TOD. Thus, the TOD can optimize its areas to accommodate various activities in a convenient pedestrian-oriented and integrated built-environment. The mass concept for the land use plan and design scheme of the proposed benchmark TOD model illustrating the land use allocation can be seen in Figure 7.

4.3. Ridership TOD Model

The modal split value for commuting trips was obtained from a benchmark study from Tokyo, with rail transit acting as the backbone mode of travel activity. On the other hand, non-commuting trips were retrieved from a previous study conducted by Lund et al. [64].
The transit ridership optimization approach derived from the required per person space requirement in a building has been applied by Hendrigan and Newman [68] in modeling the daily trips to estimate the capacity of transit mode in providing services for a dense, walkable and mixed-use area in Perth, Australia. Their research resulted in an estimation model of additional real estate yields obtained from a function of parking lot reduction and high transit mode capacity. The modal split of rail transit was obtained from a benchmarking study to the successful TOD areas in which rail transit is the main transit mode used in that city, such as in Tokyo and California; hence Jakarta was not selected since it could not be included in that category yet. The rail transit modal split was estimated by combining the modal split value of Tokyo for commuting trips (trips made from home to work which can include office, hotel or commercial area) and the findings from a TOD research in California conducted by Lund et al. [64]. The modal split value for the commuting trip was 73%, which was the maximum modal split value that had been achieved in Tokyo (see Table 4). Therefore, the same modal split value was used for apartment and office areas, considering that both were the main elements of the commuting trip end.
In hotel and commercial uses, there are two elements of trips, namely commuting trips done by workers who work in hotels and commercial retail and non-commuting trips done by hotel guests with an average rail modal split value of 44.17% (see Table 5) and retail visitors, the average rail modal split value of which is 12.58%. The rail modal split values for hotel and commercial areas were determined by taking the average rail modal split values of commuting trips and non-commuting trips, hence the modal split values for the hotel and commercial areas were 58.6% and 42.8% respectively.
Therefore, the value of the required input parameters (see Equation (1)), i.e., the transit trip generation rates, was estimated by multiplying the rail transit modal split and the required space area per person in a building plan [72,73] for the aforementioned purposes (Table 6).
The mandatory constraint related to the maximum gross floor area (GFA) was permitted to be built at the site. It was the result of the multiplication of the floor-area ratio (FAR) and the land site. In other words, the mixed-use development gross floor area should not exceed those figures. The conditional constraints were related to restriction on developing particular uses, such as the maximum/minimum GFA of commercial/residential areas, and other factors expressed in values or percentages. The last constraint was on non-negativity, which inhibited the model from generating the negative value of the decision variables. These were defined in accordance with the benchmark study (see Table 2). Based on the above explanation, the TOD optimization model to maximize ridership is presented as follows:
Maximize   Z   = 0.08 x 1 + 0.16 x 2 + 0.12 x 3 + 0.09 x 4
subject to
x 1 +   x 2 +   x 3 +   x 4 +   x 5     GFA
x 1     24 %   of   GFA
x 1     56 %   of   GFA
x 2     6 %   of   GFA
x 2     24 %   of   GFA
x 3     4 %   of   GFA
x 3     15 %   of   GFA
x 4     8 %   of   GFA
x 4     34 %   of   GFA
x 5     12 %   of   GFA
x 5     39 %   of   GFA
x 1 ,   x 2 ,   x 3 ,   x 4 ,   x 5     0
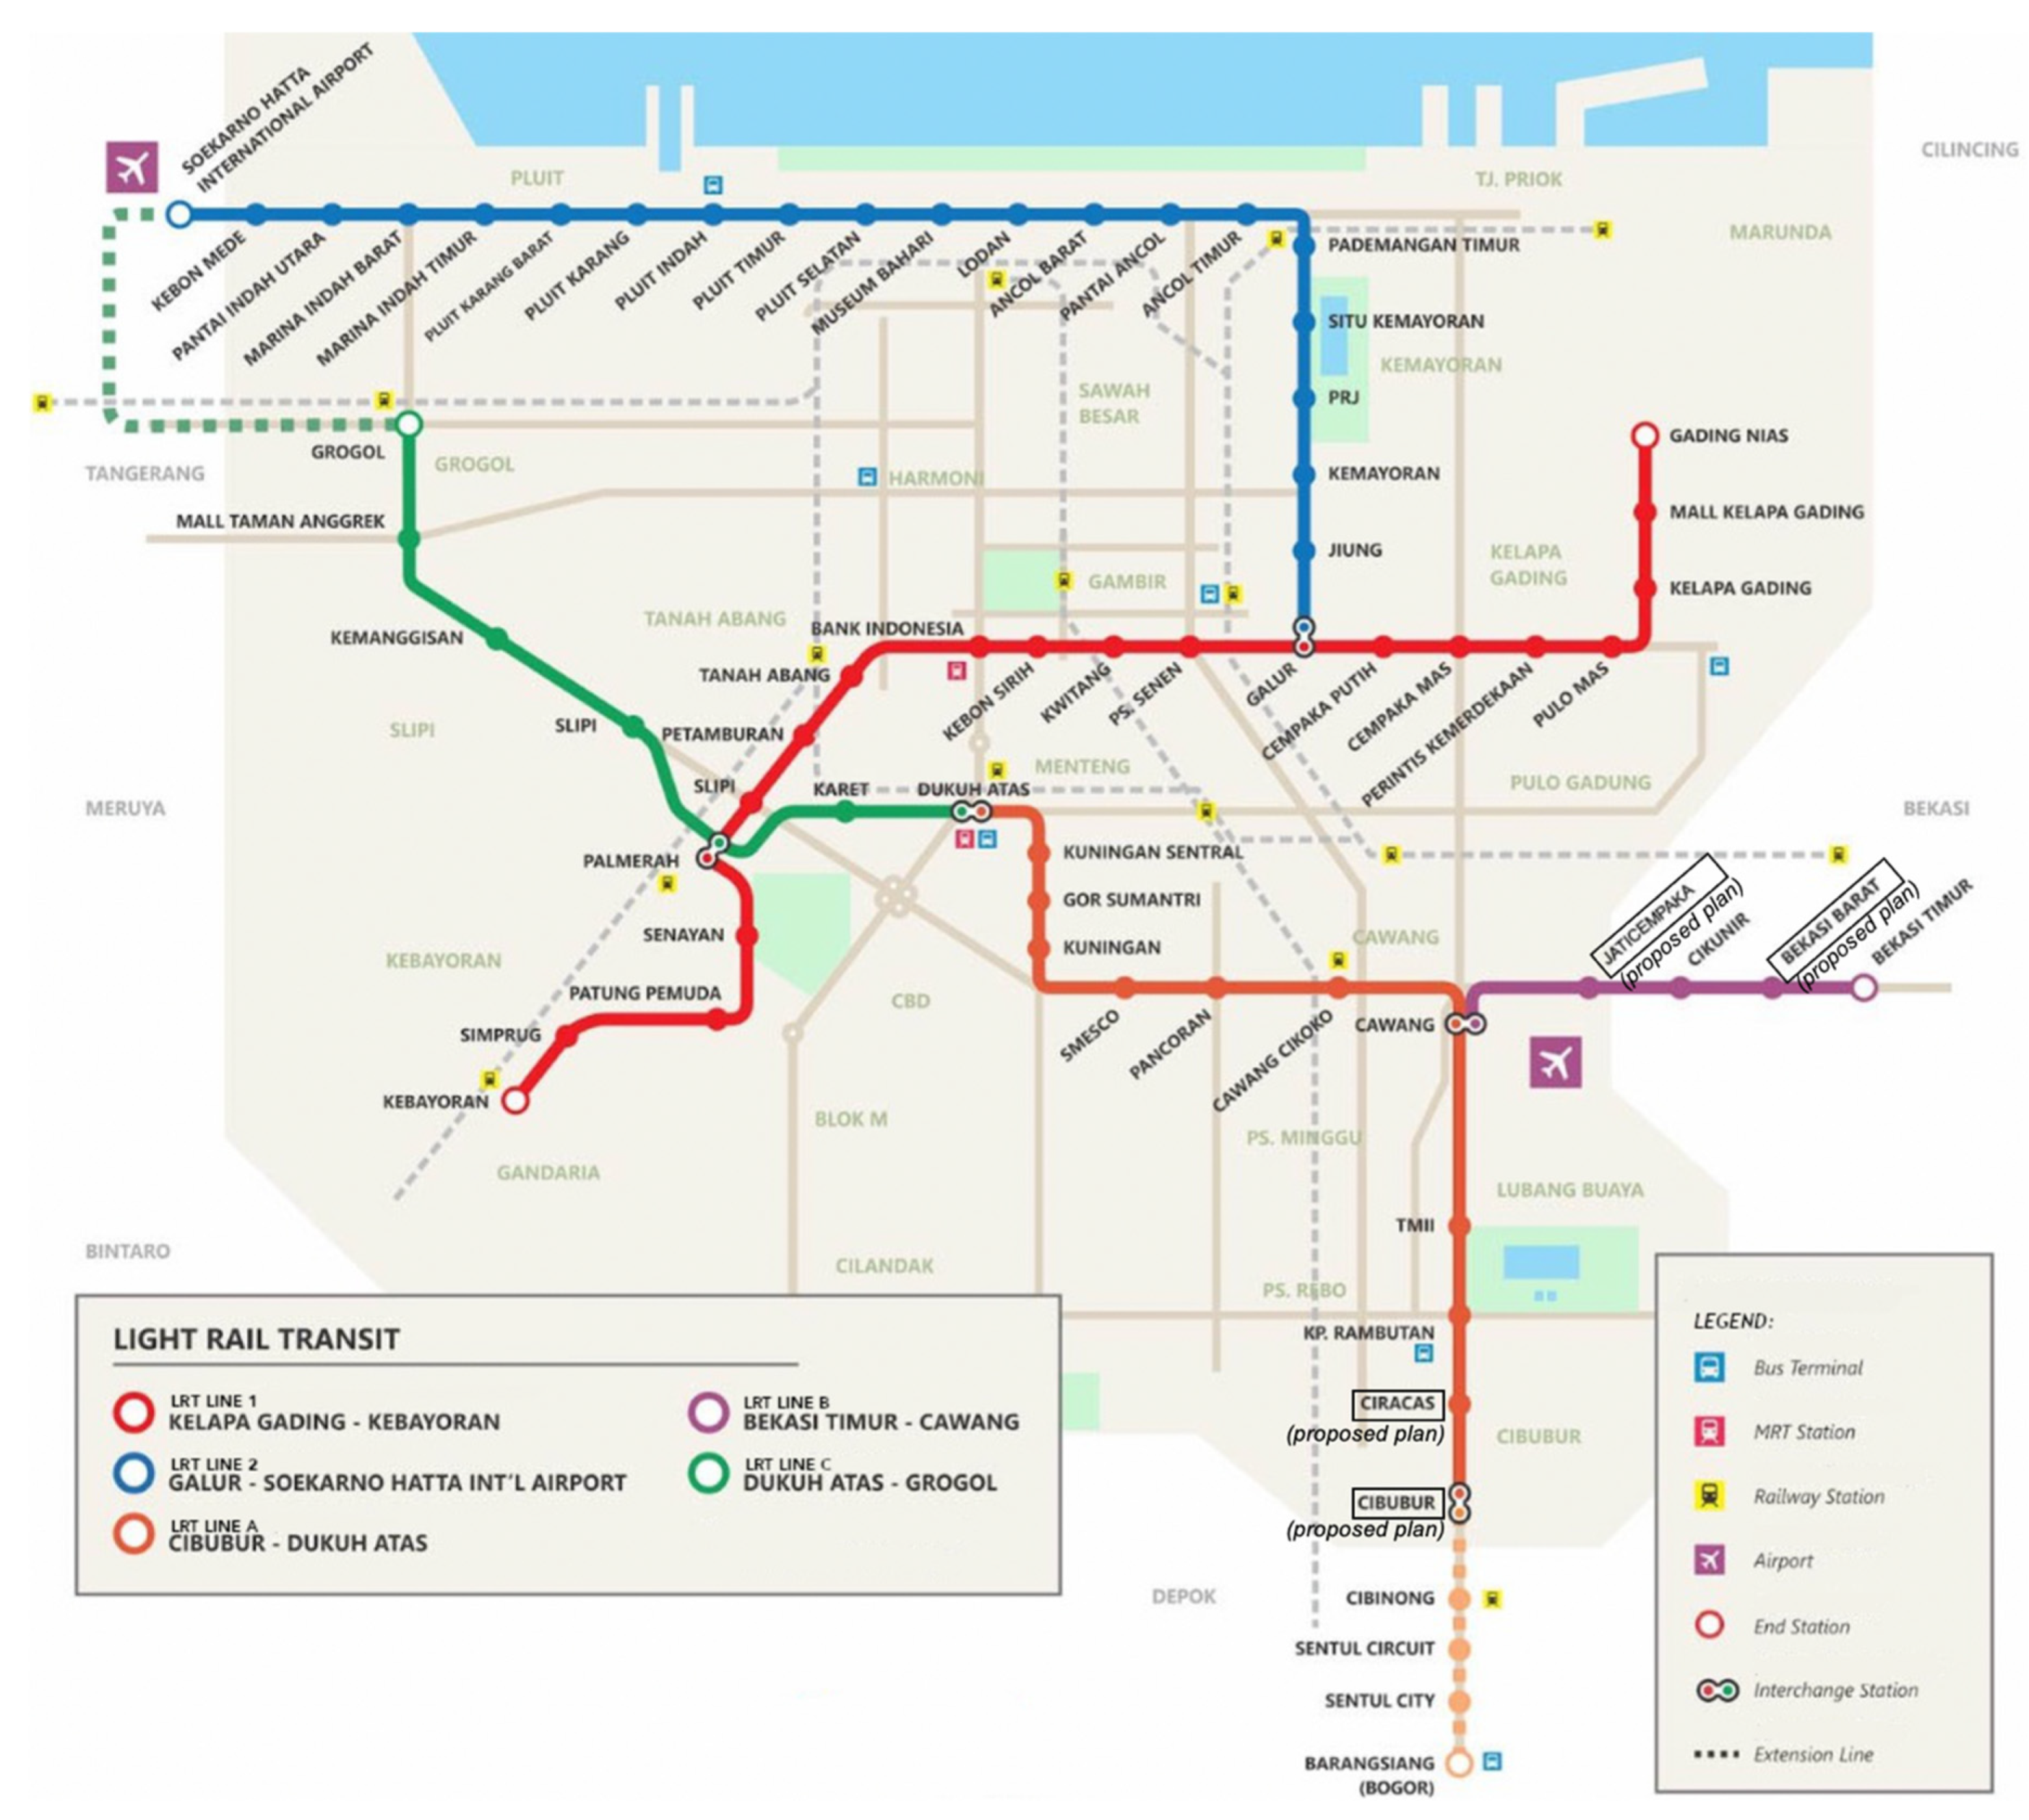
The above model was used to resolve the optimization problem in TOD planning on a land parcel of four LRT station areas. The first process evaluated ridership from the existing development plans, with the value of each gross floor area added into the objective functional equation (Equation (4)) to obtain the estimated values of ridership, as shown in Table 7.
Using the same method, the values of the ridership of Jakarta TOD with the benchmark-based land use allocation can be seen in Table 8.
The next step was to optimize the design using the linear programming optimization approach. Bekasi Timur LRT station area was an example of the application model. The TOD of Bekasi Timur was planned to be built on 50,000 m2 of land, with a maximum GFA of 178,100 m2. Based on the case study above, the linear programming process was executed. The Simplex method using the Solver parameter from the spreadsheet application was utilized. Table 9 shows the optimum TOD design from a linear programming-based optimization model using a typical benchmarking design. Based on Table 8, the ridership estimation of the Bekasi Timur LRT station with benchmark-based land use allocation was 15,921 trips per day, while the optimized design generated 1407 additional trips (from 15,921 to 17,328). This increase was a result of the optimization space taken from the residential proportion. Residential space was reduced by 20%, to be allocated to retail, hotel and office development based on the trip generation rates and the defined constraints.
The objective function showed that the highest rate of transit trip boarding came from office workers. Several studies revealed that workplace development near a station is the main determinant of transit ridership. The result of a study conducted by Kwoka et al. [74] in Denver, Colorado, suggested that locating workplaces closer to transit is more effective in encouraging non-car workers to commute than residential places. Evans and Pratt [75] reported that every 1000 feet away from stations on the Washington Metro lines, the reduction in transit mode share regarding the office location was 58% higher than that of housing. Recent research on ridership-determinant factors of the Shanghai rail transit system has revealed that employment within 500 m of a station is the dominant factor in increasing rail passenger volume, which is, therefore, the key component of TOD planning [76].
The potential ridership using the land use allocation obtained from the benchmark study (Table 8) and the optimized design of the Jakarta TOD (
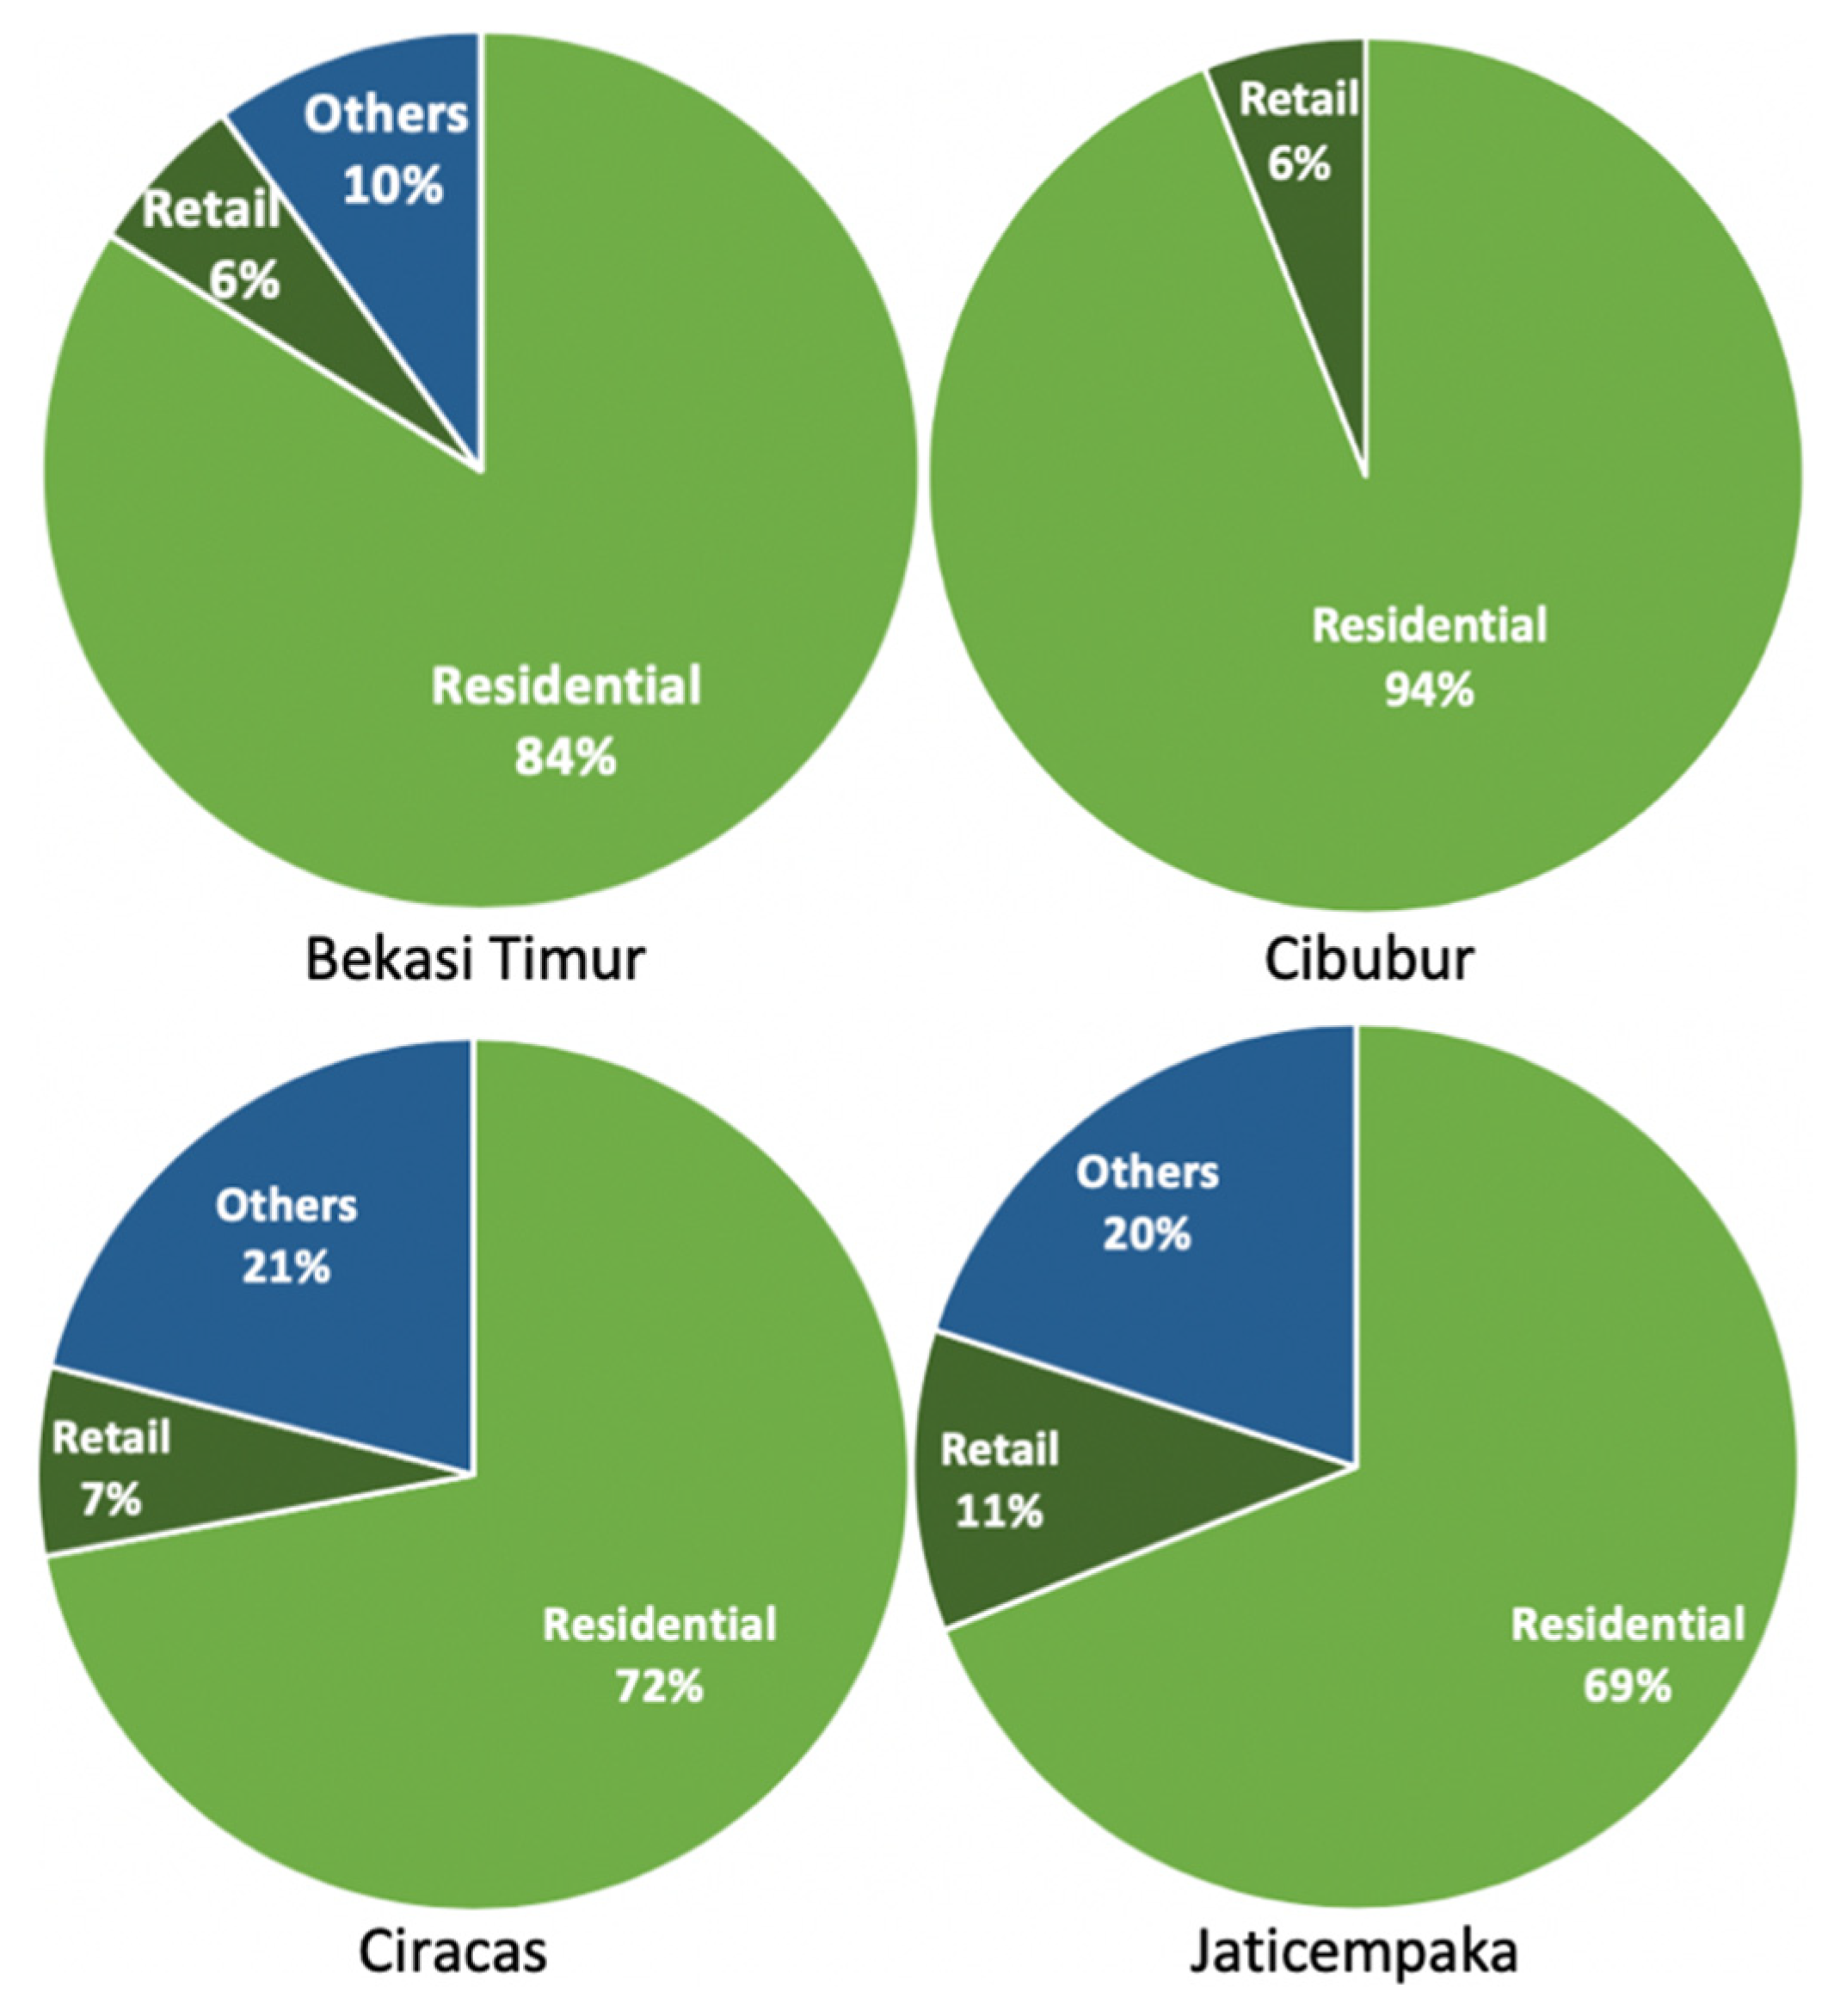
Table 10) were then compared with the ridership of the existing Jakarta TOD plan (Table 7). The existing planned design of the Jakarta TOD comprised residential development as its major land use, with other non-residential developments were allocated less than 40%. Table 11 shows the additional rate of ridership in each case study resulting from the evaluation of the benchmark design and optimization process.
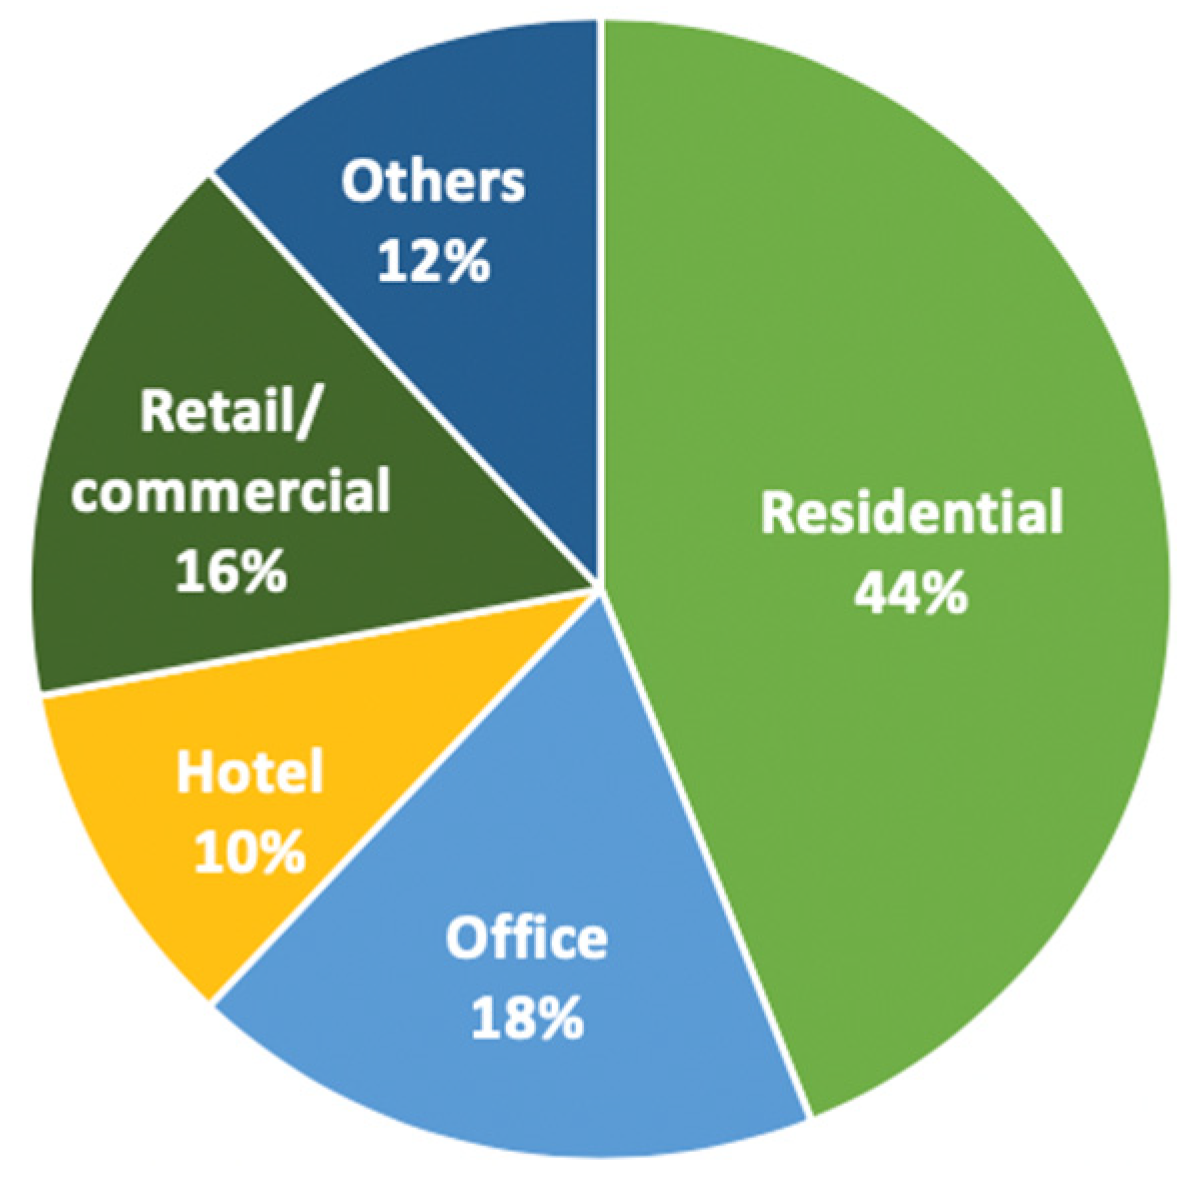
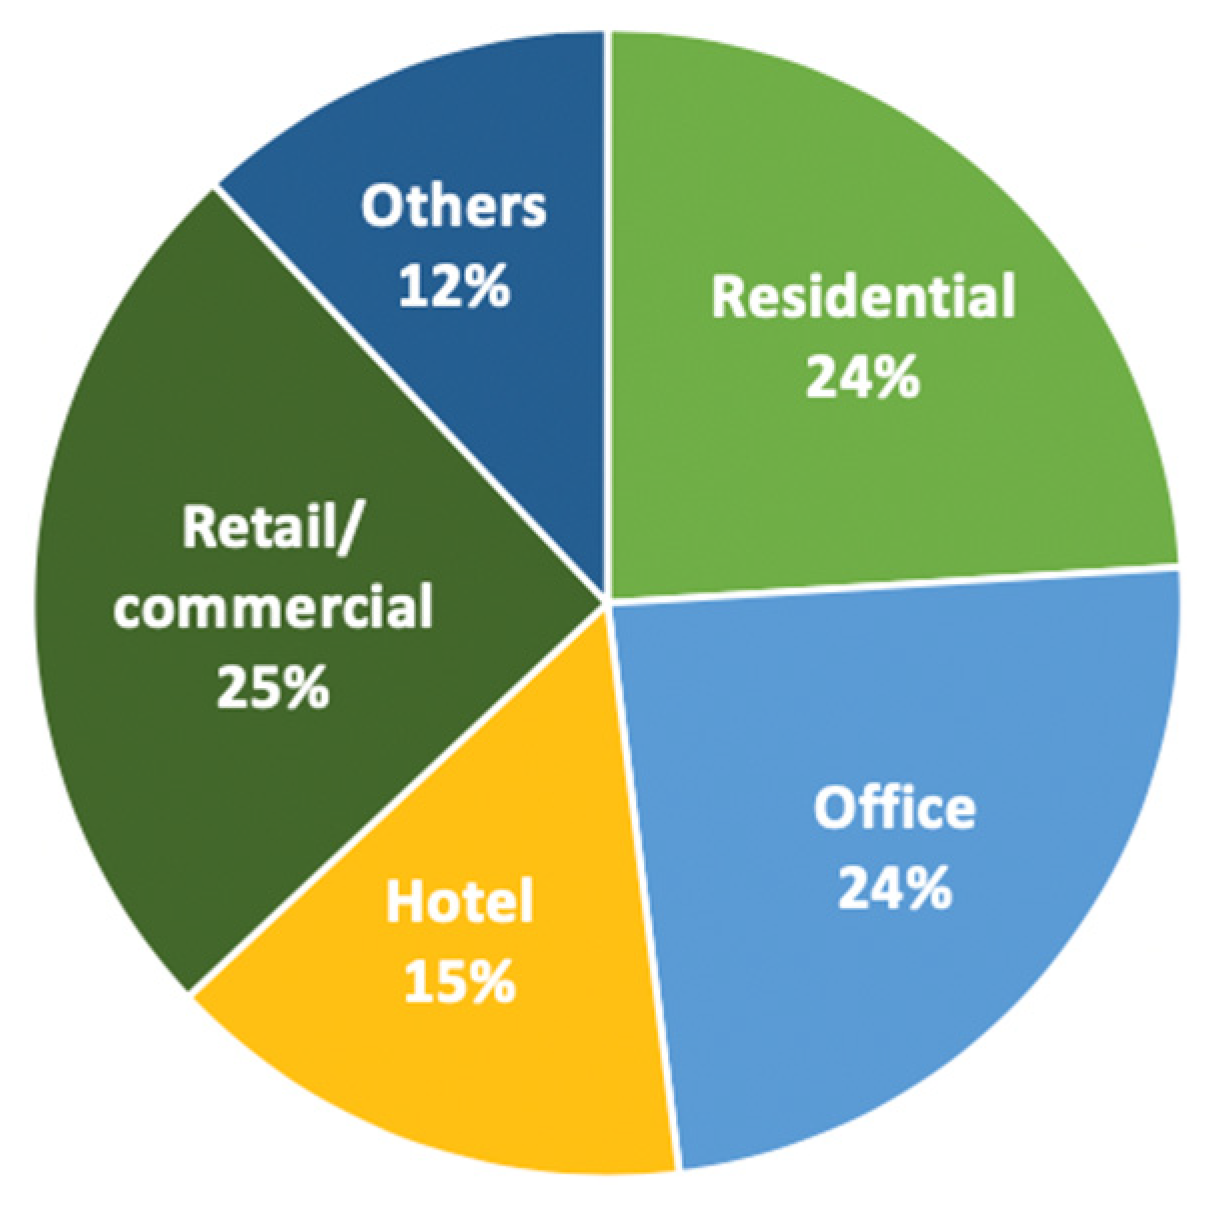
The optimized design was capable of boosting the LRT ridership up to 55% in Ciracas, 51% in Jaticempaka and 36% in Bekasi Timur, while the lowest ridership optimization took place in Cibubur. This optimized mixed-use allocation for the Jakarta TOD areas, which comprised 24% residential, 25% retail, 15% hotel, 24% office and 12% others, as shown in Figure 8, will be able to generate maximum ridership for the Jakarta LRT.
Comparing the maximized ridership generated by the optimized TOD design with the existing TOD design, it can be seen that the ridership in Ciracas was boosted by 9931 passengers daily, 5500 passengers daily in Jaticempaka, 4615 passengers daily in Bekasi Timur and 2854 passengers daily in Cibubur. This was in line with the finding of the study by Cervero and Murakami [11] investigating the transit ridership of the TOD in Hong Kong, which pursued a transit value capture to fund the railway investment through the integration of the rail transit and urban development named the ‘R+P’ program that showed that a transit-oriented design of a rail station yields benefits not only to the real estate prices but also to the transit ridership. The mixed-land use, design integration and pedestrian-oriented walking environment as the key elements of transit-oriented development evidently have a positive impact on ridership at the Hong Kong’s rail transit stations.
The finding of this study supported the TOD principle that well designed TOD with land use diversity will help transit service to sustainably finance its operation through the farebox generated by maximum ridership. Moreover, property development designed with consideration to its accessibility to transit can also be benefited in the form of a property price upgrade. Moreover, universal accessibility addresses the issue on social equity by making the safe and affordable mode of transport available for everyone, opening equal access to basic needs such as education, health and employment opportunity.
Well planned integrated transit and its diverse land development are the most effective way to achieve sustainability in urban development, as they help growing cities improve their economic development, ecological sustainability and social equity by providing inclusive transport and a livable environment accessible for all. Therefore, in order to achieve sustainable urban development, this study attempted to address this issue by formulating optimum densities around transit areas by putting in close proximity all functions including the residential, retail/commercial, office and other areas (parking spaces and open places) integrated into the concept of “live-work-play-stay-others” in the development of a TOD project which can generate more ridership for the rail transit modal split.

5. Conclusions

TOD planning plays a significant role in maximizing the transit revenue from user demand and in creating compact and sustainable urban development in a limited land area. To obtain optimization for the planning of mixed-use TOD, this study took into account a mathematical programming approach, which typically allocated limited land resources between several competing users and different mixes to achieve a certain objective. In this regard, linear programming was seen as a suitable analytical tool for such analysis. This paper therefore presents a linear programming framework by defining decision variables and formulating objectives and constraint functions based on similar TODs in different cities, maximizing transit ridership with consideration to the performance indicators of a successful TOD as the objective function. The GFA of each development type was defined as the decision variables for the residential, office, hotel and commercial purposes. The constraints were formulated based on the total range of each development’s GFA derived from the benchmark study of successful TODs around the world.
The sole objective was to quantify linear functions consisting of ridership and GFA decision variables. The values of the required input parameters, such as trip generation rates, were obtained by multiplying the transit modal split by the area needed per person in a building plan, while the highest trip rate was generated by office development (0.16 person/m2), with residential development (0.08 person/m2) generating the lowest. Thus, it can be concluded that the more mixed-use the development of the Jakarta TOD is, the higher its potential to produce a higher level of transit ridership with more livable communities than the existing TOD scenario, which was dominated by residential use.
This study encourages TOD planning to prioritize the diversity in land use allocation in order to be able to generate maximum ridership. In this regard, this paper also recommends that the city’s policymakers contribute to this by establishing supportive policy instruments and implementation frameworks regarding the land use diversity patterns to foster the development of TOD so that the sustainable urban development in terms of sustainable finance, environment as well as society, can be achieved.
Future studies need to be conducted to further examine the impact of the development scale, such as the building coverage ratio and the floor area ratio of each type of property, on transit ridership. These should also fulfill the ‘5D’ requirement of the TOD principles, namely density, diversity, design, distance to transit and destination accessibility. Furthermore, once TOD areas in the LRT corridor in Jakarta are in operation, studies assessing its performance need to be carried out. These should be able to support the purpose of sustainable development, especially in the use of transit.

Author Contributions

Conceptualization, M.A.B. and G.S.; data curation, F.A.I. and B.E.I.; writing—review and editing, P.M. and M.S. All authors have read and agreed to the published version of the manuscript.

Funding

This research received no external funding.

Acknowledgments

This research was supported by research grants from Universitas Indonesia and the Ministry of Research and Higher Education, Republic of Indonesia (Kemristekdikti).

Conflicts of Interest

The authors declare no conflict of interest.

References

  1. Suzuki, H.; Murakami, J.; Hong, Y.H.; Tamayose, B. Financing Transit-Oriented Development with Land Values: Adapting Land Value Capture in Developing Countries; The World Bank: Washington, DC, USA, 2015; ISBN 1464801495. [Google Scholar]
  2. Ma, X.; Chen, X.; Li, X.; Ding, C.; Wang, Y. Sustainable station-level planning: An integrated transport and land use design model for transit-oriented development. J. Clean. Prod. 2018, 170, 1052–1063. [Google Scholar] [CrossRef]
  3. Mudigonda, S.; Ozbay, K.; Ozturk, O.; Iyer, S.; Noland, R.B. Quantifying transportation benefits of transit-oriented development in New Jersey. Transp. Res. Rec. 2014, 2417, 111–120. [Google Scholar] [CrossRef]
  4. Vale, D.S.; Viana, C.M.; Pereira, M. The extended node-place model at the local scale: Evaluating the integration of land use and transport for Lisbon’s subway network. J. Transp. Geogr. 2018, 69, 282–293. [Google Scholar] [CrossRef]
  5. Bardaka, E.; Hersey, J. Comparing the travel behavior of affordable and market-rate housing residents in the transit-rich neighborhoods of Denver, CO. Travel Behav. Soc. 2019, 15, 74–87. [Google Scholar] [CrossRef]
  6. Newman, P.; Kenworthy, J.; Glazebrook, G. Peak Car Use and the Rise of Global Rail: Why This Is Happening and What It Means for Large and Small Cities. J. Transp. Technol. 2013, 3, 272–287. [Google Scholar] [CrossRef] [Green Version]
  7. Zhang, M.; Xu, T. Uncovering the Potential for Value Capture from Rail Transit Services. J. Urban Plan. Dev. 2017, 143, 04017006. [Google Scholar] [CrossRef]
  8. Kenworthy, J.R. The eco-city: Ten key transport and planning dimensions for sustainable city development. Environ. Urban. 2006, 18, 67–85. [Google Scholar] [CrossRef]
  9. Bertolini, L. Spatial development patterns and public transport: The application of an analytical model in the Netherlands. Plan. Pract. Res. 1999, 14, 199–210. [Google Scholar] [CrossRef]
  10. Li, Y.; Guo, H.L.; Li, H.; Xu, G.H.; Wang, Z.R.; Kong, C.W. Transit-oriented land planning model considering sustainability of mass rail transit. J. Urban Plan. Dev. 2010, 136, 243–248. [Google Scholar] [CrossRef]
  11. Cervero, R.; Murakami, J. Rail and property development in Hong Kong: Experiences and extensions. Urban Stud. 2009, 46, 2019–2043. [Google Scholar] [CrossRef]
  12. Li, X.; Liu, Y.; Gao, Z.; Liu, D. Decision tree based station-level rail transit ridership forecasting. J. Urban Plan. Dev. 2016, 142, 04016011. [Google Scholar] [CrossRef]
  13. Kim, T.; Sohn, D.W.; Choo, S. An analysis of the relationship between pedestrian traffic volumes and built environment around metro stations in Seoul. KSCE J. Civ. Eng. 2017, 21, 1443–1452. [Google Scholar] [CrossRef]
  14. Lin, J.J.; Li, C.N. A grey programming model for regional transit-oriented development planning. Pap. Reg. Sci. 2008, 87, 119–138. [Google Scholar] [CrossRef]
  15. Lin, J.J.; Gau, C.C. A TOD planning model to review the regulation of allowable development densities around subway stations. Land Use Policy 2006, 23, 353–360. [Google Scholar] [CrossRef]
  16. Addae-Dapaah, K. Highest and best use in the valuation of mixed-use development sites: A linear programming approach. J. Prop. Res. 2005, 22, 19–35. [Google Scholar] [CrossRef]
  17. Addae-dapaah, K. Nonlinear Modelling of the Highest and Best Use in the Valuation of Mixed-Use Development Sites; IRES Working Paper Series; National University of Singapore: Kent Ridge, Singapore, 2011; pp. 1–35. [Google Scholar]
  18. Winokur, H.S.; Frick, J.B.; Bean, J.C. The Affair Between the Land Developer and the Management Scientist. Interfaces 1981, 11, 50–56. [Google Scholar] [CrossRef]
  19. Bevilacqua, C.; Cappellano, F.; Zingali, L. TOD -Transit oriented development: A sustainable tool towards smart living. In Proceedings of the 7th Conference of International Forum on Urbanism, 7–11 October 2013; National Chen Kung University in Tainan: Taiwan, China, 2013. [Google Scholar]
  20. Wey, W.M.; Zhang, H.; Chang, Y.J. Alternative transit-oriented development evaluation in sustainable built environment planning. Habitat Int. 2016, 55, 109–123. [Google Scholar] [CrossRef]
  21. Calthorpe, P.; Fulton, W. The Regional City; Island Press: Washington, DC, USA, 2001; ISBN 9781597266215. [Google Scholar]
  22. Zhu, Z.; Lee, M.; Pan, Y.; Yang, H.; Zhang, L. Analyzing the impact of a planned transit-oriented development on mode share and traffic conditions. Transp. Plan. Technol. 2018, 41, 816–829. [Google Scholar] [CrossRef]
  23. Yuan, R.Q.; Tao, X.; Yang, X.L. CO2 emission of urban passenger transportation in China from 2000 to 2014. Adv. Clim. Chang. Res. 2019, 10, 59–67. [Google Scholar] [CrossRef]
  24. Loo, B.P.Y.; du Verle, F. Transit-oriented development in future cities: Towards a two-level sustainable mobility strategy. Int. J. Urban Sci. 2017, 21, 54–67. [Google Scholar] [CrossRef]
  25. Bamwesigye, D.; Hlavackova, P. Analysis of sustainable transport for smart cities. Sustainability 2019, 11, 2140. [Google Scholar] [CrossRef] [Green Version]
  26. Calthorpe, P. The Next American Metropolis: Ecology, Community, and the American Dream; Princeton Architectural Press: New York, NY, USA, 1993. [Google Scholar]
  27. Dock, F.C.; Swenson, C.J. Transit-Oriented Urban Design Impacts on Suburban Land Use and Transportation Planning. Transp. Res. Rec. 2003, 1831, 184–192. [Google Scholar] [CrossRef]
  28. Cervero, R.; Kockelman, K. Travel demand and the 3Ds: Density, diversity, and design. Transp. Res. Part D Transp. Environ. 1997, 2, 199–219. [Google Scholar] [CrossRef]
  29. Ewing, R.; Cervero, R. Travel and the built environment: A synthesis. Transp. Res. Rec. 2001, 1780, 87–114. [Google Scholar] [CrossRef] [Green Version]
  30. Jerde Places: D-Cube City. Jerde 2011. Available online: https://www.jerde.com/places/detail/d-cube-city (accessed on 20 September 2019).
  31. Creative Housing Associates. Transit Oriented Development: Three Case Studies. 2009. Available online: http://railvolution.org/rv2009_pdfs/20091031_10am_PrivFund_Dieden.pdf (accessed on 31 October 2019).
  32. Knowles, R.D. Transit Oriented Development in Copenhagen, Denmark: From the Finger Plan to Ørestad. J. Transp. Geogr. 2012, 22, 251–261. [Google Scholar] [CrossRef]
  33. Jaffe, E. The Secret to Tokyo’s Rail Success. Available online: https://www.citylab.com/transportation/2012/05/secret-tokyos-rail-success/2044/ (accessed on 18 May 2012).
  34. Xue, C.Q.L.; Zhai, H.; Roberts, J. An urban island floating on the MTR station: A case study of the West Kowloon development in Hong Kong. Urban Des. Int. 2010, 15, 191–207. [Google Scholar] [CrossRef]
  35. Kwon, Y. Sejong Si (City): Are TOD and TND models effective in planning Korea’s new capital? Cities 2015, 42, 242–257. [Google Scholar] [CrossRef]
  36. Jacobson, J.; Forsyth, A. Seven American TODs: Good Practices for Urban Design in Transit-Oriented Development Projects. J. Transp. Land Use 2008, 1, 51–88. [Google Scholar] [CrossRef] [Green Version]
  37. Renne, J.L. From transit-adjacent to transit-oriented development. Local Environ. 2009, 14, 1–15. [Google Scholar] [CrossRef]
  38. Li, Z.; Han, Z.; Xin, J.; Luo, X.; Su, S.; Weng, M. Transit oriented development among metro station areas in Shanghai, China: Variations, typology, optimization and implications for land use planning. Land Use Policy 2019, 82, 269–282. [Google Scholar] [CrossRef]
  39. Tilahun, N.; Fan, Y. Transit and job accessibility: An empirical study of access to competitive clusters and regional growth strategies for enhancing transit accessibility. Transp. Policy 2014, 33, 17–25. [Google Scholar] [CrossRef]
  40. Renne, J.L. Evaluating transit-oriented development using a sustainability framework: Lessons from Perth’s network city. In Proceedings of the Transportation Research Board 87th Annual Meeting, Washington, DC, USA, 13–17 January 2008. [Google Scholar]
  41. Simon, D.; Arfvidsson, H.; Anand, G.; Bazaz, A.; Fenna, G.; Foster, K.; Jain, G.; Hansson, S.; Evans, L.M.; Moodley, N.; et al. Developing and testing the Urban Sustainable Development Goal’s targets and indicators—A five-city study. Environ. Urban. 2016, 28, 49–63. [Google Scholar] [CrossRef]
  42. Valencia, S.C.; Simon, D.; Croese, S.; Nordqvist, J.; Oloko, M.; Sharma, T.; Taylor Buck, N.; Versace, I. Adapting the Sustainable Development Goals and the New Urban Agenda to the city level: Initial reflections from a comparative research project. Int. J. Urban Sustain. Dev. 2019, 11, 4–23. [Google Scholar] [CrossRef] [Green Version]
  43. Galelo, A.; Ribeiro, A.; Martinez, L.M. Measuring and Evaluating the Impacts of TOD Measures—Searching for Evidence of TOD Characteristics in Azambuja Train Line. Procedia Soc. Behav. Sci. 2014, 111, 899–908. [Google Scholar] [CrossRef] [Green Version]
  44. Li, C.; Lai, T. Sustainable Development and Transit-Oriented Development Cities in Taiwan. In Proceedings of the Annual International Sustainable Development Research Conference 2006, Hong Kong, China, 6–8 April 2006. [Google Scholar]
  45. Altef, A.N.; Mokhtarian, H.; Shokri, F.; Ismail, A.; Rahmat, R.A.O.K. Switching model for private vehicles to public transportation system in case of sana’a. Res. J. Appl. Sci. Eng. Technol. 2013, 6, 2366–2372. [Google Scholar] [CrossRef]
  46. Dell’Olio, L.; Ibeas, A.; Dominguez, A.; Gonzalez, F. Passenger preference analysis: Light rail transit or bus versus car. Transport 2012, 27, 276–285. [Google Scholar] [CrossRef]
  47. Lund, H. Reasons for living in a transit-oriented development and associated transit use. J. Am. Plan. Assoc. 2006, 72, 357–366. [Google Scholar] [CrossRef]
  48. Papa, E.; Bertolini, L. Accessibility and Transit-Oriented Development in European metropolitan areas. J. Transp. Geogr. 2015, 47, 70–83. [Google Scholar] [CrossRef] [Green Version]
  49. Ewing, R.; Tian, G.; Park, K.; Sabouri, S.; Stinger, P.; Proffitt, D. Comparative case studies: Trip and parking generation at Orenco Station TOD, Portland Region and Station Park TAD, Salt Lake City Region. Cities 2019, 87, 48–59. [Google Scholar] [CrossRef]
  50. Dell’Isola, P. Value Engineering: Practical Applications for Design, Construction, Maintenance & Operations; John Wiley & Sons: Hoboken, NJ, USA, 2014; ISBN 0876294638. [Google Scholar]
  51. Xu, J.; Lu, Y.; Huang, L. Application of Value Engineering in Urban Planning Practice-3 Cases at Different Levels. In Proceedings of the 22nd International Conference on Industrial Engineering and Engineering Management 2015; Atlantis Press: Paris, France, 2016; pp. 383–391. [Google Scholar]
  52. Berawi, M.A. Empowering Added Value in Highway Project: A Strategy to Improve the Feasibility. Available online: https://www.intechopen.com/books/highway-engineering/empowering-added-value-in-highway-project-a-strategy-to-improve-the-feasibility (accessed on 6 December 2017).
  53. In, C.S.; Nam-kung, I.; Hyun, C.T. A study on the consecutiveness of the function analysis and idea creation phase with function integration (FI) and hierarchical value engineering concept modules(HVECM). In Proceedings of the Society of American Value Engineers—48th Annual Conference of SAVE International 2008: Discovering Value Added Strategies, Reno, Nevada, 9–12 June 2008. [Google Scholar]
  54. Husin, A.E.; Berawi, M.A.; Dikun, S.; Ilyas, T.; Berawi, A.R.B. Forecasting demand on mega infrastructure projects: Increasing financial feasibility. Int. J. Technol. 2015, 6, 73–83. [Google Scholar] [CrossRef]
  55. Woodhead, R.M.; Berawi, M.A. An alternative theory of idea generation. Int. J. Manag. Pract. 2008, 3, 1. [Google Scholar] [CrossRef]
  56. Berawi, M.A.; Woodhead, R. The If-Then Modelling Relationship of Casual Function and Their Conditioning Effect on Intentionality. Value World 2005, 28, 16. [Google Scholar]
  57. Berawi, M.A.; Susantono, B. Developing conceptual design of mega infrastructure project: Creating innovation and added value. In Proceedings of the SAVE Value Summit 2013, Arlington, VA, USA, 24–27 June 2013. [Google Scholar]
  58. Berawi, M.A.; Sunardi, A.; Ichsan, M. Chief-screen 1.0 as the internet of things platform in project monitoring & controlling to improve project schedule performance. Procedia Comput. Sci. 2019, 161, 1249–1257. [Google Scholar]
  59. Berawi, M.A.; Susantono, B.; Miraj, P.; Berawi, A.R.B.; Rahman, H.Z.; Husin, A. Enhancing Value for Money of Mega Infrastructure Projects Development Using Value Engineering Method. Procedia Technol. 2014, 16, 1037–1046. [Google Scholar] [CrossRef] [Green Version]
  60. Berawi, M.A.; Nabila, A.; Miraj, P.; Rahman, H.A.; Berawi, A.R.B. Analysis of life cycle cost and public-private partnership in the development of Walini City as technology park. Int. J. Technol. 2018, 9, 1469–1479. [Google Scholar] [CrossRef] [Green Version]
  61. Berawi, M.A.; Ibrahim, B.E.; Miraj, P. Developing a conceptual design of transit-oriented development to improve urban land use planning. J. Des. Built Environ. 2019, 19, 40–48. [Google Scholar]
  62. LRT Jabodebek Proyek LRT Jabodebek 2016. Available online: https://www.rukamen.com/blog/pembangunan-proyek-lrt-di-jakarta/ (accessed on 28 May 2019).
  63. Cohon, J.L. Multiobjective Programming and Planning; Dover Books on Computer Science; Dover Publications: Mineola, NY, USA, 2013; ISBN 9780486153070. [Google Scholar]
  64. Lund, H.M.; Cervero, R.; Willson, R. Travel Characteristics of Transit-Oriented Development in California; California Department of Transportation: Sacramento, CA, USA, 2004. [Google Scholar]
  65. Loo, B.P.Y.; Chen, C.; Chan, E.T.H. Rail-based transit-oriented development: Lessons from New York City and Hong Kong. Landsc. Urban Plan. 2010, 97, 202–212. [Google Scholar] [CrossRef]
  66. Loo, B.P.Y.; Cheng, A.H.T.; Nichols, S.L. Transit-oriented development on greenfield versus infill sites: Some lessons from Hong Kong. Landsc. Urban Plan. 2017, 167, 34–48. [Google Scholar] [CrossRef]
  67. Ratner, K.A.; Goetz, A.R. The reshaping of land use and urban form in Denver through transit-oriented development. Cities 2013, 30, 31–46. [Google Scholar] [CrossRef]
  68. Hendrigan, C.; Newman, P. Dense, mixed-use, walkable urban precinct to support sustainable transport or vice versa? A model for consideration from Perth, Western Australia. Int. J. Sustain. Transp. 2017, 11, 11–19. [Google Scholar] [CrossRef]
  69. Soltani, A.; Kono, N. Transit-oriented development versus car-oriented sprawl: The story of Tokyo and Adelaide. In Proceedings of the 29th Australian Transport Research Forum (ATRF), Gold Coast, Australia, 27–29 September 2006; pp. 1–15. [Google Scholar]
  70. Kato, H. Urban Rail Development in Tokyo: Integrated Public Transportation Planning; The University of Tokyo: Tokyo, Japan, 2012. [Google Scholar]
  71. Nuzir, F.A.; Dewancker, B.J. From Sustainable to Low Carbon City: Zero Emission Urban Mobility in Japanese Cities. In Proceedings of the 11th International Conference of Asia Institute of Urban Environment, Daegu, Korea, 11–14 July 2014; pp. 3–8. [Google Scholar]
  72. Adler, D. Metric Handbook: Planning and Design Data; Architectural Press: Oxford, UK, 1999; ISBN 9780750608992. [Google Scholar]
  73. Engineering ToolBox Building Area per Person. Eng ToolBox 2003. Available online: https://www.engineeringtoolbox.com/number-persons-buildings-d_118.html (accessed on 28 May 2019).
  74. Kwoka, G.J.; Boschmann, E.E.; Goetz, A.R. The impact of transit station areas on the travel behaviors of workers in Denver, Colorado. Transp. Res. Part A Policy Pract. 2015, 80, 277–287. [Google Scholar] [CrossRef]
  75. Evans, J.E.; Pratt, R.H. Transit Oriented Development: Traveler Response to Transportation System Changes; National Academy of Sciences: Washington, DC, USA, 2007; ISBN 9780309098922. [Google Scholar]
  76. Pan, H.; Li, J.; Shen, Q.; Shi, C. What determines rail transit passenger volume? Implications for transit oriented development planning. Transp. Res. Part D Transp. Environ. 2017, 57, 52–63. [Google Scholar] [CrossRef]
Figure 1. Eight archetypal transit-oriented development (TOD)forms under the ‘node-tie-place’ model [38].
Sustainability 12 03798 g001
Figure 2. Research workflow.
Sustainability 12 03798 g002
Figure 3. Jakarta light rail transit (LRT) routes and its urban context [62].
Sustainability 12 03798 g003
Figure 4. Floor area proportion of benchmark TOD.
Sustainability 12 03798 g004
Figure 5. Function analysis system technique (FAST) diagram of TOD.
Sustainability 12 03798 g005
Figure 6. Floor area usage of the existing Jakarta TOD Development Plans.
Sustainability 12 03798 g006
Figure 7. Proposed benchmark TOD model.
Sustainability 12 03798 g007
Figure 8. Optimized mixed-use allocation for the TOD in the Jakarta LRT station area.
Sustainability 12 03798 g008
Table 1. TOD Variables.
Dependent VariableIndependent Variables
Density
-
Floor area ratio (FAR)
-
Gross floor area (GFA)
Diversity
-
Residential
-
Office
-
Hotel
-
Retail/
-
Commercial
-
Other
Design
-
Building configuration
-
Development configuration
Destination accessibility
Distance to transit
Table 2. Composition of the land use allocation of the benchmark TOD.
Property TypeFloor Area UsageRange
Union SquareNamba ParksD’Cube City
Residentialm2608,02660,000110,30024–56%
%56%24%26%
Officem2231,77860,00024,4806–24%
%21%24%6%
Hotelm2167,472018,3604–15%
%15%0%4%
Retail/commercialm282,75086,000107,8008%-34%
%8%34%25%
Othersm2044,700171,00012–39%
%0%18%39%
Total GFAm21,090,026250,700431,940
Total land aream2135,00033,70063,600
FAR 8.057.236.57
Table 3. Land use of the Jakarta TOD.
Property TypeJaticempakaCiracasCibuburBekasi Timur
Residentialm2116,266206,612150,000150,000
%69%72%94%84%
Officem2----
%----
Hotelm2----
%----
Retail/commercialm218,60018,67210,00010,000
%11%7%6%6%
Othersm233,42361,426-18,100
%20%21%-10%
Total GFAm2168,289286,710160,000178,100
Table 4. Rail modal split (commuting trips) in Tokyo.
YearModal Split Reference
200664%Soltani and Kono [69]
201273%Tokyo Metropolitan Transport Census [70]
201461%Nuzir and Dewancker [71]
Table 5. Rail modal split to the hotel in California, USA. Source: [64].
Night of StayRail Modal Split
175%
2–318.8%
4–540%
5–825%
Average 44.17%
Table 6. Parameter values determining the function of objective ridership.
DevelopmentMinimum Required Space Per Person (m2/person)Person/m2Modal Split TrainEstimation of Train Trip
Person /m2
Apartments 9.290.1173%0.08
Offices and bank 4.650.2273%0.16
Hotel 50.258.6%0.12
Retail/Commercial4.620.2242.8%0.09
Table 7. Ridership evaluation of the existing Jakarta TOD Development Plans.
TOD ProjectDevelopmentEstimation of Daily Ridership
ResidentialOfficeHotelRetailOthers
m2%m2%m2%m2%m2%
Jaticempaka116,26669----18,6001133,42320 10,858
Ciracas206,61272----18,672761,42621 17,964
Cibubur150,00094----10,0006-- 12,713
Bekasi Timur150,00084----10,000618,10010 12,713
Table 8. Ridership evaluation of the benchmark-based Jakarta TOD.
TOD ProjectDevelopmentGFA
(m2)
Estimation of Daily Ridership
ResidentialOfficeHotelRetailOthers
m2%m2%m2%m2%m2%
Jaticempaka74,0474430,2921816,8291026,9261620,19512168,28915,043
Ciracas26,1524451,6081828,6711045,8741634,40512286,71025,629
Cibubur70,4004428,8001816,0001025,6001619,20012160,00014,303
Bekasi Timur78,3644432,0581817,8101028,4961621,37212178,10015,921
Table 9. Optimum TOD design of the Bekasi Timur station area.
DevelopmentQuantityUnitProportion
Residential42,744 m224%
Office 42,744 m224%
Hotel26,715 m215%
Retail44,525m225%
Others21,372 m212%
Ridership17,328trips
Table 10. Ridership evaluation of the optimized Jakarta TOD.
TOD ProjectDevelopmentEstimation of Daily Ridership
ResidentialOfficeHotelRetailOthers
m2%m2%m2%m2%m2%
Jaticempaka40,3892440,3892425,2431542,0722520,1951216,374
Ciracas68,8102468,8102443,0071571,6782534,4051227,895
Cibubur38,4002438,4002424,0001540,0002519,2001215,567
Bekasi Timur42,7442442,7442426,7151544,5252521,3721217,328
Table 11. Additional ridership of benchmark and optimized design compared to the ridership of the existing TOD plan.
Case StudyPercentage of Additional Ridership Compared to Existing TOD Design Plan
Benchmark-Based Design (%)Optimized Design (%)
Jaticempaka3951
Ciracas4355
Cibubur 1322
Bekasi Timur 2536

