Abstract
In eastern China, where air pollution is severe and government regulations are being tightened, green economic development has become the government’s goal. This paper makes an improvement in the measurement of the Green Total Factor Productivity (GTFP) index, and an intensity measure method reciprocal of the ratio of air pollutant emissions to the GDP is adopted to estimate the level of air pollution regulation. Applying an air pollution monitoring data sample of 87 cities in eastern China, empirically tests the relationship between air pollution regulation, technological investment, and green economic growth. The positive influence of air pollution regulation on GTFP in the Beijing-Tianjin-Hebei region is higher than that in the Yangtze River Delta region. Therefore, improving the coordinated monitoring mechanism of environment and economic development can achieve co-benefits. Technological investment can promote the improvement of GTFP, but it could have a negative impact on green technology progress in the Beijing-Tianjin-Hebei region. The output efficiency of technological investment should be improved. Technological investment has a positive influence on green technology efficiency and green technology progress in the Yangtze River Delta. The robustness test suggests that the influence direction and significance of the core variables were unchanged, which supports the research conclusion.
1. Introduction
The global economy is highly integrated, and global value chain production mode is increasingly prevalent. In China’s participation in the global vertical specialization of production, along with sustained and rapid growth of the domestic economy, the extensive industries with high energy consumption and pollution, and low added value are growing too fast [1]. Growing problems include the consumption of petrochemical energy growing continuously, the supply of resources being tight, environmental damage and air pollution increasing in severity, and increasing dependence on foreign markets for energy, minerals, and other raw materials [2]. In 2018, fossil energy consumption accounted for about 80% of China’s total energy consumption, significantly surpassing that of the United States and ranking first in the world. Renewable energy accounted for 14.3% of China’s primary energy supply and only about 20% of its consumption [3]. The supply of nuclear power, hydropower, and other renewable energy is too low, making air pollution more and more serious and the necessity of green, sustainable economic development in China increasingly urgent.
China has recently given more focus on environmental protection and has gradually improved the legislation of environmental protection and air pollution monitoring system. While the increasing intensity of environmental regulation plays a certain role in reducing environmental pollution, scientific and technological innovation indispensably provide a sustained impetus for energy conservation, emission reduction, and green economic development. It is an important guarantee for the green, sustainable development of China’s economy to improve resource use efficiency and cleanliness through scientific and technological innovation and to solve the environmental pollution and damage caused by industrial development.
Air pollution monitoring data is used as the basis for objective assessment of the environmental quality, reflecting the effect of pollution control, and implementing environmental management and decision-making, and its role in environmental governance and economic green development is increasingly important. Due to that environmental pollution has negative externalities, the government will regulate the environment of production and operation activities. Environmental regulations can effectively correct system failures and promote the efficient allocation of environmental resources, which will trigger technological innovation effects and improvements in production processes and technologies, reduce the intensity of pollution emissions, increase production efficiency, and slow or offset the increased environmental costs of environmental regulations [4,5,6]. Recently, China has strengthened environmental governance and established a relatively complete and real-time ecological environment monitoring network, which is responsible for the management and operation of environmental monitoring in air and ecology, effectively promoting green economic development [7,8,9]. Regarding the relationship between technology and environmental regulation, the environmental regulation of a certain region can regulate the relationships among local green credit, green technological innovation, and economic growth. At the same time, environmental regulations will inevitably require the government to adjust some existing policies and regulations and formulate corresponding incentive measures, such as green subsidies and preferential funding, which will undoubtedly stimulate technological innovation. Environmental regulations will also reduce the launch of high-energy and high-pollution projects and, in turn, increase the supply of green innovation projects, triggering advanced industrial structures and low-carbon energy consumption, which promotes the growth of GTFP. However, due to differences in geospatial heterogeneity, the role of environmental regulation in technological innovation may also be undefined [10,11,12]. Studies in South Korea show that the environmental regulations had barely influenced the economic growth from 1980 to the mid-1990s. For countries where environmental regulations are relatively weak, the pollution industries often have relatively strong investments [13,14]. The regulatory stringency can increase the R&D investment in Japan. Furthermore, the R&D investment can stimulate the increase of total factor productivity (TFP) [15]. Environmental regulations have a positive impact on the development of the technological change [16]. Using detailed production data of America, Greenstone et al. suggest that air quality regulations can influence the manufacturing plants’ TFP levels [17]. Das et al. suggest that environmental and technological policy can improve the level of TFP in the US [18]. By increasing the investment related to science and technology, strengthening research and development (R&D) of energy-saving and emission reduction technologies and new energy technologies, and introducing energy-saving and environmental protection technologies, can reduce emissions of pollutants such as industrial waste gas, which is conducive to environmental governance and economic green growth [19,20,21]. As important engines that drive economic growth and productivity changes, inputting science and technology is an important part of the competition strategy of enterprises, industries, and even the country, which profoundly affects the economic and social development situation. The investment related to science and technology can also have a spillover effect on economic development, social development, and the ecological environment by affecting capital, manpower, and technology, promoting high-quality economic development. Increasing investment related to science and technology will help ameliorate the ability of enterprises to innovate independently, promote the energy conservation and emission reduction for industrial enterprises, and improve the green production efficiency of industrial products, which will significantly promote the level of regional green development [22,23,24]. There is a significant negative correlation among renewable energy consumption, R&D expenditure, and carbon emission [25]. Intellectual property has an incentive effect on technological innovation, and energy technological innovation plays an important role in the low-carbon green economy, which can accelerate the flow of knowledge and technology in various fields, promote innovation and sharing, and promote labor productivity and greenness [26,27,28]. Green technology innovation can promote environmental governance and sustained economic growth. Technological progress is the main driving force for reducing carbon emissions [29,30]. Foreign direct investment will help reduce the cost of introducing advanced technology in China, promote the flow and application of advanced technology in China, bring a technology spillover effect. The cross-border flow of factors has optimized the efficiency of resource allocation, which has significantly stimulated the rapid development of China’s economy. Considering the high environmental pollution costs, developed countries will transfer some pollution-intensive enterprises to developing countries with loose environmental regulations to reduce the cost of pollution control. However, the induced technical change is likely to change the pollution haven effect [31]. The advanced technology and technology spillover brought by foreign direct investment can ameliorate the utilization level of energy and resources and the cleanliness of production through a demonstration effect and correlation effect [32]. A competition effect can stimulate the host country’s enterprise, increasing R&D investment, improve the level of clean technology innovation, and reduce energy consumption and pollutant emissions. Some scholars also think that the level of environmental regulation in developing countries is low, and the investment of developed countries has a significant effect on the environmental pollution of host countries, which is not conducive to the promotion of green total factor productivity nor will it improve the efficiency and level of green technology. In order to enhance their competitiveness in attracting foreign investment, developing countries reduce the level of environmental regulation to introduce some pollution-intensive industries and low-tech industries will increase environmental pollution and hinder the improvement of GTFP [33,34]. The impact of GTFP in the host country is influenced by elements such as the environmental regulation level, financial development level, investment level, innovation heterogeneity, etc., which has uncertainty and time-varying effect. Investment in fixed assets is an important public good for stable economic development and plays a role in improving transportation logistics, human capital, and the ecological environment [35,36]. The optimal investment in fixed assets of the energy industry not only reduces the cost of the energy industry, but it also avoids the environmental deterioration caused by excessive investment [37]. Investment in environmental technology has a significant positive influence on the total factor productivity of enterprises. The green transformation and development of the economy are also inseparable from large-scale infrastructure construction, but the environmental pressure brought by the construction process and the negative effects of resource mismatch and low returns caused by excessive investment are not conducive to the development of green economy [38,39]. Financial development affects the rational flow and optimal allocation of resources, improves the efficiency of resource allocation and the productivity of green technologies, and directly promotes the improvement of GTFP. The policies related to financial liberalization and openness, which can increase the levels of R&D-related foreign direct investment, maybe lessen environmental degradation [40]. Financial development will bring new entrants to some highly polluting industries, resulting in the negative influence of financial development on the environment. There is uncertainty about the impact of financial development on the environment and green economy [41,42]. The existing research literature about air pollution under the background of environmental regulation as well as investment in science and technology to study economic growth tend to focus on the influence of environmental regulation of science and technology into single core variables. Under the demands of the development of green ecological quality and environmental regulation, the investment related to science and technology and the breakthrough of technical innovation and efficiency are very important for high-quality and economic development, the influence of the two variables should be focused on. The rapid development of China’s economy and the serious air pollution are closely related to the substantial increase of foreign direct investment with high energy consumption and pollution, and low value added after the reform and opening up. While the influence of variables such as foreign direct investment should also be emphasized, the existing literature has paid less attention to this issue. For the measurement of economic development level, scholars often adopt the traditional total factor productivity index, which does not include energy consumption, pollutant emission, or other environmental constraints and cannot accurately measure the ecological benefits of economic development. Some literature has incorporated environmental factors into the productivity analysis, mainly based on the data at the provincial level, and calculated the directional distance function with radial and oriented data envelopment analysis (DEA). However, when there is excessive input or insufficient output—that is, there is non-zero slack—the radial DEA efficiency measure overestimates the efficiency of the evaluation object, while the angular DEA efficiency measure ignores a certain aspect of input or output, so the efficiency result is not accurate.
Research of this paper is based on the radial and the angle of the directional distance functions, and it aims to construct a set of production possibilities for unintended output of environmental pollution. An intensity measurement method was used to estimate the level of environmental regulation, avoiding the bias caused by proxy variables, such as per capita Gross Domestic Product (GDP) and operating costs of pollution control facilities. Considering the cumulative effects of technological investment and foreign investment, the stock data is measured using the perpetual inventory method, and price index deflators are processed. The differential impacts of the two important economic regions (Beijing-Tianjin-Hebei and the Yangtze River Delta) were verified, the influencing factors of regional differentiation were identified, and suggestions for green economic development were put forward according to local conditions.
2. Air Pollution Monitoring in China
In last decade, the Ministry of Ecology and Environment of China established a dynamic monitoring network of air pollution, actively promoted the key projects of air pollution cause and treatment, coordinated treatment of greenhouse gases and pollutants, carried out various low-carbon pilot demonstrations, and promoted the work related to adaptation to climate change. Yangtze River ecological environment protection and restoration joint research center was established to promote the construction of the early warning system for toxic and harmful gases in the National Chemical Industry Park. China’s environmental dynamic monitoring network includes 1436 urban environmental air quality monitoring points in 338 prefecture-level cities and above, which can provide real-time and comprehensive data streams of air pollution and play a great role in strengthening environmental governance. In order to grasp the situation and dynamic change of air pollution in China from the micro-level, this paper reveals a study of the environmental governance based on the monitoring streaming data of air pollution in China in 2016.
As can be seen from Figure 1 and Table 1, among 338 prefecture-level and above cities in China, 84 cities met the air quality standard, accounting for 24.9% of the total, an increase of 6.5 percentage points over the previous year. Air quality in 254 cities exceeded standards, accounting for 75.1%. The average number of excellent days in 338 cities was 78.8%, and the average number of days exceeding the standard was 21.2%. In 338 cities, severe pollution occurred over 2464 days. The number of days with particulate matter PM2.5 as the primary pollutant accounts for 80.3% with heavy pollution or above, the number of days with PM10 as the primary pollutant accounts for 20.4%, and the number of days with O3 as the primary pollutant accounts for 0.9%. The concentrations of PM2.5, PM10, O3, SO2, NO2, and CO were 47, 82, 138, 22, 30, and 1.9 μg/m3, respectively. The ratio of days exceeding the standard was 14.7%, 10.4%, 5.2%, less than 0.5%, 1.6%, and 0.4%, respectively. Compared with 2015, the concentration of O3 and the proportion of days that exceeded the standard increased, while the concentration of the other five indicators and the proportion of days that exceeded the standard decreased [43].

Figure 1.
Proportion distribution of six air pollutants in 338 cities in different concentration ranges in 2016.

Table 1.
Interpretation of air quality-related indicators.
In 2016, the average excellent days ratio of 74 key regional cities and provincial capitals was 74.2%, 3.0 percentage points higher than that of the previous year. The number of days with PM2.5 as the primary pollutant accounted for 57.5% of the total number of days exceeding the standard, the number of days with O3 as the primary pollutant accounted for 30.8%, the number of days with PM10 as the primary pollutant accounted for 10.5%, the number of days with NO2 as the primary pollutant accounted for 1.6%, and the number of days with SO2 as the primary pollutant was less than 0.1%. As can be seen from Table 2, Compared to the previous year, the concentration and the proportion of days exceeding the standard of the other five indicators except O3 pollution source decreased.
Table 2.
Changes in pollutant concentrations in the Beijing-Tianjin-Hebei region and the Yangtze River Delta region in 2016.
In Beijing-Tianjin-Hebei region, the percentage of excellent days ranged from 35.8% to 78.7%, with an average of 56.8%, an increase of 4.3 percentage points compared to 2015. The average number of days exceeding the standard in the Beijing-Tianjin-Hebei region was 43.2%, of which light pollution is 25.3%. In general, the air pollution situation has improved. The proportion of excellent days in nine cities is between 50% and 80%, and the proportion of excellent days in four cities is less than 50%. Among the exceeding days, the days with O3 and PM2.5 as the primary pollutants accounted for 26.3% and 63.1% of the total exceeding days, respectively. CO as the primary pollutant was less than 0.1%, and no pollution days with SO2 as the primary pollutant occurred. In the Yangtze River Delta region, the percentage of excellent days in the 25 cities ranged from 65.0% to 95.4%, with an average of 76.1%, an increase of 4.0 percentage points from 2015, which is better than the environmental conditions of Beijing-Tianjin-Hebei and surrounding areas. The average number of days exceeding the standard in the Yangtze River Delta region was 23.9%, of which light pollution was 19.0%. The percentage of excellent days in seven cities is between 80% and 100%, and the percentage of excellent days in 18 cities is between 50% and 80%. Among the exceeding days, the days with O3 and PM2.5 as the primary pollutants accounted for 39.8% and 55.3% of the total exceeding days. There are no pollution days with SO2 and CO as the primary pollutants [43].
3. Empirical Methods and Data Sources
3.1. Research Questions
Based on the analysis of microdata streams for air pollution monitoring, macro data streams for annual air pollution monitoring from the provinces (municipalities) with more international industries and more severe environmental pollution in China from 2007–2016 were adapted to test the relationship between environmental regulations, technology investment, and green economic growth. It also examines the impact of regional differences in the Beijing-Tianjin-Hebei region and the Yangtse River Delta region.
3.2. Empirical Model Construction
In this study, and the green technology efficiency index, with the green technology progress index based on it are taken as explained variables to conduct the empirical research. By combing and analyzing the literature and impact mechanisms, we can know that the core influencing factors of GTFP include the level of environmental regulations and the level of technological input, as well as the level of foreign direct investment, the level of fixed asset investment, and the level of financial industry services. Therefore, it was expanded according to the needs of the research, based on the theoretical model [44]. Assuming the form of the production function is , standard production functions can be extended to
where denotes city output level, denotes considering energy input and unexpected output, denotes environmental regulations, denotes development input, denotes actual utilization of foreign capital, denotes the level of fixed assets investment, denotes the financial industry service level, denotes the capital factor input, and indicates the labor factor input. In Equation (1), represents technological progress function in Helix’s neutral. Given its multiple combinations, can be expressed as follows
Putting (2) into (1) gives
where indicates the initial production technology efficiency level, indicates exogenous production technology change, , , , indicate the elasticity coefficient of environmental regulation intensity, technology investment, actual utilization of foreign investment level, fixed asset investment level, and financial industry service level, respectively, while indicates city, and indicates time.
Dividing both sides of Equation (3) by to get the calculation formula of the :
Equation (4) is expressed in a logarithmic form of the variables as follows:
, indicates the city fixed effect, indicates the time fixed effect and indicates a stochastic error.
3.3. Variable Selection and Data Source
3.3.1. Measurement and Data Interpretation of the Explained Variable
This paper refers to the production possibility set includes expected and undesired outputs [45] and uses the Malmquist–Luenberger index based on the non-radial and non-angle slack based measure (SBM) directional distance to calculate the in eastern cities and its decomposition of green technology efficiency and technological progress index values. The calculation of the index covers labor, capital, and energy inputs. At the same time, the increase in expected output and the decrease in undesired output are integrated into the calculation of productivity indicators. This is consistent with the overall tone of green ecology and high-quality development and can better measure development level and quality. The index is the relative change rate of the index in the previous year. Therefore, the cumulative and dynamic change value of the urban in each year is obtained with the base period as 1.
The Malmquist–Luenberger index [45] from period to can be expressed as:
where is the directional distance function, while , , and are the input index, expected output, and undesired output, respectively.
, represents the efficiency of green technology. It measures the extent to which each decision-making unit catches up with the boundary of production possibility from to , and characterizes the output growth stimulated by the change in internal efficiency, that is, the “catching-up effect.”, and greater than 1 means that the efficiency of green technology in period t+1 is improved compared with that in period t. measures the degree of approach of each decision-making unit from to to the optimal production frontier. It represents the increase in output caused by technological progress, and greater than 1 indicates green technological progress.
Reasonable selection and measurement of input indicators. Labor input: This indicator is expressed by the number of employed people in each city. Capital input: Calculated using the “perpetual inventory method,” where is the city, is the year, and K, I, and represent the capital stock, investment amount, and depreciation rate, respectively. These deflate to the capital stock of constant price with 2006 as the base period. The depreciation rate is set to 15% [46]. The price index is set to 0.5 multiply the producer price index plus 0.5 multiply the fixed asset investment price index. The relevant data comes from the statistical yearbooks of various provinces and cities over the years as well as the China City Statistical Yearbook. Reasonable selection and measurement of output indicators. Expected output is urban GDP. This article selects the expression of urban GDP and uses 2006 as the base period and the price index to eliminate the influence of price factors. Unexpected output is sulfur dioxide emission and smoke emission. The data were obtained from statistical yearbooks of various provinces and cities and the China City Statistical Yearbook over the years.
3.3.2. Measurement and Data Interpretation of Explanatory Variables and Control Variables
The core explanatory variables are the intensity of environmental regulation and technological input, and the control variables include foreign direct investment, fixed asset investment levels, and financial industry service levels. Environmental regulation () measures can generally be measured by finding proxy variables, such as per capita GDP, pollution control facility costs, and pollutant emissions per unit of output. Taking into account the scientific nature of the indicator and the availability of data, this article uses the reciprocal of the ratio of industrial sulfur dioxide emissions and industrial smoke (dust) emissions to the GDP. The higher the indicator value, the stronger the intensity of environmental regulations. Variable unit: %. Individual missing data on urban pollution emissions are replaced with the average of the past two years. Scientific and technological investment () is expressed by the scientific and technological expenditure in the general budget of local finance. Variable unit: 100 million RMB. Since the cumulative effect and lag effect of technology investment are obvious, the stock data are used for empirical analysis. , represents the stock of science and technology investment in period of city , represents the stock of science and technology input in period of city , represents the depreciation rate for period of city . Setting the depreciation rate directly to 15% [46]. In the stock of technology investment in the base period, calculated as , represents the amount of science and technology investment in period of city , is the average annual growth rate of technology investment from 2007 to 2016, and is the depreciation rate. We have deflated the price index of technology investment and set it to 0.5 multiply fixed asset investment price index plus 0.5 multiply industrial product ex-factory price index.
Foreign direct investment (): Taking into account the obvious cumulative and lag effects of foreign direct investment, the actual use of foreign capital in each city took years to measure. Variable unit: Million dollar. The specific measurement method is the technology investment stock. Investment level of fixed assets () is measured by the total investment in fixed assets in each city. Missing data are replaced with the average of the past two years. Variable unit: 100 million RMB. Financial Industry Service Level () is measured by the balance of financial institutions’ deposits at the end of each year. Variable unit: 100 million RMB. Missing data in individual cities are recursively processed using the average annual growth rate of the past five years.
3.4. Empirical Ideas and Model Selection
In order to more accurately grasp the effect of environmental regulations and technological investment on the growth of and its sources, this article analyzes the green technology efficiency and the progress of green technology based on an empirical test of . The differences in environmental quality observed in the Beijing-Tianjin-Hebei and Yangtze River Delta regions from the microdata stream of air pollution monitoring based on the full sample inspection, empirical tests were performed on the Beijing-Tianjin-Hebei and Yangtze River Delta regions. At the same time, for the sake of reducing the effects of dimensional difference and heteroscedasticity, the variables were logarithmicized.
To ensure that the estimation is valid and avoid false regression, the method of panel unit root was employed to test the stationarity of each series. Table 3 shows the full sample and subregional test results, all variables are stable except for variables. After the first-order difference of the variables is stable, the single integer order of the explanatory variables becomes lower than the order of the explanatory variables. The p-value of cointegration test results is less than 0.01, so the original hypothesis of “no cointegration relationship” can be strongly rejected at the level of 1%, and the cointegration relationship is considered to exist. There is no “pseudo-regression” problem in the regression equation constructed by variables. The variance expansion factor of the explanatory variables is all within 10, there is no problem of multicollinearity. Stata 15.0 measurement software was used to pass the F test, and the “individual effect model” was selected for estimation. The Hausman test also rejected the null hypothesis of random effects, so a fixed effect model was used for regression estimation research. The statistical description of variables in full sample regression is shown in Table 4.
Table 3.
Unit root test of variables in empirical equation.
Table 4.
Statistical description of variables in full sample regression.
4. Results and Discussion
4.1. Full Sample Results and Analysis
The results in Table 5 and Figure 2 show that the regression coefficient of environmental regulation variables () is positive. Environmental regulation has a significantly positive influence on the . Environment regulation has a greater influence on the progress of green technology (), and the impact of green technology efficiency () has not passed the significance tests. The implementation of current environmental regulatory measures helps promote the adoption of advanced production technologies and management systems. It can improve by promoting technological innovation, improvements in production processes and technologies, and environmental regulations that are necessary for green development. The effect of intensive green economic growth that promotes continuous improvement in efficiency has not yet appeared. Investment related to science and technology () can stimulate the improvement of . From the perspective of decomposing sources, it has a significant influence on the improvement of green technology efficiency, but it has a negative influence on the progress of green technology. The current increase in government-led investment in science and technology has increased the efficiency of green technologies by affecting the allocation efficiency of capital and technology elements, attracting talent pools, improving human capital levels, and accelerating the sharing of knowledge and technology in various fields. Investment in science and technology is relatively limited in enterprise technology R&D. The introduction of talents and efficiency-improving scientific and technological funds have squeezed out the independent research and innovation, introduction, and absorption of technology. The impact coefficient of foreign direct investment () is negative, and the negative impact on the progress of green technology is higher than the efficiency of green technology. The sample cities are mainly regions with concentrated foreign direct investment in the east. The foreign-invested industries in these regions are mainly concentrated in the low value-added sectors of labor-intensive industries or capital-intensive industries with high pollution and energy consumption and low added value. Industrial production in these regions is concentrated in low value-added segments of global value chains. The pollution effect of product production on the environment exceeds the effect of technological progress introduced by foreign capital. It is urgent to ameliorate the quality of foreign investment and reduce the level of environmental pollution. The negative impact of fixed asset investment () on green technology efficiency is higher than the positive impact of green technology progress. Large-scale infrastructure-led investments have played an active role in improving transportation logistics, human capital, and the ecological environment. However, the negative effects of resource mismatch and low returns caused by extensive overinvestment are not conducive to the development of the green economy. The financial service () improves , which is reflected in the progress of green technology. It shows that with the reform and opening up, domestic financial funds are becoming increasingly abundant, and the service level of financial institutions is constantly improving, which affects the rational flow of resources, optimizes the allocation, and improves the efficiency of resource allocation and green technology productivity. In recent years, financial institutions, under the guidance of national green ecological development policies, have selected investment companies in terms of credit access, pricing ratings, and priority support. These institutions have guided green technology R&D, playing a positive role in improving .
Table 5.
Environmental regulation, technology investment and dependent variables: , , . (Full sample)
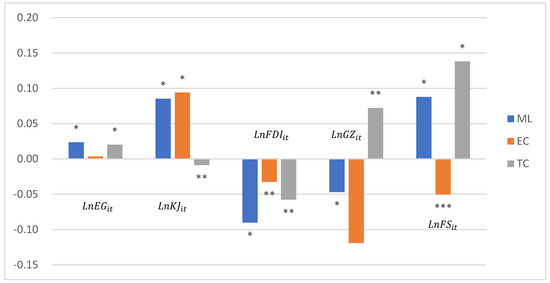
Figure 2.
Coefficient value and significance of variables in full sample regression.; Notes: *** p < 0.01; ** p < 0.05; * p < 0.1
4.2. Beijing-Tianjin-Hebei and Yangtze River Delta Region Sample Results and Analysis
From the regional regression results in Table 6, Figure 3 and Figure 4, the environmental regulation () of the Beijing-Tianjin-Hebei region has a higher positive impact on the GTFP than that of the Yangtze River Delta region. The intensity of environmental regulations in the capital region is greater, and the effect is more obvious. Environmental regulation has a greater influence on the progress of green technology, but the impact of green technology efficiency has not passed the significance test. Due to a large number of highly polluting industrial enterprises in the Beijing-Tianjin–Hebei region and a large number of iron and steel enterprises in Hebei, environmental pollution problems are serious, and the ecological benefits of economic development are not high. In recent years, the state has strengthened environmental regulations and the Beijing-Tianjin-Hebei region has borne the brunt of this. Its industrial structure has been continuously optimized and adjusted, making the growth effect on GTFP more noticeable. The implementation of environmental regulatory measures in the two regions has helped to promote the adoption of advanced production technologies and management systems. While it can promote technological innovation and improve production processes and technologies, it has no obvious effect on improving resource utilization and scale efficiencies.
Table 6.
Environmental Regulation, Technology Investment, and Green Total Factor Productivity in the Beijing-Tianjin-Hebei Region and the Yangtze River Delta Region.
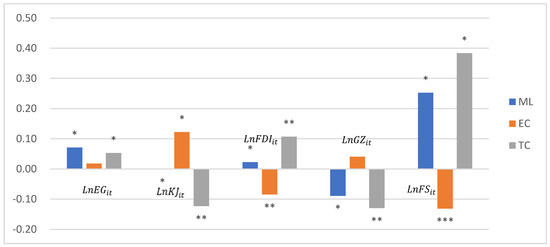
Figure 3.
Coefficient value and significance of variables in Beijing-Tianjin-Hebei Region sample regression. Notes: *** p < 0.01; ** p < 0.05; * p < 0.1
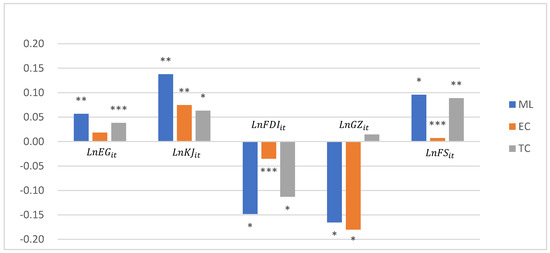
Figure 4.
Coefficient value and significance of variables in Yangtze River Delta Region sample regression. Notes: *** p < 0.01; ** p < 0.05; * p < 0.1.
The investment in science and technology () has a positive effect on the improvement of green technology efficiency in the Beijing-Tianjin-Hebei region and a negative impact on the improvement of green technology progress, yet it has positive impacts on both green technology efficiency and progress in the Yangtze River Delta. The Beijing-Tianjin-Hebei government’s fiscal-led technology investment has played a role in attracting talent, improving human capital, accelerating the flow of knowledge and technology between various fields, and promoting innovation and sharing. However, investment has a squeeze-out effect on independent research and development. The government of the Yangtze River Delta region has more abundant financial funds, higher investment in science and technology, and a better R&D foundation. While improving the efficiency of green technology, it has also promoted enterprise research and innovation, and significantly improved the level of green technology.
The impact coefficient of FDI () on the Beijing-Tianjin-Hebei region is positive, improving the level of green technology progress, but reducing green technology efficiency. The amount of foreign investment in the region is relatively small and located in the economic circle of the capital. In recent years, enterprises have paid more attention to the quality of foreign investment. The accumulation of science, technology, and talent factors caused by the introduction of foreign capital has increased the level of green technology, but the development methods of some industrial enterprises are still relatively extensive, and green technology efficiency requires further improvement. The impact coefficient of the Yangtze River Delta is negative, and the negative influence of FDI on green technology progress is higher than that on green technology efficiency. There is a concentration of foreign direct investments, labor-intensive industries, chemical industries, and other capital-intensive high-polluting industries in the Yangtze River Delta. Although the structure of attracting foreign capital has been actively adjusted in recent years due to the large number and large scale of foreign-funded enterprises, high-energy consumption and high-polluting industries still produce significant air pollution, making it difficult to increase GTFP in the short term.
The negative impact of fixed asset investment () on GTFP has been higher in the Yangtze River Delta region than in the Beijing-Tianjin-Hebei region. The negative impact of the Beijing-Tianjin-Hebei region mainly stems from green technology progress, while the Yangtze River Delta region’s impact stems from green technology efficiency. Beijing-Tianjin-Hebei’s fixed-asset investment failed to improve green enterprise technology after improving transportation logistics, human capital, and the ecological environment. This shows that the problems of extensive investment and repeated construction remain serious. The amount of fixed-asset investment in the Yangtze River Delta region is relatively high, with relatively strong technological and R&D levels. The technological advancement effect of investment is evident, but the economic development mode has remained relatively extensive. Investment efficiency is low, resources are mismatched, low returns, and other problems still exist, and all of these factors are not conducive to green and high-quality economic development.
The promotion effect of the financial service level () on in the Beijing-Tianjin-Hebei region was higher than in the Yangtze River Delta, and the positive effect on green technology progress is clear, yet the negative effect on green technology efficiency was also found in the Beijing-Tianjin-Hebei region. Beijing and Tianjin, as municipalities directly under the Central Government and financial centers, have relatively high levels of financial institution services. Under the constraints of ecological economic development, financial service has a significant role in driving regional green technology progress. The development level of the financial industry in the Yangtze River Delta region is also relatively high, which plays a significant role in guiding the development of green enterprise technologies and affects the rational flow of resources to optimize their allocation and improve . However, the promotion effect was weaker than in the Beijing-Tianjin-Hebei region.
4.3. Robustness Test of Empirical Results
Robustness tests can be expanded generally by replacing the estimation method and variables. If the difference between estimation results before and after the transformation is insignificant, then the estimation results have strong robustness. As it is difficult to obtain data about variables related to independent variables, the generalized least square method of panel data was selected with fixed regression model estimation to re-estimate in order to test the robustness of the effects of environmental regulation and technological investment on (Table 7). The robustness test indicates that although the significance of individual variables has changed, the coefficient value of the model’s core explanatory variables has changed insignificantly, indicating that the research conclusion of this paper has strong robustness. The regression results of Beijing-Tianjin-Hebei region and the Yangtze River Delta region are consistent with the panel fixed effect model, which shows that the final research conclusion is reliable and stable.
Table 7.
Environmental regulation, technology investment, and .
5. Conclusions and Recommendations
The establishment of an energy consumption air pollution monitoring network in China, providing real-time and comprehensive air pollution data streams, has played a great role in strengthening environmental governance. The Yangtze River Delta region is better than the Beijing-Tianjin-Hebei region at air pollution environmental governance. Environment regulation has a significant positive impact on . The positive effect of environmental regulation on in the Beijing-Tianjin-Hebei region is higher than in the Yangtze River Delta region. Environmental regulation has a greater influence on green technology progress than green technology efficiency. The increase in the intensity of environmental regulation improves the TFP of Japan, which has little impact on the economic growth of South Korea and a negative impact on the United States. The differences in research conclusions are mainly related to the time stage of the investigation, the regions involved and the differences of TFP influencing factors in different countries. Science and technology investment can promote and had a positive impact on green technology efficiency in the Beijing-Tianjin-Hebei region. Such investment had a positive influence on green technology efficiency and green technology progress in the Yangtze River Delta. Research on Japan, South Korea, and the United States also shows that technology investment can promote TFP. The influence coefficient of the whole sample of FDI variables was negative, and the negative influence of FDI was stronger on green technology progress than on green technology efficiency. Fixed asset investment had a negative impact on and a stronger negative impact on the Yangtze River Delta region than the Beijing-Tianjin-Hebei region. The improvement of financial service levels has improved the , and the promotion effect was more pronounced in the Beijing-Tianjin-Hebei region than in the Yangtze River Delta region. Based on the analysis results of air pollution monitoring data, environmental regulations, and investment in science and technology on the (combined with the current domestic environment, resource constraints, and industrial development status), the following measures are recommended to improve the effectiveness of air pollution control.
5.1. Improve the Coordinated Monitoring Mechanism of Air Environment and Economic Development to Promote the Improvement of Environmental Governance
Under the rigid constraints of ecological development, air pollution detection networks should be established and strengthened in key regions (such as the eastern provinces and cities, the Beijing-Tianjin-Hebei region, and the Yangtze River Delta region), regional cooperation should be strengthened, joint prevention and control should be achieved, regional green ecological development awareness should be increased, green transformation and upgrading should be achieved, and an ecological security guarantee system should be built. At the same time, the government must grasp the strength and nodes of environmental regulation, especially in the context of increasing economic uncertainty. Enterprises should be given sufficient time and space for green transformation and development. Environmental regulations and policies should be tailored to local conditions and conditions to avoid the negative impact of a “one size fits all” model of economic development. Coordinated monitoring of air pollution and economic development should be realized, ensuring green and sustainable economic development through scientific and reasonable coordinated measures.
5.2. Obtain Investment to Increase Green Technology R&D, Improve R&D Output Efficiency, and Ensure Green and Sustainable Economic Development
The investment in science and technology has a promotion effect on GTFP It should appear as a noun without the italic treatment of the formula. The government should give green science and technology innovation projects that can promote industrial development preferential loans, tax relief, patent protection, and other measures. Doing so will stimulate enthusiasm for enterprise R&D, strengthen technological innovation, and promote green production efficiency. Considering the negative impact of science and technology investment on the improvement of green technology progress in the Beijing-Tianjin-Hebei region, it is necessary to establish an efficient R&D decision support system, formulate scientific and reasonable R&D strategy, improve R&D output efficiency and green technology levels, and ensure green and sustainable economic development.
5.3. Formulate Differentiated Investment Strategies to Improve Investment Effectiveness and Financial Services
Governments and enterprises should formulate differentiated investment strategies based on regional advantages to promote green TFP growth. For regional central cities, such as Beijing and Shanghai, the investment attraction industry should focus on business logistics, finance, science and technology, cultural tourism, and other service industries, building an open platform around constructing high-end industries. Other regions should actively increase investment attraction for strategic emerging industries and high value-added industries to reduce air pollution. Future investment should focus on intensive and efficient investment in infrastructure and fixed assets that are conducive to the improvement of the ecological environment. The government should take Beijing, Shanghai, and other financial center cities as forerunners, guide the agglomeration of high-quality financial factors, and improve the R&D of financial services and green ecological industry development.
5.4. Limitations and Suggestions for Future Research
There is still something to be improved in this paper, which is worthy of further study. Considering the influence of regional spatial association of environmental regulation policy is more helpful for policymaking. At present, the sample selection is mainly for the eastern cities of China. In the future, it can be considered to add more cities in the central and western regions for comparative analysis. Japan, South Korea and India have also widely participated in the division of value chain, and there is a serious period of environmental pollution. The effects of their air pollution regulation and technological investment on sustainable development of green economy are also worthy of study. Through international comparison, more effective measures should be taken to accelerate China’s sustainable development of green economy in the future.
Author Contributions
M.Z. proposed this research, designed the empirical model and made the part of the manuscript. F.L. made the analysis of air pollution emissions. Y.S. supported the design of this paper and reviewed this paper. J.G. made the data collection. All authors have read and agreed to the published version of the manuscript.
Funding
This work was supported by the Natural Science Foundation of Shandong Province under Grants ZR2019QG006, the National Natural Science Foundation of China under Grants 71573161, Science and technology support plan of Youth Innovation Team in Colleges and universities of Shandong Province Grant 2019RWE013 and Shandong Social Science Planning Research Project Grants 20CJJJ32.
Conflicts of Interest
The authors declare no conflict of interest
References
- Hummels, D.; Ishii, J.; Yi, K.M. The nature and growth of vertical specialization in world trade. J. Int. Econ. 2001, 1, 75–96. [Google Scholar] [CrossRef]
- Poon, J.; Casas, I.; He, C. The impact of energy, transport, and trade on air pollution in China. Eurasian. Geog. Econ. 2006, 5, 568–584. [Google Scholar]
- China Electric Power Planning and Design Institute. China Energy Development Report; China Electric Power Press: Beijing, China, 2018. (In Chinese) [Google Scholar]
- Jiang, M.; Lee, J.; Jeong, K.; Cui, Z.; Kim, B.; Hwang, S.; Choi, Y.J. Data stream-based, integrative approach to reliable and easily manageable real time environmental monitoring. Int. J. Distrib. Sens. Netw. 2015, 11, 1–14. [Google Scholar] [CrossRef]
- Trilles, S.; Òscar, B.; Schade, S.; Huerta, J. A domain-independent methodology to analyze IoT data streams in real-time. A proof of concept implementation for anomaly detection from environmental data. Int. J. Digit. Earth. 2017, 10, 103–120. [Google Scholar] [CrossRef]
- Ji, Q.; Zhang, D.Y. How much does financial development contribute to renewable energy growth and upgrading of energy structure in China? Energy Policy 2019, 128, 114–124. [Google Scholar] [CrossRef]
- Cheng, R.; Li, W. Evaluating environmental sustainability of an urban industrial plan under the three-line environmental governance policy in China. J. Environ. Manag. 2019, 251, 1–11. [Google Scholar] [CrossRef]
- Zhang, G.; Deng, N.; Mou, H.; Zhang, Z.; Chen, X. The impact of the policy and behavior of public participation on environmental governance performance: Empirical analysis based on provincial panel data in China. Energy Policy 2019, 129, 1347–1354. [Google Scholar] [CrossRef]
- Zhang, X.; Tan, Z.; Chang, B.; Chan, K. Is a Regional Coordination Approach to Air Pollution Management Helpful? Evidence from China. Sustainability 2020, 12, 134. [Google Scholar] [CrossRef]
- Chen, J.D.; Cheng, S.L.; Song, M.L. Decomposing inequality in energy-related CO2 emissions by source and source increment: The roles of production and residential consumption. Energy Policy 2017, 107, 698–710. [Google Scholar] [CrossRef]
- Guo, Q.; Zhou, M.; Liu, N.; Wang, Y. Spatial effects of environmental regulation and green credits on green technology innovation under low-carbon economy background conditions. Int. J. Environ. Res. Public Health 2019, 16, 3027. [Google Scholar] [CrossRef]
- Song, Y.J.; Ji, Q.; Du, Y.J.; Geng, J.B. The dynamic dependence of fossil energy, investor sentiment and renewable energy stock markets. Energy Economics 2019, 84, 104564. [Google Scholar] [CrossRef]
- Lee, M. Environmental regulations and market power: The case of the Korean manufacturing industries. Ecol. Econ. 2008, 1, 205–209. [Google Scholar] [CrossRef]
- Chung, S.H. Environmental regulation and foreign direct investment: Evidence from South Korea. J. Dev. Econ. 2018, 104, 222–236. [Google Scholar]
- Hamamoto, M. Environmental regulation and the productivity of Japanese manufacturing industries. Resour. Energy. Econ. 2006, 4, 299–312. [Google Scholar] [CrossRef]
- Altman, M. When green isn’t mean: Economic theory and the heuristics of the impact of environmental regulations on competitiveness and opportunity cost. Ecol. Econ. 2001, 36, 31–34. [Google Scholar] [CrossRef]
- Greenstone, M.; List, J.A.; Syverson, C. The Effects of Environmental Regulation on the Competitiveness of U.S. Manufacturing; NBER Working Paper; National Bureau of Economic Research: Cambridge, MA, USA, 2012; No.18392. [Google Scholar]
- Das, G.G.; Alavalapati, J.R.R.; Carter, D.R.; Tsigas, M.E. Regional impacts of environmental regulations and technical change in the US forestry sector: A multiregional CGE analysis. Forest Policy Econ. 2005, 7, 25–38. [Google Scholar] [CrossRef]
- Ashford, N.A.; Zwetsloot, G. Encouraging inherently safer production in European firms: A report from the field. J. Hazard. Mater. 2000, 78, 123–144. [Google Scholar] [CrossRef]
- Baldwin, J.; Lin, Z. Impediments to advanced technology adoption for Canadian manufacturers. Res. Policy 2002, 31, 1–18. [Google Scholar] [CrossRef]
- Lefebvre, E.; Lefebvre, L.A.; Talbot, S. Determinants and impacts of environmental performance in SMEs. R&D Manag. 2003, 3, 263–283. [Google Scholar]
- Yang, X.; Wang, S.; Zhang, W.; Li, J.; Zou, Y. Impacts of energy consumption, energy structure, and treatment technology on SO2 emissions: A multi-scale LMDI decomposition analysis in China. Appl. Energy 2016, 184, 714–726. [Google Scholar] [CrossRef]
- Chen, J.D.; Cheng, S.L.; Song, M.L.; Wang, J. Interregional differences of coal carbon dioxide emissions in China. Energy Policy 2016, 96, 1–13. [Google Scholar] [CrossRef]
- Tan-Soo, J.S.; Qin, P.; Zhang, X.B. Power stations emissions externalities from avoidance behaviors towards air pollution: Evidence from Beijing. Energy Policy 2018, 121, 336–345. [Google Scholar] [CrossRef]
- Ganda, F. The impact of innovation and technology investments on carbon emissions in selected organization for economic Co-operation and development countries. J. Clean. Prod. 2019, 217, 469–483. [Google Scholar] [CrossRef]
- Lai, X.; Liu, J.; Shi, Q.; Georgiev, G.; Wu, G. Driving forces for low carbon technology innovation in the building industry: A critical review. Renew. Sustain. Energy Rev. 2017, 74, 299–315. [Google Scholar] [CrossRef]
- Bonnet, C.; Hache, E.; Seck, G.S.; Simoën, M.; Carcanague, S. Who’s winning the low-carbon innovation race? An assessment of countries’ leadership in renewable energy technologies. Interna. Econ. 2019, 160, 31–42. [Google Scholar] [CrossRef]
- Jiang, P.; Alimujiang, A.; Dong, H.; Yan, X. Detecting and Understanding Synergies and Co-Benefits of Low Carbon Development in the Electric Power Industry in China. Sustainability 2020, 12, 297. [Google Scholar] [CrossRef]
- Du, K.; Li, J. Towards a green world: How do green technology innovations affect total-factor carbon productivity. Energy Policy 2019, 131, 240–250. [Google Scholar] [CrossRef]
- Zhang, S.F.; Hu, T.T.; Li, J.B.; Cheng, C.; Song, M.L.; Xu, B.; Tomas, B. The effects of energy price, technology, and disaster shocks on China’s Energy-Environment-Economy system. J. Clean. Prod. 2019, 207, 204–213. [Google Scholar] [CrossRef]
- Maria, C.D.; Smulders, S.A. Trade pessimists vs Technology optimists: Induced technical change and pollution havens. Adv. Econ. Anal. Policy 2004, 2, 1–29. [Google Scholar] [CrossRef]
- Girma, S.; Gong, Y.; Görg, H. Foreign direct investment, access to finance and innovation activity in Chinese enterprises. World Bank Econ. Rev. 2008, 22, 367–382. [Google Scholar] [CrossRef]
- Rafindadi, A.A.; Muye, I.M.; Kaita, R.A. The effects of FDI and energy consumption on environmental pollution in predominantly resource-based economies of the GCC. Sustain. Energy Tech. Assess. 2018, 25, 126–137. [Google Scholar] [CrossRef]
- Song, M.L.; Cen, L.; Zheng, Z.X.; Fisher, R.; Liang, X.; Wang, Y.T.; Huisingh, D. How would big data support societal development and environmental sustainability? Insights and practices. J. Clean. Prod. 2017, 142, 489–500. [Google Scholar] [CrossRef]
- Kukulski, J.; Ryan, M. Investment history and market orientation effects in the TFP-FDI relationship. World Economy 2011, 34, 546–567. [Google Scholar] [CrossRef]
- Yue, S.; Yang, Y.; Hu, Y. Does foreign direct investment affect green growth? Evidence from China’s experience. Sustainability 2016, 8, 158. [Google Scholar] [CrossRef]
- Peng, J.; Xiao, J.; Wen, L.; Zhang, L. Energy industry investment influences total factor productivity of energy exploitation: A biased technical change analysis. J. Clean. Prod. 2019, 237, 1–16. [Google Scholar] [CrossRef]
- Antonietti, R.; Marzucchi, A. Green tangible investment strategies and export performance: A firm-level investigation. Ecol. Econ. 2014, 108, 150–161. [Google Scholar] [CrossRef]
- Daina, L.G.; Sabău, M.; Daina, M.; Neamtu, C.; Tit, D.M.; Buhas, C.L.; Bungau, C.; Aleya, L.; Bungau, S. Improving performance of a pharmacy in a Romanian hospital through implementation of an internal management control system. Sci. Total. Environ. 2019, 675, 51–61. [Google Scholar] [CrossRef]
- Tamazian, A.; Chousa, J.P.; Vadlamannati, C.K. Does higher economic and financial development lead to environmental degradation: Evidence from BRIC countries. Energy Policy 2009, 37, 246–253. [Google Scholar] [CrossRef]
- Laeven, L.; Levine, R.; Michalopoulos, S. Financial innovation and endogenous growth. J. Fina. Inter. 2015, 24, 1–24. [Google Scholar] [CrossRef]
- Yuan, H.; Zhang, T.; Feng, Y.; Liu, Y.; Ye, X. Does financial agglomeration promote the green development in China? A spatial spillover perspective. J. Clean. Prod. 2019, 237, 1–12. [Google Scholar] [CrossRef]
- Ministry of Environmental Protection of the People’s Republic of China. China Environmental Statistics Annual Report; China Environmental Press: Beijing, China, 2016. (In Chinese) [Google Scholar]
- Hulten, C.R.; Bennathan, E.; Srinivasan, S. Infrastructure, externalities, and economic development: A study of the Indian manufacturing industry. World Bank Econ. Rev. 2006, 20, 291–308. [Google Scholar] [CrossRef]
- Färe, R.; Grosskopf, S. Directional distance functions and slacks-based measures of efficiency. Eur. J. Oper. Res. 2010, 200, 320–322. [Google Scholar] [CrossRef]
- Hu, A.G.Z.; Jefferson, G.H.; Qian, J.C. R&D and technology transfer: Firm-level evidence from Chinese industry. Rev. Econ. Stat. 2005, 87, 780–786. [Google Scholar]
© 2020 by the authors. Licensee MDPI, Basel, Switzerland. This article is an open access article distributed under the terms and conditions of the Creative Commons Attribution (CC BY) license (http://creativecommons.org/licenses/by/4.0/).