1. Introduction
The past decades were characterized by more frequent financial crises than before, an increased imbalance between the national economies of the world, a high imbalance between imports and exports for many countries, the rise of households’ debt, as well as the unequal distribution of personal income. Economic research has always tried to identify and quantify the impact of different factors on economic evolutions. Factors such as labor and capital were always under the close watch of scientists, the importance given to them varying at different moments. In the last few decades, we have witnessed a shift of importance in favor of capital versus labor.
Lately, researchers have advocated that a wage-led growth strategy might be the solution for counter fighting the negative evolutions witnessed in the economy. Despite their justifications, in order to be correctly applied and to have the expected results, such a strategy must be well understood by the governments that choose to apply it.
The ideas of this strategy are not new. The relation between distribution and growth has been long discussed in great detail. While it stood in the center of macroeconomic analysis for the classics, in neoclassic economics it became less important, with income distribution being considered as regulated by the marginal productivity relations within a perfect competition model.
The wage-led growth strategy has its roots in the 19th century economics. It got a boost from economists such Keynes and Kalecki [
1,
2], who developed the effective demand theories, and later from researchers such as Rajan [
3], Onaran [
4], Palley [
5], Stiglitz [
6], Hagemejer & all [
7], Novo-Corti&all [
8], Rowthorn [
9], Dutt [
10], and Bhaduri and Marglin [
11].
One important step in using this strategy is a clear distinction between the distributional policies and the economic regimes. Engelbart Stockhammer [
12,
13] underlines the differences between the pro-labor and pro-capital distributional policies and the wage-led and profit-led demand and supply regimes. He shows that the pro-labor policies are shifting the income distribution in favor of labor, while the pro-capital policies are also distributional policies, but they shift the income distribution against labor.
Pro-capital distributional policies usually promote the flexibilization of labor markets by measures meant to lower the minimum wages, to reduce employment protection legislation, to reduce the power of labor unions, etc. Pro-labor policies do exactly the opposite, offering the labor unions more power, reducing the salary income disparities, adding employment protection legislation, etc. The effects generated by pro-labor policies are bigger real wages, stable or increasing wage share, and a decrease in wage dispersion.
Income distribution should nevertheless be regarded as very dependent not only upon the distributional policies applied, but also upon other factors such as technological changes, globalization, and financialization. If ignored, these factors could make the distributional policies useless.
The macroeconomic regimes of countries are determined by a complex set of institutional determinants and on different macroeconomic factors, such as the openness to international trade, the welfare state, structure of the economy, characteristics of the financial system, etc. An economic regime is a description of the economic structures and institutions. These characterize also the openness of the country and its attitude towards social security. The forms of government policy deeply influence the economic regime, but it should be clear that the nature of the economic regime is not a choice variable for economic policy in any straightforward sense.
Countries can be classified according to their macroeconomic regimes into wage-led and profit-led economic regimes. One can also distinguish between demand-side (the key determinant variable being the level of aggregate demand) and supply-side (the key determinant variable being the productivity growth) considerations. In a wage-led regime, the wages’ increase generates positive effects both in the short run (as the economic activity increases), as well as in the long run (as due to higher economic activity, the accumulation of capital also increases), through the demand effects as well as through the supply side effects (a productivity growth is generated). In the case of a profit-led economic regime, it is expected that a decrease in the share of wages or an increase in the profit margins are the measures that produce positive effects upon the economy.
2. Literature Review
The economic growth has been analyzed using different methodologies or samples, according to the combination of distributional policies and economic structures analyzed.
An important group of studies analyze the relationship between the capacity utilization and profit shares by using two-way relationship of both variables. Barbosa-Filho and Taylor [
14] using VAR and Carvalho and Rezai [
15] using TVAR (trash-hold vector auto regressive) find that profit is leading the US economy. But Nikiforos and Foley [
16] show that, according to the level of the wage share and of capacity utilization, in the US economy one can find multiple equilibrium points, at lower or higher levels, and they conclude that the US economy is wage-led as at wage share increases, despite the initial negative reactions, the economy will reach the equilibrium point at a higher capacity utilization.
Other researchers decompose the GDP into its components and establish the impact of wage share on each component, only afterward predicting the general impact on the economy (by multiplying each of the individual component’s reactions with estimated coefficients). It was the approach used by Bowles and Boyer [
17], when they tested the impact of wages on each component of GDP, at the level of five countries (developed ones). Later studies use time-series techniques and even panel data (see [
18] who consider the Euro-zone as wage-led, or [
19] that estimates that the OECD countries are generally wage-led).
The models of distribution and growth developed by the post-Keynesian/post-Kaleckian authors shown that even though there is a clear relationship between wage share and growth, it is just an empirical matter which depends upon a very large variety of factors regarding the particularities of the economy. Wages are considered by these authors in their dual role: As source of the demand in the economy as well as a cost for the employers, while the central role in the explanations of growth in economies with rates of unemployment over zero, is kept by the evolution of demand.
There were studies that tried to find alternatives to the European strategy of wage restraint but they were not feasible enough as they only analyzed a subset of European countries (see [
17,
20,
21,
22,
23,
24,
25]), considered just the Euro area (regarded as a single country which is not feasible due to the cross-country interactions that were ignored) (see [
18,
22]). Bhaduri and Marglin’s [
11] model tries to show whether, using either the wage-led or the profit-led demand regimes, governments of Europe can generate a higher growth while keeping a more equitable income distribution. They seek to find if a coordinated wage policy, used on a multi-country level, could be a solution for Europe in keeping wages under control better than through the European strategy of wage restraint.
Lavoie and Stockhammer [
26] analyze the medium or long-time connections that exist between distribution and economic growth. Despite the criticism they received for sometimes using wage terminology with respect to short-run cyclical patterns (e.g., [
14,
27]) while referring to long-run correlations, they outline a variety of interventions that can be used in influencing the income distribution (stronger unions, better unemployment benefits, favoring financial regulation), showing that the wage share is not itself an instrument but the aggregation of all of these interventions is.
The problem of raising the wage share has preoccupied lots of researchers for a long time ([
1,
22,
24,
28,
29,
30,
31,
32]). The majority tried to set a connection between such a raise and the economic growth or the international competitiveness of local companies. Keynes [
1], Hein and Vogel [
24], and Onaran and Galanis [
22] consider that a rise in the wage share has the best effects upon the economic growth as workers tend to have a higher preference for consumption than the capitalists.
Rowthorn [
9] and Bowles and Boyer [
17] show that there is an important connection between the type of regime and the impact changes in the real wages have on the economic growth. The impact can be either negative or positive. According to the Bhaduri and Marglin’s [
11] model, capital accumulation is determined by profit share and the capacity utilization rate. They consider that the preference for saving is higher in the case of capitalists than in that of the workers and therefore the increase of the workers’ income can result in a higher capacity utilization.
Still, the higher level of wages can also have negative effects as it negatively impacts on the profit share and can therefore reduce the competing capacity of local firms in an international context. Higher wage shares also have a negative direct impact on investments, as profits are smaller due to the increased costs of labor. This can lead to reduced interest for investments and therefore to capitalists reducing their contribution to capital formation. If the direct negative effects of the wage share increase are larger than the positive ones, the growth regime would be exhilarationist (profit-led). But, if a higher wage share has a larger positive effect (through an increase in consumption), the growth regime would be stagnationist (wage-led) in which the change in the wage share stimulates the aggregate demand.
Mark Blyth and Matthias Matthijs [
33] show in their research that there are links between the rise or decline of economic regimes and the rise of populism in the world. They emphasize the fact that, in many countries, the post-World War Two policies applied were very favorable to labor, developing a new growth model that failed in time, due to the inflationary effects. Their study was just a starting point for different researchers that tried to find and explain connections between populism and growth regimes, as well as between the wage led growth policies and their inflationary impact. What is important to note is that such studies have not only emerged after the 2007–2018 crises, but they were present in the literature since the 80s; the financial crises just emphasized the populist measures taken by different governments, to generate positive political effects for their parties.
Wage-led growth comes from the premise that, in recent decades, wage growth has not kept pace with productivity growth, which has led to the situation of finding ourselves in a period with high income inequality [
13].
According to Stockhammer [
34], based on the available evidence, most economies are wage led. In open economies, the effects of net exports can create the premises of a profit-led economy. Stockhammer [
34] shows that there are several studies that identify the positive effects of wage increases on productivity growth, indicating that long-term effects of wage increases may have positive impacts on the economy.
Figure 1 shows the result of correlation between policies and their enhanced results leading to growth. However, an improper correlation, e.g., pro-capital policies and wage-led growth, will lead to stagnation and volatile growth.
A package of measures for economic recovery must consider the sustainable growth of wages in line with productivity. Moreover, to be successful, it is necessary to restructure the financial sector, eliminating financial innovations and requiring a larger fiscal contribution of the financial sector. In this regard, Hein and Mundt [
35] suggest that a “global Keynesian New Deal” is required.
Onaran și Obst [
31] shows in an empirical analysis that simultaneous decrease of wages’ share in the European economy leads to a decrease of the economic growth, although the magnitude of the effect is not high.
3. Current Situation for Romania
In the present paper, we analyze the case of Romania, where pro-labor distribution policies were applied. The growth of net average wage, based only on salaries in the budgetary sector, is not correlated with other factors such as technological changes, globalization, and financialization, which are considered by the literature as essential in order to obtain the positive effects.
Although the wage-led growth theory does not discriminate between the public and private sectors, the way it was implemented by the Romanian government only focused on the public sector without taking into account that the private sector would only react in the case that productivity would also increase, and not as result of a public decision. If we analyze the measures taken, we can notice that the income distribution is not influenced in the same manner for the entire Romanian labor market. The stagnation of wages in the private sector and the widening of the gap between private and budgetary salaries created more problems than they solved, amplifying some fundamental macroeconomic imbalances [
34,
36,
37] such as the exchange rate and trade deficits, as can be seen in
Figure 2.
In the case of Romania, populist policies have increased the weight of the permanent budgetary expenditure with wages and pensions, bringing them to the level reached before the financial crisis of 2007. This way, the executive has little maneuver space to adjust the public expenditure, as the permanent expenditure represents about 80% of the social contributions and fiscal revenues, as shown in
Figure 3.
As we can observe in
Figure 3, the increase of the share in wages and social contribution in 2007 and 2008 has deteriorated the sustainability of public finance, leaving a very limited fiscal space for 2009 and 2010. The Romanian crisis experiences meant the reduction of all public sector employees with 25%, which was an extreme measure to reduce budget deficit of 9.1% in 2009 to 6.9% in 2010.
Recent evolutions are showing that an increase in public wages and pensions with disregard to the public budget equilibrium is not sustainable nor is morally correct for assuring generational peace. Currently, Romania stands in the excessive deficit procedure due to a budget deficit of 4.6% in 2019, and an estimated deficit of 3.6% in 2020, before the pandemic.
Thus, analyzing the present state of facts in Romania, one can say that, unfortunately, the lessons taught by the previous crises were not learnt and the executive appeals at pro-cycle public policies that we consider as not being sustainable.
Figure 3 shows that in the event of a future recession, the Romanian executive has limited or inexistent fiscal possibilities to deal with it.
The wage-led growth strategy employed by the Romanian government, has direct effects only on the government sector. For the private sector, the effects are indirect, namely through the shifting of preferences of employees that will make rational decisions in terms of salary and free time and will direct their main interest to jobs in the public sector.
Thus, the effects are negative for the sustainability of the Romanian economy in two different ways:
The increase of the permanent public expenditure which permits very few actions to adjust the public deficit; and
The shifting of skilled workforce from the private sector to the government sector with immediate effects on productivity and labor shortages in the market.
The present paper aims to show that the populist policies implemented in Romania are unsustainable. The short-term oriented measures, applied mainly for electoral purposes, can hamper the sustainable growth. Therefore, public policies should be applied in a responsible manner and the case of Romania, a EU member state that has implemented a wage-led growth strategy as national wage policy, should be studied in order to understand why the results are far from being the expected ones, Romania being in a full excessive deficit procedure, with no fiscal maneuver space in the eventuality of turbulent times ahead.
4. Methodology and/or Theoretical Framework
The main variables taken into consideration for this paper are as follows: Net monthly average wage, trade deficit, number of employees in the economy, inflation rate, labor productivity, minimum wage, the dummy variable (see
Table 1).
Due to the interdependencies between the variables selected, the impact between them being mutual, we have decided to use a VAR model, one the most versatile research methodologies available in our research inventory. The robustness tests were performed for VAR stability (
Table A4), VAR order selection (
Table A5), VAR residual portmanteau tests for autocorrelations (
Table A6), VAR residual serial correlation LM tests (
Table A7), and VAR residual heteroskedasticity tests (
Table A8). Thus, by the test performed, the robustness of the VAR model has been proven, and therefore we can continue to the impulse response functions. The composition tables are presented in the
Appendix A as
Table A1,
Table A2 and
Table A3.
The data selected was monthly data, starting from January 2000 until December 2018, a time span that we consider adequate for our study, and having enough observations to be relevant.
The reason we have taken this period into consideration is because, after 2000, the Romanian economy was stable after experiencing inflation rates up to 300% between 1992 and 1998 (period for which the data would not be adequate for our study). In addition, a period of almost 20 years is considered to be adequate, both from econometric reasons, but also for wage related evolutions in Romania.
In this regard, we have formulated two major hypotheses, namely:
Hypothesis 1 (H1). Increasing the average wage is going to increase the trade deficit as stated by Marinescu [38,39] or Stockhammer [40,41,42]. In addition, we consider this hypothesis, given the composition of imports in Romania and the fact that the propensity of consumption in the Romanian economy is for foreign goods and services. In caeteris paribus conditions, the increase in the wages will generate an increase in the number of employees and increased inflation. Hypothesis 2 (H2). The increase of the minimum wage will generate an increase of the trade deficit, but with a smaller impact, as small wages tend to consume goods from the internal market. However, the impact is still going to be positive on inflation, in the direction of an augmented inflation.
5. Results of the Research
We have performed the necessary tests for the VAR methodology and we have presented the results in the annexes, such as: VAR stability condition (
Table A4), VAR lag order selection criteria (
Table A5), VAR tests for autocorrelation (
Table A6 and
Table A7), and VAR heteroscedasticity test (
Table A8), we have moved foreword to perform the impulse response function.
Thus, after performing the VAR stability condition, we can observe in
Table A4 that the VAR satisfies the stability condition. It is ensured, in this way, the essential condition for VAR stability, in this way we are assured that we can proceed further with our VAR methodology.
The number of lags chosen is two, as it can be observed in
Table A5. Thus, a change with a unit of the independent variable will have an effect on the dependent variable within two months, which, in our opinion, makes sense, as a wage increase will affect productivity almost instantaneously and will give an incentive to the idle labor market to move into the productive process, by decreasing the natural rate of unemployment.
Regarding the autocorrelation tests, we have performed both portmanteau and LM tests, as we can observe in
Table A6 and
Table A7, and we have no autocorrelation, thus validating another condition for ensuring the validation process of our VAR methodology.
Last, in
Table A8, we can observe that the VAR satisfies the condition of heteroscedasticity. Having these tests validated, we can proceed further with the impulse response functions and the validation of our hypothesis.
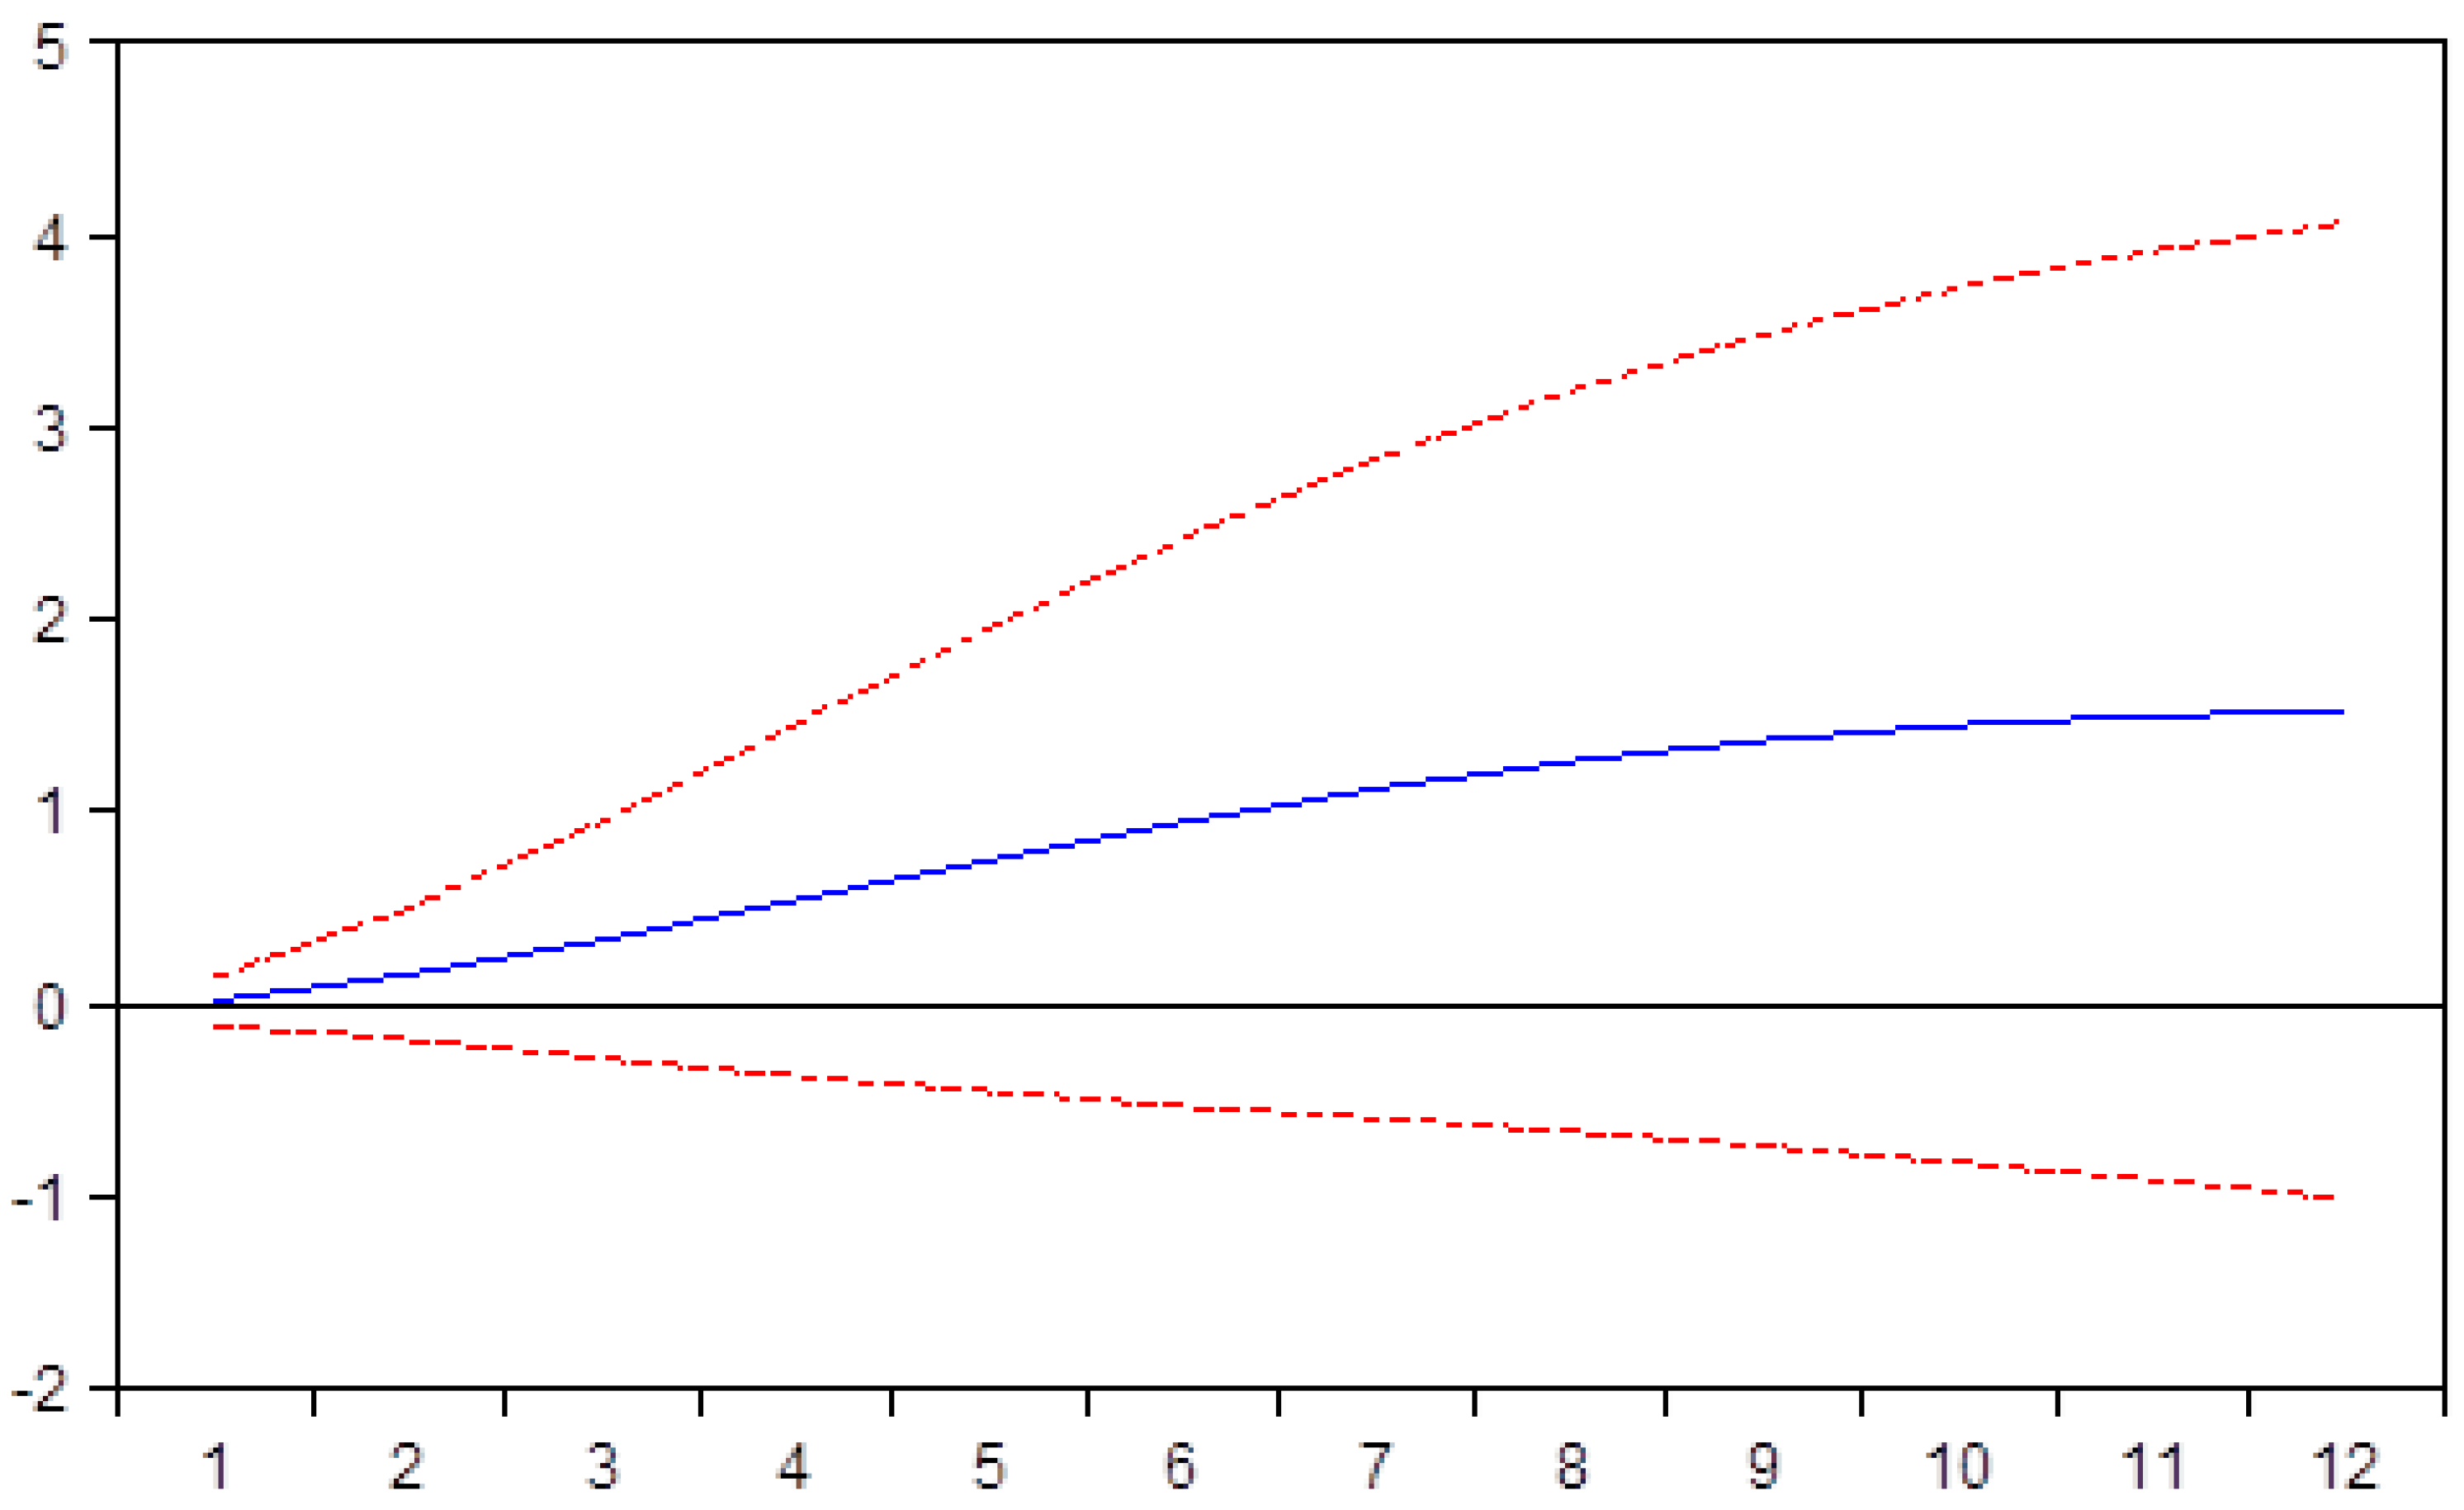
5.1. Impact of Increasing Average Monthly Wage
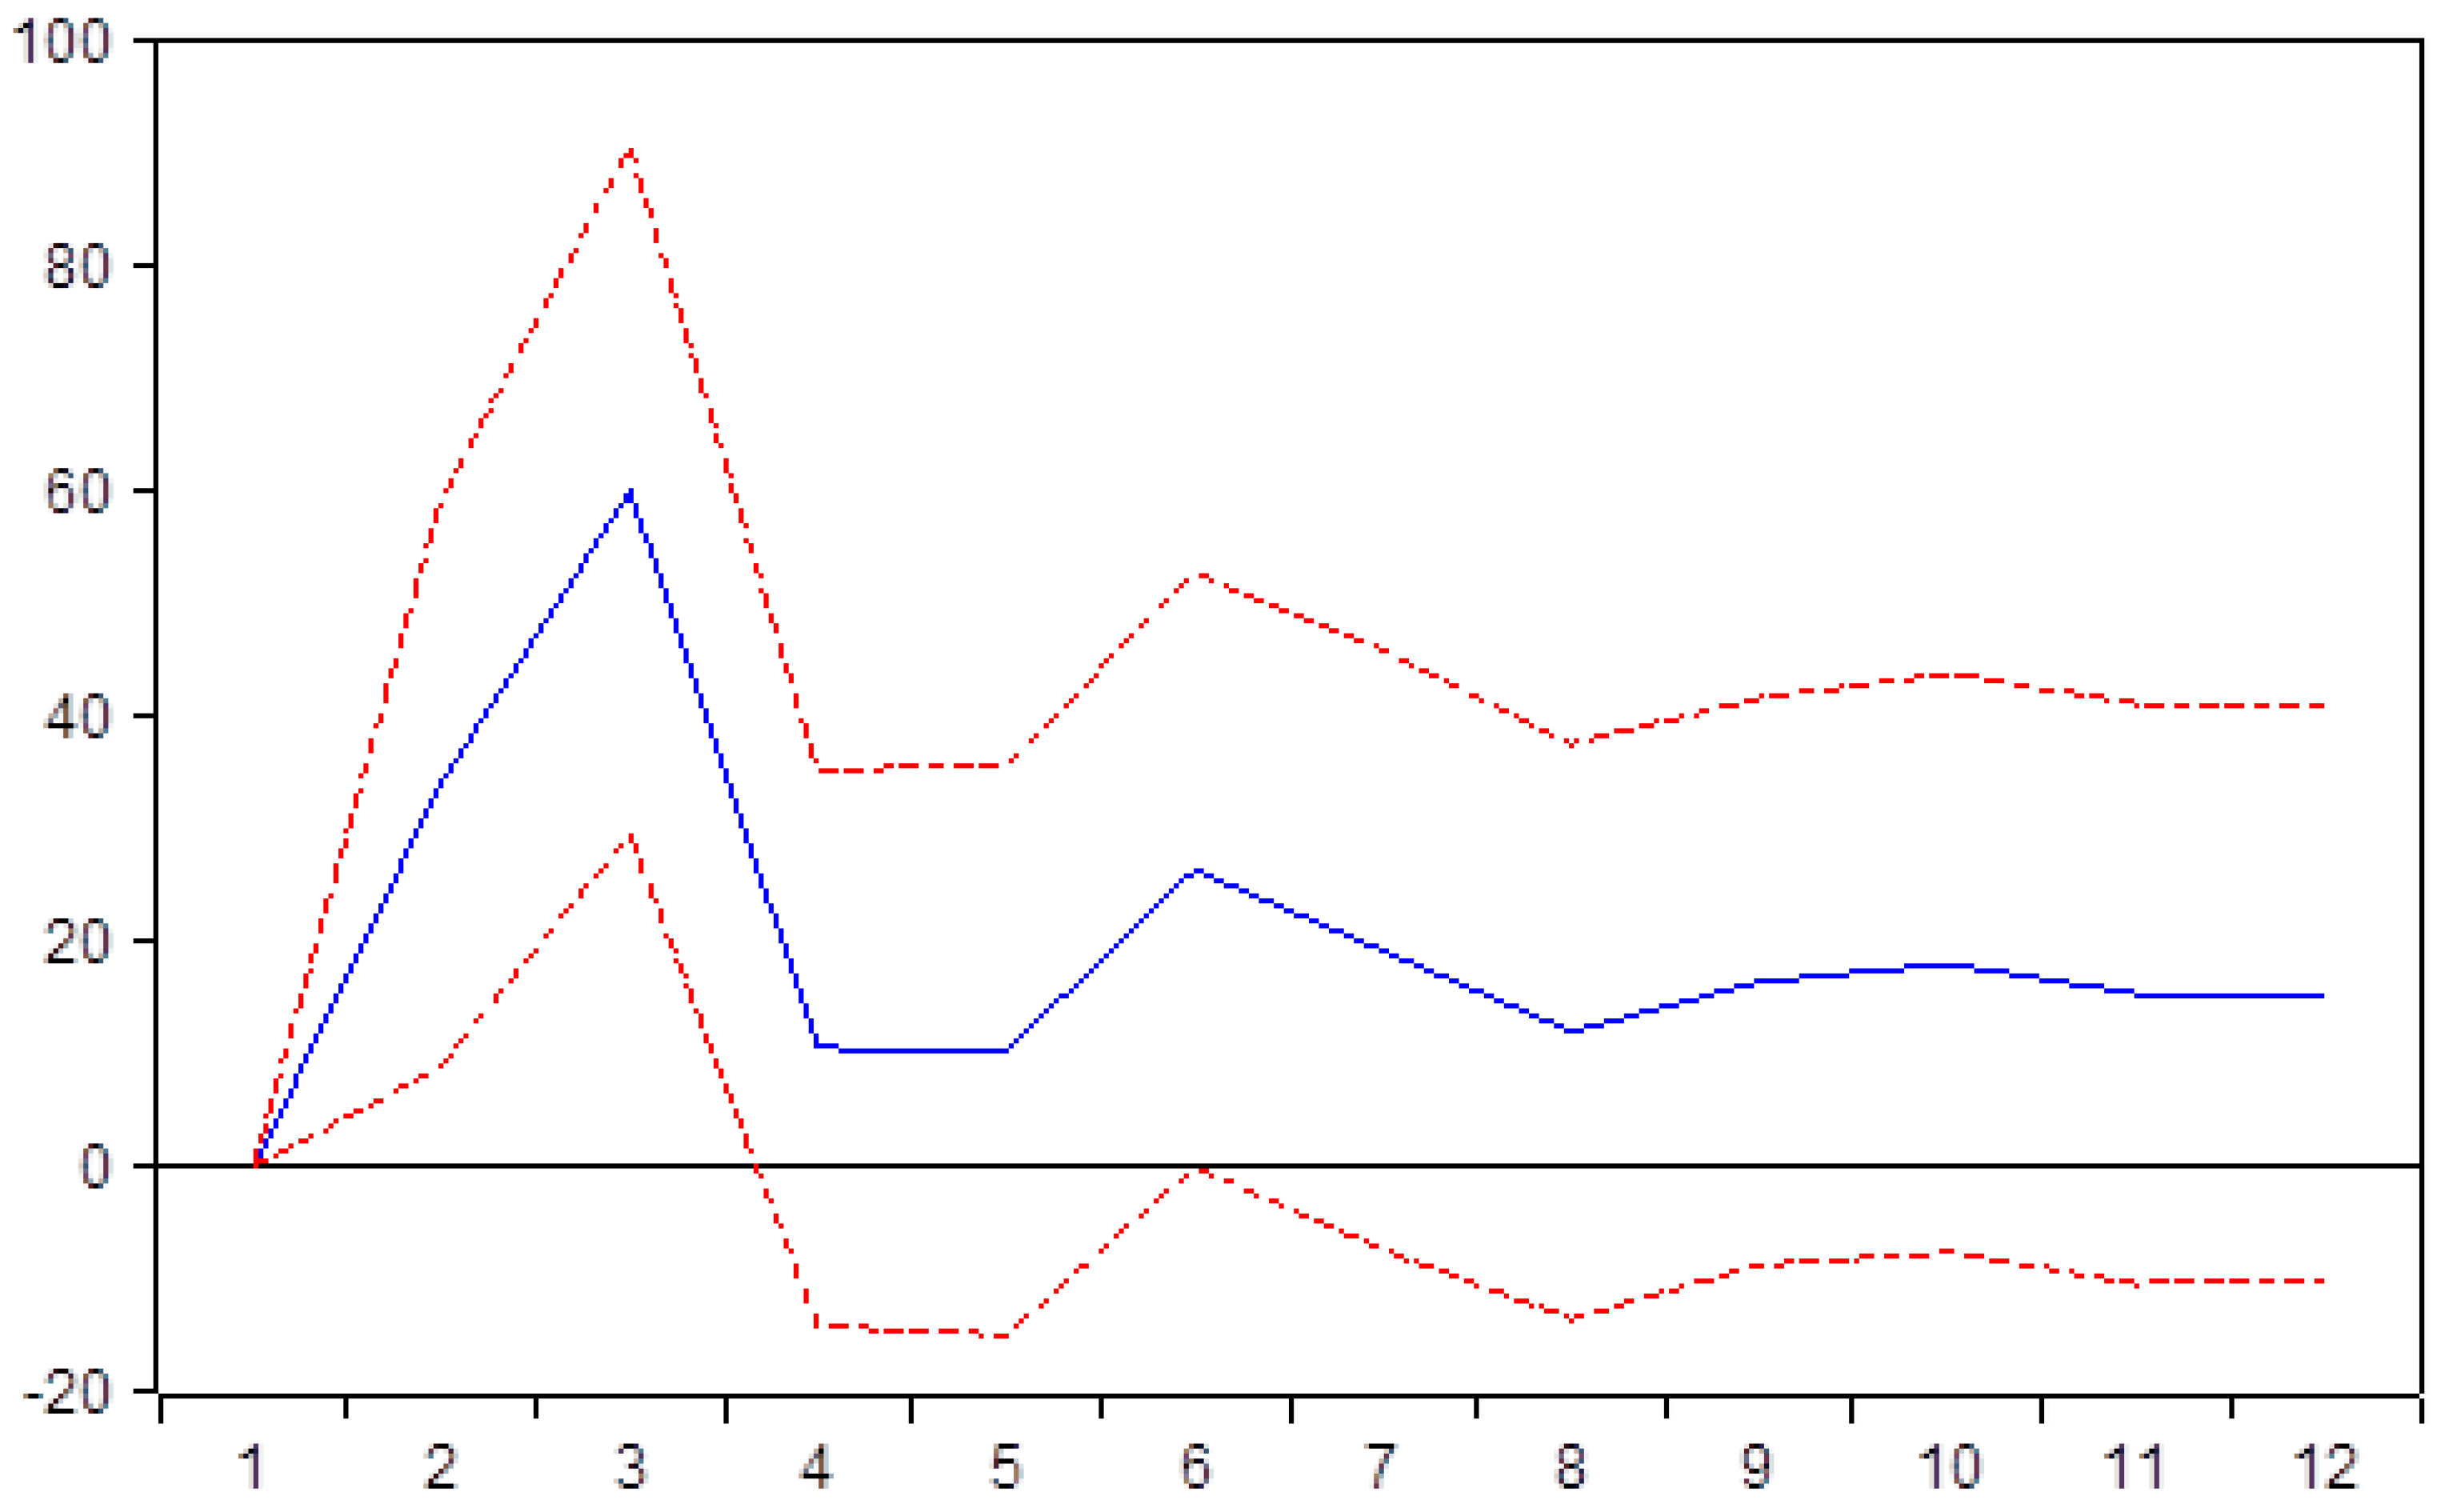
As we can observe in
Figure 4, the impact of the average net salary is strong and permanent upon the trade deficit. Therefore, an increase in the average salary will increase the trade deficit, as in Romania the increase in consumption will increase the imports of goods and services. Also, applying a wage-led growth will increase the internal cost of production, compromising the competitive advantages of lower costs and therefore making the strategy of export-led growth impossible.
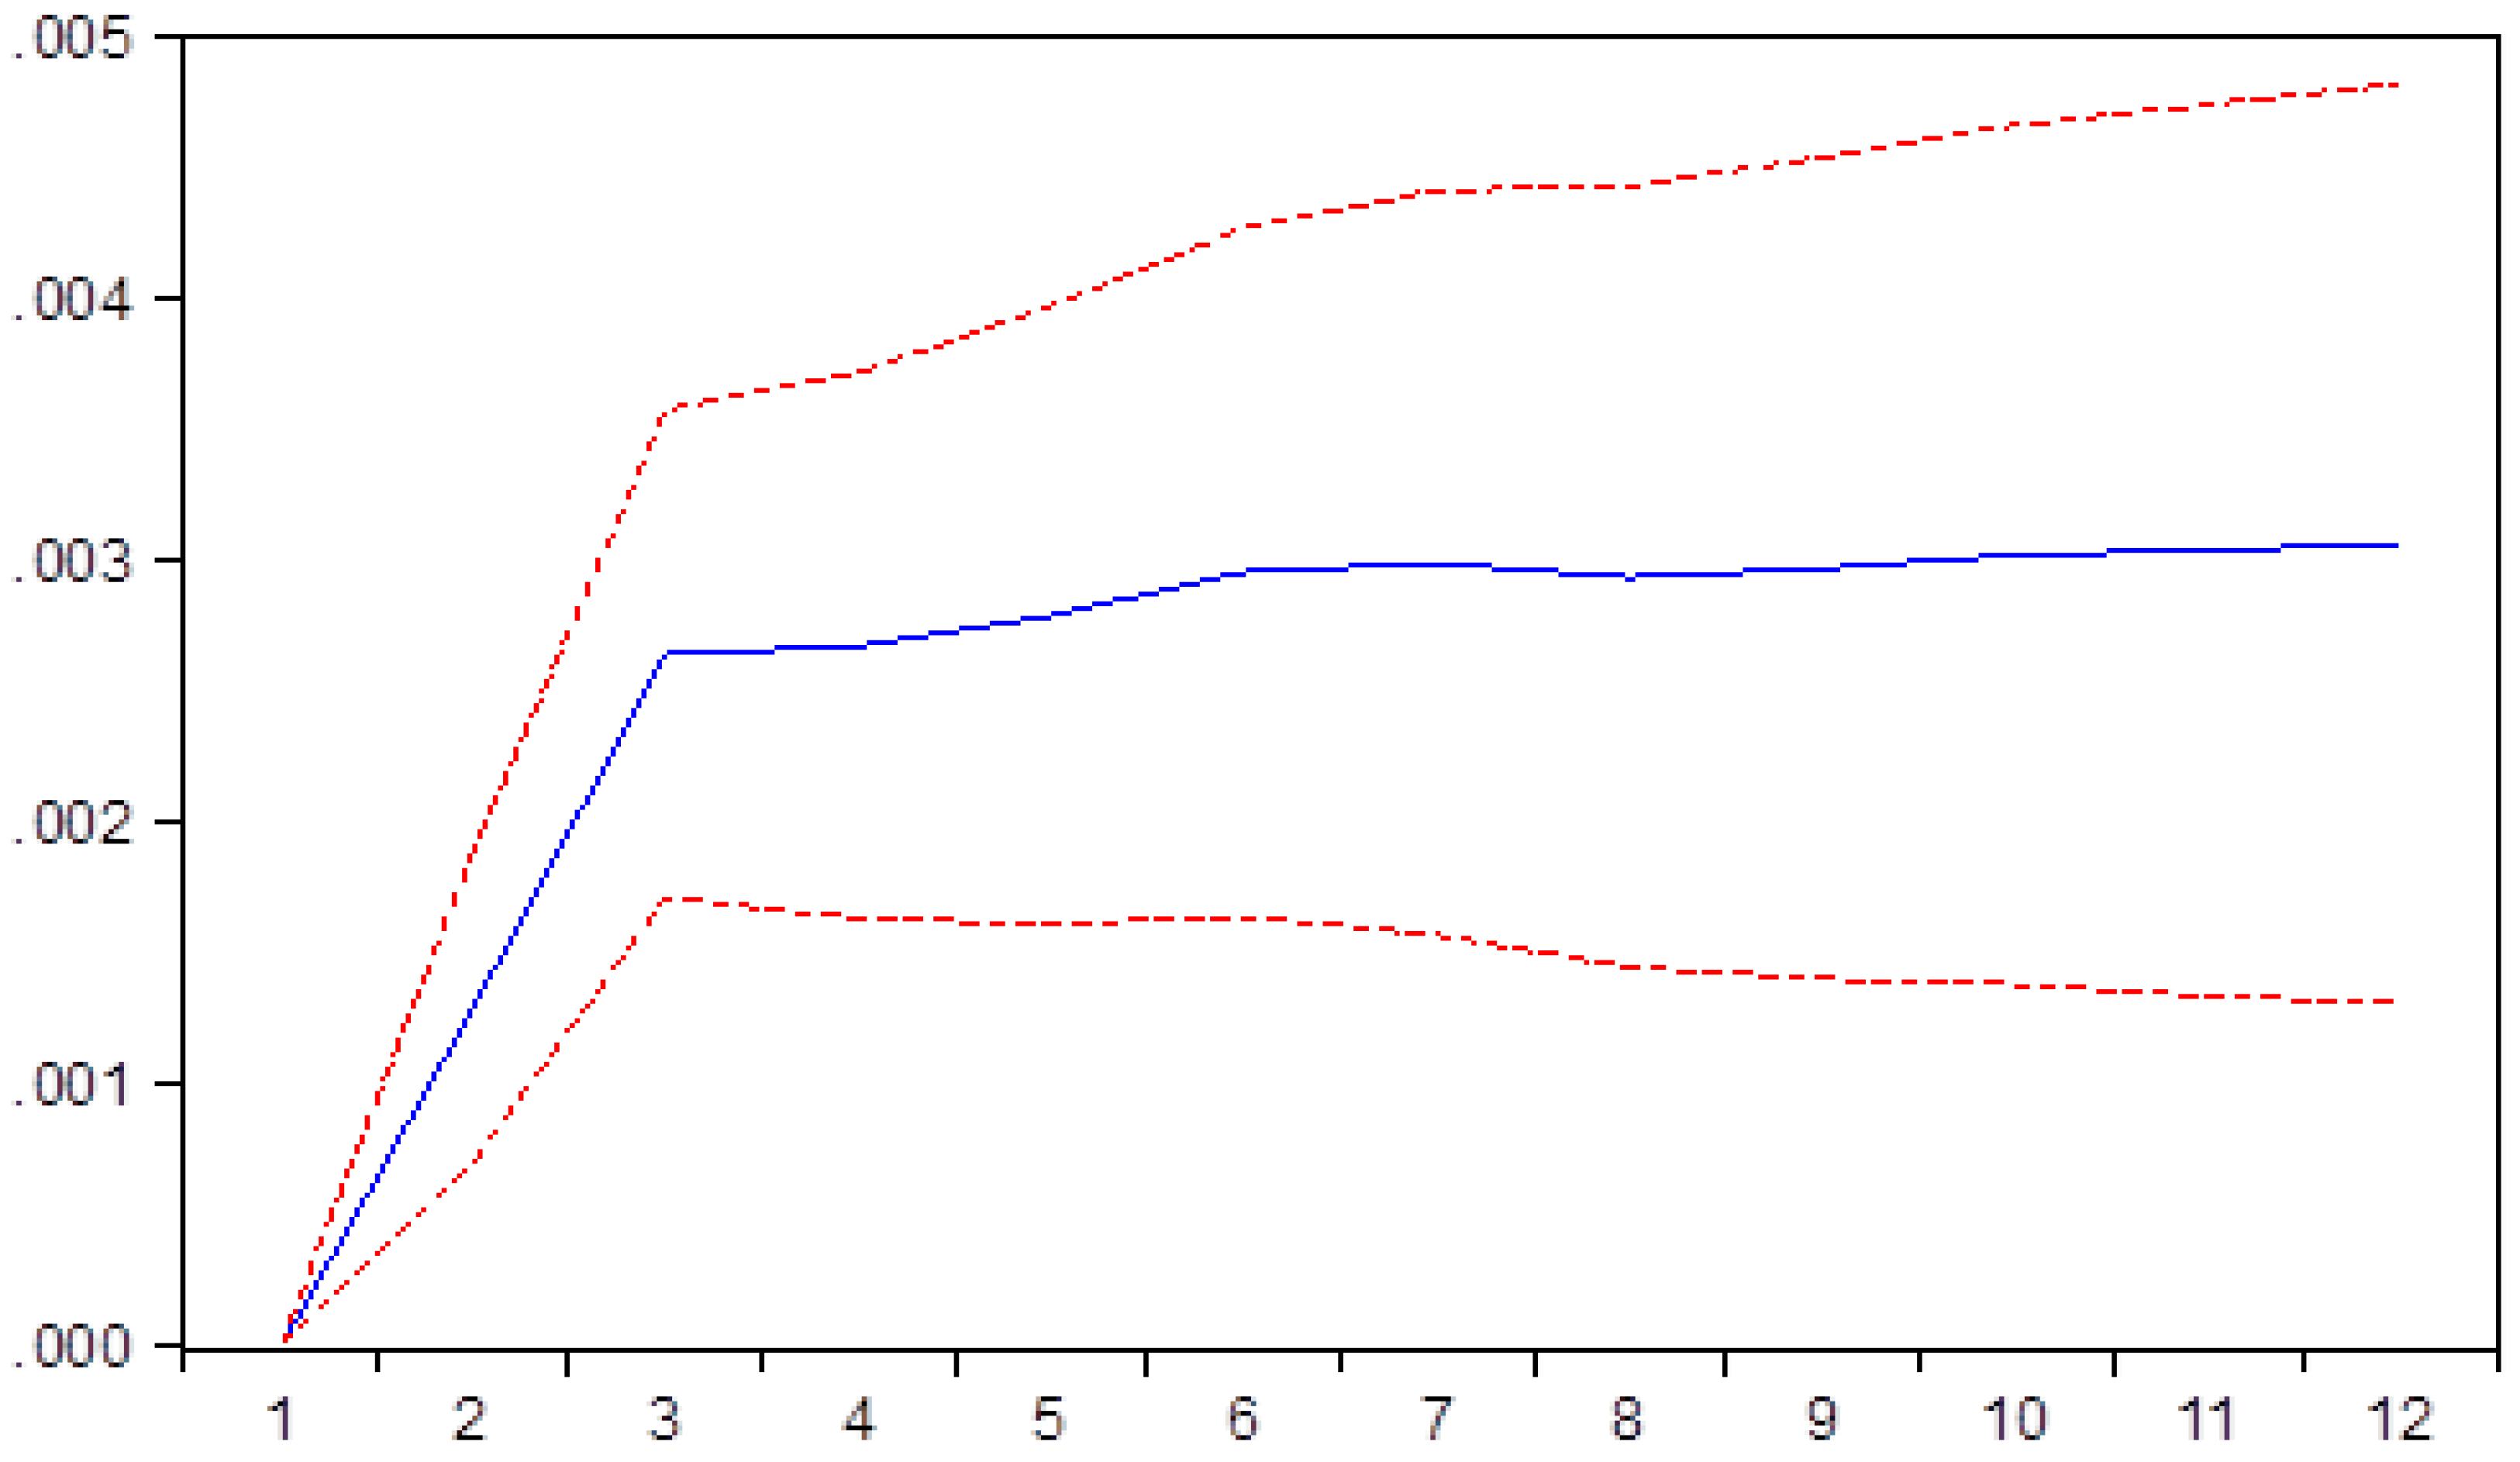
As we can observe in
Figure 5, the impact of the average net salary on the number of employees is strong and permanent. Therefore, an increase in the salaries on the Romanian labor market will stimulate employment and will shift the preferences of individuals from having free time towards getting a job.
This has positive effects on the economic growth. However, taking into consideration the labor shortages and labor deficit of the Romanian economy, the effects of wage-led growth are limited. In Romania, the unemployment rate is at a minimum level of 4% at the end of June 2019. Thus, in our opinion, increasing the wages would work better in an economy with high unemployment and does not serve this purpose in the particular case of Romania.
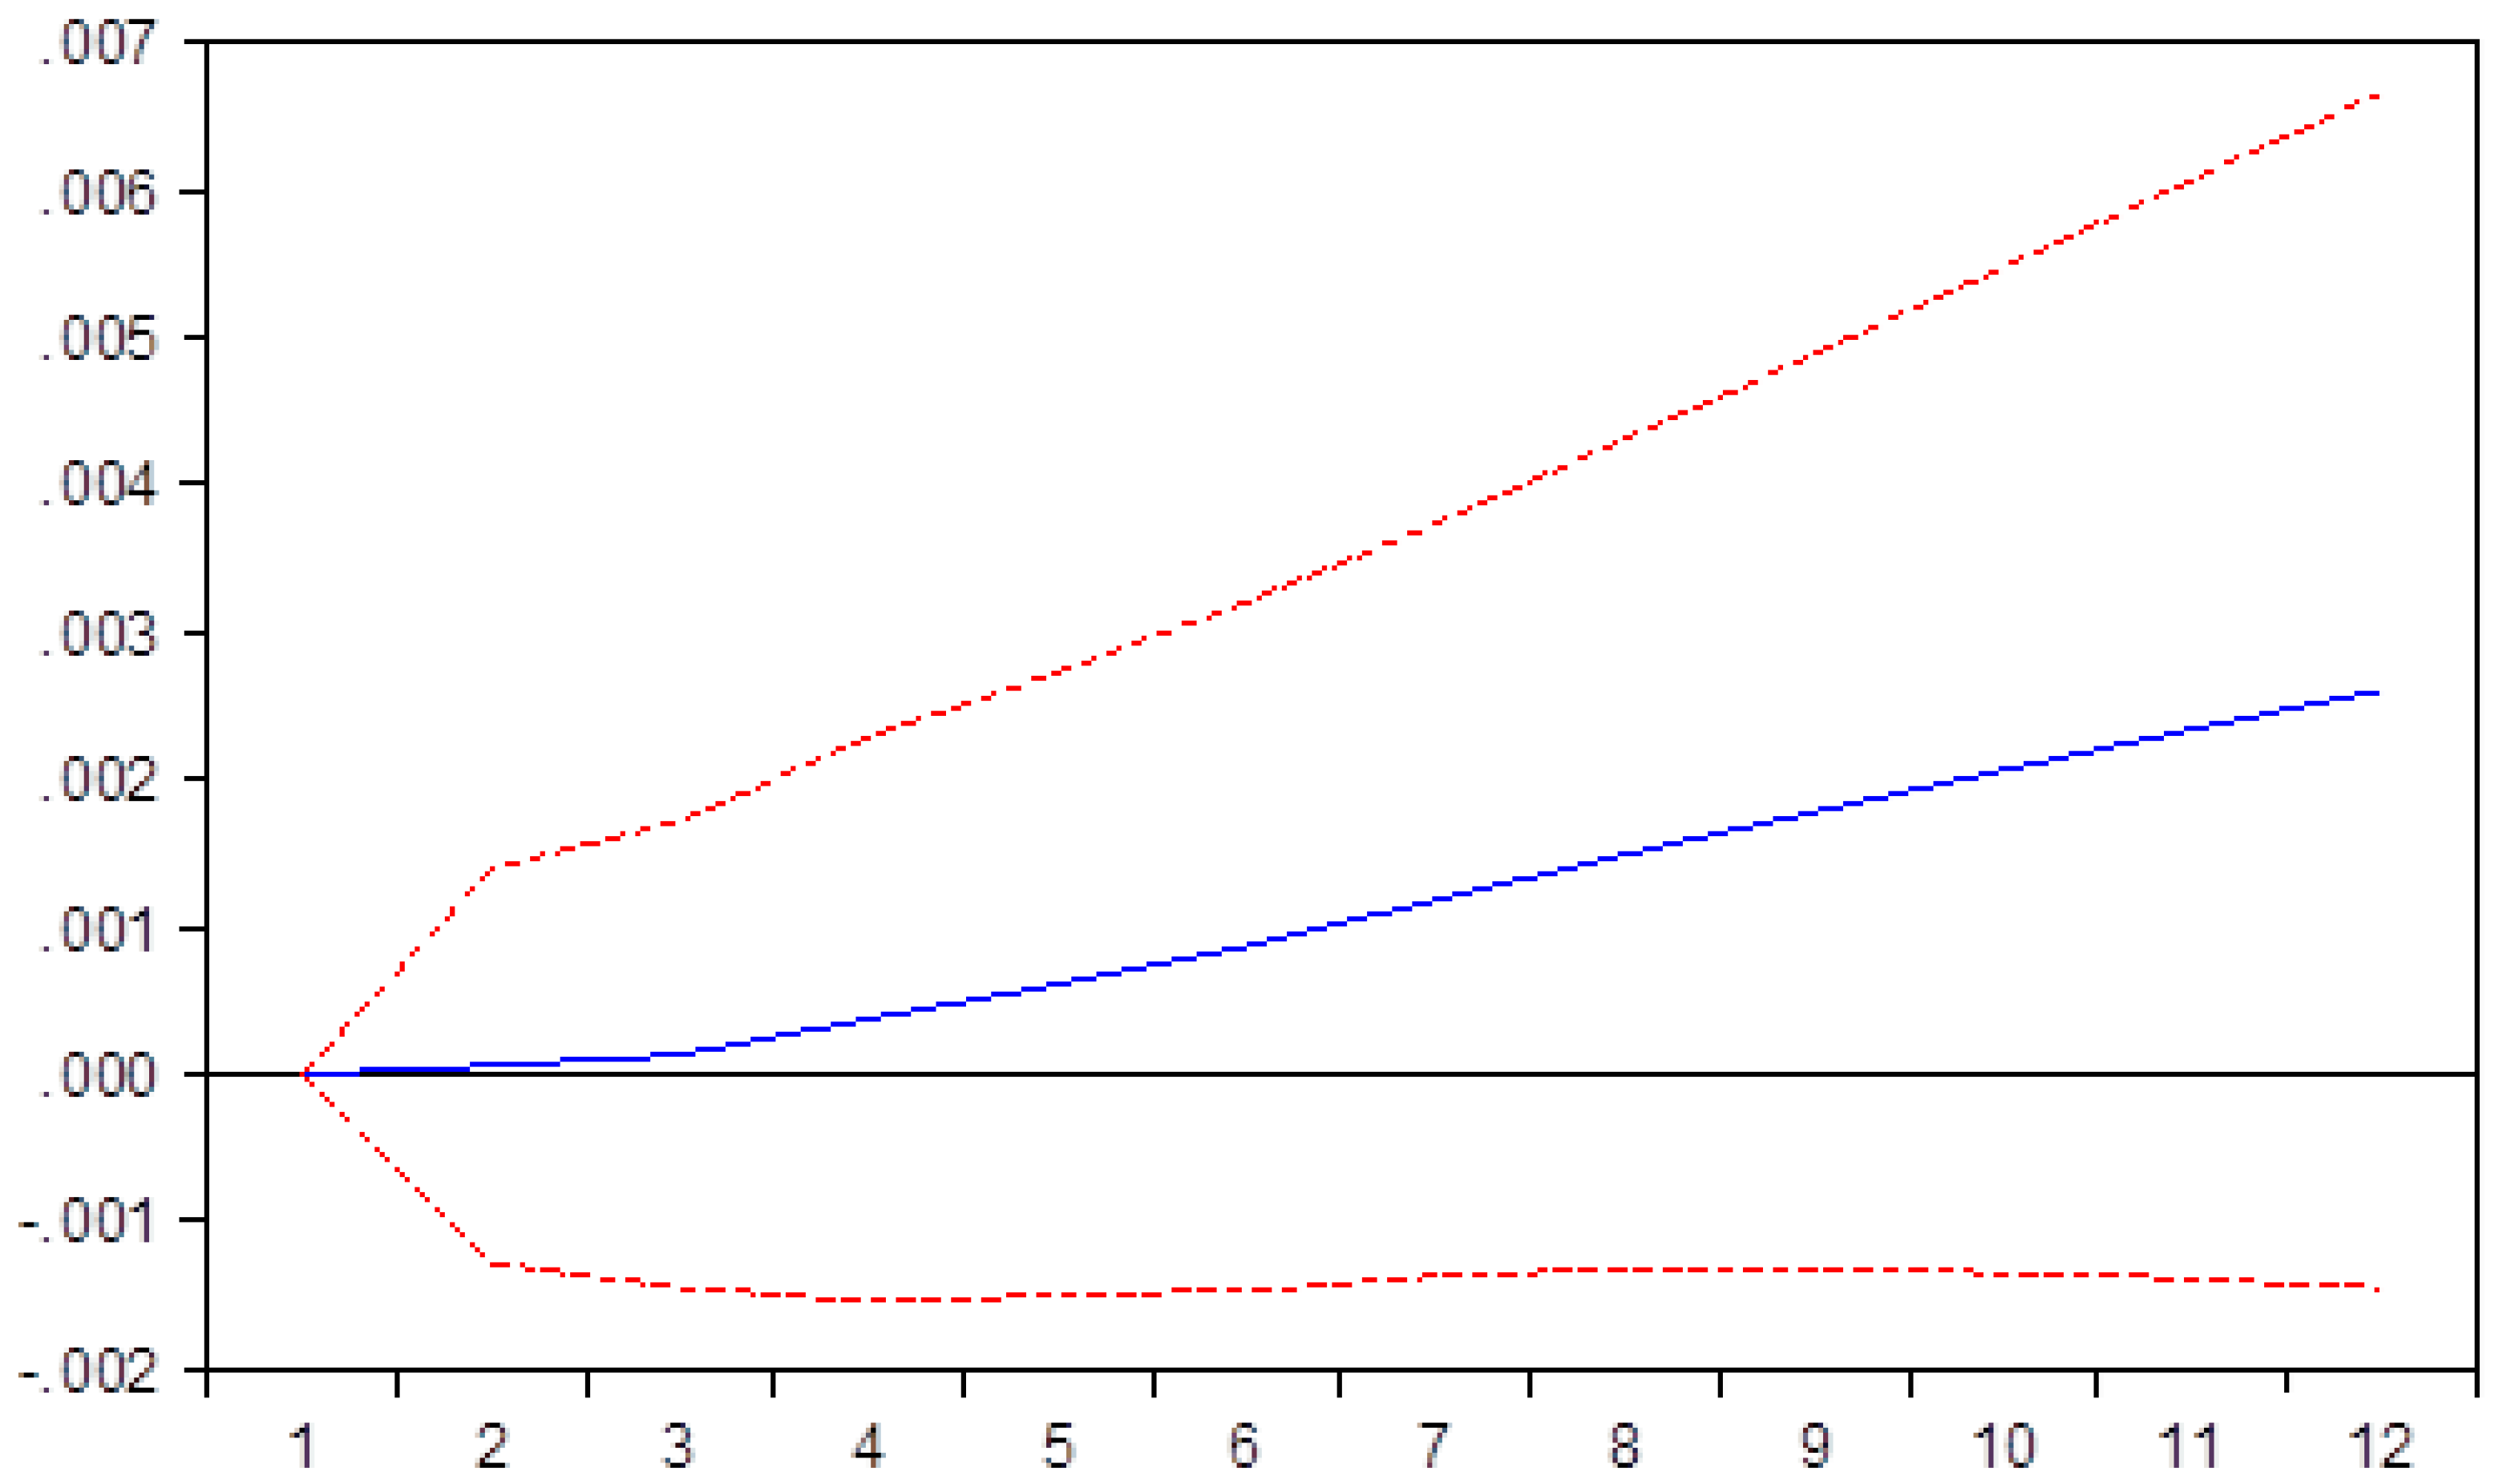
As one can observe in
Figure 6, the impact of the average net salary upon inflation is strong and permanent. Therefore, taking into consideration both graphs, an increase in salaries without an increase in productivity will generate inflation.
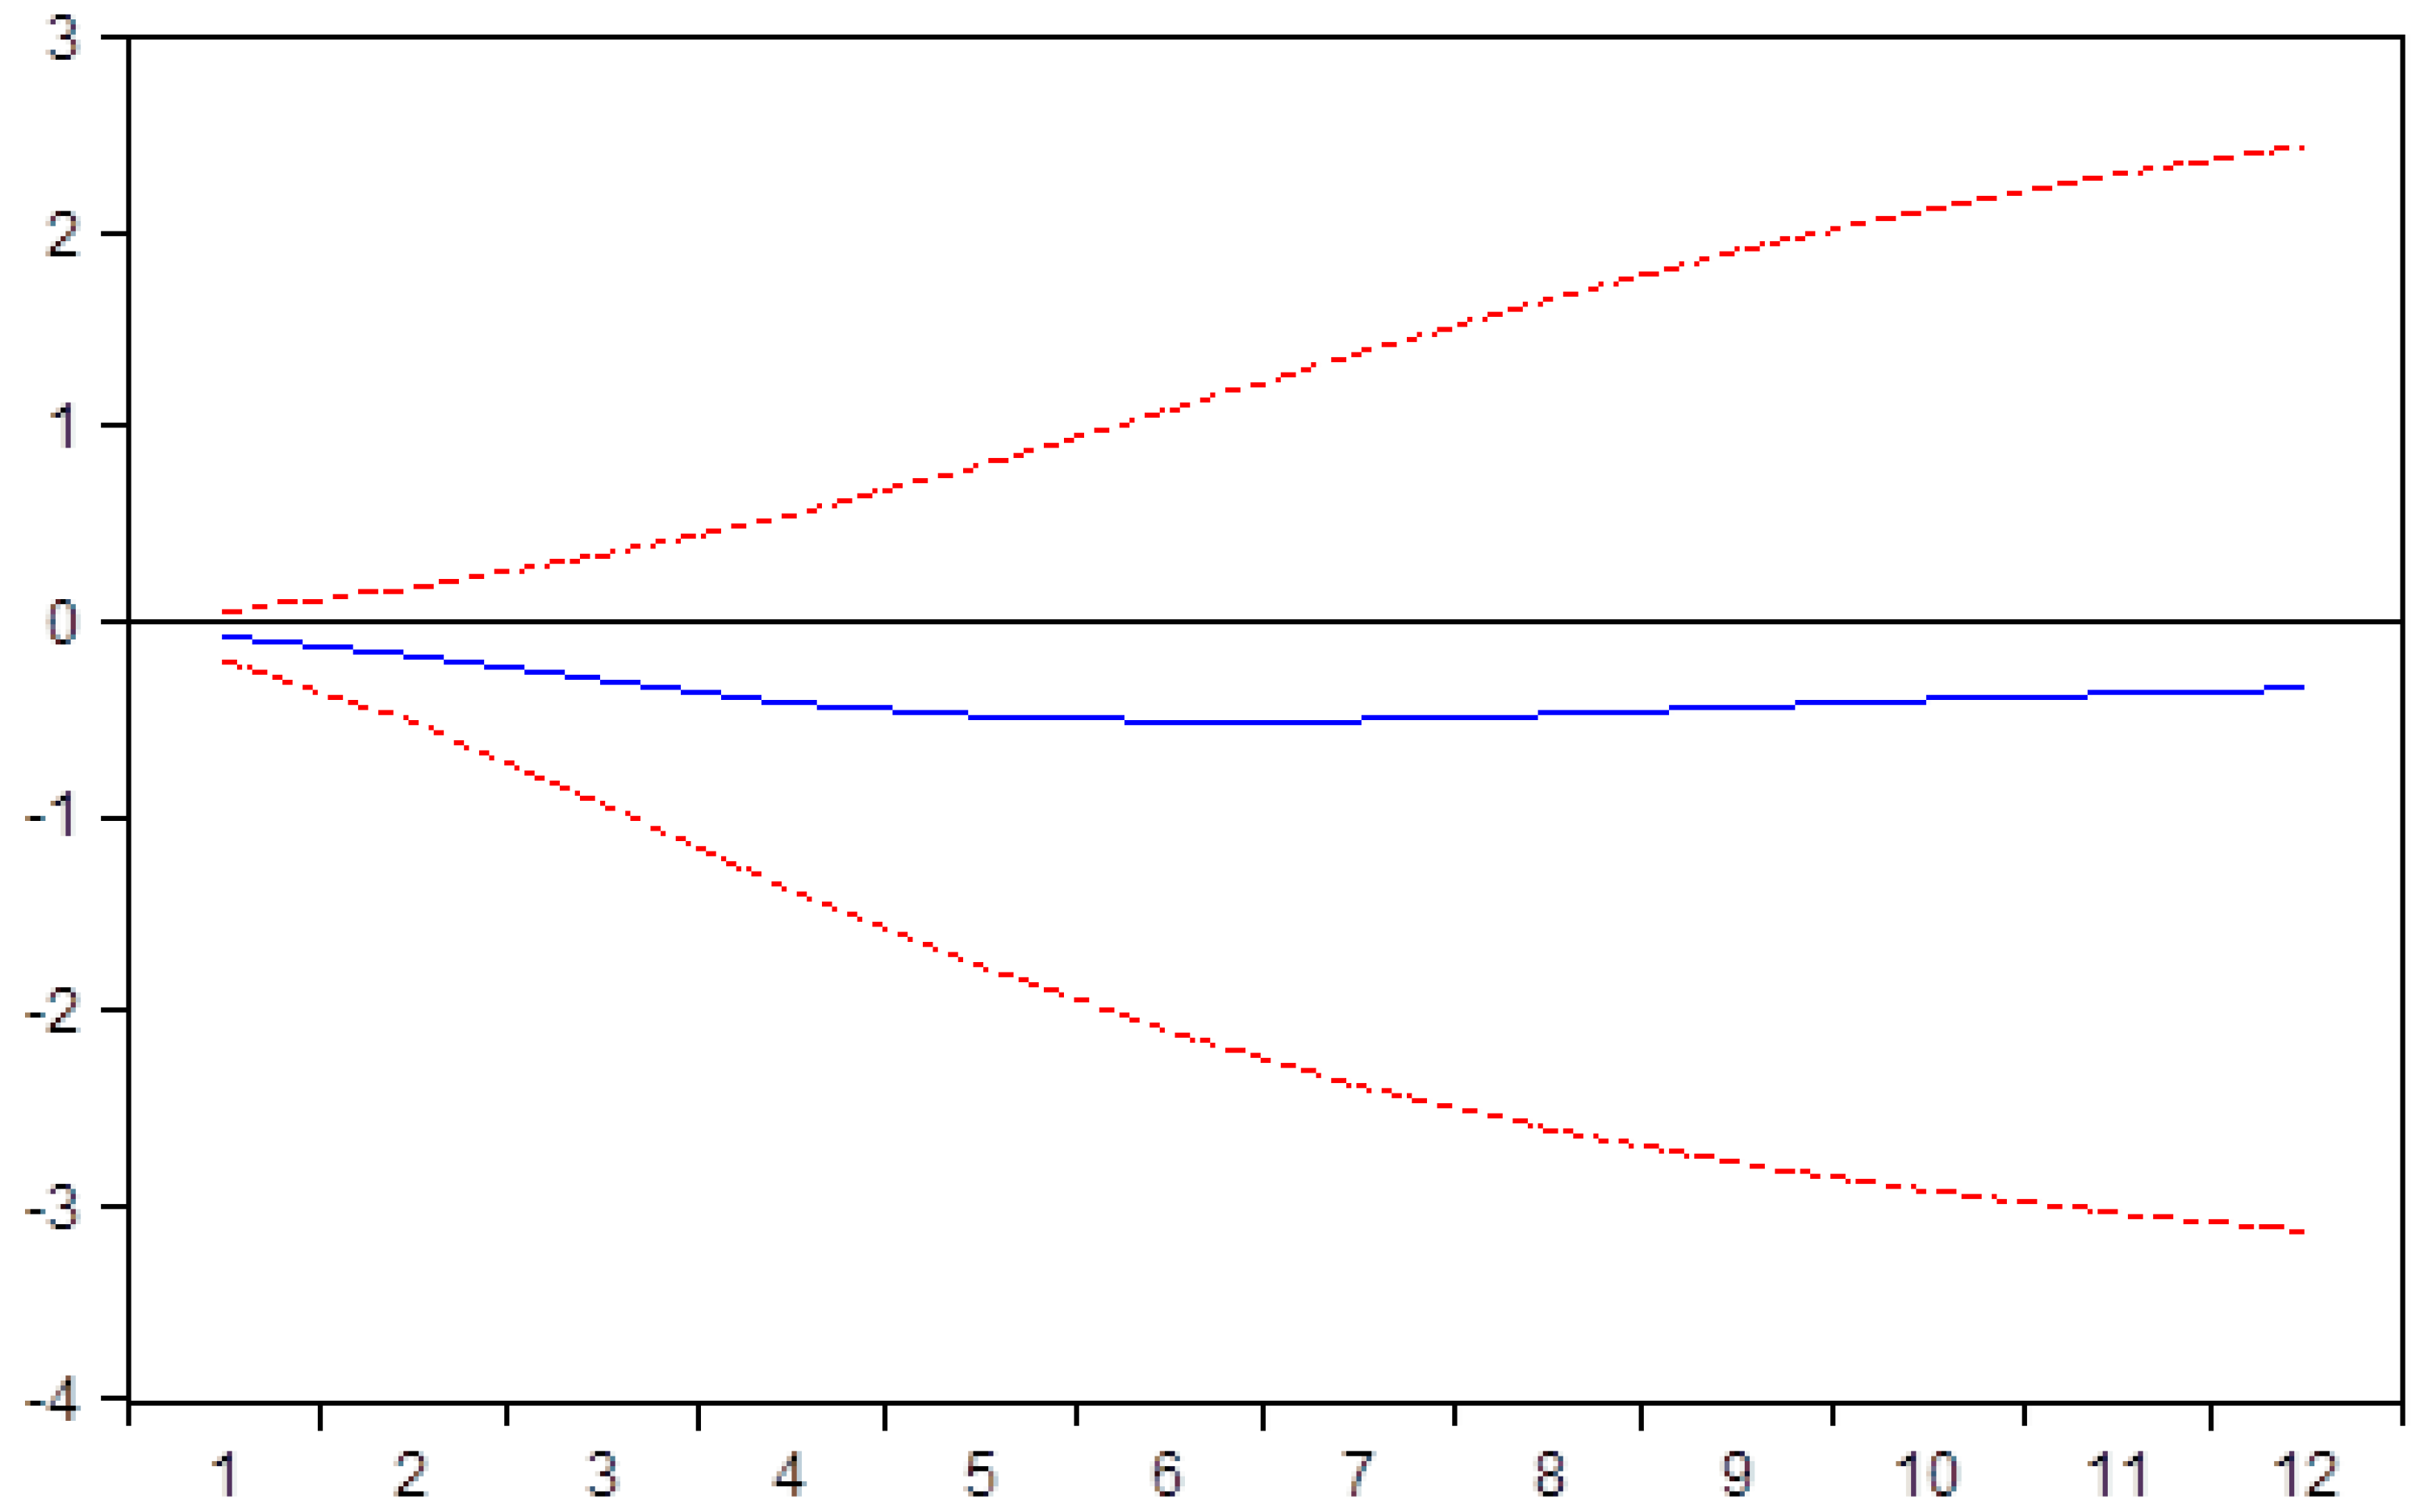
As one can observe in
Figure 7, the average net salary evolution has a mild negative impact on productivity. However, as one can see in
Figure 7, in Romania, the salaries were increased without taking into consideration the labor productivity. This was the case especially during the last two years since the wage-led growth strategy started to be applied in Romania.
5.2. Impact of Increasing Minimum Wage
As one can observe in
Figure 8, the impact of increasing the minimum wage upon the trade deficit is a negative one. However, taking into consideration the consumption habits of minimum wage employees, it is unlikely that they will consume imported goods and services, which have higher added value.
Figure 9 shows that by increasing the minimum wage, there will be an increase in employment, thus the number of employees will increase. This is also correlated with the increase of average salary, thus the shift in perception and in the labor habits which will determine the employees to get jobs rather than spending their free time at home.
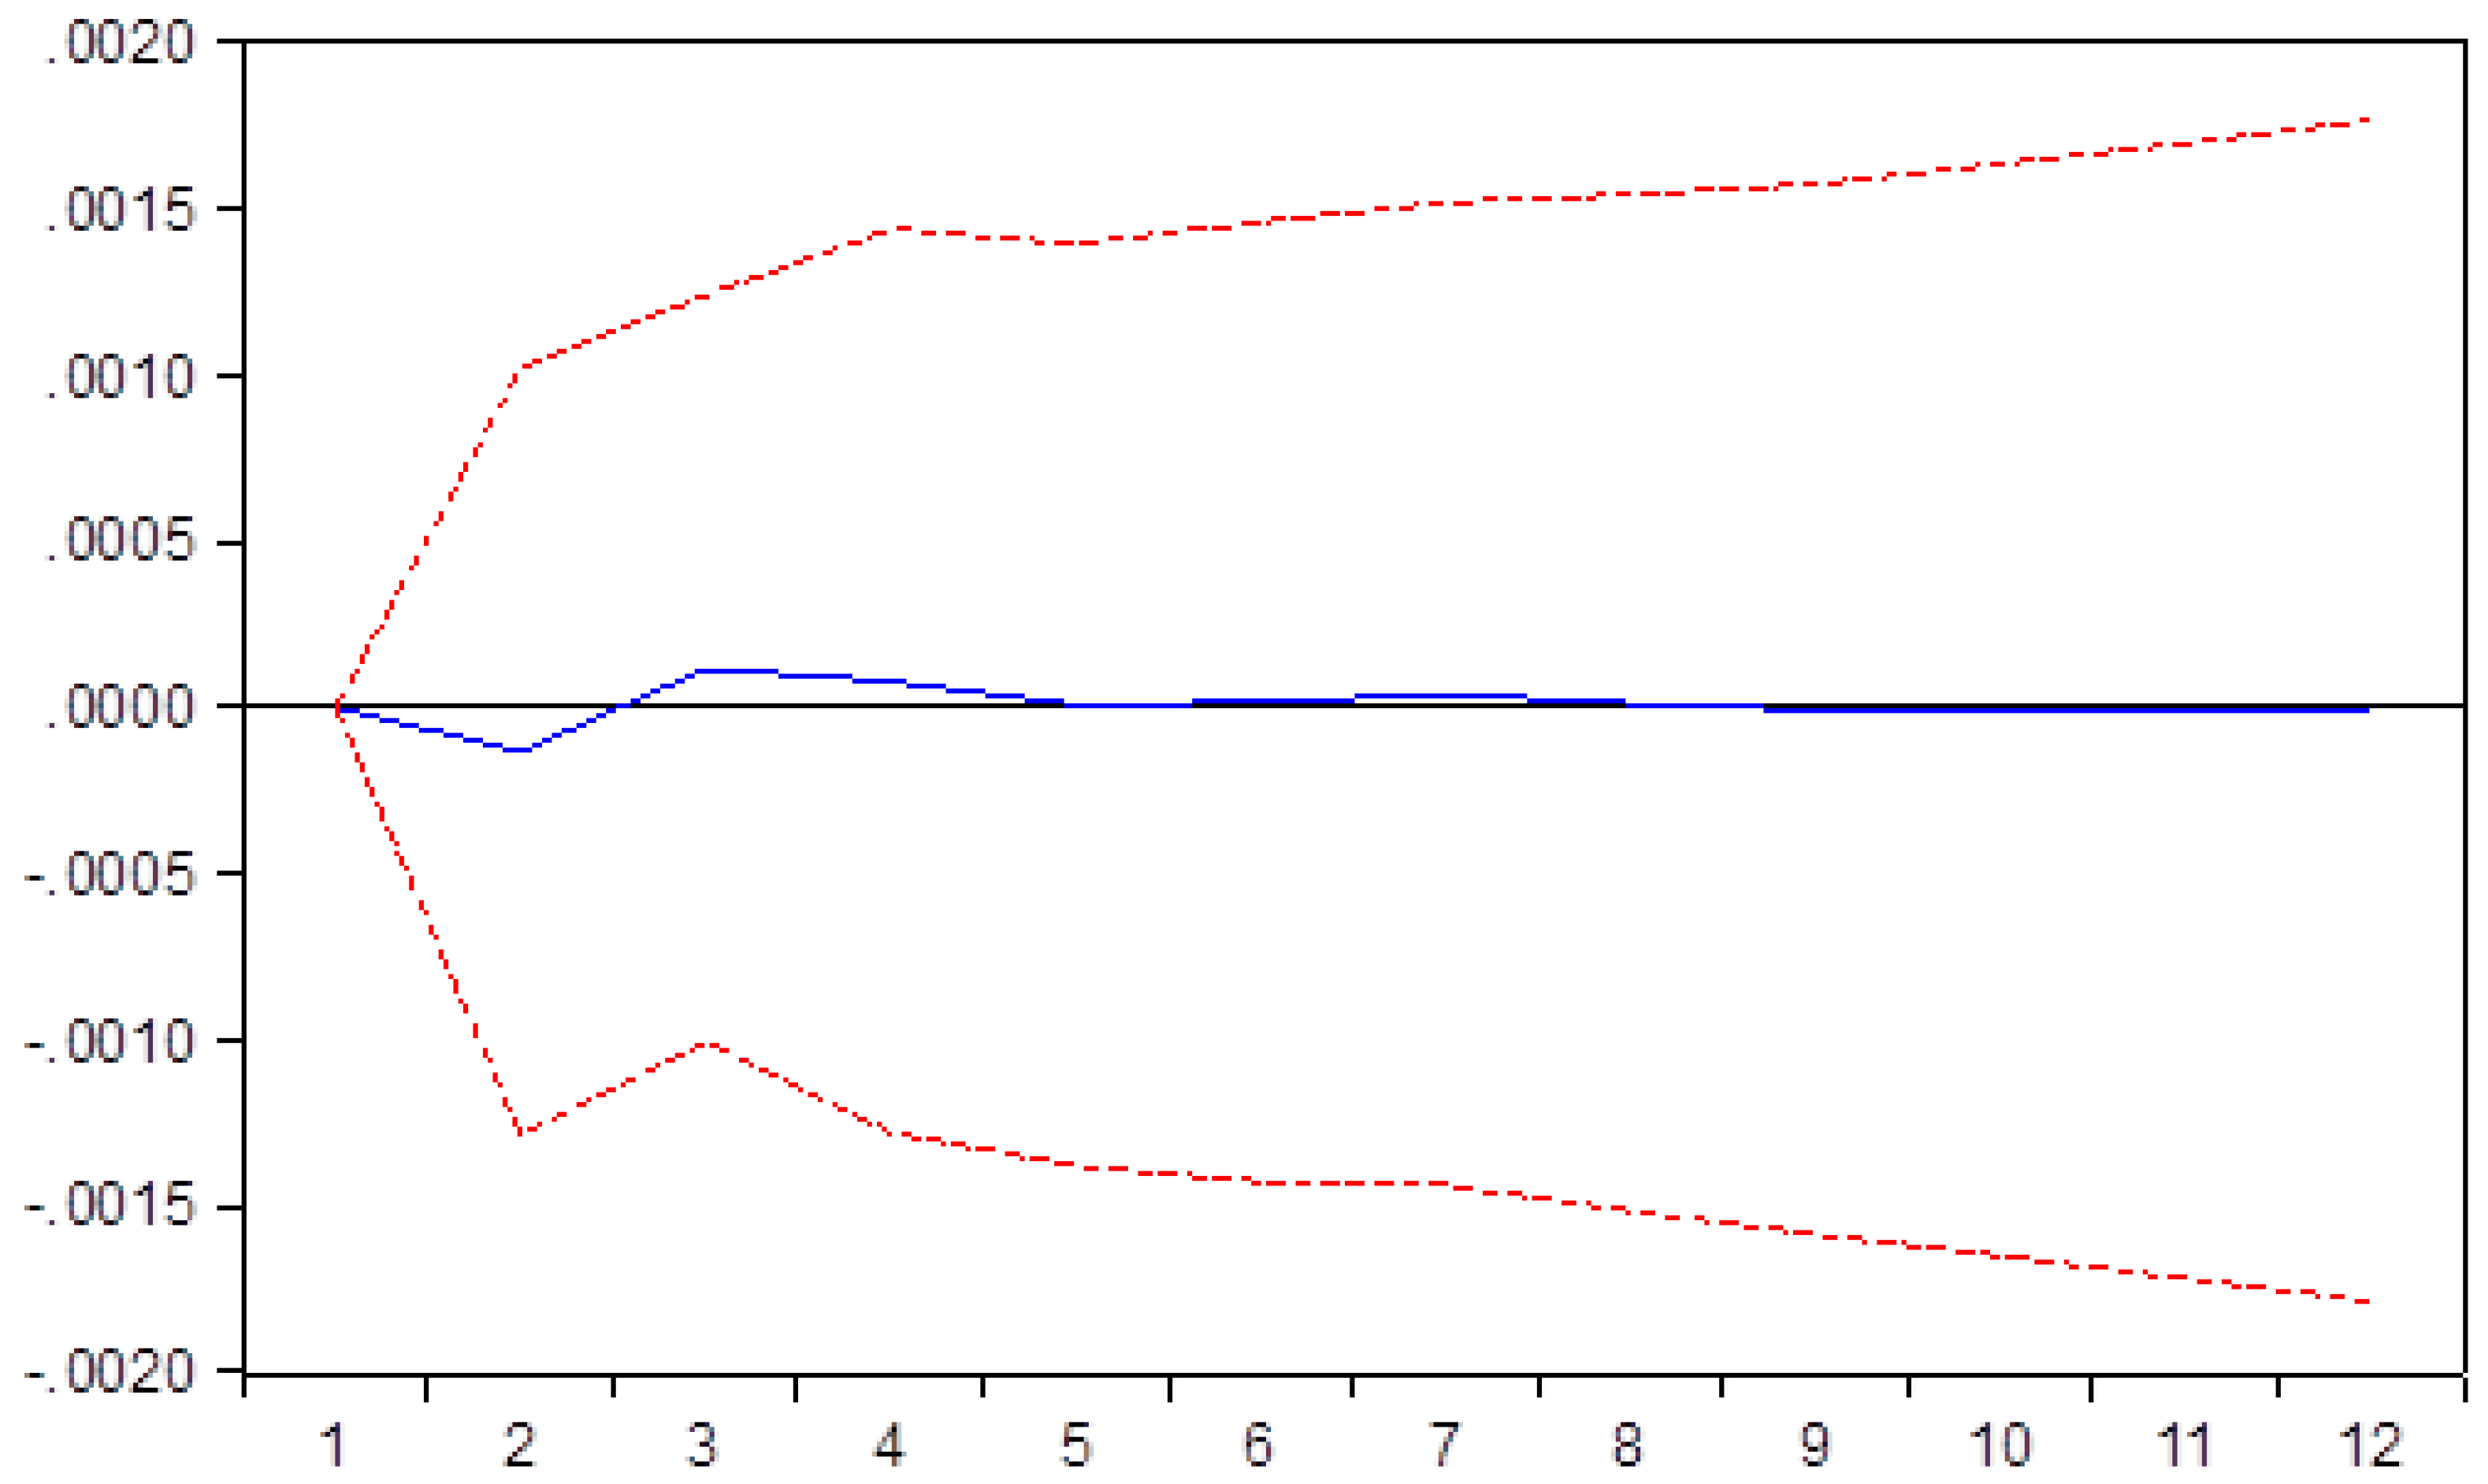
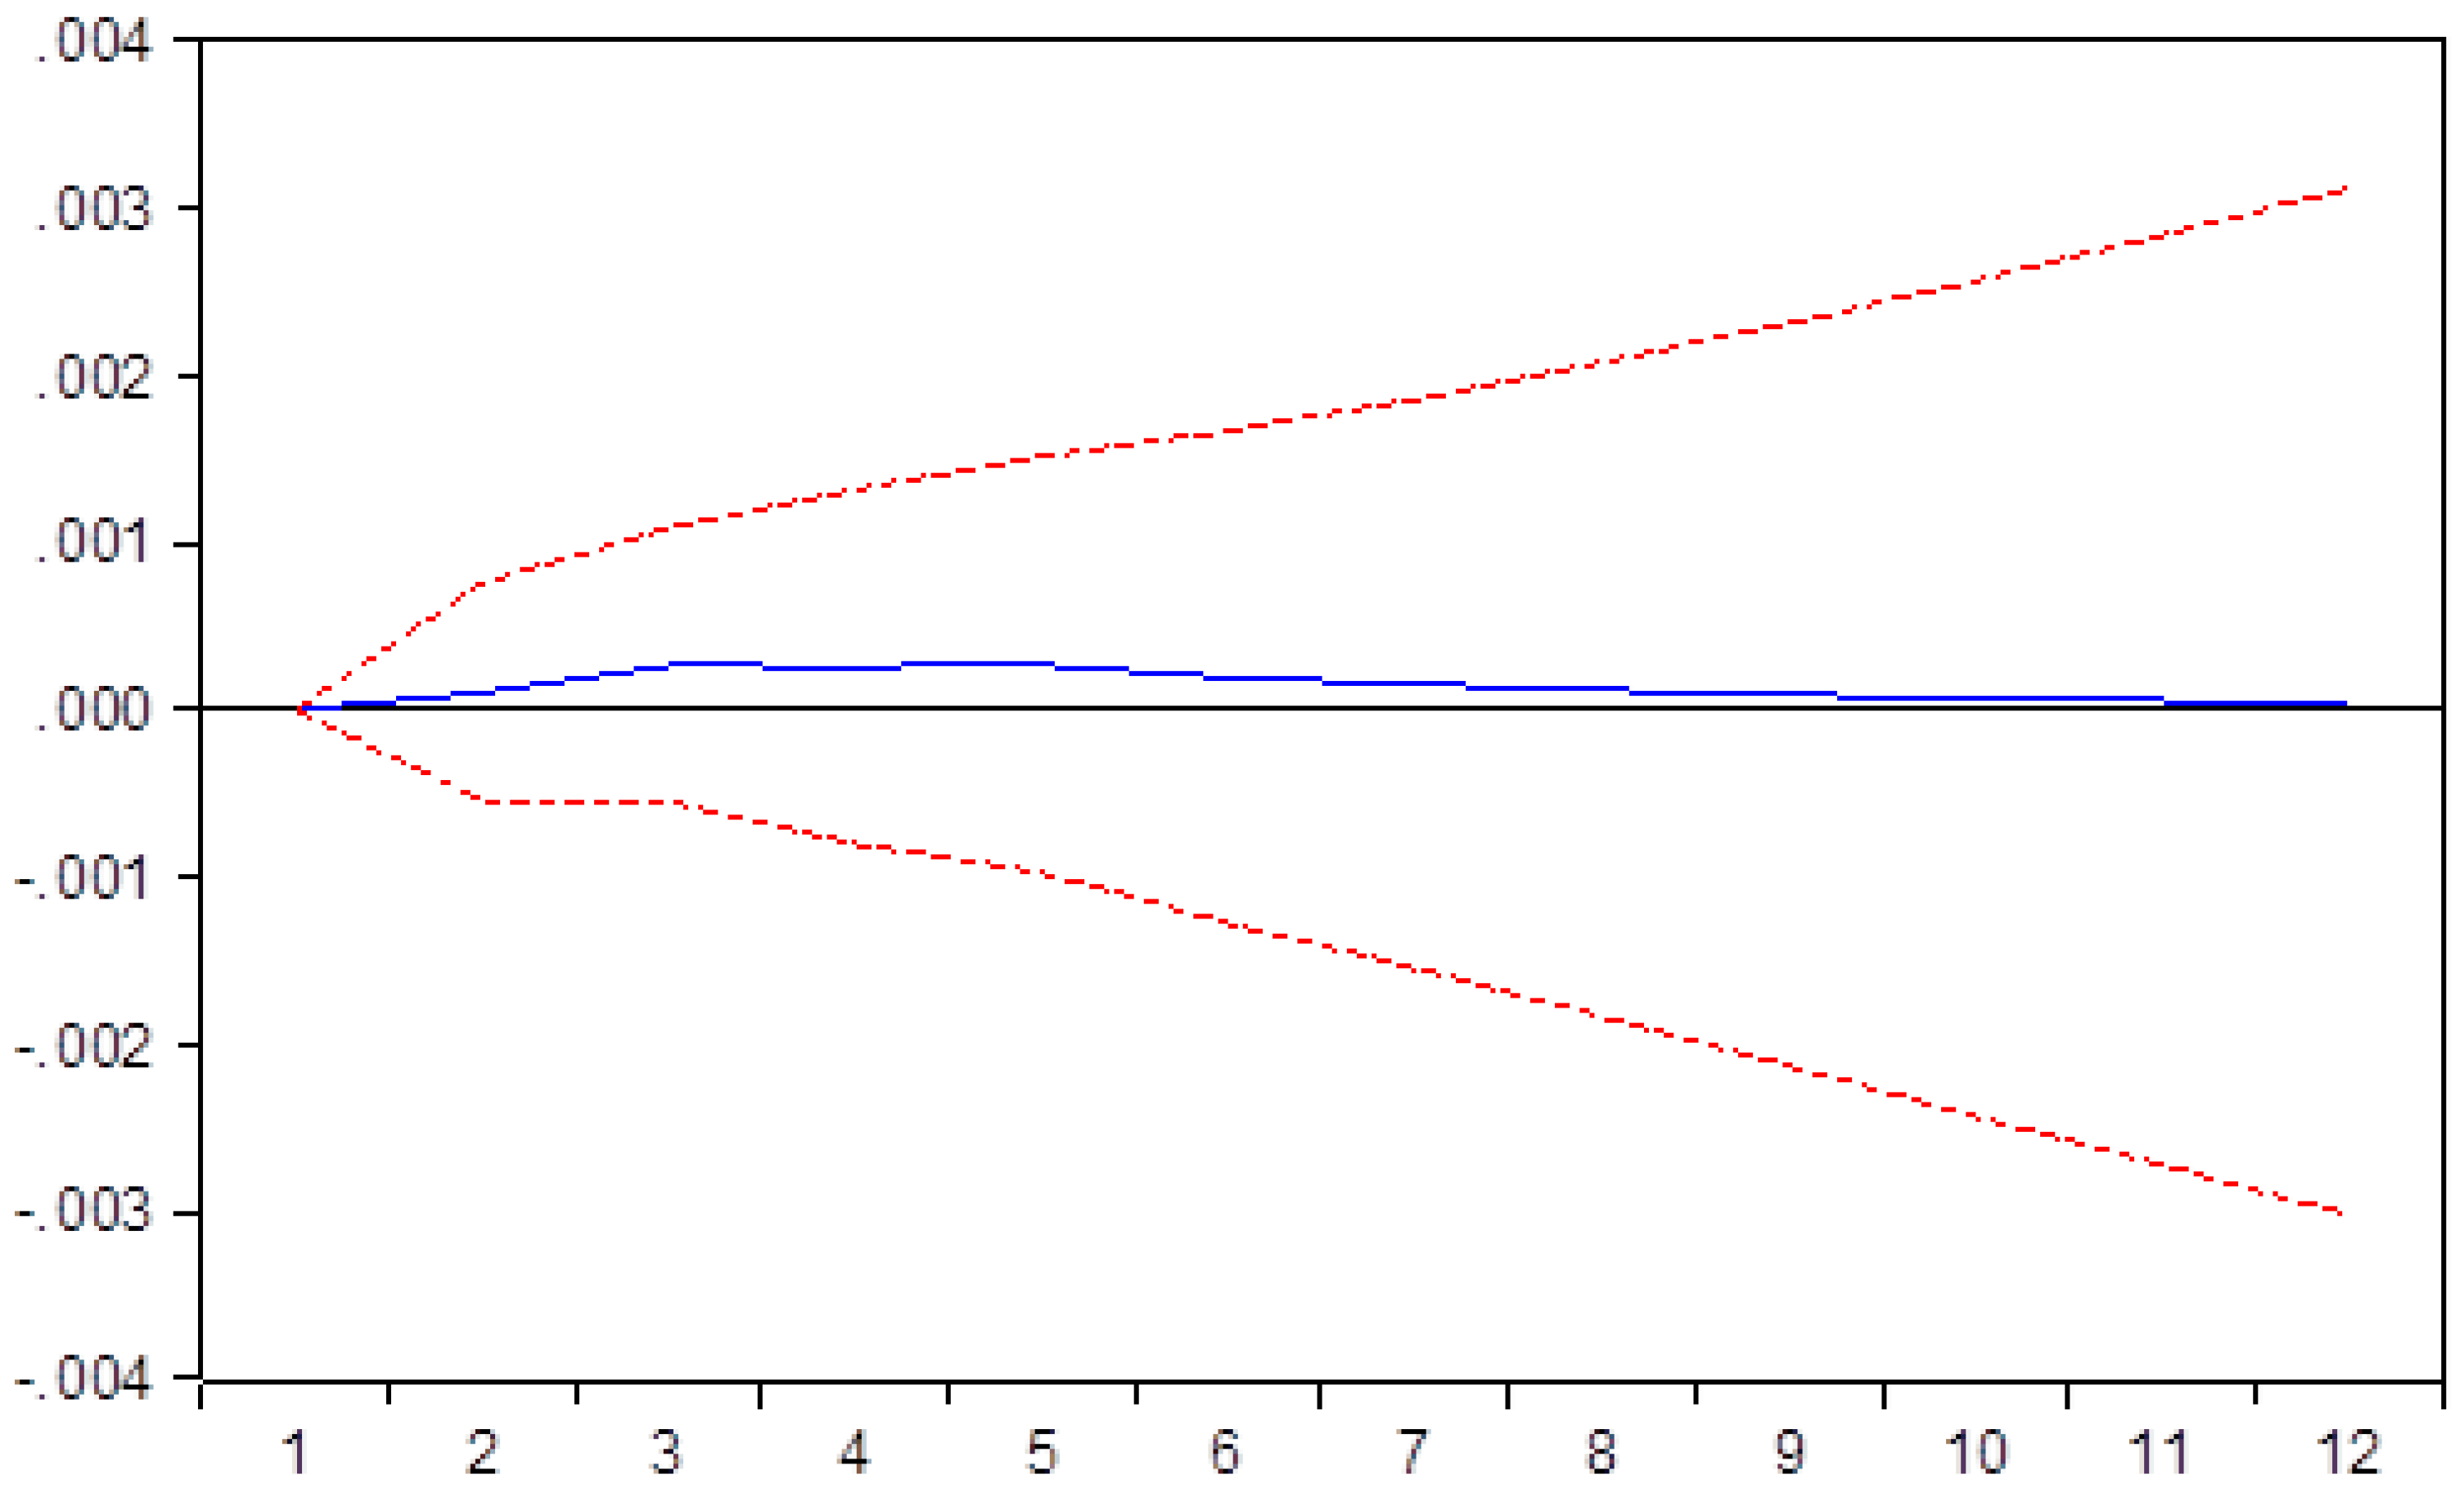
Increasing the minimum wage has no influence on inflation (see
Figure 10). The explanation is that the increases of the minimum wage are correlated with productivity and also that that these increases are relatively small being directed into basic consumption goods.
The impact of increasing minimum wage will have a positive impact on productivity (see
Figure 11). We can explain this by the relatively high number of employees that have minimum wage and thus the difference in increasing productivity is higher than that of the increased minimum wage. This spread between productivity and wage is larger on the productivity side, thus the increase in productivity.
5.3. Impact of Dummy Variable
Our dummy variable shows that wage-led growth will translate into inflation thus confirming the basic economic literature review (see
Figure 12). An increase in wage without a similar increase in productivity generates inflation, as the demand for products and services will increase due to a higher income, while the offer of goods and services stays at the same level in the absence of a better productivity or simultaneous increase of the production capacities generated by new investments. A wage-led growth policy and a consumption-led growth policy are nothing more than procyclical policies meant to stimulate growth in the short run. On the other hand, a stimulated policy of export-led growth is the only theory that stood the test of time and that makes sense in the long run, assuring sustainable growth.
A policy of wage-led growth has a neglectable impact on the number of employees.
Thus, a sustainable growth of wages, doubled by an increased productivity and good economic environment, are the only ways to reach sustainable employment. An arbitrary wage policy dictated by the government without taking into consideration basic economic laws could trigger the adverse effect.
Also, when the salaries in the public sector are growing faster than in the private sector, there will be a shift from the private sector to the public sector, as rational employees will seek better paying jobs. Of course, this action will impact the productivity of the private sector, thus the wage increases will be only for short periods, as the contributions of the private sector to the state budget are going to decrease (see
Figure 13).
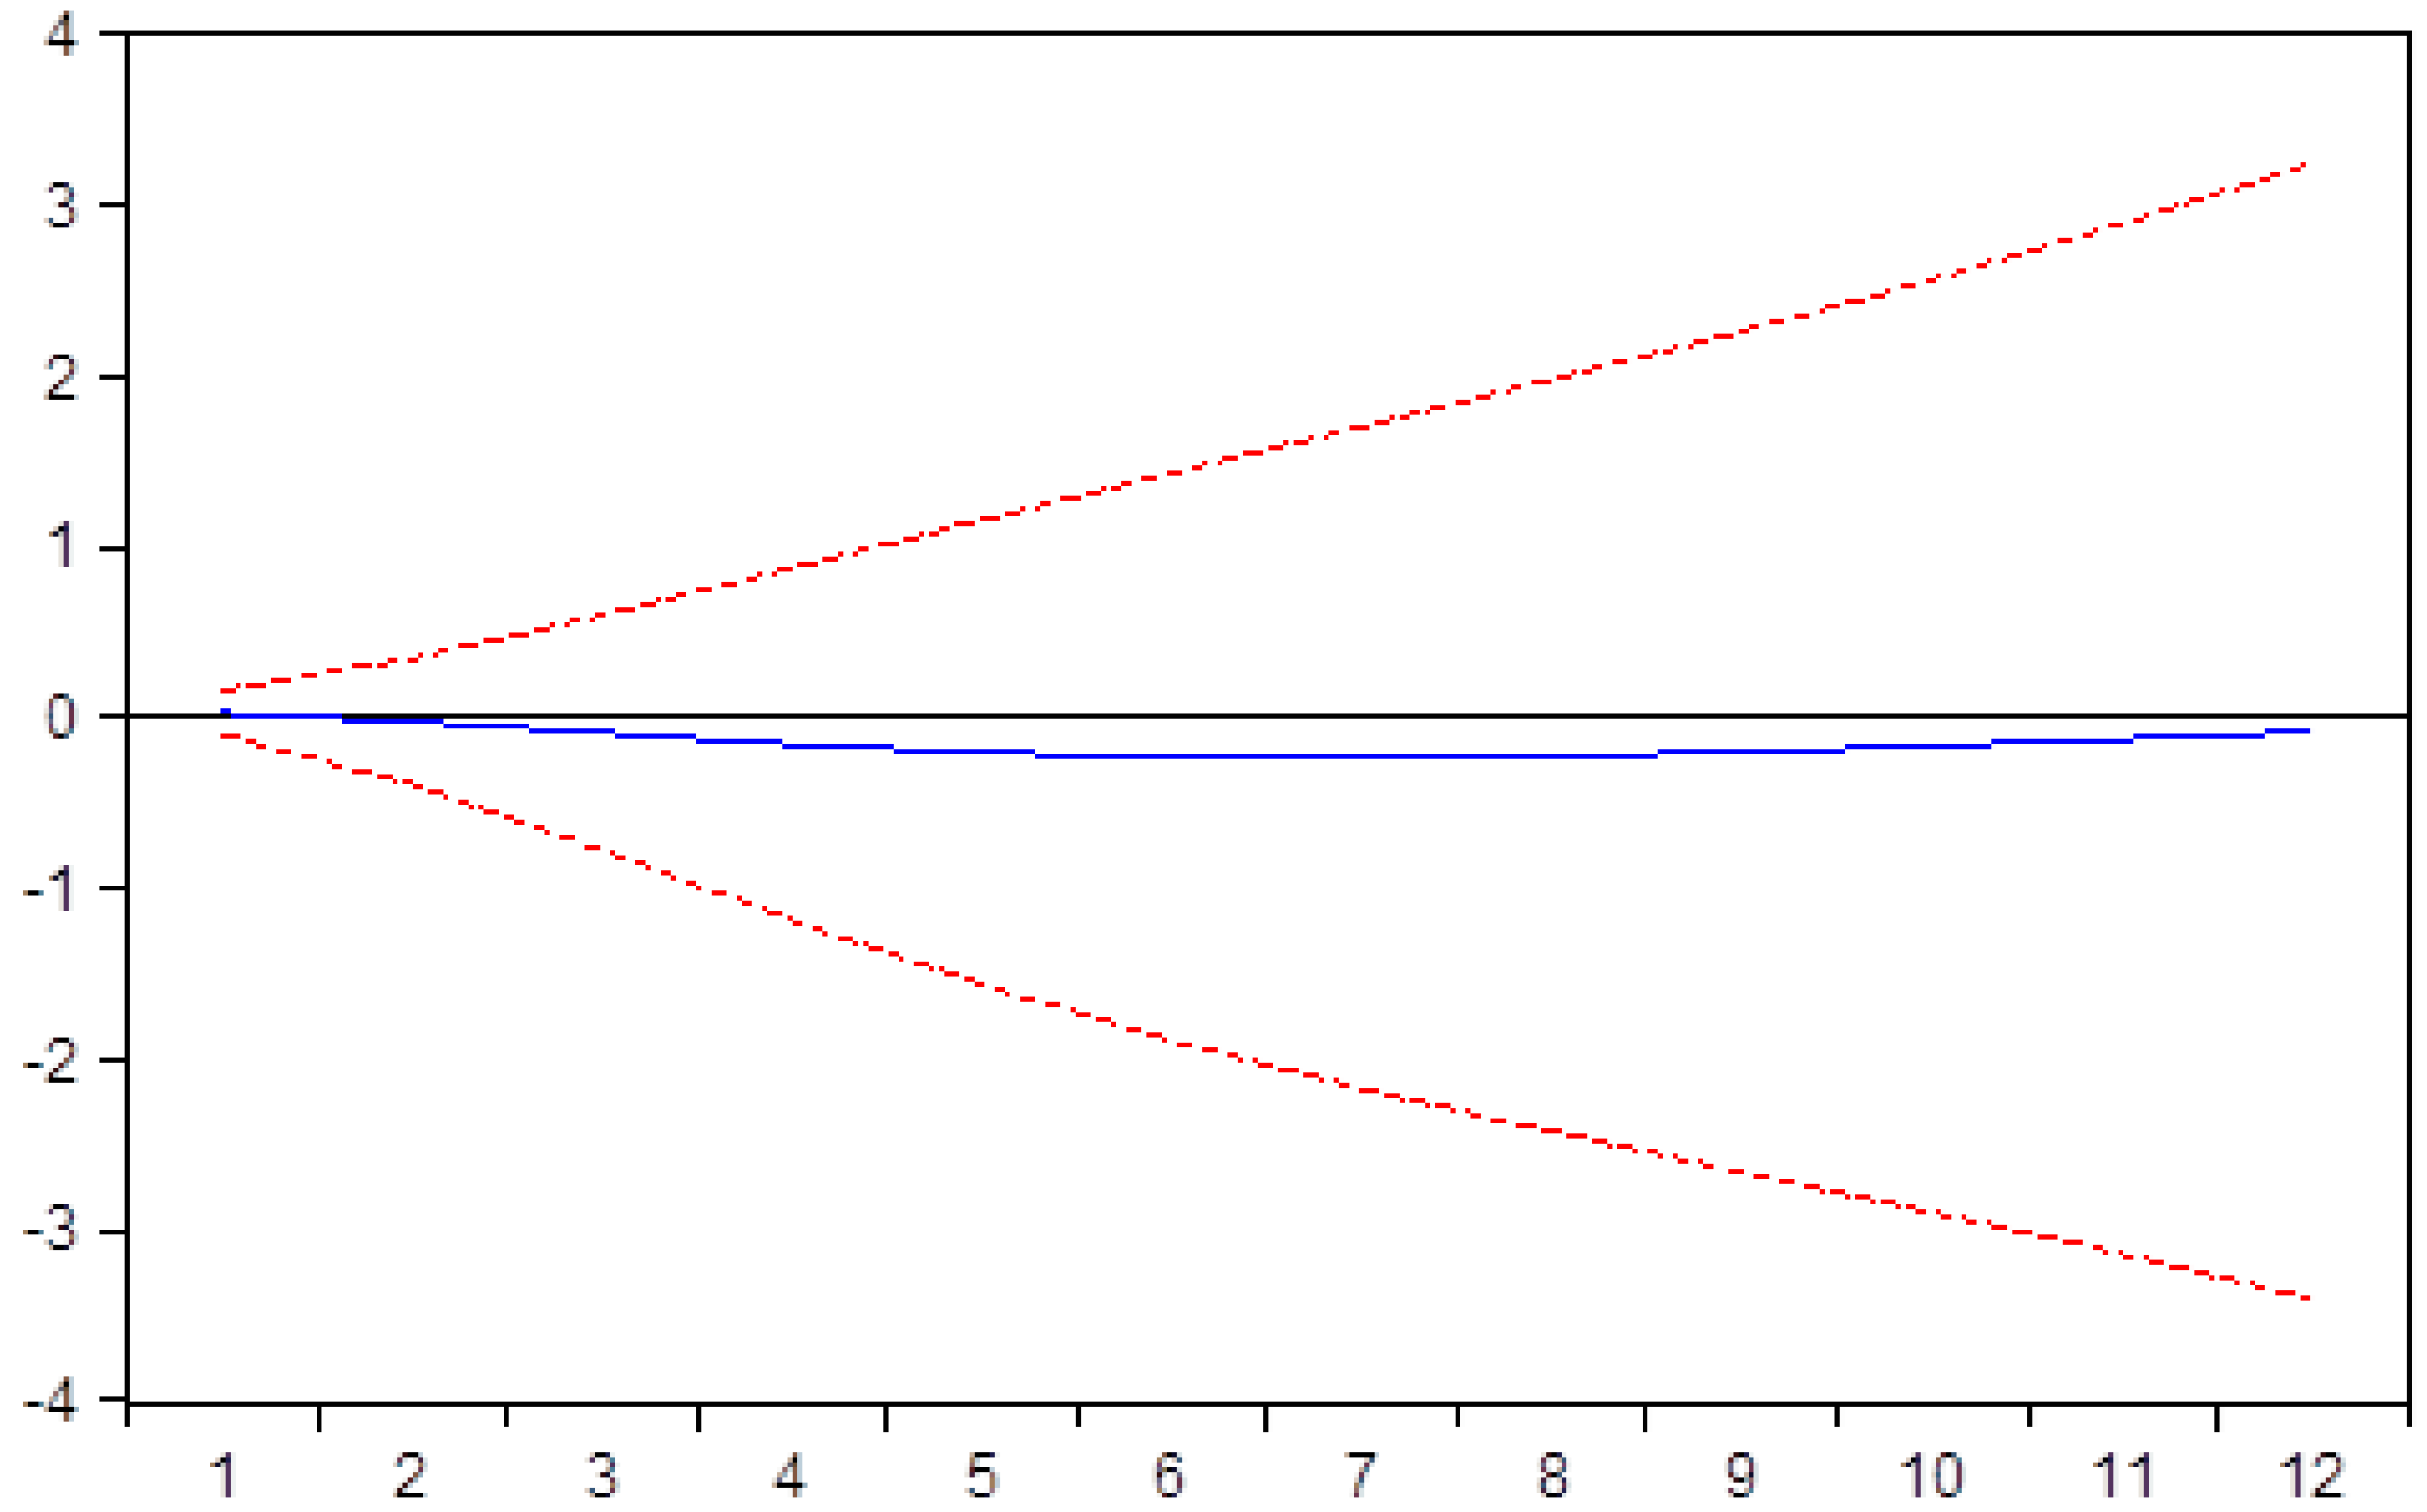
As analyzed in the figure above, the conclusion is demonstrated in
Figure 14, as wage-led growth will have a negative impact on productivity due to the changes on the salary policy.
Thus, the Romanian government, by increasing only the wages in the public sector instead of generating the positive effects that labor-led policies can have, contributed to a decrease of productivity.
Romania has at this point 5.2 million employees, of which about 4 million are in the private sector and 1.2 million employees are in the public sector. With the larger wage increases in the public sector, the Romanian labor market has seen a shift in preferences from the private sector to the public sector and in caeteris paribus conditions as migrations from the private sector to the public sector occur.
6. Discussion and Conclusions
For Romania, the lack of conformity between the different political and elective cycles from the latest years and the almost annual presence of electoral campaigns with different stakes (parliament elections, presidential elections, local, or European elections), were opportunities to display populist public policies. Therefore, populist policies promoted by the governing authorities were aiming to attract the electors through increases in their pensions or wages, politics that are in many cases unsustainable.
The increase of the minimum wage, out of purely populist reasons, proved to be a measure that lead to distortions of the work market. A populist increase of wages only brings an illusory prosperity and leads to an inflationary increase in prices; increase that is followed by changes in the exchange rate and the diminished competitivity of companies that are involved in exports, that once wages grow are losing their competitive advantage they used to have before the wage change.
If we consider an average productivity of about 60% of the EU average and an average wage of about 40% of the European average, we can talk about a clear competitive advantage of the Romanian economy. However, an increase of the minimum wage without any connectivity to productivity will cancel this competitive advantage and therefore decrease the intensity of growth of the Romanian economy.
One can notice that the public policy measures that are targeting electoral advantages are severely affecting the robust, sustainable growth, exposing the economy to severe recessionist shocks.
We can observe that the public policies of decision makers have a strong pro-cycle tendency in the last years, using wage growth and encouraging consumption. The purpose of these populist measures was surely achieved in the short term, Romania for two years in a row having one of the highest economic growths in the EU. But at what cost? The limits of this approach started to show in Romania and deficits are getting out of control. The trade deficit of the first three months of 2019 was 34% bigger than that of the previous year. Also, Romania is the only country in the region that has constantly registered a trade deficit in the last 10 years. States as the Czech Republic, Poland, Bulgaria, or Hungary constantly register trade and current account excess. Their economic growth, even if they are smaller in value, are more robust and therefore sustainable.
As the increased pensions and wages were used to buy mainly imported goods, the Romanian economy could not produce enough to satisfy the demand that grew because of increased salaries in the economy.
Problems such as budgetary, trade, and current account deficits, diminished direct foreign investments, local currency depreciation and inflation are the price of the populist measures taken by the government that raised the wage-led growth concept at public policy rank. Annulling some of the competitive advantages and increasing the macroeconomic disequilibrium highly exposes the Romanian economy to recession pressure.
Our paper shows that the worries regarding the present situation are justified, and that a wage-led growth policy affects and deepens the economic disequilibrium.
The results of our paper are consistent with the literature. It shows that wage-led growth policy has a negative impact on economic equilibrium.
Our hypothesis, namely that the influence of increasing the average wage or the minimum wage is going to generate the increase of the trade deficit, inflation, but also of the number of employees, was validated, showing that the wage-led growth strategy is widening the main macroeconomic deficits and also inflation.
Our main findings are as follows: 1) An increase in salaries on the Romanian labor market will stimulate employment; 2) the impact of the average net salary has a strong and permanent impact on inflation; 3) the impact of the average net salary has a mild negative impact on productivity; 4) the impact of increasing minimum wage has a negative impact on trade deficit; and 5) increasing the minimum wage, there will be an increase in employment, thus the number of employees will increase
What really counts, in our opinion, is that the wage increases are not correlated with labor productivity, an aspect that was completely ignored in the last three years. Also, the mix of fiscal, monetary, and budgetary policies, through the adopted wage policy generated growth based on consumption. The frailty of the Romanian economy and the weight of the permanent expenditure generated by populist policies (pensions and wages in the public sector), will leave the Romanian economy exposed to future recessionist shocks that can be not only exogenous but also endogenous.

 ,
, 


