Abstract
The increasing integration of photovoltaic (PV) power plants into power systems demands a high accuracy of yield prediction and measurement. With this aim, different global horizontal irradiance (GHI) estimations based on new-generation geostationary satellites have been recently proposed, providing a growing number of solutions and databases, mostly available online, in addition to the many ground-based irradiance data installations currently available. According to the specific literature, there is a lack of agreement in validation strategies for a bankable, satellite-derived irradiance dataset. Moreover, different irradiance data sources are compared in recent contributions based on a diversity of arbitrary metrics. Under this framework, this paper describes a characterization of metrics based on a principal component analysis (PCA) application to classify such metrics, aiming to provide non-redundant and complementary information. Therefore, different groups of metrics are identified by applying the PCA process, allowing us to compare, in a more extensive way, different irradiance data sources and exploring and identifying their differences. The methodology has been evaluated using satellite-based and ground-measured GHI data collected for one year in seven different Spanish locations, with a one-hour sample time. Data characterization, results, and a discussion about the suitability of the proposed methodology are also included in the paper.
1. Introduction
The integration of renewables into current power systems is attracting much attention. Indeed, sustainability of energy policies and their mid-term outlooks are currently a topic of interest for major agencies. Ellabban et al. affirm that the renewable energy resource potential is enormous, as such resources can, in principle, exponentially exceed the world’s energy demand [1]. However, due to the intermittent nature of such renewable energy resources, it is necessary to address different challenging issues, as they are significantly different from the conventional resources [2]. Moreover, in terms of solar resources, the inherent variability of large-scale solar generation requires an accurate power/irradiance forecasting, which is critical to secure the economic operation of power systems and future smart grids [3].
A relevant number of methodologies have been proposed to measure and forecast global solar irradiation, being considered essential for the design, economic evaluation, and performance analysis of photovoltaic (PV) power plants and their integration into power systems [4,5]. A recent review of power forecasting models for renewables can be found in [6]. By considering the different methods and proposals, their validations were carried out through a variety of measures of errors based on the author’s criteria and mainly focused on averaged statistical test results. Notton et al. proposed the application of artificial neural networks—assessed by relative root mean square error (rRMSE) and relative mean absolute error (rMAE)—to estimate solar irradiance on tilted planes [7]. In a similar way, relative mean bias error (rMBE), rRMSE, determination coefficient (), and ’d’ Willmott index were used to evaluate both artificial neural networks and support vector machine applications [8]. Bouchouicha et al. used root mean square error (RMSE) and rRMSE to validate a readjusted model over the Algerian Big South [9]. Noorian et al. evaluated 12 models to estimate hourly diffuse radiation on inclined surfaces by determining the rRMSE [10]. An extensive comparison—over 90 contributions—of estimated solar radiation models was performed by Teke et al., to suggest the most accurate models [11]. In this revision, and according to the most commonly used statistical test results, linear modeling, non-linear modeling, artificial intelligence modeling, and fuzzy approaches were compared accordingly.
According to the specific literature, it can be affirmed that most contributions are evaluated by applying the rRMSE and rMAE. During the last years, different applications have been proposed for global horizontal irradiance (GHI) based on new-generation geostationary satellites; highly appropriate to monitor remote areas and large-scale territories with minimum capital and operating costs. Subsequently, a growing number of solutions and databases are then available online to provide such potential, for instance PVWatts [12], PVGIS [13], Global Atlas [14] and SolarGIS [15]. Nevertheless, Piasecki et al. affirm in [16] that, to the best of the authors’ knowledge, the satellite/reanalysis data have so far not been compared with the measurements provided by the National Institute of Meteorology and Water Management (Poland) from the renewable energy sources perspective. Other contributions are focused on analyzing these satellite data. For example, Bódis et al. combined satellite-based and statistical data sources with machine learning to provide a reliable assessment of the technical potential for rooftop PV electricity production with a spatial resolution of 100 m across the European Union (EU) [17]. Psiloglou et al. recently published a comparison between satellite-based data sets and reanalysis against ground measurements by considering only an isolated rural area [18]. Boca et al. evaluated a multiple–regression approach model for fast estimation of PV potentials over Europe and Africa based on the PVGIS database and through the mean absolute percent error (MAPE) [19].
Data based on moderate resolution imaging spectroradiometer (MODIS), along with conventional meteorological data, are used in [20] to estimate monthly-mean daily global solar radiation. Two statistics: general mean bias deviation (gMBD) and relative general mean bias deviation (rgMBD) are applied in [21] to validate the estimated GHI by using satellite-based spectral irradiance data. Pierro et al. provided RMSE scores to evaluate PV power estimation and forecasts through satellite and numerical weather prediction data [22]. In addition, Tang et al. used mean bias error (MBE), RMSE, and rRMSE to evaluate whether GHI estimations can be improved by increasing the frequency of satellite observations. Recently, the mean absolute difference (MAD) was determined in [23] to compare global irradiation from a satellite estimate model and on-ground measurements. Satellite-based solar radiation data were also used by Buffat et al. to estimate the rooftop solar irradiation potential over large regions. The correlation coefficient and a median monthly relative error were applied to estimate the accuracy of such estimations [24]. Other authors have proposed methods for estimating the direct normal irradiation from GOES geostationary satellite imagery for concentrating solar systems. In this case, MBE and RMSE averaged values are used to validate the methods [25]. Pfenninger et al. used RMSE results to validate long-term patterns of European PV output by means of 30 year hourly reanalysis and satellite data [26]. Ernst et al. compared ground-based and satellite-based irradiance data by using confidence interval results [27].
By considering the contributions previously discussed, and regarding the appropriate metrics, most of the authors propose and use the following strategies: RMSE, MBE, and the relative versions of each (rRMSE and rMBE), the mean absolute error (MAE), Pearson correlation coefficient (r), and the standard deviation of the residual (SD). Moreno et al. is a recent example of the metric application from Meteosat Second Generation (MSG) images [28]. Gueymard reviews validation methodologies and statistical performance indicators for modeled solar radiation data, dividing possible statistical indicators into four categories, directly proposed by the author [29]. In this framework, a review of the literature demonstrates that there is a lack of agreement in validation strategies for a bankable, satellite-derived solar irradiance dataset [30]. Therefore, and due to the lack of agreement in validation methodologies of solar irradiance datasets, the aim of this paper is focused on the following objectives:
- An extended estimations of metrics to compare GHI satellite data to on-ground data.
- A correlation analysis to identify similarities by considering homogeneous behaviors of such metrics.
- A principal component analysis (PCA) application to divide the metrics into different categories and propose independent indicator groups to be considered for comparison data purposes.
2. Methodology
According to the literature review, different metrics have been defined and used to validate the GHI data from ground measures or satellite–derived data. Table 1 summarizes such definitions by including expressions and mathematical references, where and represent the satellite-based GHI and the ground-measured GHI values, respectively. is the normalized value and n is the number of data samples. By considering previous contributions, a diversity of averaged GHI values have been suggested as the normalizing value in order to determine the relative magnitude of error metrics. For example, Paoli et al. compute the normalized error metrics from the mean global radiation obtained on the season [31]; Nik et al. calculate monthly mean hourly global solar radiation values [32]; and Lu et al. estimate daily global solar radiation [33]. A detailed review of accuracy tests used in the specific literature was reviewed by Teke et al. in [11]. Therefore, and taking into account the proposed characterization of metrics, the daily average GHI values are considered by the authors to normalize and determine the relative magnitude of error metrics. From the expressions and approaches proposed in previous contributions to characterize the metrics, it is desirable to determine the similarities among them and propose different groups of metrics in order to estimate the complementary information in a data comparison process. A characterization and classification methodology to identify similarities among metrics applied on the GHI data is thus proposed and described. This approach classifies the metric differences for a large amount of irradiance data determined through a variety of sources: satellite–derived, on-ground installations, and/or estimated irradiation values. Therefore, an autonomous and flexible solution to compare different irradiation data sources is proposed in this work; allowing us to select complementary metrics, which offer non-redundant information to evaluate differences among those irradiation data.

Table 1.
Definition of the error metrics.
The proposed methodology is first based on an estimation of metrics for the different irradiation data sources. Subsequently, a matrix of differences for the different metrics is then determined for each station, according to the selected sample time—a one-hour sample time for the case study discussed in Section 4. After this initial metric estimation, a multiple correlation analysis is carried out on each station, to identify metrics with a relevant (or not) dependence. This correlation analysis is then used as the input for a clustering process, grouping by each location, those metrics with similar behaviors and thus, metrics that provide similar information. A graphical representation is proposed by the authors to visualize in a more convenient way these multiple correlation results as well as the clustering process.
From these results, we can then compare the clustering results for all locations, estimating the homogeneity of the different groups according to the specific locations. In a complementary way, a statistical analysis—the mean and standard deviation—is then applied to each metric correlation coefficient corresponding to all considered locations. This statistical analysis gives an additional estimation of the homogeneity of such correlations, as well as their independence (or not) from the specific locations. Subsequently, from the clustering process and the additional statistical analysis, we can then estimate the metric correlation dependence from the locations, as well as the similarity of the metric grouping according to a visual comparison of the clustering process.
Figure 1 schematically shows the proposed methodology by considering m different metrics determined from p-locations and corresponding to n-days hourly data. The correlation and metric clustering are then carried out by each specific location. Subsequently, a metric clustering estimation for all locations is proposed to determine the homogeneity of such metric clustering processes, including an additional statistical analysis for each group of metrics.
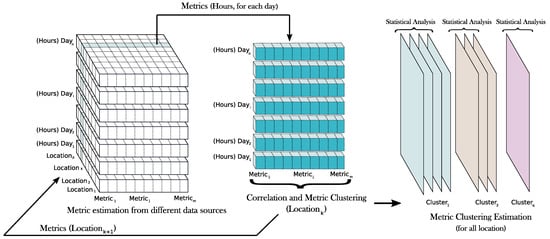
Figure 1.
The correlation analysis and clustering process. General scheme.
From the previous clustering and statistical analysis, we then propose to apply PCA for all metrics and locations. In fact, PCA is helpful in this context, when the group of variables—the metrics depicted in Table 1—are highly correlated and a dimensionality reduction is convenient. Moreover, PCA is also an appropriate solution to identify the ’principal components’, which account for most of the variance in the observed/measured variables [38]. In our case, an m–dimensional vector [] is initially identified corresponding to the different metrics determined. A data matrix X corresponds to the observations of the variable. We then estimate a linear combination of each m–dimensional vector [] of matrix X with maximum variance. Such linear combinations are given by
where is a m-dimensional vector of constants [], and the variance of any such linear combination is given by , with S being the sample covariance–variance matrix associated with the data and denoting the transpose. Identifying the linear combination with maximum variance is equivalent to determining an m-dimensional vector maximizing and requiring . A Lagrange multiplier approach with constraints can be then used to show that the full set of eigenvectors of S is the solution to the linear combination with a maximum variance problem, obtaining up to m new linear combinations,
which successively maximize variance, uncorrelated with other linear combinations [39]. PCA is thus a statistical technique for reducing the dimension of the initial data, increasing their interpretability, but at the same time, minimizing any information loss. A recent PCA review and developments can be found in [40]. Therefore, and by determining these principal components and their corresponding metric relations, different groups of differences—errors—are then identified and graphically represented. Moreover, they can be selected independently to provide a complementary information about the irradiance data source discrepancies. Figure 2 shows graphically the PCA application on the irradiance data metrics. As can be seen, different principal components are then estimated according to the metric dependence, decreasing the initial m-dimension of the metrics, allowing for a low-dimensional graphical representation and providing a reduced number of components independent among them. It is relevant to point out that this metric characterization has not been discussed previously in the specific literature; previous authors proposed a variety of different metrics without analyzing their dependence and subsequently neglecting the possible redundancies of such metrics.
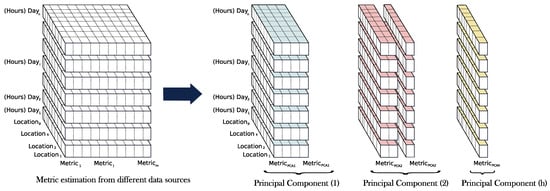
Figure 2.
Principal component analysis (PCA). Graphical scheme.
The proposed methodology is implemented in the well-known R environment [41]. The following contribution packages are used for methodology implementation purposes: ggplot2 to create graphics [42], corrplot to visualize correlation matrices [43], FactoMineR for the PCA application [44], and dtw and dtwclust for the dynamic time warping (DTW) and shape based distance (SBD) metrics estimation [45,46].
3. Case Study
Different ground-based meteorological stations were considered, comparing their GHI data to the satellite-based values for one year (2018). For the present analysis, the Network of the Agricultural Information System of Murcia (SIAM) was selected to provide ground-based irradiance data. SIAM consists of 49 automatic stations, ground-based installations that are geographically distributed along the Region of Murcia (11,300 km); 32 stations are from the Murcian Institute of Agricultural and Food Research and Development (IMIDA) Regional Government of Murcia, 15 are from the Spanish Ministry of Agriculture, Food and Environment, one is from the Universidad Politécnica de Cartagena (Murcia, Spain), and one is from the City Council of Mazarrón (Murcia, Spain). The IMIDA and Ministry stations were financially supported by European fund projects [47].
Figure 3 shows some examples of such meteorological stations and Figure 4 depicts some examples of data available online from these ground-based stations. As an attempt to cover a relevant area of study, seven ground-based stations geographically distributed along this south-east Spanish Region have been selected for the present analysis. In this way, Figure 5 shows the selected ground-based station locations in universal transverse Mercator (UTM) coordinates. The different colors in Figure 5 are related to the altitude of each ground-based meteorological station (depicted in UTM coordinates). Regarding satellite-based irradiance data, and among the different satellite-based irradiance data currently available online, the authors selected Copernicus, which is the European Union’s Earth Observation Programme. This online platform provides a variety of information services based on satellite earth observation and in situ (non-space) data. The programme is currently coordinated and managed by the European Commission and it is implemented in partnership with the member states, the European Space Agency (ESA), the European Organisation for the Exploitation of Meteorological Satellites (EUMETSAT), the European Centre for Medium-Range Weather Forecasts (ECMWF), EU Agencies, and Mercator Océan. A relevant amount of global data is then available to provide information and help service providers, public authorities and other international organizations. The information services provided are freely and are openly accessible to its users [48].
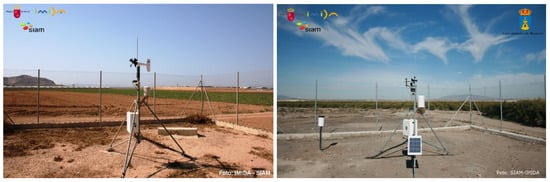
Figure 3.
Example of the ground-based meteorological stations (Source: SIAM-IMIDA [47]).
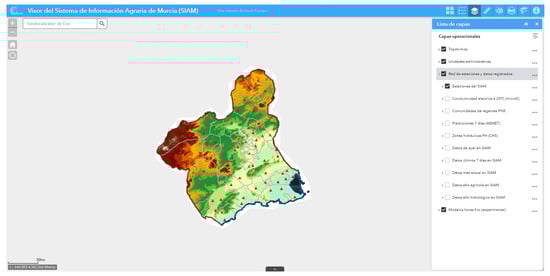
Figure 4.
Ground-based data available online: graphical example of data (Source: SIAM-IMIDA [49]).
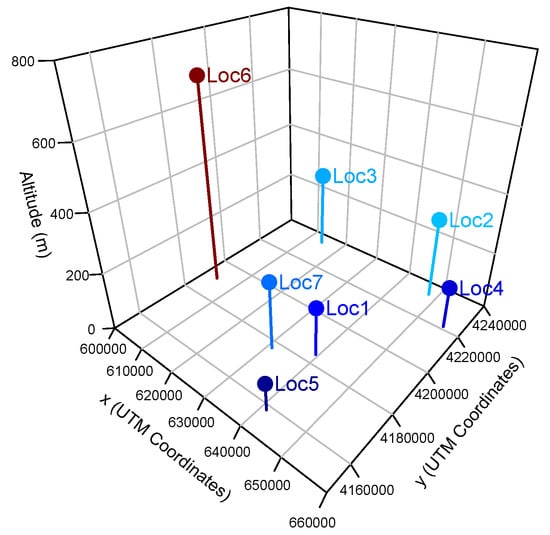
Figure 5.
Ground-based meteorological station locations (universal transverse Mercator (UTM) coordinates).
According to the information available in the Network of the SIAM, irradiance values were collected by such ground-based meteorological stations, providing hourly average GHI data. Ten-minute sampling time is available for the Copernicus satellite-based data. Therefore, the corresponding hourly average satellite GHI values were then determined from the Copernicus satellite-based data to compare to the ground-based data. Nevertheless, and in line with the study presented by Kim et al. in [50], hourly average values can smooth the error metric bias. Moreover, if the instantaneous snapshot values are used in the error metric evaluation, the results would be worse. In this case, a total amount of 429,240 data points were initially analyzed, which correspond to the ground-based and satellite-based values accordingly. By considering this initial group of GHI values, a preliminary comparison of data was required to visualize some possible discrepancies among the sources and data. With this aim, Figure 6 summarizes some consecutive days along 2018 and compares both the irradiance database values by considering hourly average values. The time series of bias, as satellite-based as ground-measured GHI values, are also included in such figure. These days correspond to weeks covering all seasons of the year, where the irradiance levels are considerably different and where several cloudy days and oscillating irradiance values can be also identified.
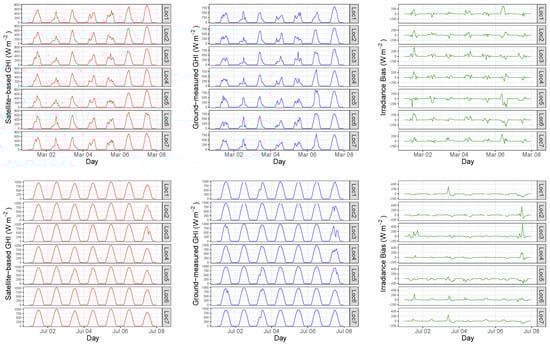
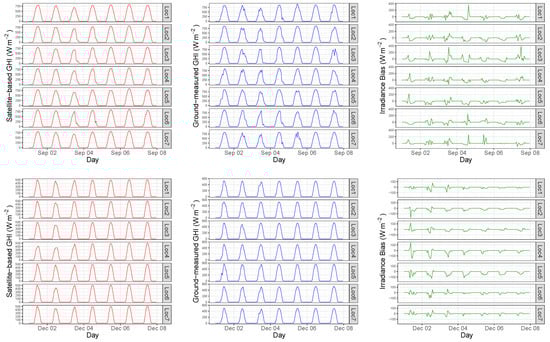
Figure 6.
Examples of satellite-based hourly global horizontal irradiance (GHI), locally ground-measured GHI, and irradiance bias (One week of March, July, September, and December 2018).
As a preliminary analysis, the irradiance data from both sources are significantly similar. Moreover, both irradiance curves are practically overlapping and, as was expected, a detailed metric analysis was required to compare the different sources in a more extended way. Subsequently, an estimation of metrics is then determined according to Table 1, where a variety of metrics used and proposed by previous contributions is summarized. With this aim, Figure 7 shows the daily evolution of such metrics, depending on each location and with a one hour sample time. Table 2 summarizes some descriptive statistics of the error metrics (including average values, minimum, maximum, and quartiles). These metrics were determined from both irradiation data sources and they provide a variety of alternatives to estimate the differences between the data. From these metrics, a characterization and classification by considering the proposed methodology, as described in Section 2, was carried out by the authors. The results are presented and discussed in Section 4. In addition, PCA was also applied to identify the main relationships among the metrics, reduce the number of variables and allow us a graphical representation of such metrics in a low-dimensional environment.
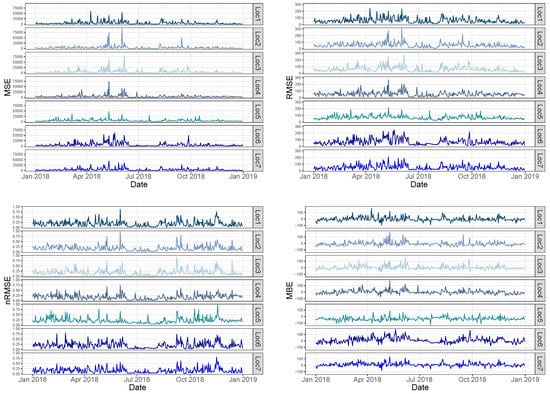
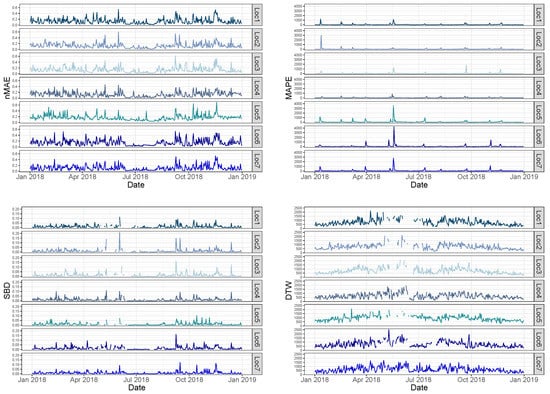
Figure 7.
Daily evolution of the difference metrics at each location.
Table 2.
Descriptive statistics of the error metrics.
4. Results
As was previously discussed, by considering the different metrics summarized in Table 1 and according to the database described in Section 3, a total of ten metrics are determined by each location, with a one hour sample time and using the 2018 GHI data. Consequently, 17,520 values are then available by each location. An example of such different metrics can be found in Figure 7. From these preliminary results, an initial correlation analysis for the different locations is first carried out by the authors, in line with the proposed methodology depicted in Figure 1. These correlations are summarized in Figure 8, where all of the locations are individually analyzed and depicted. As can be seen, some groups of metrics can be identified, which correspond to a more relevant correlation. Therefore, these preliminary results provide an initial identification of groups of metrics that are highly correlated and, consequently, they offer a similar metric information. As an attempt to characterize the variability of these correlations in terms of the diversity introduced by the geographical dispersion, an additional statistical analysis was proposed and carried out as well. With this aim, Figure 8 also shows the mean and standard deviation values of the correlation coefficients by considering the metrics results of each location. As can be seen, and in this specific case study, the statistical results provide a low variability of metric correlations and, consequently, it is then proposed to analyze all of the metrics simultaneously and independently of the location. Therefore, the rest of the proposed methodology can be applied simultaneously to all metric estimations and without any dependence on the geographical location. Nevertheless, the proposed methodology can also be applied to other situations where the location dependence is more relevant and it cannot be neglected. In that case, the rest of methodology will be repeated by each location. As an additional result, and following with the present case study, Figure 9 shows the correlation matrices of the error metrics by considering all locations simultaneously. A similar group of relevant correlations is also identified in line with the previous correlation results depicted in Figure 8.
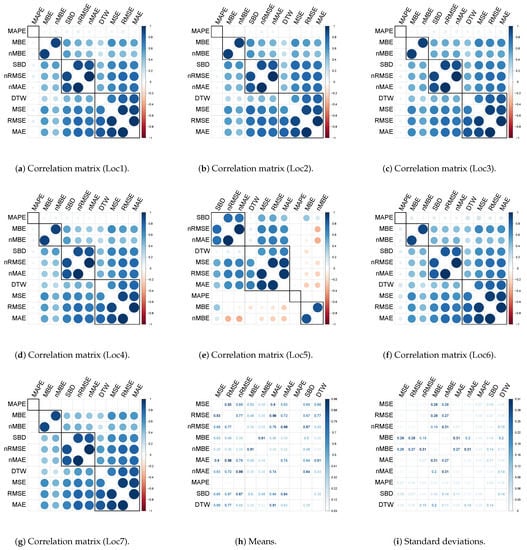
Figure 8.
(a–g) The correlation matrices of the error metrics for each separate location. (h,i) The means and standard deviations of the correlation coefficients of the error metrics, obtained at each location.
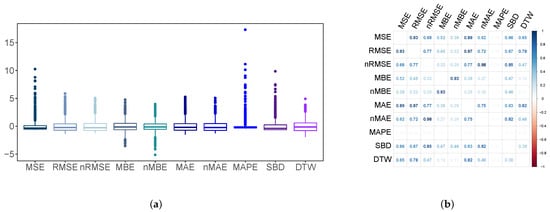
Figure 9.
(a) Boxplots of the scaled error metrics for all locations. (b) Correlation matrix of error metrics for all locations.
In order to explore patterns of similarities and gain an understanding of the structure of variability between metrics, the PCA approach was then applied to the metrics. A reduction of dimension was also achieved by using such analysis. Moreover, by considering only the most relevant components, it should be informative enough to allow for pattern detection in similar metric studies. With this aim, and considering the proposed methodology by including the PCA approach from all metrics and locations as discussed in Section 2—and graphically given in Figure 2 for the current case study—the ’principal components’ are subsequently estimated for all metric results. By applying the PCA technique, Figure 10 shows the scree plot of the components (eigenvalues and percentage of variance accounted for by the principal components). As can be seen, when considering only the four most representative principal components, about 94% of the metric variability can be identified, which significantly reduces the metric dimension from 10-dimensions—see Table 1 and preliminary results in Figure 7—to four-dimensions. Therefore, and by considering these results, the first component explains 58.2% of the total variability, while the second component explains 16.1%, leaving the remaining third and fourth component with the explanation of around 10% of the variability for each one. As a consequence, an effective and convenient dimension reduction is achieved by considering the first four components of the PCA algorithm. For a more extensive analysis, the Appendix summarizes both eigenvalue and eigenvector results—see Table A1 and Table A2, respectively.
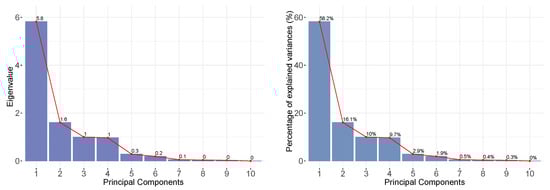
Figure 10.
Scree plot of the components extracted by PCA.
With regard to the relevance of each metric on the selected ’principal components’, Table 3 provides the relative weight of each metric for the corresponding relevant principal components. The bold marked values in Table 3 correspond to the most influent metrics for each principal component. In line with these results, Figure 11 gives the contributions, as a percentage, for each metric variable to the most relevant dimension corresponding to the PCA application. In addition, a dashed-line has been included to point out such relevant metrics corresponding to each dimension. Moreover, the dimensions clearly depend on different metrics, which enhances the preliminary correlations given in Figure 8 and Figure 9. Consequently, and in line with a main objective of this work, it is then possible to identify different groups of metrics that provide complementary information and, thus, they can be combined to characterize convenient differences among different database sources.
Table 3.
Relative weight of each metric for the most relevant principal components.
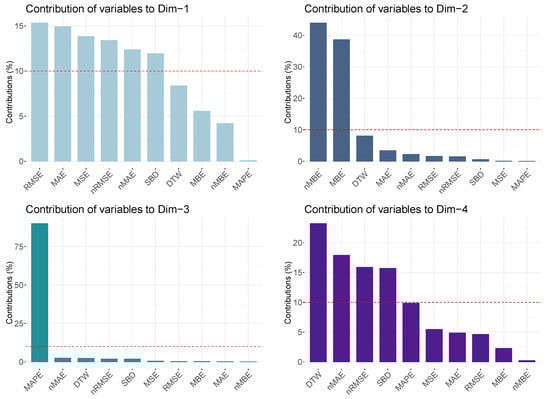
Figure 11.
Contributions (%) of each variable to each dimension of the PCA.
Finally, Figure 12 summarizes the metric correlation with the four selected ’principal components’, which represent about 94% of the global metric variability. In this graphical representation, circles correspond to and variability explained by the components respectively. Therefore, the area within both circles contains the most representative metrics depending on each principal component. These results are thus a complementary characterization of the metrics, considering their correlation with the selected principal components.
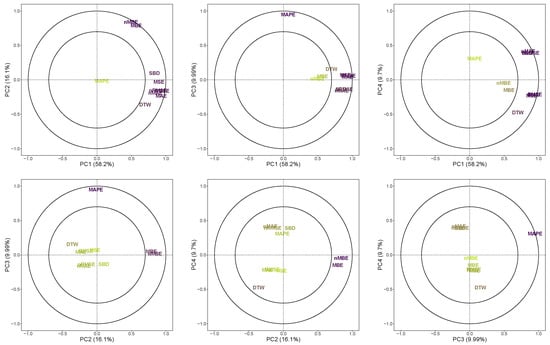
Figure 12.
Correlation plots of the first four components of the PCA applied to the metrics.
5. Conclusions
A characterization of metrics based on GHI data from different sources is described and assessed in order to identify different groups of similar metrics. From the specific literature, a group of ten different metrics is initially selected, which have been proposed by other contributions to compare different irradiation data. A location dependence analysis and a PCA application process is proposed to characterize such metrics and identify the similarities and explore the differences among them. The proposed methodology has been evaluated from satellite-based and ground-measured GHI data collected for one year in seven different Spanish locations, using average hourly estimations. We analyzed an initial database of 429,240 data points, which corresponds to the satellite-based and ground-measured values accordingly. The selected metrics are determined by each pair of irradiance data and the correlation matrices for each location are estimated.
PCA application allows us to explore similarities among metrics and identify the most relevant ’principal components’. Moreover, a reduction of dimension is also addressed by this technique. In this case, a group of four-’principal components’ is selected, which accounts for 94% of the metric variability. Therefore, a dimension reduction and an identification of metric groups with similar information are provided, which outlines the suitability of the process. Moreover, the initial variety metrics are representative of different principal components and, thus, it is possible to identify and select such groups of metrics that offer complementary information. Non-redundant information metric groups are then available to determine the differences among irradiation database sources. This work provides a solution to compare metrics, despite the lack of agreement in validation strategies for irradiance databases that has been currently detected by the authors.
Author Contributions
Conceptualization, A.M.-G. and M.C.B.; methodology, M.C.B.; validation, J.M.P.-P., A.M.-A., and A.M.-G.; formal analysis, M.C.B.; resources, J.M.P.-P.; data curation, M.C.B.; writing—original draft preparation, A.M.-G.; writing—review and editing, A.M.-G. and A.M.-A. All authors have read and agreed to the published version of the manuscript.
Funding
The paper includes results of activities conducted under the Research Program for Groups of Scientific Excellence at Region of Murcia (Spain), the Seneca Foundation, and the Agency for Science and Technology of the Region of Murcia (Spain). This work was also supported by the Spanish Ministry of Economy and Competitiveness and the European Union–FEDER Funds, ENE2016-78214–C2-1-R.
Conflicts of Interest
The authors declare no conflict of interest.
Abbreviations
The following abbreviations are used in this manuscript:
| ECMWF | The European Centre for Medium-Range Weather Forecasts |
| ESA | The European Space Agency |
| EU | The European Union |
| EUMETSAT | The European Organisation for the Exploitation of Meteorological Satellites |
| GHI | Global Horizontal Irradiance |
| GOES | Geostationary Operational Environmental Satellite |
| IMIDA | Murcian Institute of Agricultural and Food Research and Development |
| MODIS | Moderate Resolution Imaging Spectroradiometer |
| MSG | Meteosat Second Generation |
| PCA | Principal Component Analysis |
| PV | Photovoltaic |
| PVGIS | Photovoltaic Geographical Information System |
| SIAM | Agricultural Information System of Murcia |
| UTM | Universal Transverse Mercator |
Symbols in metrics:
| DTW | Dynamic Time Warping |
| Ground-measured GHI | |
| Satellite-based GHI | |
| gMBD | General Mean Bias Deviation |
| MAD | Mean Absolute Difference |
| MAE | Mean Absolute Error |
| MAPE | Mean Absolute Percentage Error |
| MBE | Mean Bias Error |
| MSE | Mean Square Error |
| NCC | Normalized Cross-Correlation |
| nMAE | Normalized Mean Absolute Error |
| nMBE | Normalized Mean Bias Error |
| nRMSE | Normalized Root Mean Square Error |
| r | Pearson Correlation Coefficient |
| rgMBD | Relative General Mean Bias Deviation |
| rMAE | Relative Mean Absolute Error |
| rMBE | Relative Mean Bias Error |
| RMSE | Root Mean Square Error |
| rRMSE | Relative Root Mean Square Error |
| Determination Coefficient | |
| SBD | Shape Based Distance |
| SD | Standard Deviation |
Appendix A
Table A1.
Eigenvalues and percentage of variance explained associated with each component in the PCA.
Table A1.
Eigenvalues and percentage of variance explained associated with each component in the PCA.
| Component | Eigenvalue | Percentage | Cumulative Percentage |
|---|---|---|---|
| of Variance (%) | of Variance (%) | ||
| 1 | 5.8202 | 58.2016 | 58.2016 |
| 2 | 1.6084 | 16.0838 | 74.2854 |
| 3 | 0.9991 | 9.9911 | 84.2765 |
| 4 | 0.9697 | 9.6970 | 93.9735 |
| 5 | 0.2866 | 2.8663 | 96.8397 |
| 6 | 0.1923 | 1.9229 | 98.7627 |
| 7 | 0.0543 | 0.5432 | 99.3059 |
| 8 | 0.0394 | 0.3937 | 99.6996 |
| 9 | 0.0287 | 0.2871 | 99.9868 |
| 10 | 0.0013 | 0.0132 | 100.0000 |
Table A2.
Principal components (eigenvectors) in the PCA.
Table A2.
Principal components (eigenvectors) in the PCA.
| Dim 1 | Dim 2 | Dim 3 | Dim 4 | Dim 5 | Dim 6 | Dim 7 | Dim 8 | Dim 9 | Dim 10 | |
|---|---|---|---|---|---|---|---|---|---|---|
| MSE | 0.3721 | −0.0239 | 0.0700 | −0.2333 | −0.6377 | 0.1253 | 0.2759 | 0.5481 | 0.0517 | 0.0002 |
| RMSE | 0.3917 | −0.1266 | 0.0590 | −0.2147 | −0.2114 | −0.1170 | −0.1351 | −0.4730 | −0.5169 | 0.4620 |
| nRMSE | 0.3662 | −0.1214 | −0.1379 | 0.3984 | 0.0682 | −0.2498 | −0.1452 | 0.1887 | −0.4829 | −0.5626 |
| MBE | 0.2357 | 0.6217 | 0.0505 | −0.1512 | −0.0338 | −0.1281 | −0.6789 | 0.1086 | 0.2052 | −0.0119 |
| nMBE | 0.2043 | 0.6629 | 0.0181 | −0.0467 | 0.2937 | −0.0698 | 0.6199 | −0.0684 | −0.1904 | −0.0005 |
| MAE | 0.3862 | −0.1836 | 0.0420 | −0.2206 | −0.0372 | −0.2242 | 0.1497 | −0.4859 | 0.5214 | −0.4297 |
| nMAE | 0.3517 | −0.1495 | −0.1590 | 0.4231 | 0.2162 | −0.3663 | 0.0723 | 0.2198 | 0.3608 | 0.5340 |
| MAPE | 0.0291 | −0.0131 | 0.9487 | 0.3139 | −0.0019 | −0.0100 | 0.0033 | −0.0107 | 0.0142 | −0.0009 |
| SBD | 0.3456 | 0.0776 | −0.1362 | 0.3963 | −0.0097 | 0.7963 | −0.0584 | −0.2198 | 0.1132 | 0.0117 |
| DTW | 0.2893 | −0.2835 | 0.1553 | −0.4820 | 0.6390 | 0.2613 | −0.0913 | 0.3016 | −0.0595 | 0.0073 |
References
- Ellabban, O.; Abu-Rub, H.; Blaabjerg, F. Renewable energy resources: Current status, future prospects and their enabling technology. Renew. Sustain. Energy Rev. 2014, 39, 748–764. [Google Scholar] [CrossRef]
- Wang, L.; Singh, C.; Kusiak, A. Guest Editorial: Special Issue on Ontegration of Intermittent Renewable Energy Resources into Power Grid. IEEE Syst. J. 2012, 6, 2–3. [Google Scholar] [CrossRef]
- Wan, C.; Zhao, J.; Song, Y.; Xu, Z.; Lin, J.; Hu, Z. Photovoltaic and solar power forecasting for smart grid energy management. CSEE J. Power Energy Syst. 2015, 1, 38–46. [Google Scholar] [CrossRef]
- Shi, J.; Lee, W.; Liu, Y.; Yang, Y.; Wang, P. Forecasting power output of photovoltaic systems based on weather classification and support vector machines. IEEE Trans. Ind. Appl. 2012, 48, 1064–1069. [Google Scholar] [CrossRef]
- Yang, C.; Thatte, A.A.; Xie, L. Multitime-scale data-driven spatio-temporal forecast of photovoltaic generation. IEEE Trans. Sustain. Energy 2015, 6, 104–112. [Google Scholar] [CrossRef]
- Ahmed, A.; Khalid, M. A review on the selected applications of forecasting models in renewable power systems. Renew. Sustain. Energy Rev. 2019, 100, 9–21. [Google Scholar] [CrossRef]
- Notton, G.; Paoli, C.; Vasileva, S.; Nivet, M.L.; Canaletti, J.L.; Cristofari, C. Estimation of hourly global solar irradiation on tilted planes from horizontal one using artificial neural networks. Energy 2012, 39, 166–179. [Google Scholar] [CrossRef]
- Dos Santos, C.M.; Escobedo, J.F.; Teramoto, E.T.; Da Silva, S.H.M.G. Assessment of ANN and SVM models for estimating normal direct irradiation (Hb). Energy Convers. Manag. 2016, 126, 826–836. [Google Scholar] [CrossRef]
- Bouchouicha, K.; Hassan, M.A.; Bailek, N.; Aoun, N. Estimating the global solar irradiation and optimizing the error estimates under Algerian desert climate. Renew. Energy 2019, 139, 844–858. [Google Scholar] [CrossRef]
- Noorian, A.M.; Moradi, I.; Kamali, G.A. Evaluation of 12 models to estimate hourly diffuse irradiation on inclined surfaces. Renew. Energy 2008, 33, 1406–1412. [Google Scholar] [CrossRef]
- Teke, A.; Yıldırım, H.B.; Celik, O. Evaluation and performance comparison of different models for the estimation of solar radiation. Renew. Sustain. Energy Rev. 2015, 50, 1097–1107. [Google Scholar] [CrossRef]
- Dobos, A. PVWatts Version 5 Manual; National Renewable Energy Laboratory (NREL): Denver, CO, USA, 2014. Available online: http://www.nrel.gov/docs/ (accessed on 1 December 2019).
- Uri, M.; Huld, T.; Dunlop, E. PV-GIS: A web-based solar radiation database for the calculation of PV potential in Europe. Int. J. Sol. Energy 2005, 24, 55–67. [Google Scholar] [CrossRef]
- International Renewable Energy Agency (IRENA). Global Atlas for Renewable Energy: Overview of Solar and Wind Maps. Available online: https://irena.masdar.ac.ae/gallery/#gallery (accessed on 1 December 2019).
- SOLARGIS. Weather Data and Software for Solar Power Investments. 2019. Bratislava Slovakia. Available online: https://solargis.com/ (accessed on 1 December 2019).
- Piasecki, A.; Jurasz, J.; Kies, A. Measurements and reanalysis data on wind speed and solar irradiation from energy generation perspectives at several locations in Poland. SN Appl. Sci. 2019, 1, 865. [Google Scholar] [CrossRef]
- Bódis, K.; Kougias, I.; Jager-Waldau, A.; Taylor, N.; Szabó, S. A high-resolution geospatial assessment of the rooftop solar photovoltaic potential in the European Union. Renew. Sustain. Energy Rev. 2019, 114, 109309. [Google Scholar] [CrossRef]
- Psiloglou, B.; Kambezidis, H.; Kaskaoutis, D.; Karagiannis, D.; Polo, J. Comparison between MRM simulations, CAMS and PVGIS databases with measured solar radiation components at the Methoni station, Greece. Renew. Energy 2020, 146, 1372–1391. [Google Scholar] [CrossRef]
- Bocca, A.; Bergamasco, L.; Fasano, M.; Bottaccioli, L.; Chiavazzo, E.; Macii, A.; Asinari, P. Multiple-regression method for fast estimation of solar irradiation and photovoltaic energy potentials over Europe and Africa. Energies 2018, 11, 3477. [Google Scholar] [CrossRef]
- Feng, J.; Wang, W.; Li, J. An LM–BP neural network approach to estimate monthly-mean daily global solar radiation using MODIS atmospheric products. Energies 2018, 11, 3510. [Google Scholar] [CrossRef]
- Amillo, A.M.G.; Huld, T.; Vourlioti, P.; Müller, R.; Norton, M. Application of satellite-based spectrally-resolved solar radiation data to PV performance studies. Energies 2015, 8, 3455–3488. [Google Scholar] [CrossRef]
- Pierro, M.; Felice, M.D.; Maggioni, E.; Moser, D.; Perotto, A.; Spada, F.; Cornaro, C. Data-driven upscaling methods for regional photovoltaic power estimation and forecast using satellite and numerical weather prediction data. Sol. Energy 2017, 158, 1026–1038. [Google Scholar] [CrossRef]
- Antonanzas-Torres, F.; Cañizares, F.; Perpiñán, O. Comparative assessment of global irradiation from a satellite estimate model (CM SAF) and on-ground measurements (SIAR): A Spanish case study. Renew. Sustain. Energy Rev. 2013, 21, 248–261. [Google Scholar] [CrossRef]
- Buffat, R.; Grassi, S.; Raubal, M. A scalable method for estimating rooftop solar irradiation potential over large regions. Appl. Energy 2018, 216, 389–401. [Google Scholar] [CrossRef]
- Porfirio, A.C.; Ceballos, J.C. A method for estimating direct normal irradiation from GOES geostationary satellite imagery: Validation and application over Northeast Brazil. Sol. Energy 2017, 155, 178–190. [Google Scholar] [CrossRef]
- Pfenninger, S.; Staffell, I. Long–term patterns of European PV output using 30 years of validated hourly reanalysis and satellite data. Energy 2016, 114, 1251–1265. [Google Scholar] [CrossRef]
- Ernst, M.; Thomson, A.; Haedrich, I.; Blakers, A. Comparison of ground-based and satellite-based irradiance data for photovoltaic yield estimation. Energy Procedia 2016, 92, 546–553. [Google Scholar] [CrossRef]
- Moreno, A.; Gilabert, M.; Camacho, F.; Martínez, B. Validation of daily global solar irradiation images from MSG over Spain. Renew. Energy 2013, 60, 332–342. [Google Scholar] [CrossRef]
- Gueymard, C.A. A review of validation methodologies and statistical performance indicators for modeled solar radiation data: Towards a better bankability of solar projects. Renew. Sustain. Energy Rev. 2014, 39, 1024–1034. [Google Scholar] [CrossRef]
- Bright, J.M. Solcast: Validation of a satellite-derived solar irradiance dataset. Sol. Energy 2019, 189, 435–449. [Google Scholar] [CrossRef]
- Paoli, C.; Voyant, C.; Muselli, M.; Nivet, M.L. Forecasting of preprocessed daily solar radiation time series using neural networks. Sol. Energy 2010, 84, 2146–2160. [Google Scholar] [CrossRef]
- Nik, W.W.; Ibrahim, M.; Samo, K.; Muzathik, A. Monthly mean hourly global solar radiation estimation. Sol. Energy 2012, 86, 379–387. [Google Scholar] [CrossRef]
- Lu, N.; Qin, J.; Yang, K.; Sun, J. A simple and efficient algorithm to estimate daily global solar radiation from geostationary satellite data. Energy 2011, 36, 3179–3188. [Google Scholar] [CrossRef]
- Yang, L.; Gao, X.; Li, Z.; Jia, D.; Jiang, J. Nowcasting of surface solar irradiance using FengYun-4 satellite observations over China. Remote Sens. 2019, 11, 1984. [Google Scholar] [CrossRef]
- Paparrizos, J.; Gravano, L. K-Shape: Efficient and accurate clustering of time series. In Proceedings of the 2015 ACM SIGMOD International Conference on Management of Data, Melbourne, Victoria, Australia, 31 May–4 June 2015; pp. 1855–1870. [Google Scholar] [CrossRef]
- Molina-García, A.; Fernández-Guillamón, A.; Gómez-Lázaro, E.; Honrubia-Escribano, A.; Bueso, M.C. Vertical wind profile characterization and identification of patterns based on a shape clustering algorithm. IEEE Access 2019, 7, 30890–30904. [Google Scholar] [CrossRef]
- Keogh, E.; Ratanamahatana, C.A. Exact indexing of dynamic time warping. Knowl. Inf. Syst. 2005, 7, 358–386. [Google Scholar] [CrossRef]
- Combes, C.; Azema, J. Clustering using principal component analysis applied to autonomy—Disability of elderly people. Decis. Support Syst. 2013, 55, 578–586. [Google Scholar] [CrossRef]
- Jolliffe, I. Principal Component Analysis. In International Encyclopedia of Statistical Science; Lovric, M., Ed.; Springer: Berlin/Heidelberg, Germany, 2011; pp. 1094–1096. [Google Scholar] [CrossRef]
- Jolliffe, I.T.; Cadima, J. Principal component analysis: A review and recent developments. Philos. Trans. R. Soc. A Math. Phys. Eng. 2016, 374. [Google Scholar] [CrossRef]
- R Core Team. R: A Language and Environment for Statistical Computing; R Foundation for Statistical Computing: Vienna, Austria, 2018. [Google Scholar]
- Wickham, H. ggplot2: Elegant Graphics for Data Analysis; Springer: New York, NY, USA, 2016. [Google Scholar]
- Wei, T.; Simko, V. R Package ’Corrplot’: Visualization of a Correlation Matrix. version 0.84. October 2017. Available online: https://cran.r-project.org/web/packages/corrplot/corrplot.pdf (accessed on 1 December 2019).
- Lê, S.; Josse, J.; Husson, F. FactoMineR: A Package for Multivariate Analysis. J. Stat. Softw. 2008, 25, 1–18. [Google Scholar] [CrossRef]
- Giorgino, T. Computing and Visualizing Dynamic Time Warping Alignments in R: The dtw Package. J. Stat. Softw. 2009, 31, 1–24. [Google Scholar] [CrossRef]
- Sarda-Espinosa, A. Dtwclust: Time Series Clustering Along with Optimizations for the Dynamic Time Warping Distance. R Package version 5.5.6. December 2019. Available online: https://cran.r-project.org/web/packages/dtwclust/dtwclust.pdf (accessed on 10 January 2020).
- Network of the Agricultural Information System of Murcia (SIAM). 2019. Available online: https://siam.imida.es/ (accessed on 27 January 2020).
- European Union’s Earth Observation Programme. 2019. Available online: https://www.copernicus.eu/ (accessed on 27 January 2020).
- Online Viewer of the Agricultural Information System of Murcia. 2019. Available online: https://geoportal.imida.es/siam/ (accessed on 27 January 2020).
- Kim, C.K.; Kim, H.G.; Kang, Y.H.; Yun, C.Y. Toward Improved Solar Irradiance Forecasts: Comparison of the Global Horizontal Irradiances Derived from the COMS Satellite Imagery Over the Korean Peninsula. Pure Appl. Geophys. 2017, 174, 2773–2792. [Google Scholar] [CrossRef]
© 2020 by the authors. Licensee MDPI, Basel, Switzerland. This article is an open access article distributed under the terms and conditions of the Creative Commons Attribution (CC BY) license (http://creativecommons.org/licenses/by/4.0/).