1. Introduction
Since the early 1990s, international trade has become an important channel for each developed and developing country in the world to obtain sustainable development which is one of the most important objectives for a country [
1,
2,
3]. As international trade is often mixed with technological innovation and transfer, integration into global economy is extremely important for the competition and sustainable development of the enterprise [
4,
5,
6]. Today’s global economy has been characterized by two phenomena: the upgrade of global value chains (GVCs) and the sweeping trade agreements (TAs). GVCs and TAs are the two sides of the same coin in which the directions of the most favorable TAs are determined not only by the volume and intensity of international trade, but also by the GVC structure of countries [
7]. On the one hand, GVCs as the internationally dispersed production system have changed the pattern of international trade and cross-border investment for good [
8]. Intermediate goods traded in parts and components have increased almost six times in GVCs between 1990 and 2015 [
9] as the total foreign direct investment (FDI) has increased about 12 times over the same period [
10].
On the other hand, free or regional trade agreements (FTAs or RTAs) have grown very fast around world while bilateral and multilateral trade talks had made unprecedented progress since the 1990s [
11,
12]. There are more than 400 free or regional trade agreements now, and almost every economy belongs to at least one of TAs [
13]. Preferential trade agreements (PTAs) which have lower trade barriers between member-states [
14,
15] but not necessarily between countries within the same regions or in regional proximity as RTAs [
9] also surged more than 5-folds from 50 in 1990 to about 280 in 2015. At the same time, the content of PTAs has been deepening to include investment and competition policy besides the traditional focus of tariffs [
9].According to [
16], PTAs are unilateral trade preferences and include Generalized System of Preferences schemes under which developed countries grant preferential tariffs to imports from developing countries, as well as other non-reciprocal preferential schemes granted a waiver by the General Council. PTAs are understood to mean non-reciprocal preferential schemes and distinct from FTAs or RTAs, which are covered by the Transparency Mechanism and defined as reciprocal trade agreements between two or more partners [
7,
15,
17]. In order to avoid the unnecessary confusion, we use the broad definition of “Trade Agreements” (TAs) as in [
18] in this paper.
Researchers and policy makers as well as the general public have been interested in whether the deepening TAs can boost the participation, integration and upgrade of partner countries in GVCs [
19] find that a trade agreement with one more policy area can significantly increase the domestic and foreign value added of intermediates as suppliers with forward and backward global value chain linkages respectively. Thus, they suggest that in regional and global production processes, policymakers can use TAs to anchor national producers.
However, the effectiveness of TAs on GVCs is dependent on the continuing trust in an open system, which is contingent on the economic, institutional, policy and even cultural environment of partner countries of TAs [
9,
20]. Güler and Guillén [
21] also suggest that only host-country’s “horizontal” improvement in the scientific, legal and political institutional infrastructures can attract foreign venture capital investment. Extant literature concentrates on the effect of host country’s institutional environment on the selection of partner in international investment and export [
22]. Roy and Oliver [
23] argue that rule of law perceptions in a host country alleviate investors’ concerns on appropriation (capture rents generated by international investment) and coordination cost (future costs of interacting with their partners). At the same time, rule of law perceptions in a host country make investors more probably choose partners relied on partner-related criteria such as trustworthiness, reputation, market power, partnering ability and partnering intent rather than the task-related criteria such as political ties, facilities and raw materials.
China has emerged as an important hub in traditional and simple GVC networks, even though United States and Germany still remain the most important hubs in complex GVC networks. As a new rival in GVC trade through upgrading of intermediates exports, China also has become the largest and the unique global supply hub [
24]. Cui and Jiang [
25] argue that when Chinese acquiring firms invest overseas, they attain host country’s regulative and normative institutional legitimacy by adjusting their entry strategies. Chinese state-owned enterprises (SOEs) are important in China’s internationalization, as more than 70% Chinese cross-border acquirers are state-owned [
26,
27]. Meyer et al. [
28] address that the host country’s institutional environment is even more complex for Chinese SOEs than private firms. SOEs are supported by the home country government, leading to possible “weak legitimacy of stat ownership”, such as perceived threats to national security, ideological conflicts and claimed unfair competitive advantage. Therefore, Chinese exporters and international investors should consider host-country’s institutions on partner selection.
More recent literature has shifted from studying the host-country institutions to the influence of home country institutions on export, OFDI and GVCs [
20,
29], which has addressed the active role of government in the internationalization process of home country. Geleilate et al. [
30] summarize relevant studies and conclude that specific policies of home country such as labor market flexibility, capital market development, control of corruption, regulatory quality and trade openness can significantly influence multinational corporations’ (MNCs) operations abroad and overall performance. Estrin et al. [
31] and Peng et al. [
32] argue that the governance-related control of home country institutions can shape the ability of minority shareholders and civil society to monitor acquiring firms’ decision-makers, and thereby their strategies of internationalization. Hence, home country institutions have significantly shaped MNEs’ capacity to improve their multinational investments and performance.
However, as the most important policy in Chinese internationalization, China’s One Belt and One Road (OBOR) initiative incepted in 2013 has not been studied with significant attention in international business literature on home country institutions. As China’s economic growth has been gradually slowing down since 2012, the sustainability of the China model as a global manufacturer is facing unprecedented challenges. Huang [
33] points out that the OBOR initiative has become a Chinese national strategy to sustain its economic growth by developing closer cooperation with China’s partner countries and transforming into the next stage of sustainable development. Fu et al. [
34] study the construction of the trade cooperation network with the Belt and Road countries and find that, as a “strengthening China by trade” strategy for sustainable development, the OBOR initiative is of great significance for China to deepen its trade cooperation with the Belt and Road countries. Kang et al. [
20] argue that the OBOR initiative itself is a sustainable continuation and development of the long tradition of economic, institutional, and cultural convergence with the OBOR countries. Du and Zhang [
26] also argue that China’s enterprises realize the upgrading of industrial structure and sustainability development by participating the overseas competition and cooperation, developing new markets and accelerating innovation. Thus, it is very surprising that there is little literature relating the OBOR initiative with China’s deepening TAs, leaving alone their influence on export, OFDI and GVCs. Hence, this paper responses to the call for more research on the effects of home country institutions [
35,
36] and endeavors to fill this gap by investigating the effect of the deepening TAs in the context of OBOR initiative on China’s export, OFDI and upgrade of the partner countries in GVCs. This paper aims to answers some important questions: What is the link between China’s TAs and OBOR initiative? Do China’s TAs affect the selection of OBOR partner countries? Can the deepening TAs in numbers and content between China and the partner countries promote China’s export and OFDI? Do the China’s TAs improve partner countries’ locations in GVCs? What are the different effects of China’s TAs and OBOR initiative on the GVC upgrade between the developed and developing countries?
2. Theoretical and Conceptual Framework
This paper contributes to the current literature on trade agreements and GVCs such as [
9,
14,
19] in several ways. First, this paper focuses on the links between China’s trade agreements and OBOR initiative. It is the first time to relate the trade agreements with the home country’s institutions in the context of China’s OBOR initiative. Studying of one country’s TAs has a big advantage compared with a cross-country study by controlling the complicated economic, institutional, policy and even cultural environment of home countries.
Second, based on a new World Bank data [
37], this paper can illustrate how China’s trade agreements have deepened over time and how this evolution relates to the China’s export, OFDI and the rise of GVCs in partner countries. A structural equation model (SEM) is applied on these correlated variables to identify the direct and indirect effects of China’s TAs and OBOR initiative on China’s export and OFDI, and then partner countries’ GVCs upgrade. SEM models the measurement error of the latent variables of deepening TAs and other control variables. In addition, SEM simultaneously estimates the links between TAs, OBOR initiative, export, OFDI and GVCs’ upgrade, while modeling co-variation amongst them. The direct and indirect effects of endogenous variables in this simultaneous system can be quantitatively estimated by using the SEM. As far as we know, it is the first time to apply a SEM for this kind of research in China.
Third, the export sophistication of each partner country is calculated as the measure of GVCs’ upgrade. Following [
38], the export sophistication index of each 260 kinds of 3-digit export good has first been calculated. Then, this paper uses the index of 260 kinds of 3-digit export good to calculate the export sophistication index of each 183 countries with different real GDP per capita. It is also the first time to use this measure to assess the policy effect of China’s TAs and OBOR initiative on GVCs’ upgrade of partner countries.
Finally, this paper discusses empirical research not only suggesting the deepening agreements boost GVCs’ upgrade, but also showing how this impact differs across country groups at the different locations of GVCs. The rest of the paper is as follows:
Section 3 reviews the literature and
Section 4 sets up the hypotheses;
Section 5 introduces the empirical methodology and describes data and variables;
Section 6 presents the empirical results; and the final section concludes.
3. Literature Review
The 1990s and 2000s saw the fast development of the MNCs in China. Since the beginning of the new millennium, Chinese MNCs are encouraged to go abroad and participate in the construction of GVCs by government’s “Going out Strategy” [
27,
35,
39,
40]. After the Uruguay Round negotiation resulted in the birth of World Trade Organization (WTO), cross-border barriers of international trade and investment have been dramatically reduced by the multilateral liberalization. China’s entry into WTO in 2001 has been accelerating its economic growth and integration into a more open global economy [
41,
42]. As an increasingly active player in the globalization process, China has concluded 13 TAs with 21 individual economic partners (see
Table A1 in
Appendix A).
Several studies such as [
43,
44] have analyzed the progress of China’s TAs after entering WTO. However, there is no paper to study the influence of China’s deepening TA strategy on the partner selection of OBOR initiative. China’s OBOR initiative in 2013 represents “the Silk Road Economic Belt (One Belt) and the 21st Century Maritime Silk Road (One Road)” policy, which aims to construct regional and bilateral partnership of trade and investment, and integrate with economies in Asia, Europe and Africa. The OBOR initiative is regarded as a sustainable development and continuation of China’s internationalization policies of “Going out Strategy” and TAs since entry into WTO in 2001 [
20,
26]. Thus, this paper firstly will have a hypothesis on the positive relationship between TAs and OBOR initiative (see H1 in the following sector).
Chinese government has been playing a dominant role in the internationalization process by promoting policies of export and OFDI. Cui and Jiang [
25] argue that Chinese government sets rules for acquiring firms to provide incentives or impose restrictions on their international investment. Lu et al. [
45] argue that Chinese government helps China’s OFDI enter into a host country by supporting their institutions. Li et al. [
46] suggest that institutional incompatibility (thus lack of legitimacy) at home or abroad should reduce Chinese SOEs’ OFDI activities. Luo et al. [
35] observe that competitive disadvantage of Chinese enterprises is offset by export and investment promotion policies which are economically imperative and institutionally complementary. They call for more studies on the convergence between two seemingly paradoxical views (e.g., institutional escapism and governmental promotion) in international expansion of emerging market enterprises.
Liu et al. [
27] analyze the impact of market potential, infrastructure facilities, openness of partner countries and exchange rate level on China’s OFDI in the OBOR countries. Du and Zhang [
26] identify that China’s OFDI favors Russia, Central and West Asia and Western Europe, preferring the continental OB countries to the maritime OR countries. Wang et al. [
47] argue that the pollution emissions of CO
2, SO
2, NO
2 for climate change and environmental degradation are the disadvantages of maritime transportation in international trade which have been be incorporated into binding multilateral agreements like the Kyoto Protocol. Bode et al. [
48] also address the importance of voluntary agreement on pollution emission and suggest that international shipping can be integrated into climate policies to control greenhouse gas emissions. Obviously, these policy areas of multilateral agreements like the Kyoto Protocol and voluntary agreements on international shipping have been absorbed into the deepening trade agreements such as provisions of sanitary and phytosanitary measures, environmental laws and nuclear safety and will have more and more important influence on international trade and investment [
9,
19]. Kang et al. [
20] find that in promotion of the OBOR initiative, the motivation of China’s OFDI is mainly market-seeking rather than resource-seeking. Additionally, China’s OFDI is based on international institutional cooperation and cultural convergence rather than infrastructure-led strategy. However, above studies did not consider the systematic effect of the TA partnership and OBOR initiative on China’s export and OFDI in the partner countries. Hence, this paper investigates whether the TA partnership and OBOR initiative can promote China’s export and OFDI in partner countries by setting a hypothesis as H2 in the following sector.
Since the early 1990s, flourishing GVCs and revolutionary world economic relations have brought with the new paradigm of labor division and specialization, which have motivated all economies to be involved in this process [
12]. As the world is moving towards more disintegrated production process, knowledge on the mechanism of TA formation in GVCs is still urgently needed. This paper aims to examine how the deepening TAs matter in GVCs in an emerging economy such as China, which will give some implications to other emerging economies [
49,
50]. Generally, this paper investigates the TAs’ effect on the partner countries’ upgrade in GVCs. Partner countries of TAs need to internalize the positive spillover externality of cross-border policies such as China’s OBOR initiative. Their stronger commitments with China’s cross-border policies also promote partner countries’ upgrade in GVCs [
9,
13,
19,
30,
31,
45]. This paper has a hypothesis on the relationship between TAs, OBOR initiative and the GVC upgrade of partner countries as H3 in the following sector.
Given the network structure of GVCs, one could trace suppliers and buyers both horizontally and vertically from immediate linkages through to the ultimate supplier and consumer [
51]. Inomata and Taglioni [
52] discuss firms in developing countries (such as China) and advise to avoid excessive price competition at a low end and upgrade their value chains, with examples of smartphone and cars, etc. As [
53] address the firm heterogeneity among both buyers and suppliers in production networks, this paper focuses on country heterogeneity in production network. According to partner countries’ economic development, TAs can be categorized into vertical (consists of economies with different economic levels) and horizontal modes (consists of economies with identical or similar economic level). Following [
54], this paper determines an economy’s GVC location by using real per capita GDP. When partner economies standing at different GVC locations, GVC vertical division of labor leads to the vertical TAs. In contrast, when partner economies standing at same or similar GVC locations, GVC horizontal division of labors results in the horizontal TAs [
12,
55,
56,
57]. Furthermore, the horizontal TAs can be divided into GVC high-end and low-end horizontal TAs according to partner countries all being at the high-end or low-end of GVC. Trade agreements are meant to achieve deeper integration of international competition and investment [
58,
59].
In general, trade and investment between high-end and low-end partners within a vertical TA is an inter-industry mode, with high-end (such as research and development, R&D) and low-end task/activities (such as assembling and processing). China’s export and OFDI spillovers might boost productivity in the TA partner country through vertical inter-industry channels such as forward links and backward links effect. Javorcik [
60] examines firm-level data from Lithuania and find the productivity spillovers from FDI occurring through vertical TAs rather than horizontal TAs. Moreover, domestic-market foreign companies have greater productivity than export-oriented ones. Since China’s OFDI is mainly market-seeking rather than resource-seeking [
20], China’s export and OFDI to TA partner countries should be more domestic-market-oriented. Additionally, the less developed countries are more likely to have forward links with China and be their local suppliers in upstream sectors. Thus, it might find the less developed TA partner countries have more significantly positive effect of the deepening TA partnership on their GVC upgrade as H4 in the following sector.
However, [
61,
62] argue that when partner countries have large technology gaps and high foreign shares, spillovers of vertical TAs are less likely in these countries with “enclave” characteristics. Hence, inter-industry vertical mode does not necessarily boost the less developed partner countries. That is, vertical TAs might not benefit the less developed partner countries when the more developed countries’ export and OFDI have captured the major market share in the partner country with large technological gap. Barrios et al. [
63] also address a competition effect of foreign investment which deters entry of domestic firms. Therefore, the positive effect of vertical TAs on GVC upgrade of less developed partner is dependent on the market-seeking motivation and “enclave” characteristics of vertical TAs with which China’s MNEs compete against domestic producers by absorbing skilled workers and owning high foreign shares.
Horizontal TAs as intra-industry mode with small technology gaps have much less competing and “enclave” characteristics than vertical TAs. International trade and investment within a GVC high-end horizontal TA are following a high-end intra-industry mode, in which high-end partners can conduct high-end task/activities (such as Research and Development). In the same vein, a GVC low-end horizontal PTA is a low-end intra-industry mode, with all partners conducting low-end task/activities (such as assembling and processing). Neither high nor low-end horizontal TAs can aim to compete against domestic producers by absorbing skilled workers and owning high foreign shares. Hence, we might find the TA partner countries in the same development stage as China can benefit more from the deepening TA partnership with China in their GVC upgrade. Based on above discussion on horizontal TAs, partner countries with productivity similar to China possibly benefit more from China’s export and OFDI than developed countries. Thus, this paper posits a hypothesis as H5.
5. Methodology and Data Description
5.1. A Structural Equation Model
In order to identify the simultaneous relationship between China’s TAs, OBOR initiative, China’s export, OFDI and GVC upgrade of those partner countries, this paper uses a structural equation model (SEM) to model the measurement error of the latent variables of deepening TAs and other explanatory/control variables, as well as the co-variation amongst them. This is particularly important in a complicated economic system of jointly determined relationships. The direct and indirect effects of endogenous variables (OBOR
it, exp
it, ofdi
it, and EXPY
it) in this simultaneous system can be quantitatively estimated by using four equations as follows:
This paper firstly investigates whether the OBOR initiative was related with the tradition of China’s TAs by estimating the OBOR selection Equation (1). Dependent variable is the
OBOR country dummy (1 = country
i covered by OBOR initiative; 0 = non-OBOR country). This paper follows the (74) OBOR and (142) non-OBOR country/economy categorization in [
20,
26]. Main explanatory variable is the TA dummy (1 = country
i is a TA partner of China; 0 = non-TA partner of China). As shown in the
Table A1, China is implementing 13 concluded TAs involving 21 individual economies over the period 2003–2015 including Australia, Chile, Costa Rica, Hong Kong, Iceland, Macao, New Zealand, Pakistan, Peru, Singapore, South Korea, Switzerland and the ten-member Association of Southeast Asian Nations (ASEAN, including Brunei, Cambodia, Indonesia, Laos, Malaysia, Myanmar, Philippines, Singapore, Thailand and Vietnam). According to Hypothesis 1, the coefficient of TA should be significantly positive (α
1 > 0). This paper estimates the effect of TAs and OBOR initiatives on China’s export and OFDI to the partner countries by using Equations (2) and (3) in the simultaneous equation system. The dependent variable of Equation (2) is the log form China’s real export to the partner country
i in year
t (
lnrexpit, all measured in 2010 US
$), which is from the [
64]. The nominal values of export and OFDI are both deflated by the GDP deflator from [
10]. And, the dependent variable of Equation (3) is the log form China’s real OFDI to the partner country
i in year
t (lnrofdiit, all measured in millions of 2010 US
$, [
65]). According to Hypothesis 2, the coefficients of TA and OBOR dummies in Equations (2) and (3) should be significantly positive (β
1, β
2, γ
1, γ
2 > 0).
5.2. Export Sophistication
The impacts of China’s TAs on the GVC upgrade of the partner countries is estimated by using an econometric model based on Equation (4). The dependent variable is the log form export sophistication (lnEXPYit) as proxy of GVC-location of the partner country i in year t.
Following the two-step method in [
38], this paper calculates the variable of export sophistication (
EXPY) for each partner country over the period 2010–2015. First, the export sophistication of a country is defined as a weighted average of income levels (e.g., GDP per capita) of this country’s all exports. Additionally, the income level of each export is also a weighted average of income levels of the countries that export them [
66,
67]. Hence, we need firstly calculate the index called product sophistication (
PRODY). Products that are exported by rich countries with higher GDP per capita have higher product sophistication than products that are exported by poorer countries with lower GDP per capita. Then the weighted average income level associated with product
j,
PRODYj, equals:
The value of the exporting product j of country i equals xij, so the total value of all j kinds of exports of country i equals Xi = Σjxij. Yi is the real per-capita GDP of country i which has been adjusted in 2010 US$ by using the GDP deflators also provided by World Bank. xij/Xi is the value-share of the product j in the country i’s overall export basket. Σi(xij/Xi) is the sum of value shares of product j in all countries exporting the good. Hence the index of product sophistication is average of per-capita GDPs weighted by the revealed comparative advantage (RCA) of each country in good j, i.e., (xij/Xi)/Σi(xij/Xi).
This paper uses 260 kinds of 3-digit products in SITC 3.0 (
j = 260) exported by 183 countries (including China,
i = 183) from the United Nations Commodity Trade Statistics Database [
64] to calculate the export sophistication index of each product
j (
PRODYj).
Table A2 in
Appendix A presents top 3 kinds of 3-digit products with the largest
PRODY values (in 2010 US
$) and the bottom 3 kinds of 3-digit products with the smallest
PRODY values over the period 2010-2015. In 2010, the highest productivity was associated with railway track iron and steel (US
$43,064), fur skins (US
$42,786) and nickel (US
$41,013). After 2010, another 5 products including (1) musical instruments; (2) coin non-gold noncurrent; (3) medicines; (4) watches and clocks; and (5) works of art/antique also temporarily appeared in the top three products with largest
PRODY values. However, medicines (US
$41,486), watches and clocks (US
$39,368) and fur skins (US
$37,280) were the most sophisticated exports in 2015.
On the other hand, the smallest PRODY values were below US $900 in the SITC 3.0 categories of natural abrasives (US $856), jute (US $792) and silk (US $766) in 2010. Compared with the more dynamic changes in the top three products, the bottom three products had been quite stable including two products of natural abrasives and jute, over the entire period of 2010–2015. The main change is that uranium and thorium ores (US $674) replaced the bottom location of silk in 2015. It suggests that poor countries trapped at the bottom locations of GVCs be more difficult to improve their export sophistication than rich countries at the top locations of GVCs.
Second, the country-wide indices of export sophistication associated with country
i’s export basket,
EXPYi, is as follows:
Table A3 in
Appendix A presents the largest and smallest
EXPY values (in 2010 US
$) over the period 2010–2015. The highest productivity around US
$25,000 was associated with exports from Ireland, Switzerland and Japan in 2010. China had been in the top three countries temporarily around the OBOR initiative shock year 2013. But in most cases, Ireland, Switzerland, Japan, Finland, Singapore and Qatar stably occupied the highest end of GVCs. In 2010, the smallest
EXPY values were around US
$4000 in Burundi, Central African Republic and Malawi. These three countries, as well as later Burkina Faso and Comoros were at the lowest end of GVCs. In the last year of the sample period, Gambia, Sierra Leone and Sao Tome and Principe took the lowest end of GVCs.
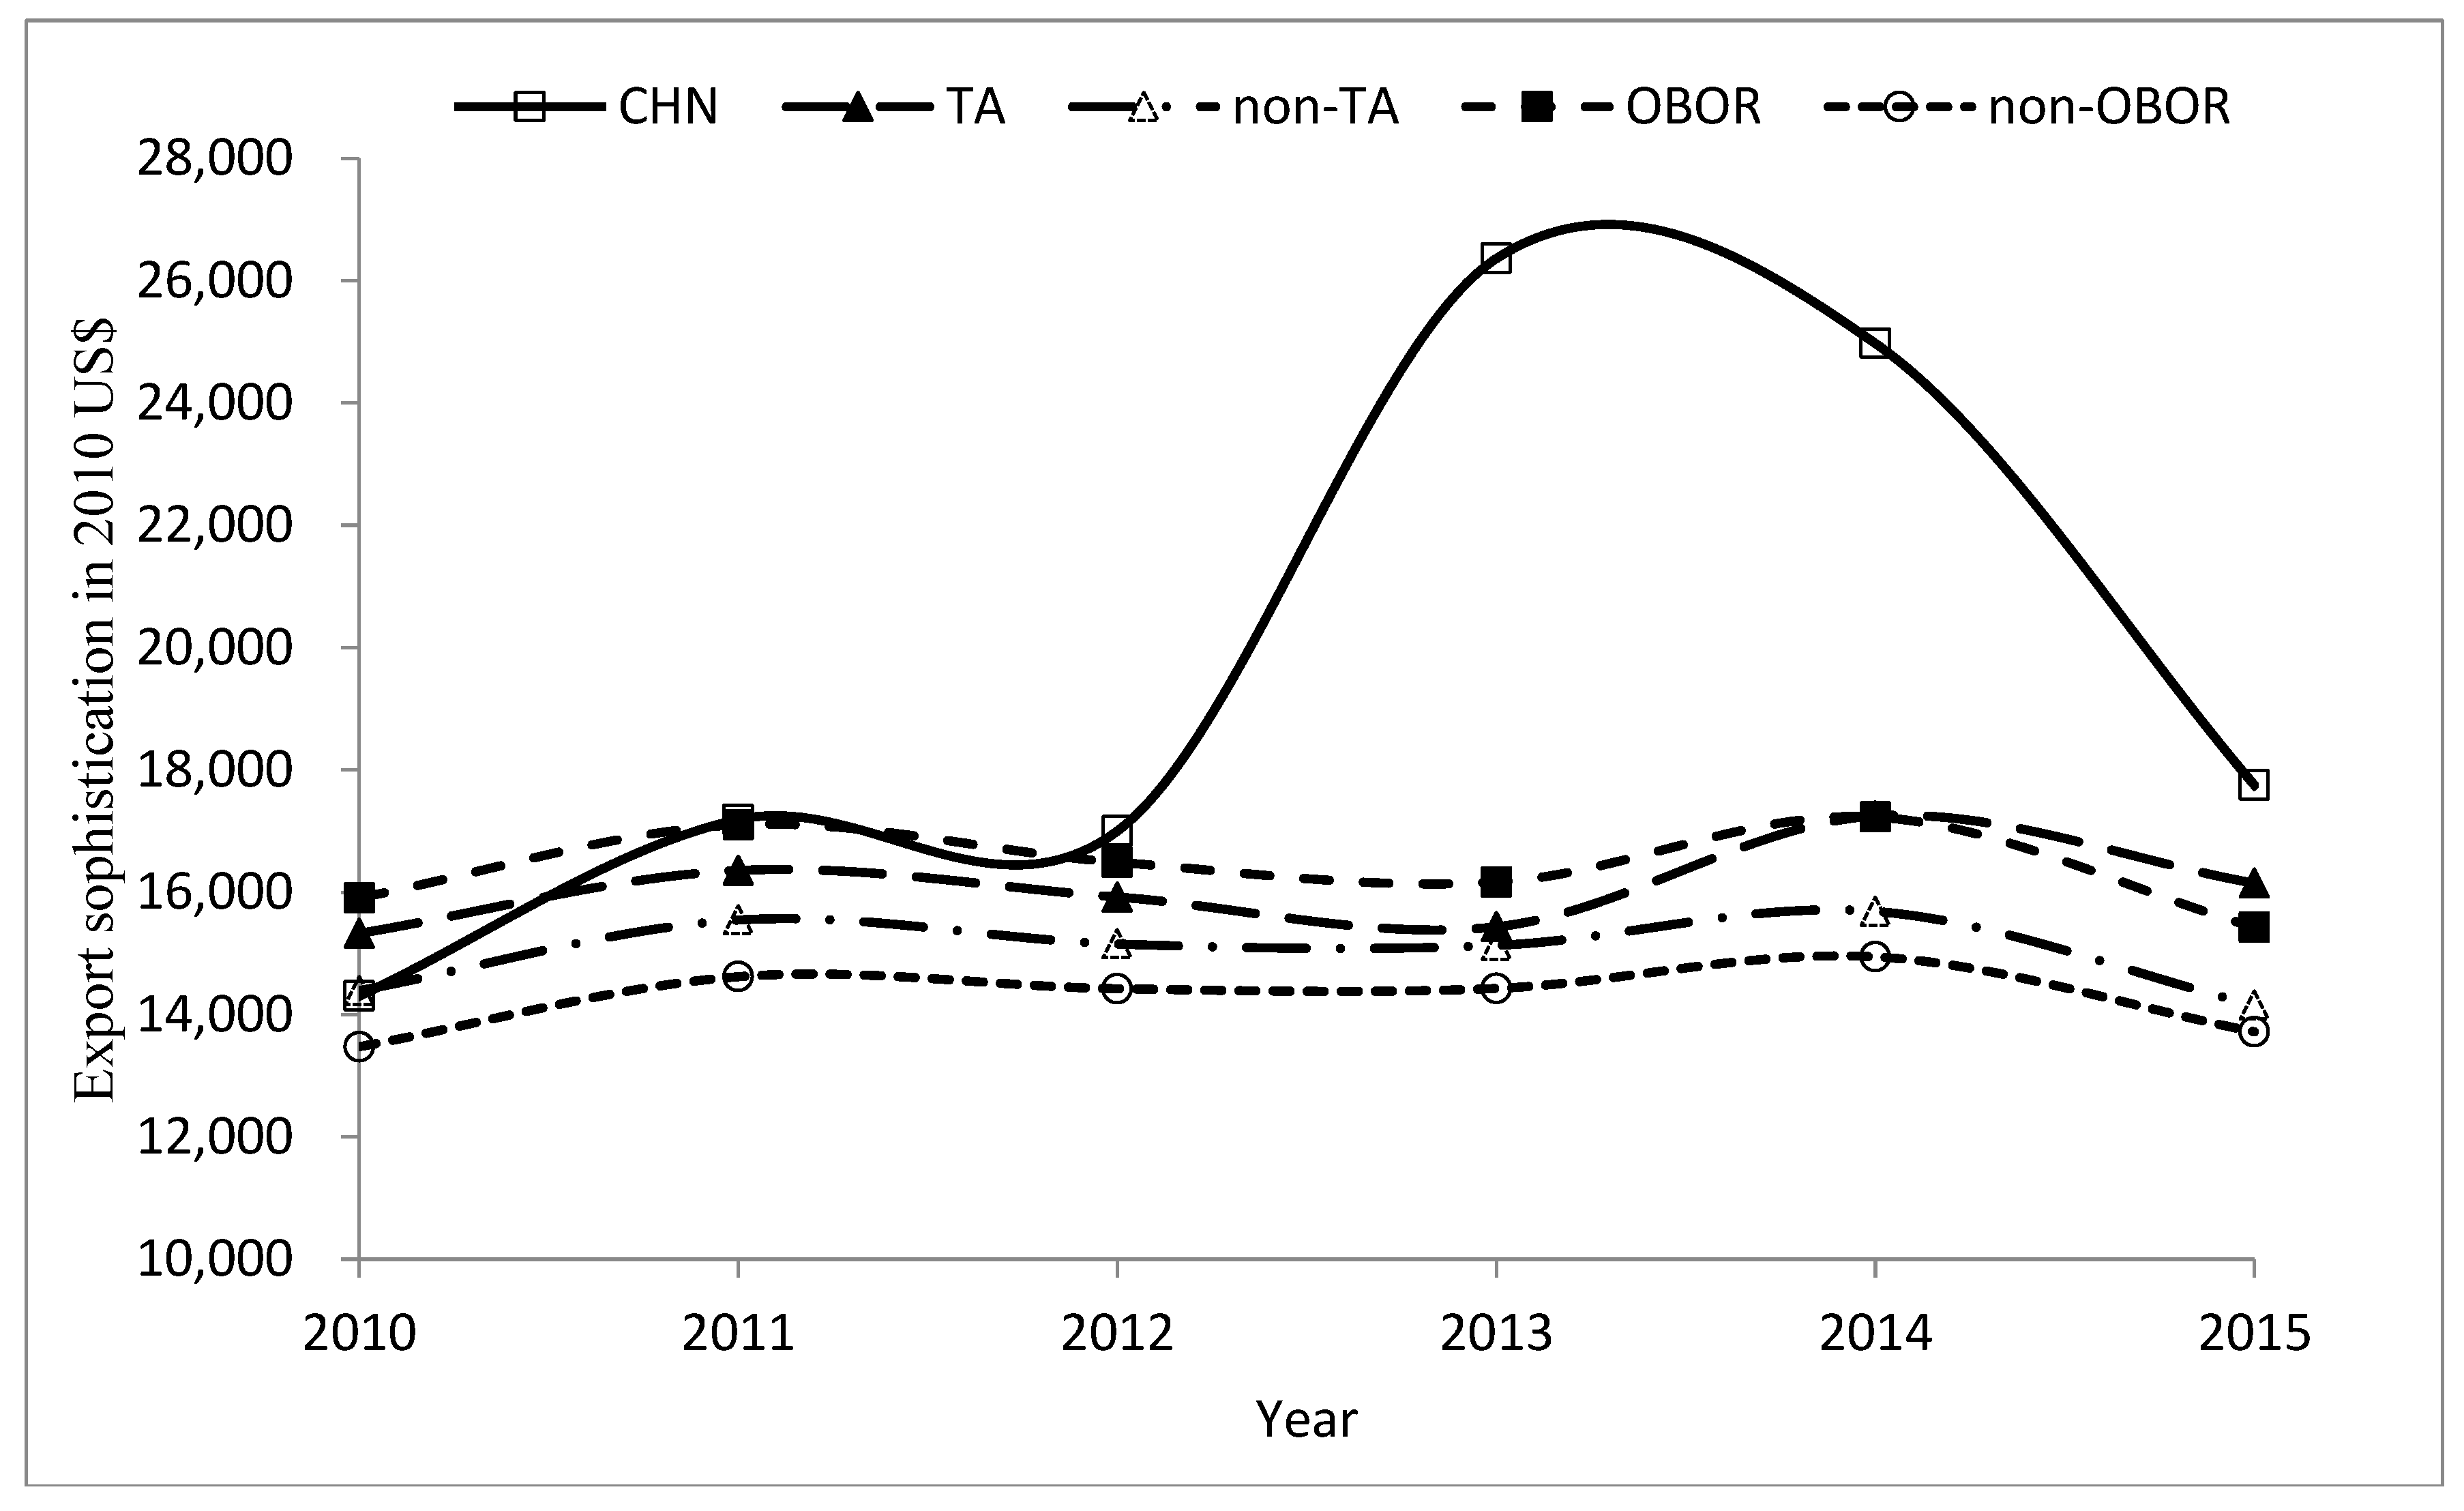
Figure A1 in
Appendix A represents China’s
EXPY over time, China’s TA/non-TA partner countries and OBOR/non-OBOR countries. In 2010, export sophistication of China was around US
$14,000 which was similar to the average export sophistication of non-TA countries, a little bit higher than non-OBOR countries (around US
$13,500) but lower than China’s TA partner countries (around US
$15,500) and OBOR countries (around US
$16,000). Note how China had a significant jump during the OBOR initiative in 2013. However, this shock for the export sophistication was short term because the
EXPY of China recovered a comparable level of other countries in 2015. It confirms the observation that China’s OBOR initiative in 2013 had a strong impact on its export and could have significant influence on those relevant countries. Following [
38], we use the log form export sophistication (
lnEXPY) as the dependent variable in the estimation. According to Hypothesis 3, the coefficients of TA and OBOR dummies in Equation (4) should be significantly positive (λ1, λ2 > 0)
There are alternative measures of GVC-location. For example, Ref. [
55] focus on vertical specialization (VS) which is a key aspect of vertical linkages of GVCs. Koopman et al. [
68] decompose a country’s gross exports into value-added components by source. Koopman et al. [
69] compute domestic and foreign contents. Hausmann and Hidalgo [
70] use information on GDP per capita to calculate export sophistication, only the links between countries and products. This implies that the result depends on the structure of the network and not on the GDP measure. Because this paper estimates the spillovers effect of China’s TAs, OBOR initiative and its export and OFDI on the upgrade of host countries in GVCs, the structure of the network is not the main concern. Hausmann et al. [
38] measure of export sophistication is based on productivity level of countries with same exports weighted by the revealed comparative advantages and is more relevant and accurate for our research purpose.
5.3. Control Variables
Hausmann et al. [
38] argue that levels of export sophistication are highly correlated with some socio-economic variables such as human capital, GDP per capita and the size of the labor force. The former two variables should be positively associated with
EXPY, but the size of labor force might induce labor-intensive technology and decrease the export sophistication [
71]. Görg and Greenaway [
72], Buckley et al. [
73] and Kang et al. [
20] also address the importance of economic, institutional and cultural environment such as infrastructure, political stability, cultural distance and industrialization and so on, as well as the overall macroeconomic and trade policy climate. Hence, in Equations (1)–(4) we also measure these control variables as follows.
Table A4 in
Appendix A presents the descriptive statistics of all dependent and control variables.
5.3.1. Productivity (lnrpgdp)
We use the log form real per-capita GDP (lnrpgdp, in 2010 US$) as productivity measure of each partner country, which is also from World Bank. In the sample’s starting year 2010, China’s real per-capita GDP was US $4560, ranking the 120 among 217 economies and falling between the 25th percentile (US $1535, around Nicaragua ranking 165) and the 50th percentile (US $5599, around Belarus ranking 108). In the sample’s ending year 2015, China’s real per-capita GDP was US $7063, ranking the 92 among 217 economies and falling between the 50th percentile and 75th percentile (US $21,136, around Slovenia ranking 55). This indicates that China’s productivity has improved very fast during the sample period, and has surpassed the median level in terms of per-capita income. Thus, the sample period 2010–2015, during which China transformed from a low-end country to a middle high-end country reveals a unique semi-natural societal experiment for the effect of China’s TA partnership on the GVC-location of partner countries.
5.3.2. Human Capital (edu2)
The human capital of partner countries reflects the absorptive capacity of spillovers effect of import and FDI from China. We use the enrollment ratio of secondary level education as proxy of human capital of partner country. This variable is from World Development Indicators data [
10].
5.3.3. Infrastructure Facilities (infra)
Infrastructure facilities in partner countries such as railways, airports, internet access and telecommunication have impact on China’s export, OFDI and its spillover effect. The six indicators of infrastructure facilities in the partner countries are air transport freight, railway density, landline phone, mobile phone, internet and fixed broadband subscriptions, also derived from World Development Indicators data [
10]. We measured the infrastructure facilities in the partner countries by applying a principal component analysis (PCA) that can account for most of the variability in these six indicators for all 216 partner countries/regions and China and reduce the dimensionality of the dataset. A factor (
infra) varies from −1.065 to 3.51 with large values suggesting better infrastructure facilities in the partner countries.
5.3.4. Institutional Quality (wgi)
Six social and political governance variables in the Worldwide Governance Indicators [
74] are used to measure the institutional quality in the partner countries. These variables reveal the basic situation of partner countries’ political environment which includes indicators of government effectiveness, regulatory quality, control of corruption, political stability and absence of violence/terrorism, voice and accountability and rule of law. As above, a PCA is applied on these six variables for all 216 partner countries and China. Thus, a factor of worldwide governance indicators (
wgi) varies from −2.28 to 1.93, with large values suggesting better institutional quality.
5.3.5. Cultural Distance (cd)
Following [
20], we extend [
75] model to measure the cultural distance index (
cd) using six cultural dimensions: individualism/collectivism, power distance, uncertainty avoidance, masculinity/femininity, indulgence/restraint and long-term/short-term in [
76,
77]. In
Table A4, the cultural distance index (cd) varies from 0.16 to 8.16 with higher values not only indicating larger cultural distance of host countries from China, but also reflecting a weaker absorptive capacity for spillovers of China’s export and OFDI. Interested readers can contact with authors for the details of measurement of infrastructure facilities, institutional quality and cultural distance in the host countries.
5.3.6. Other Control Variables
We controlled the FDI (
fdir, % GDP), labor force (
lab, % population) and the economic structure (
indserv, a ratio of an industrial sector to a service sector), also derived from World Development Indicators data [
10].
5.4. Vertical and Horizontal TAs
For alternative measure of partner country’s location in GVCs, this paper classifies partner countries into Group 1–4 by using the quartiles of their real GDP per capita: (1) the low-end group, Group1≤ US
$1535 (first quartile); (2) the low-middle-end group, US
$1535 (first quartile) < Group2≤ US
$5599 (second quartile); (3) the middle-high-end group, 5599 US
$(second quartile) <Group3≤ US
$21,136 (third quartile); (4) the high-end group, Group4 > US
$2,1136 (third quartile). This paper uses high-end Group 4 as the baseline group and construct three dummies for the other three groups. The log form real GDP per capita (
lnrgdppc) in Equations (1)–(4) is replaced by the three dummies, as well their interaction (*=times) with TA dummy to reveal the heterogeneous effect of China’s TA on partner countries’ export sophistication along the different locations of the GVCs.
Over the OBOR initiative period 2010–2015, China’s productivity has overpassed the threshold of media lever and transited from a low-middle-end country in group 2 to a middle-high-end country in group 3. And, the coefficient of TA dummy interacted with Group1 dummy (λ5) in Equation (10) represents the incremental effect of China’s vertical TA on the export sophistication of low-end countries. According to Hypothesis 4, China’s vertical TA should improve the export sophistication of low-end countries more than that of the baseline high-end countries. Thus, if the vertical inter-industry effect dominated the spillovers of China’s TAs, the incremental effect of China’s vertical TA on low-end countries should be significantly positive (λ5 > 0).
The coefficients of TA dummy interacted with Group2 and Group3 dummies (λ6, λ7) in Equation (10) represent the incremental effects of China’s horizontal TAs on the export sophistication of low-middle-end and middle-high-end countries. According to Hypothesis 5, if the horizontal intra-industry effect dominated the spillovers of China’s TAs, the incremental effect of China’s horizontal TA on low-middle-end and middle-high-end countries should be significantly positive (λ6 > 0, λ7 > 0).
5.5. Depth of TAs
Numbers and content of provisions in trade agreements might have changed over time. The simple measure of TA as a dummy variable might overlook the fact and lose important information of TA deepening. Before the 1990s, trade arrangements involve mostly tariff reductions. However, several more recent trade agreements have covered more untraditionally regulatory areas and other policy provisions such as services, investment, competition policy and intellectual property right protection than before [
9,
16,
78]. Following [
19], this paper uses the detailed information of 52 legally enforceable provisions of China’s TAs (including 14 WTO-plus provisions and 38 WTO-extra provisions) in the World Bank Content of Deep Trade Agreement Database [
37] to measure the depth of China’s TAs.
First depth measure is the number of legally enforceable provisions in China’s TAs. Specifically, it defines the variable Depth1it = provikt i.e., the simple count of legally enforceable provisions (provikt) included in the agreement between China and the partner country i in year t.
We define the second depth variable
Depth2it =
provict as the number of “core” provisions (
provict) included in the agreement between China and the partner country
i in year
t. “Core” provisions are the most economic relevant content in a trade agreement. In our dataset, “core” provisions include 14 WTO-plus provisions and 4 WTO-extra provisions. Other 34 untraditional TA provisions such as human rights, environmental laws and nuclear safety etc. have been excluded from counting for the second depth variable. Hofmann et al. [
37] also argue that the 18 “core” provisions are most often included in TAs.
As above measurement of infrastructure facility and institutional quality, the third measurement of depth of China’s TA is a PCA factor accounting for the variability of 52 provision areas. We then define the third depth variable as Depth3it = wk provikt which is weighted average of 52 provisions using the coefficients of the first component as weights.
Thus, we replace the TA dummy variable and its interactions with country groups in Equations (7)–(10) with the three depth measures of TA (Depth1–3). According to Hypotheses 4–5, China’s deepening TAs can have vertical or horizontal spillovers effect on the export sophistication of the partner countries.
6. Empirical Results
6.1. SEM Results
Table 1 shows the SEM estimation results of direct effect of China’s TAs on GVCs upgrade by using simultaneous Equations (1)—(4). First of all, the OBOR selection Equation (1) shows significantly positive effect of China’s TA partnership on the likeliness of being covered by the OBOR initiative, as Hypothesis 1 predicts. The TA partner countries of China have 14% higher opportunity than those non-TA countries to be covered by the OBOR initiative. It confirms that the OBOR initiative is a continuation of the long-term tradition of economic cooperation between China and its partner countries [
20].
The second export equation suggests that China’s TA partnership (3.163) and OBOR initiative (3.362) can significantly promote China’s export to the partner countries. The third OFDI equation also finds the significantly positive effect of TA partnership (2.514) on China’s OFDI to the partner countries, but the direct effect of OBOR initiative is not significant. Thus, Hypothesis 2 is only partially supported by empirical evidences in the second and third columns in
Table 1.
The fourth export sophistication equation shows the significantly positive effect of OBOR initiative on GVC upgrade of partner countries, but no significantly direct effect of TA. Coverage by the OBOR initiative can promote the export sophistication of partner countries by 10.7%. Thus, Hypothesis 3 is also only partially supported by the direct effect results in
Table 1. However, results in
Table 1 ignore the possible indirect effects of China’s TAs. For example, China’s TAs can significantly improve the OBOR coverage, China’s export and OFDI in the partner countries which might work as three critical channels for indirect positive effect of China’s TAs on the export sophistication.
One of advantages of a SEM is that it can calculate the indirect effects of China’s TAs, which is presented in panel a of
Table 2. It finds that China’s TAs can have significantly positive indirect effect on export to partner countries through the channel of OBOR initiative. China’s export to TA partner countries is 47% higher than that to non-TA countries. At the same time, the indirect effect of China’s TAs on export sophistication is also significantly positive through channels of OBOR initiative, export and OFDI. China’s TA partnership can indirectly improve the export sophistication of partner countries by 2.6%.
Panel b of
Table 2 combines the direct effect results in
Table 1 and the indirect effect results in panel a. The total effects of China’s TAs on OBOR coverage (0.14), China’s export (3.633), OFDI (2.549) and export sophistication (0.05) are all significantly positive, all of which are consistent with Hypotheses 1–3. At the same time, the total effects of OBOR initiative are significantly positive on China’s export (3.633) to the partner countries and their export sophistication (0.112). Thus, it concludes that both Hypothesis 1 and 3 are fully supported by estimation results of total effects in
Table 2. Hypothesis 2 is also supported by results in
Table 1 and
Table 2 except that OBOR’s positive effect on China’s OFDI is insignificant. It is consistent with [
20]’s finding that the significance of increasing effect of OBOR on China’s OFDI is based on the economic, institutional and cultural heterogeneity across countries.
6.2. Vertical and Horizontal TAs
Table 3 presents the SEM estimation results considering vertical and horizontal TAs on different income country groups using Equations (7)–(10). In order to focus on the main research questions, this paper only present the total effects of four county group dummies (g1–g4) and their interactions with China’s TA dummy. Thus, this paper has categorized all 1296 (=216 sample economies including China’s 21 TA partner countries × 6 years) observations into eight groups by income quartiles and TA status with China: (1) 295 observations of low-end non TA countries (g1); (2) 303 observations of low-middle-end non TA countries (g2); (3) 302 observations of middle-high-end non TA countries (g3); (4) 270 observations of high-end non TA countries (g4); (5) 29 observations of low-end TA countries (g1 × TA); (6) 21 observations of low-middle-end TA countries (g2 × TA); (7) 22 observations of middle-high-end TA countries (g3 × TA); (8) 54 observations of high-end TA countries (g4 × TA). It applies the 270 observations of high-end non-TA country (g4) as the baseline group.
In the first OBOR selection equation, non-TA countries are not significantly different each other. China’s TAs can significantly improve the chance of the low (0.62), low-middle (0.449) and middle-high (0.289) income countries to be involved in the OBOR initiative. However, for the high-income countries (GDP per capita > 21,136 US$), the TA agreements even significantly lower their chance to be involved in the OBOR initiative (−0.17). Hypothesis 1 is confirmed only for China’s TA partner countries with low and middle-level income.
In the second and third columns, OBOR initiative still has significantly positive effect on China’s export (3.719) and OFDI (0.267) as Hypothesis 2 predicts. However, China’s export and OFDI to non-TA partner countries are significantly lower in the low- and middle-income countries (g1–g3) than in those non-TA countries with high income (g4). China’s export to its TA partner countries with low income (−2.767) is also significantly lower than other TA countries. China’s TAs only improve export to high-end countries (4.165), as well as FDI to low-middle-end (1.107) and high-end countries (2.145). Thus, Hypothesis 2 is only confirmed for China’s TA partner countries with high income and partially for those with low-middle income.
In the last column, the significantly positive effects of OBOR (0.105) on export sophistication, supporting Hypothesis 3. Furthermore, the significantly positive effects of TA are mainly in the low-end countries (0.098) and low-middle-end countries (0.184), as China transits from a low-middle income country to a middle-high income country over the sample period 2010–2015. Hence, the vertical spillovers of export sophistication in low-end countries support the vertical TA Hypothesis 4, while the horizontal spillovers of export sophistication in low-middle-end countries support the horizontal TA Hypothesis 5.
6.3. China’s TA Depth
To test the sensitivity of the results, this paper replaces the TA dummy variable in Equations (7)–(10) with three measures of the depth of China’s TAs. China’s deepening TAs have covered more and more provisions on investment, competition policy, service and intellectual property rights [
9].
Table 4 presents the SEM estimation results of the total effect of China’s deepening TAs on partner countries’ GVC upgrade by using the new measures of TA depth and Equations (7)–(10). To simplify the analysis, it focuses on the estimation results of the equation (10) using the “total depth”(
depth1, counting 52 legally enforceable provisions), “core depth” (
depth2, counting 18 legally enforceable core provisions) and the “PCA depth” (
depth3, using principal component analysis to account for most variability of 52 legally enforceable provisions).
Estimation results of TA depth are very close to those of TA dummy in the last column of
Table 3. Non-TA countries with low and middle-level income have significantly lower export sophistication than high-end non-TA countries. OBOR initiative always has significantly positive effect on export sophistication. In the first column, if the total depth increased one more provision, the export sophistication of the low-end partner countries could increase by 9.8%. The vertical spillover of China’s TA on low-end economies is significantly positive, as Hypothesis 4 predicts. Moreover, one provision increase in China’s TA will increase the export sophistication of low-middle-end economies by 18.4%. The horizontal spillover of China’s TA on low-middle-end economies is also significantly positive, supporting Hypothesis 5. Thus, the total depth of China’s TA has both vertical and horizontal spillover effects on the GVC upgrade of partner countries.
In the second column, one “core” provision increases of China’s TA depth only increase the export sophistication of the low-end partner countries by 1.7%, but no significant effect on low-middle-end partner countries. Thus, the deepening “core” provisions of China’s TAs only has the vertical spillover effect on those low-end partner countries (as in Hypothesis (4), but no horizontal spillover effect on those low-middle-end partner countries (as in Hypothesis (5).
The PCA depth has the similar effect to the total depth. In the third column, if the PCA depth index increased by one, the export sophistication of the low-end partner countries could increase by 3.2%. The vertical spillover of China’s TA on low-end economies is significantly positive, as Hypothesis 4 predicts. Moreover, one unit increase of the PCA depth will increase the export sophistication of low-middle-end economies by 4.6%. The horizontal spillover of China’s TA on low-middle-end economies is also significantly positive, supporting Hypothesis 5. Therefore, the PCA depth of China’s TA still has both vertical and horizontal spillover effects on the GVC upgrade of partner countries.
7. Conclusions and Discussion
This paper contributes to the current literature on trade agreements (TAs) and partner countries’ upgrade in global value chains (GVCs) by studying the experience of China. We apply the structural equation model (SEM) on a dataset including 216 countries and regions to identify the direct and indirect effects of China’s TAs and OBOR initiative on its export, outwards foreign direct investment (OFDI) and partner economy’ GVCs upgrade over the period 2010–2015. SEM can correct the potential endogeneity problem of China’s OBOR initiative, exports, OFDI and host countries’ upgrade in GVCs in this simultaneous system. We find that China’s TA partner countries are more likely to be included in the OBOR initiative than those non-TA partner countries. The positive effects of China’s TAs and OBOR initiative on China’s export, outwards foreign direct investment (OFDI) and partner countries’ upgrade in GVCs differ across country groups at the different locations of GVCs. Both vertical and horizontal spillover effects exist in China’s TAs. Therefore, the partner countries at low end and middle of GVCs might benefit more from TAs with China than those richer countries at the high end of GVCs.
Based on this study, we recommend that China should take advantage of the negotiating and deepening trade agreements including PTAs and RTAs to promote the OBOR initiative in more countries and regions. The participation of more countries not only encourages international trade and FDI between China and the partner countries, but also improves the locations of GVCs for two sides. With both vertical and horizontal spillovers effects of China’s TAs, developing countries can benefit even more from the partnership with China. Fu et al. [
34] also argue that for the countries more like China, economic cooperation should have priority while for those countries much different from China, the starting point should be cultural exchanges and institutional development. It is consistent with our results of less significant effect of TAs with more developed countries than with developing countries. Thus, more countries with geographic, cultural, institutional and endowment’s diversity can benefit from the OBOR initiative through more cultural and institutional cooperation including traditional TA negotiation and untraditional TA deepening.
As final remarks, we explain the limitations of our study and the possible directions of future works. First of all, the detailed content of specific provisions in China’s TAs might have subtle effects on OBOR initiative coverage, China’s export, OFDI and partner countries’ upgrade in GVCs. Laget et al. [
19] categorize 52 legally enforceable provisions of TAs into 14 WTO-plus provisions and 38 WTO-extra provisions, or 18 core provisions and 34 non-core provisions. The dataset including only China’s TAs is too small to estimate these specific policy effect. Second, as the deepening TAs concern more on the untraditional policy areas such as the global environment issues, the development of global value chains may be conditioned by sustainability policies and laws. Countries less committed to contribute to sustainable development would attract the most polluting production stages of value chains. This important aspect of the relationship between the deepening TAs and GVCs has not been thoroughly studied yet and calls for further research. Thus, future research can study how the specific provisions in deepening trade agreements affect economic outcomes of exporter and cross-border investors. More detailed data of specific policy areas in TAs and relevant exporting and investment firms need to be collected and analyzed. Researchers need focus more on case studies and survey-based data at firm level to explore the vertical and horizontal spillovers from trade agreements.


