Article

Outdoor Thermal Comfort at a University Campus: Studies from Personal and Long-Term Thermal History Perspectives

School of Design, Shanghai Jiao Tong University, Shanghai 200240, China
*
Author to whom correspondence should be addressed.
Sustainability 2020, 12(21), 9284; https://doi.org/10.3390/su12219284
Submission received: 23 September 2020 / Revised: 3 November 2020 / Accepted: 6 November 2020 / Published: 9 November 2020
(This article belongs to the Special Issue Climate Change and Sustainable Urban Environmental Planning)

Abstract

:
Thermally comfortable outdoor spaces have contributed to high-quality urban living. In order to provide a further understanding of the influences of gender and long-term thermal history on outdoor thermal comfort, this study conducted field surveys at a university campus in Shanghai, China by carrying out microclimatic monitoring and subjective questionnaires from May to October, 2019. The analysis of collected data found that, during our survey, 57% of the occupants felt comfortable overall and 40–60% of them perceived the microclimate variables (air temperature, humidity, solar radiation, and wind speed) as “neutral”. The universal thermal climate index (UTCI) provided a better correlation with occupant thermal sensation than the physiologically equivalent temperature (PET). Females were more sensitive to the outdoor thermal environment than males. Older age led to lower thermal sensation, but the thermal sensitivities for age groups of <20, 20–50, and >50 were similar. Occupants who had resided in Shanghai for a longer period showed higher overall comfort rating and lower thermal sensation. Interviewees who came from hot summer and cold winter climate regions were less effected by the change of UTCI than those from severe cold or cold climate regions.

1. Introduction

With 56% of the global population living in cities in 2020 [1], thermal comfort in urban outdoor spaces has gained growing research attention worldwide. Thermally comfortable urban open spaces offer high-quality locations for various activities, attract citizens to the outdoors, and improve the vitality of the city [2,3,4,5,6,7,8]. Increased outdoor activity may also help in saving building energy consumption [9,10,11,12]. According to the review by Lai et al. [13], field studies concerning outdoor thermal comfort have been conducted in more than 100 cities globally to gain a better understanding of this topic. These studies have demonstrated that physical, physiological, and psychological factors are direct influencing factors of outdoor thermal comfort.
From a physical perspective, many studies [14,15,16,17,18] have demonstrated that the physical environment parameters such as air temperature, wind, thermal radiation, and humidity are crucial because they determine the heat transfer between a human body and the outdoor thermal environment [19]. Besides physical parameters, physiological signals of the human body such as skin temperature and rectal temperature were shown to be a good indicator of outdoor thermal comfort [20,21,22]. Psychological influences [23] include experience, expectation, and perceived control, and these altered people’s thermal sensation in outdoor spaces.
Although the direct influencing factors (physical, physiological, and psychological) are known, outdoor thermal comfort remains a complex issue. For example, due to individual differences, subjects of different genders and ages may have distinctive thermal perceptions, even under the same thermal environment. Females were often found to be more sensitive to the thermal environment than males [24,25,26], while the elderly group was the least sensitive compared to other age groups [27]. However, the findings were not consistent. Cohen et al. [28] demonstrated that females had a higher tolerance to cold than males did. In addition to personal factors, people’s long-term thermal history affected their current thermal sensation. Some studies [29,30,31] have reported that local residents expressed higher satisfaction to the outdoor thermal environment than visitors did, but the researchers did not investigate the effect of former climatic experiences.
The contradictory findings regarding personal influences on outdoor thermal comfort and the insufficient research effort on the effect of long-term thermal history suggest that further investigation should be conducted. This paper reports the findings of a thermal comfort field survey of a university campus. One main focus of this study is to analyze the influences from a personal and long-term thermal history perspective.

2. Methods

A field survey was conducted at a university campus to study the outdoor thermal comfort. This section first describes the investigated site. Then, the field survey is presented in detail. Finally, the thermal indices used for the data analysis are introduced.

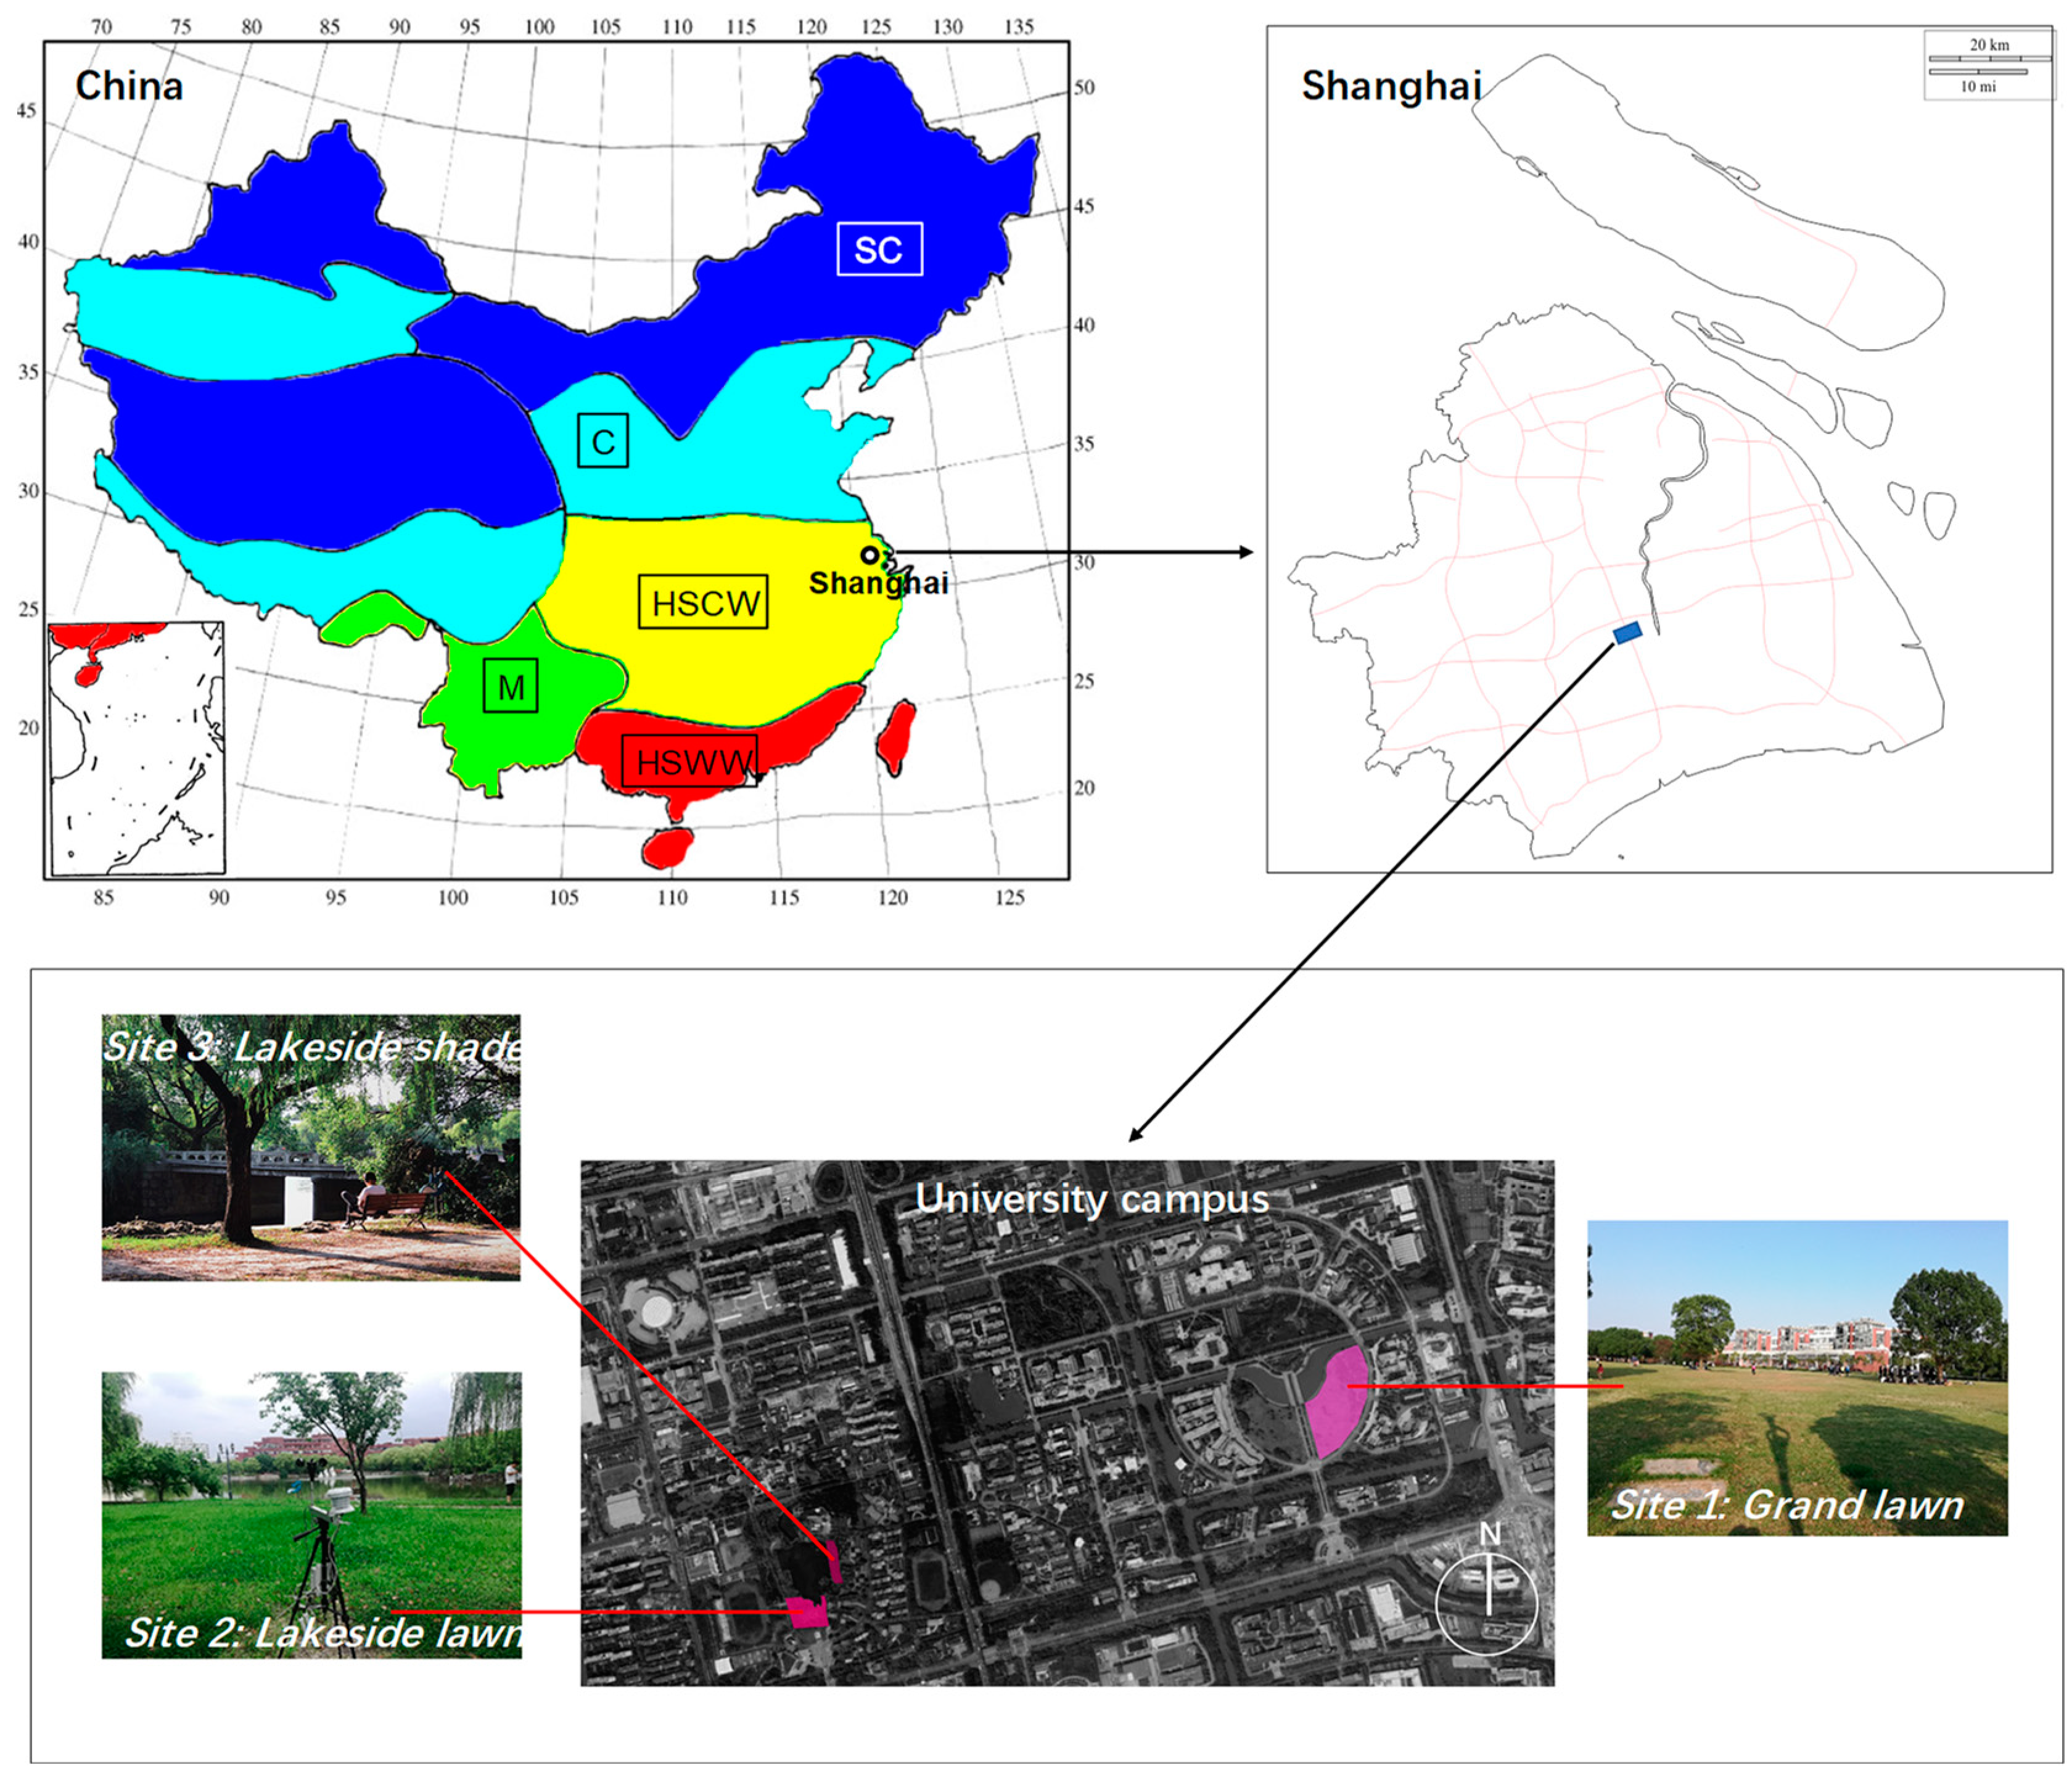
2.1. Site Description
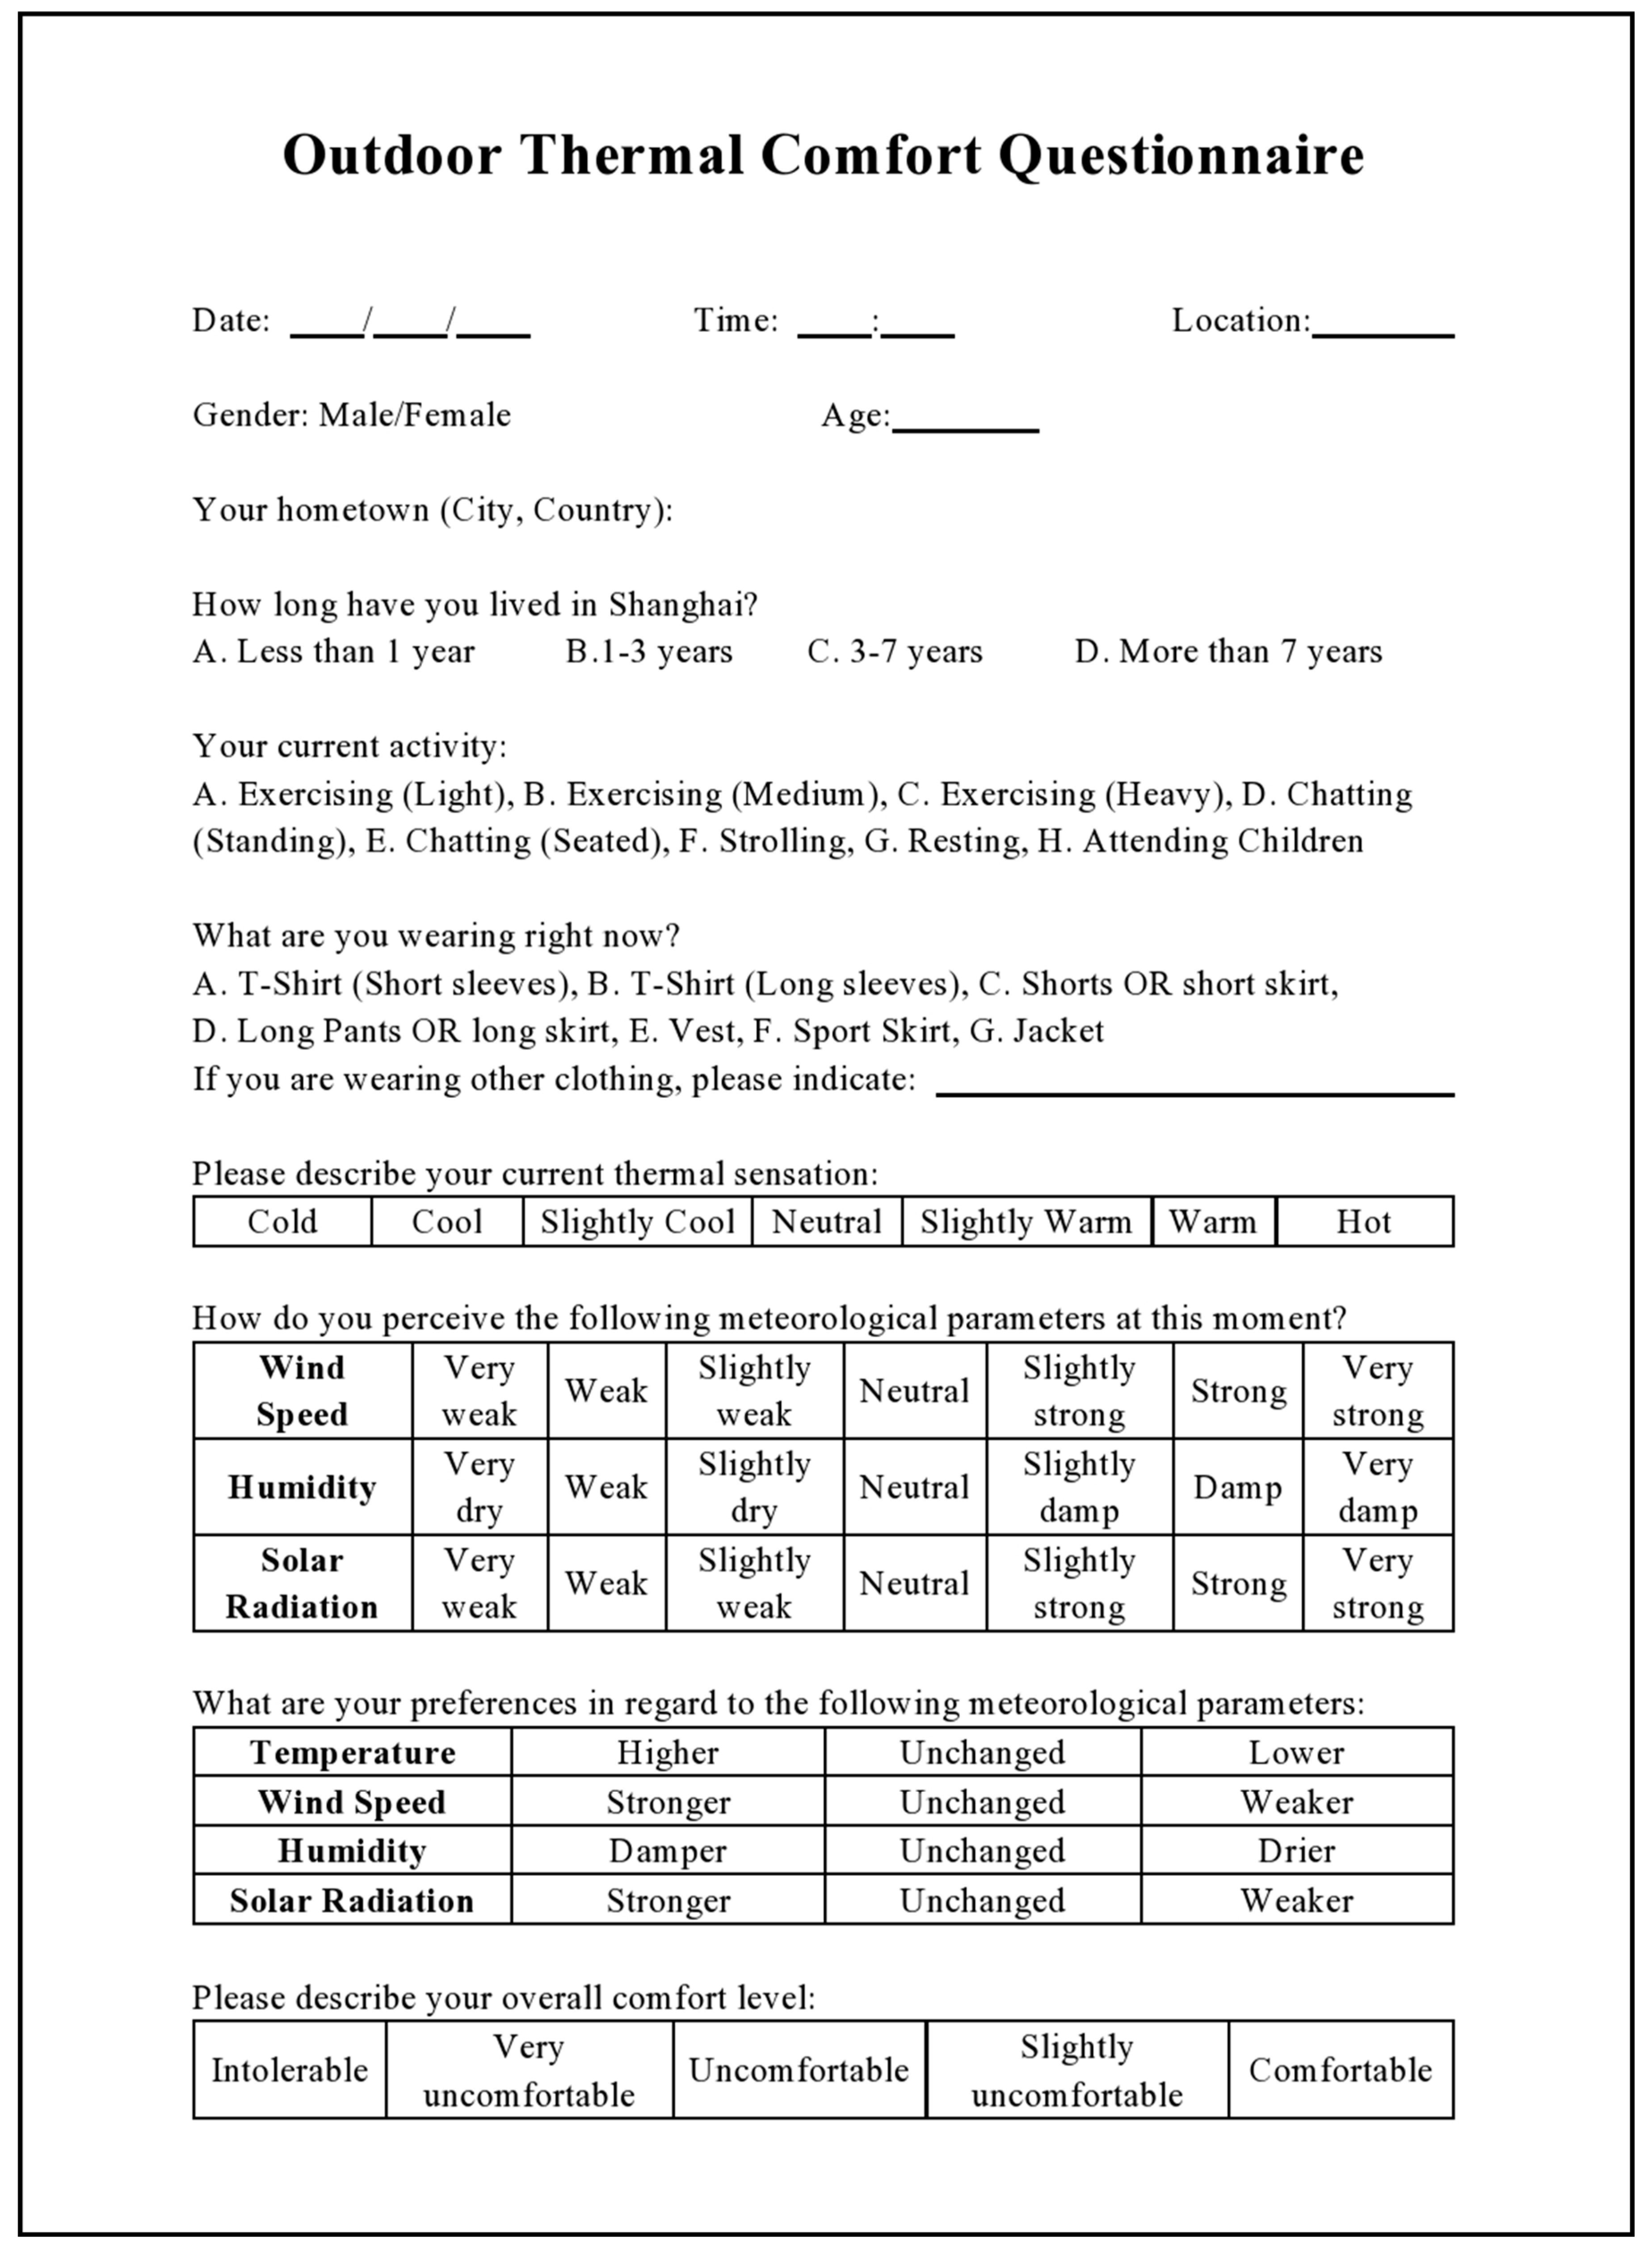
The investigation was conducted at the Minhang Campus of Shanghai Jiao Tong University in Shanghai, China. We chose to perform the outdoor thermal comfort field study at a university campus because the majority of interviewees were university students, and they came from different climate zones and had distinctive thermal histories. The campus has an area of 309 hectares and encounters a wide variety of thermal environments. As shown in Figure 1, the field survey was performed at three sites with a distinctive surrounding morphology. The first site is a grand lawn with an open view and is exposed to direct sun and wind. The second site is a lawn near a lake, but it is much smaller compared to the first site. The third site is close to the second one, but it has clusters of trees, which provide shade. The users of the investigated sites performed various activities such as exercising, relaxing, reading, and chatting.

2.2. Field Survey

In order to collect data to analyze outdoor thermal comfort, this investigation conducted six field surveys from 1 May 2019 to 3 November 2019. During the field survey, subject interviews were conducted while, simultaneously, the microclimate was monitored. For the microclimate monitoring, portable weather stations were deployed at the sites to record air temperature (Ta), relative humidity (RH), wind speed (Va), and global solar radiation (G) at a height of 1.5 m above the ground. Table 1 shows the specifications of the sensors used to record the microclimatic variables.
A voluntary questionnaire was distributed to occupants in the studied sites to collect subjective data. The collected information included personal data such as gender, age, clothing insulation, activity level, and long-term thermal history information such as length of residence in Shanghai and former residence. Subjective perception and preference of the thermal environment were also recorded. The perceptions included seven-point thermal sensation [32], and those of the wind, sun, and humidity. The preference questions asked the occupants if they would like the microclimatic parameters (air temperature, wind, solar radiation, humidity) to be higher, unchanged, or lower. The overall comfort was rated on a five-point scale: comfortable, slightly uncomfortable, uncomfortable, very uncomfortable, and intolerable. The questionnaire used in the investigation is shown in Figure 2. A total of 520 samples were obtained in the field survey, with 75 samples in May, 136 in June, 118 in July, and 191 in October.

2.3. Thermal Indices

Two thermal indices were chosen for the analysis of outdoor thermal comfort: Physiologically Equivalent Temperature (PET) [33] and Universal Thermal Climate Index (UTCI) [34]. The two indices assess the influences from the outdoor thermal environment parameters in an integrated manner, and they have been widely used in outdoor thermal comfort studies. In this study, PET and UTCI were calculated using the RayMan program [35,36].

2.3.1. Physiologically Equivalent Temperature (PET)

The PET index is an equivalent temperature based on the two-node Munich Energy-balance Model for Individuals [37]. PET is defined as the air temperature of a typical indoor room producing the same core and skin temperature as the actual complex outdoor conditions.

2.3.2. Universal Thermal Climate Index (UTCI)

UTCI is similar to PET, but the UTCI has several advantages. For example, UTCI is based on an advanced multi-node human thermoregulation model [38]. In addition, UTCI considers the changes in clothing insulation with the changes in ambient temperature [38]. When comparing the typical indoor and actual environments, UTCI uses integrated physiological signals as criteria [39].

3. Results

Because the microclimatic parameters are essential factors in outdoor thermal comfort [40], this section first presents the weather of Shanghai and the microclimatic conditions present during the survey. Then, thermal comfort is demonstrated descriptively and analyzed with respect to PET and UTCI. Finally, the influences of personal factors and long-term thermal history were studied and presented.

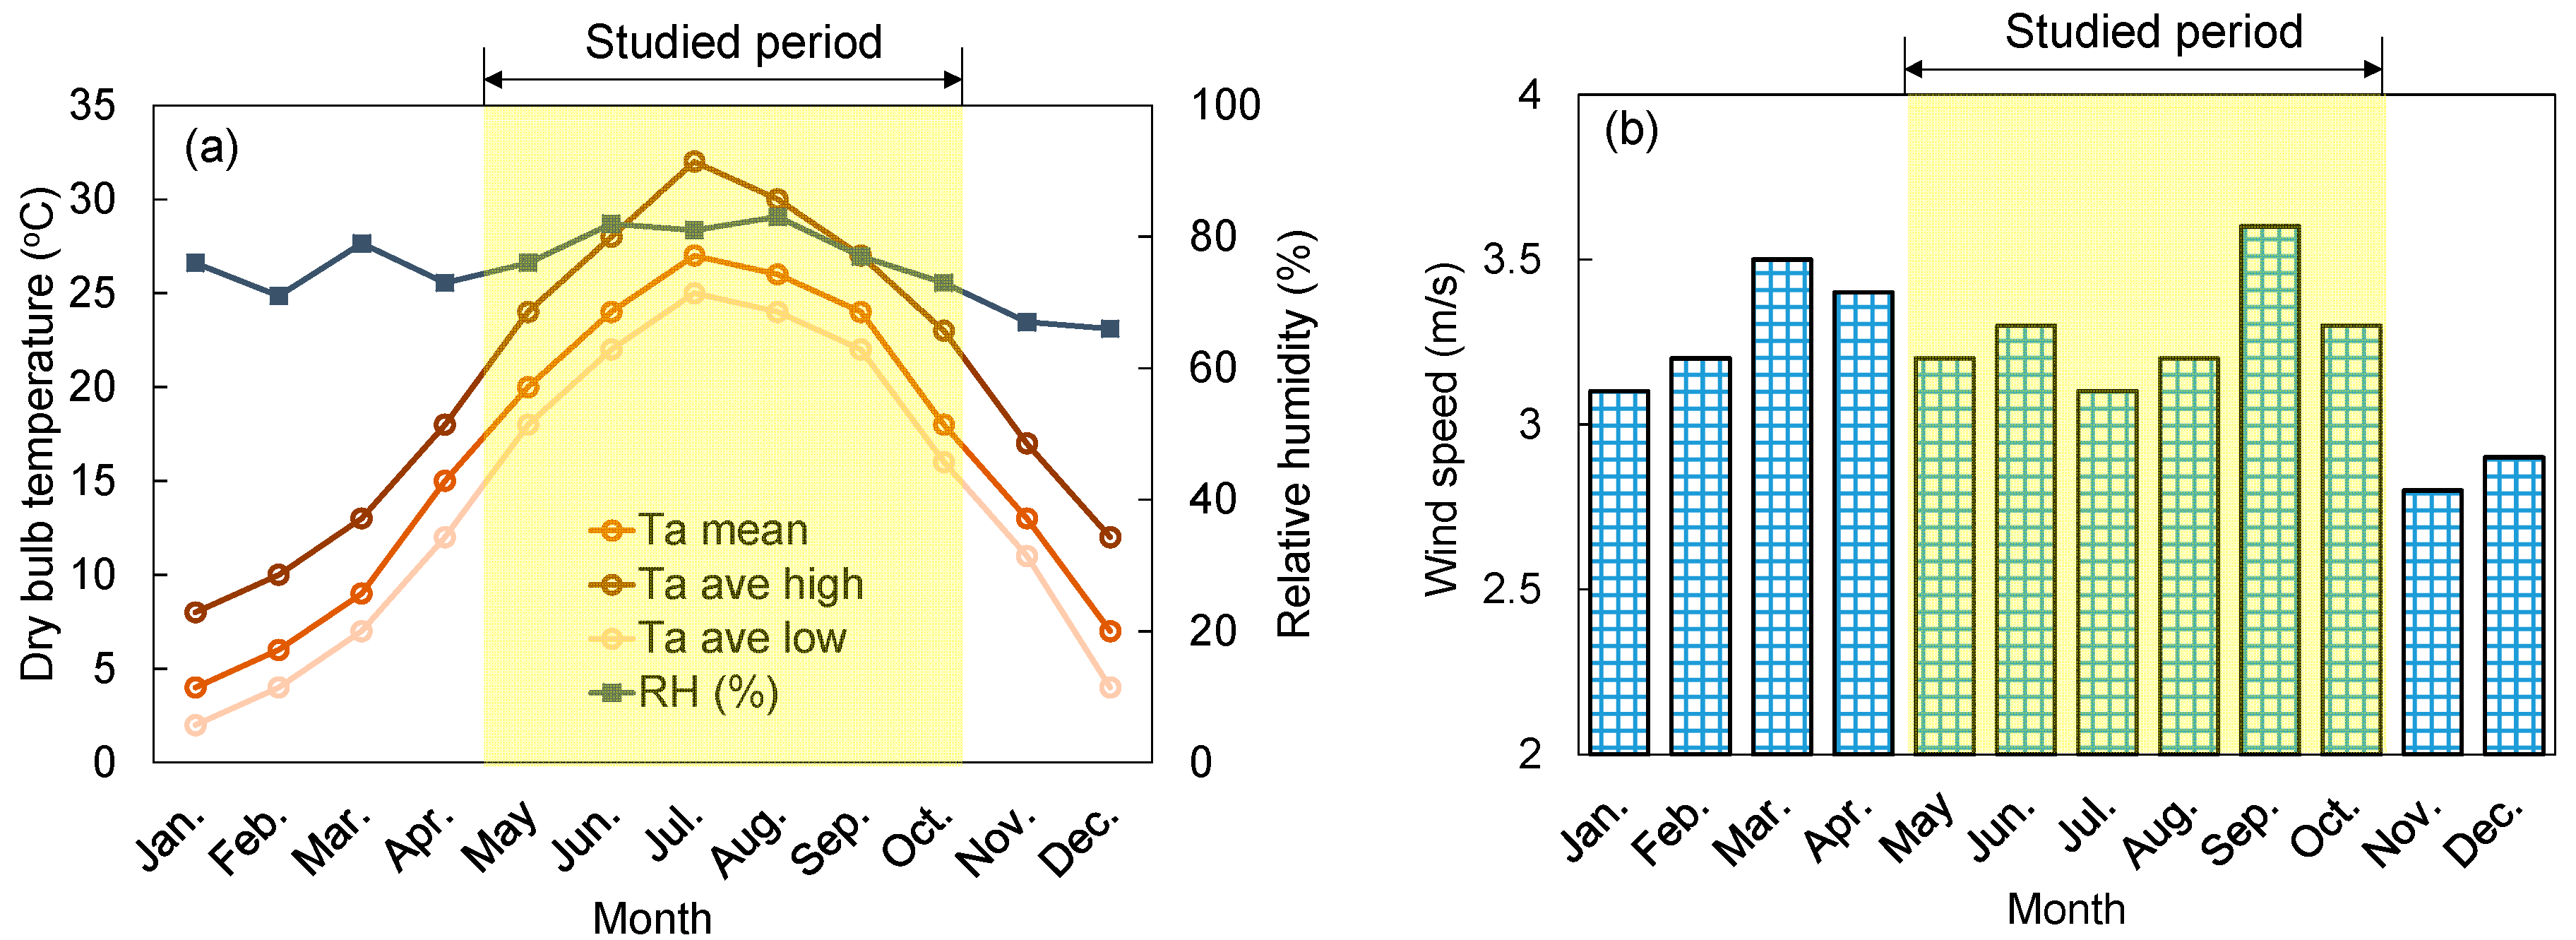
3.1. Climate and Microclimate

According to Koppen Climate classification [41], Shanghai has a humid subtropical climate (Csa) with a hot summer and a cold winter, and it is generally moist throughout the year. Figure 3 shows the mean, averaged maximum, and averaged minimum monthly air temperature and mean monthly relative humidity in Shanghai according to Chinese Standard Weather Data (CSWD) from 1971 to 2003 [42]. The hottest month was July, with a monthly mean Ta of 27 °C, while the coldest month was January, with a 4 °C monthly mean Ta. The relative humidity was constantly high, exceeding 65% for all months. In summer months (June, July, and August), the mean monthly RH was greater than 80%. The wind speed 10 m above ground was generally higher than 3 m/s.
Our field investigation was conducted from May to October, when the weather ranged from mild to hot. Table 2 shows the microclimatic conditions measured at the three sites during the survey. The air temperature was between 20.7 and 33.1 °C, while the relative humidity ranged from 46.6% to 79.7%. The different forms of the three sites have led to distinct wind speed and solar radiation levels. With its wide-open form, the grand lawn had the highest mean wind speed of 0.9 m/s and mean global radiation of 239 W/m2, followed by the lakeside lawn (0.4 m/s and 232.4 W/m2). The shaded place had compact surroundings, so the mean wind speed was only 0.2 m/s and the mean global radiation was 100.2 W/m2.

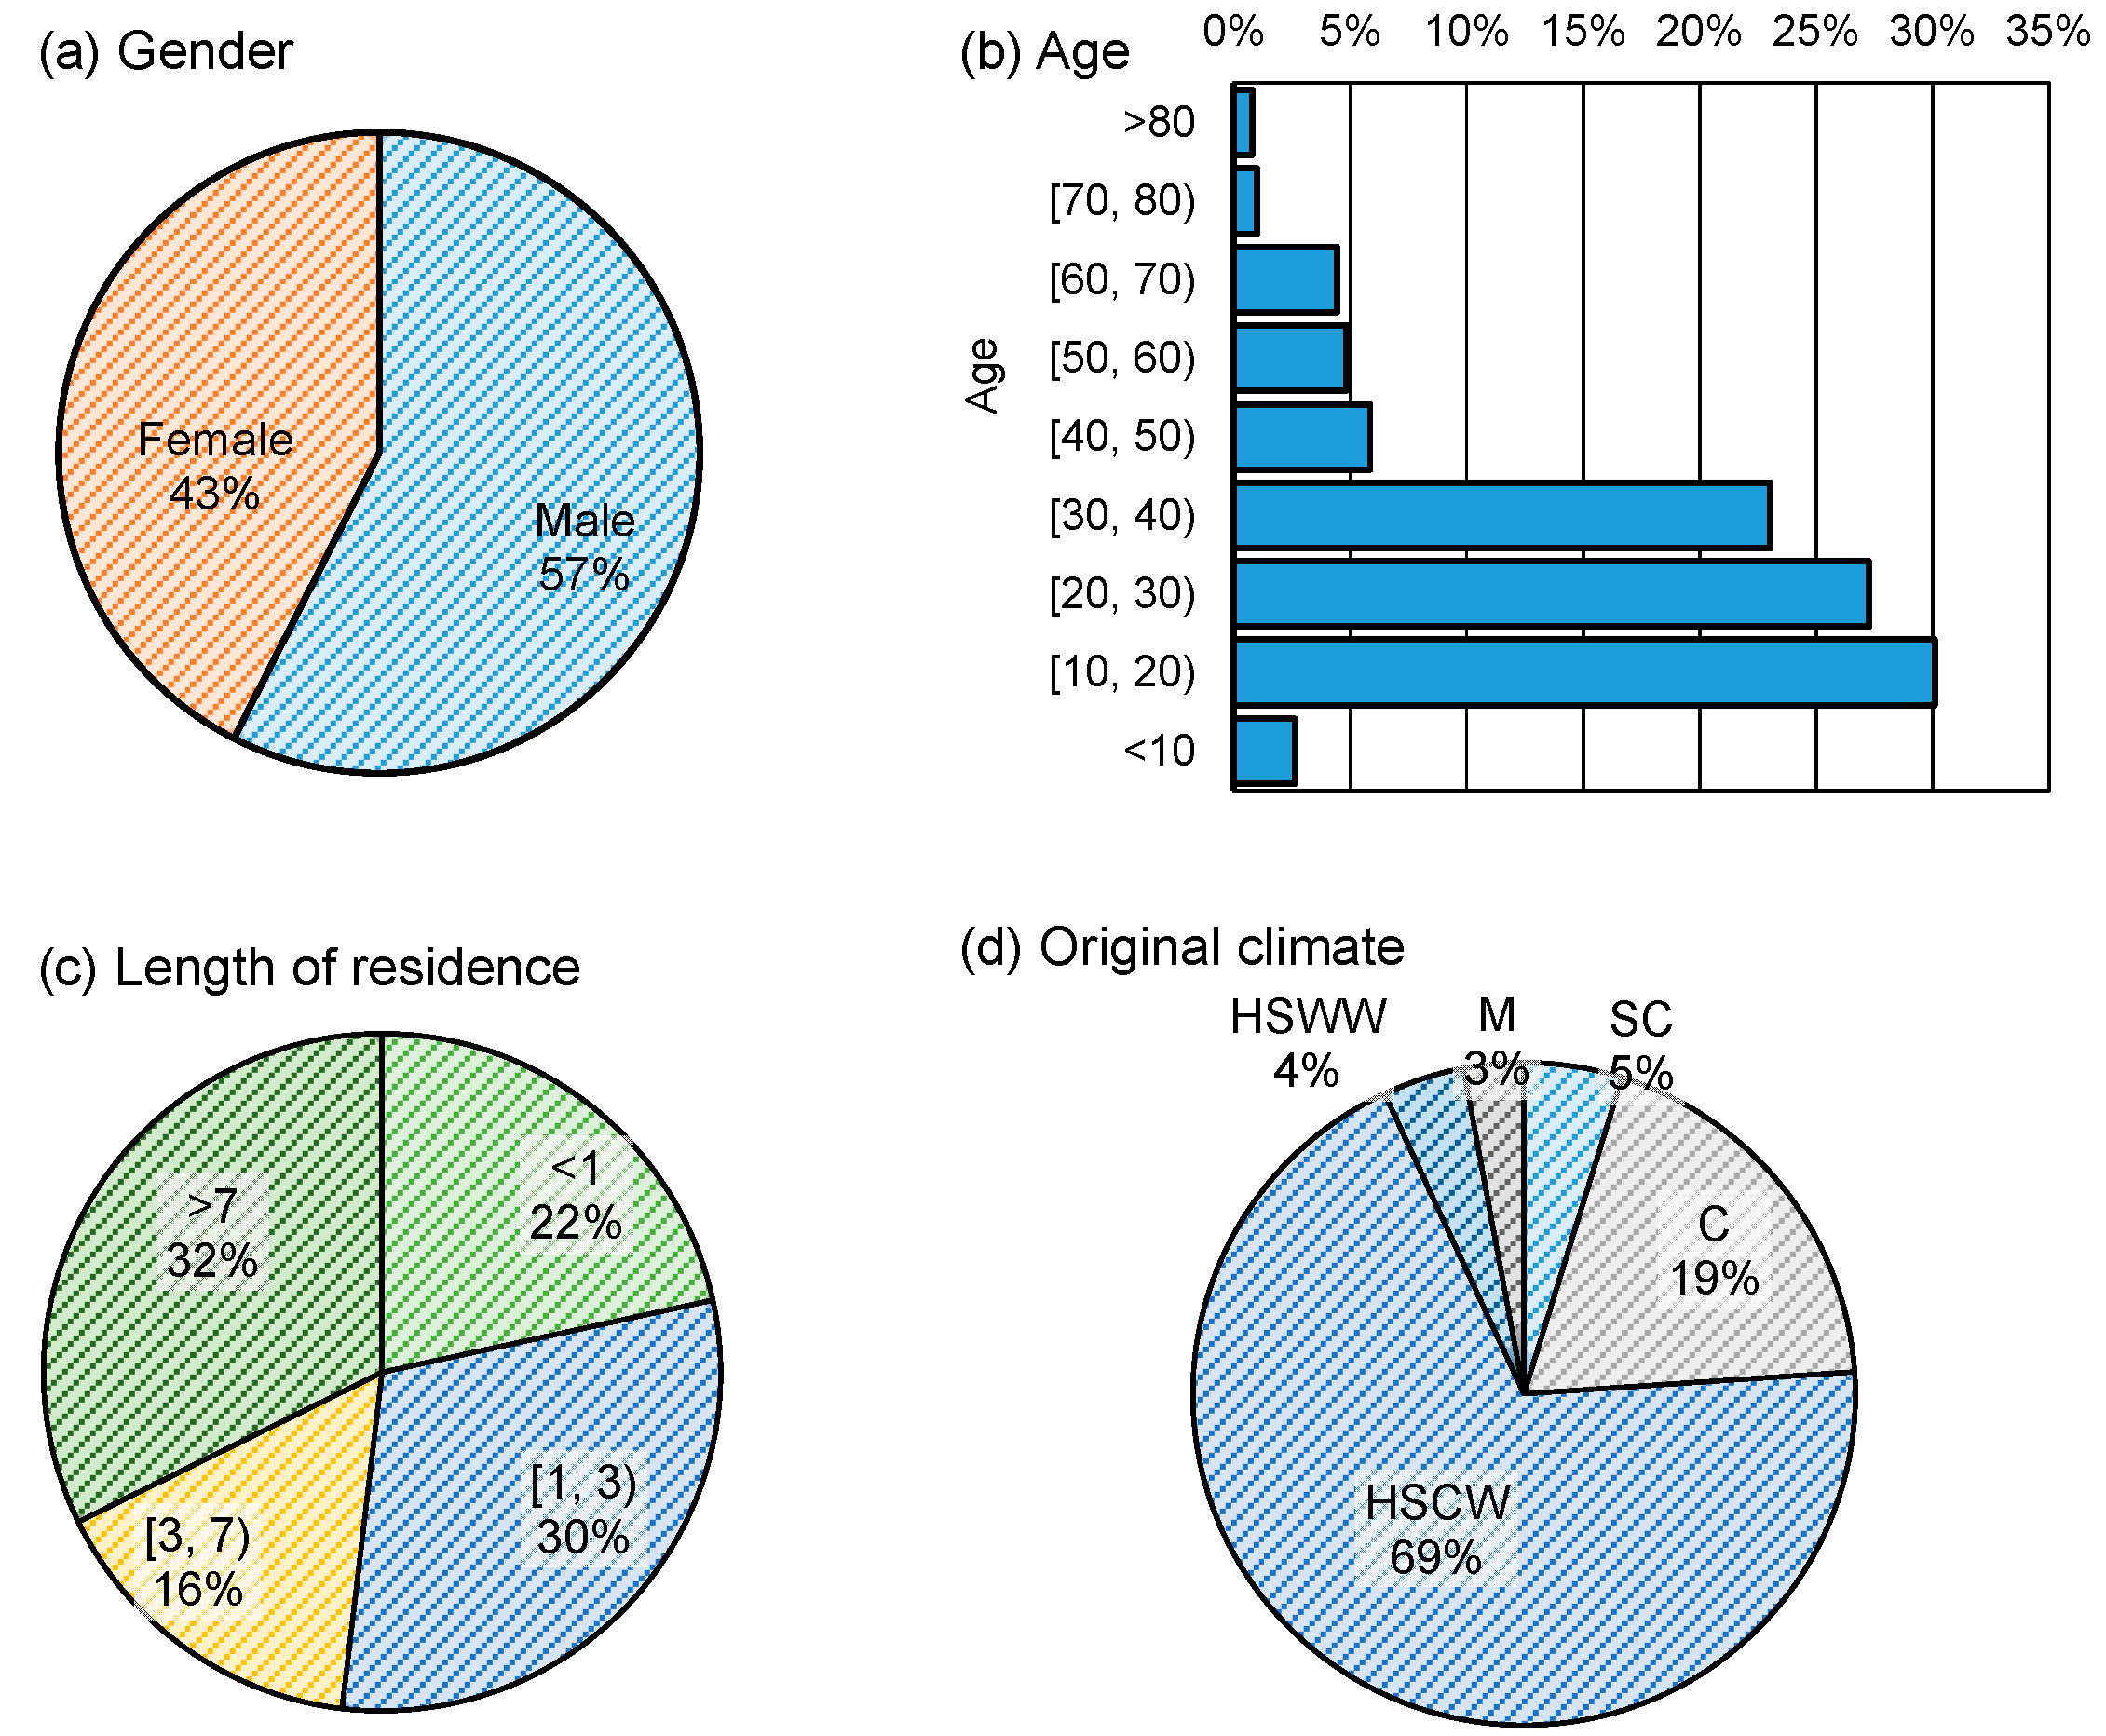
3.2. Demographics of the Interviewees

Because the major objective of this study is to understand the influence of personal factors and long-term thermal history on outdoor thermal comfort, we summarized the gender, age, length of residence, and hometown climate of the respondents in Figure 4. According to the survey results, our interviewees consisted of more males (57%) than females (43%). Figure 4b shows that the age of the respondents was concentrated in the range of 10 to 40. The residence length was more evenly distributed than age; Figure 4c shows that 22%, 30%, 16%, and 32% of the interviewees have lived in Shanghai for less than 1 year, 1 to 3 years, 3 to 7 years, and more than 7 years, respectively. The climate of the hometown of the respondents was classified into severe cold (SC), cold (C), hot summer and cold winter (HSCW), hot summer and warm winter (HSWW), and mild (M) based on average air temperatures in the coldest and hottest months of the year [43], as shown in Figure 1. It is noteworthy that Shanghai was categorized as a HSCW climate. The distribution of hometown climate was uneven, with 69% of the respondents coming from a HSCW region. C regions accounted for 19% of respondents, but the other three climate zones represented a share of less than 5%.

3.3. General Description of Thermal Comfort

In Figure 5, we first provide an overall picture of our survey results by demonstrating the distributions of the perception vote, including the thermal sensation vote (TSV), the humidity sensation vote (HSV), the sun sensation vote (SSV), and the wind sensation vote (WSV). The “neutral” perception accounted for the highest proportion among all scales for all four microclimatic variables. The distributions of the perception votes followed a normal distribution except for the TSV. For the TSV, the “hot” vote accounted for 15% of responses. The humidity sensation vote was slightly skewed to the “damp” side, which reflected the natural humidity of Shanghai’s climate.
Figure 6 shows the distributions of the preferences for air temperature, humidity, solar radiation, and wind speed. Most participants voted for the “unchange” option for the four microclimatic parameters, showing a generally high acceptance of the outdoor thermal environment during our survey. Figure 6 also demonstrates that the general climate was warm because the percentages of respondents who wanted the air temperature, humidity, and solar radiation to be “lower” were larger than the percentages of the “higher” vote, and the wind speed had a reversed trend. The result of preference vote distributions agreed with the climate measured during the survey (Table 2).
Figure 7 demonstrates the distribution of overall comfort. Overall, 57% of the respondents indicated that they felt comfortable. Only 1%, 3%, and 8% of them regarded the outdoor thermal environment as intolerable, very uncomfortable, or uncomfortable, respectively.
Figure 8 examines the overall comfort rating at different thermal sensation levels. Due to the insufficient “cold” vote (N = 3), this level was excluded from the analysis. We have assigned numerical values 1 to 5 to intolerable, very uncomfortable, uncomfortable, slightly uncomfortable, and comfortable, respectively. A higher score indicates higher overall comfort perception. A decrease in overall comfort was observed from “neutral” to “hot”. However, it is interesting to find that “cool”, “slightly cool” and “neutral” thermal sensations had similar overall comfort ratings. This is because our survey was conducted in mild-to-hot seasons, and previous studies [44,45] have shown that, in hot seasons, people perceived “cool” sensations as more comfortable than “warm” ones.

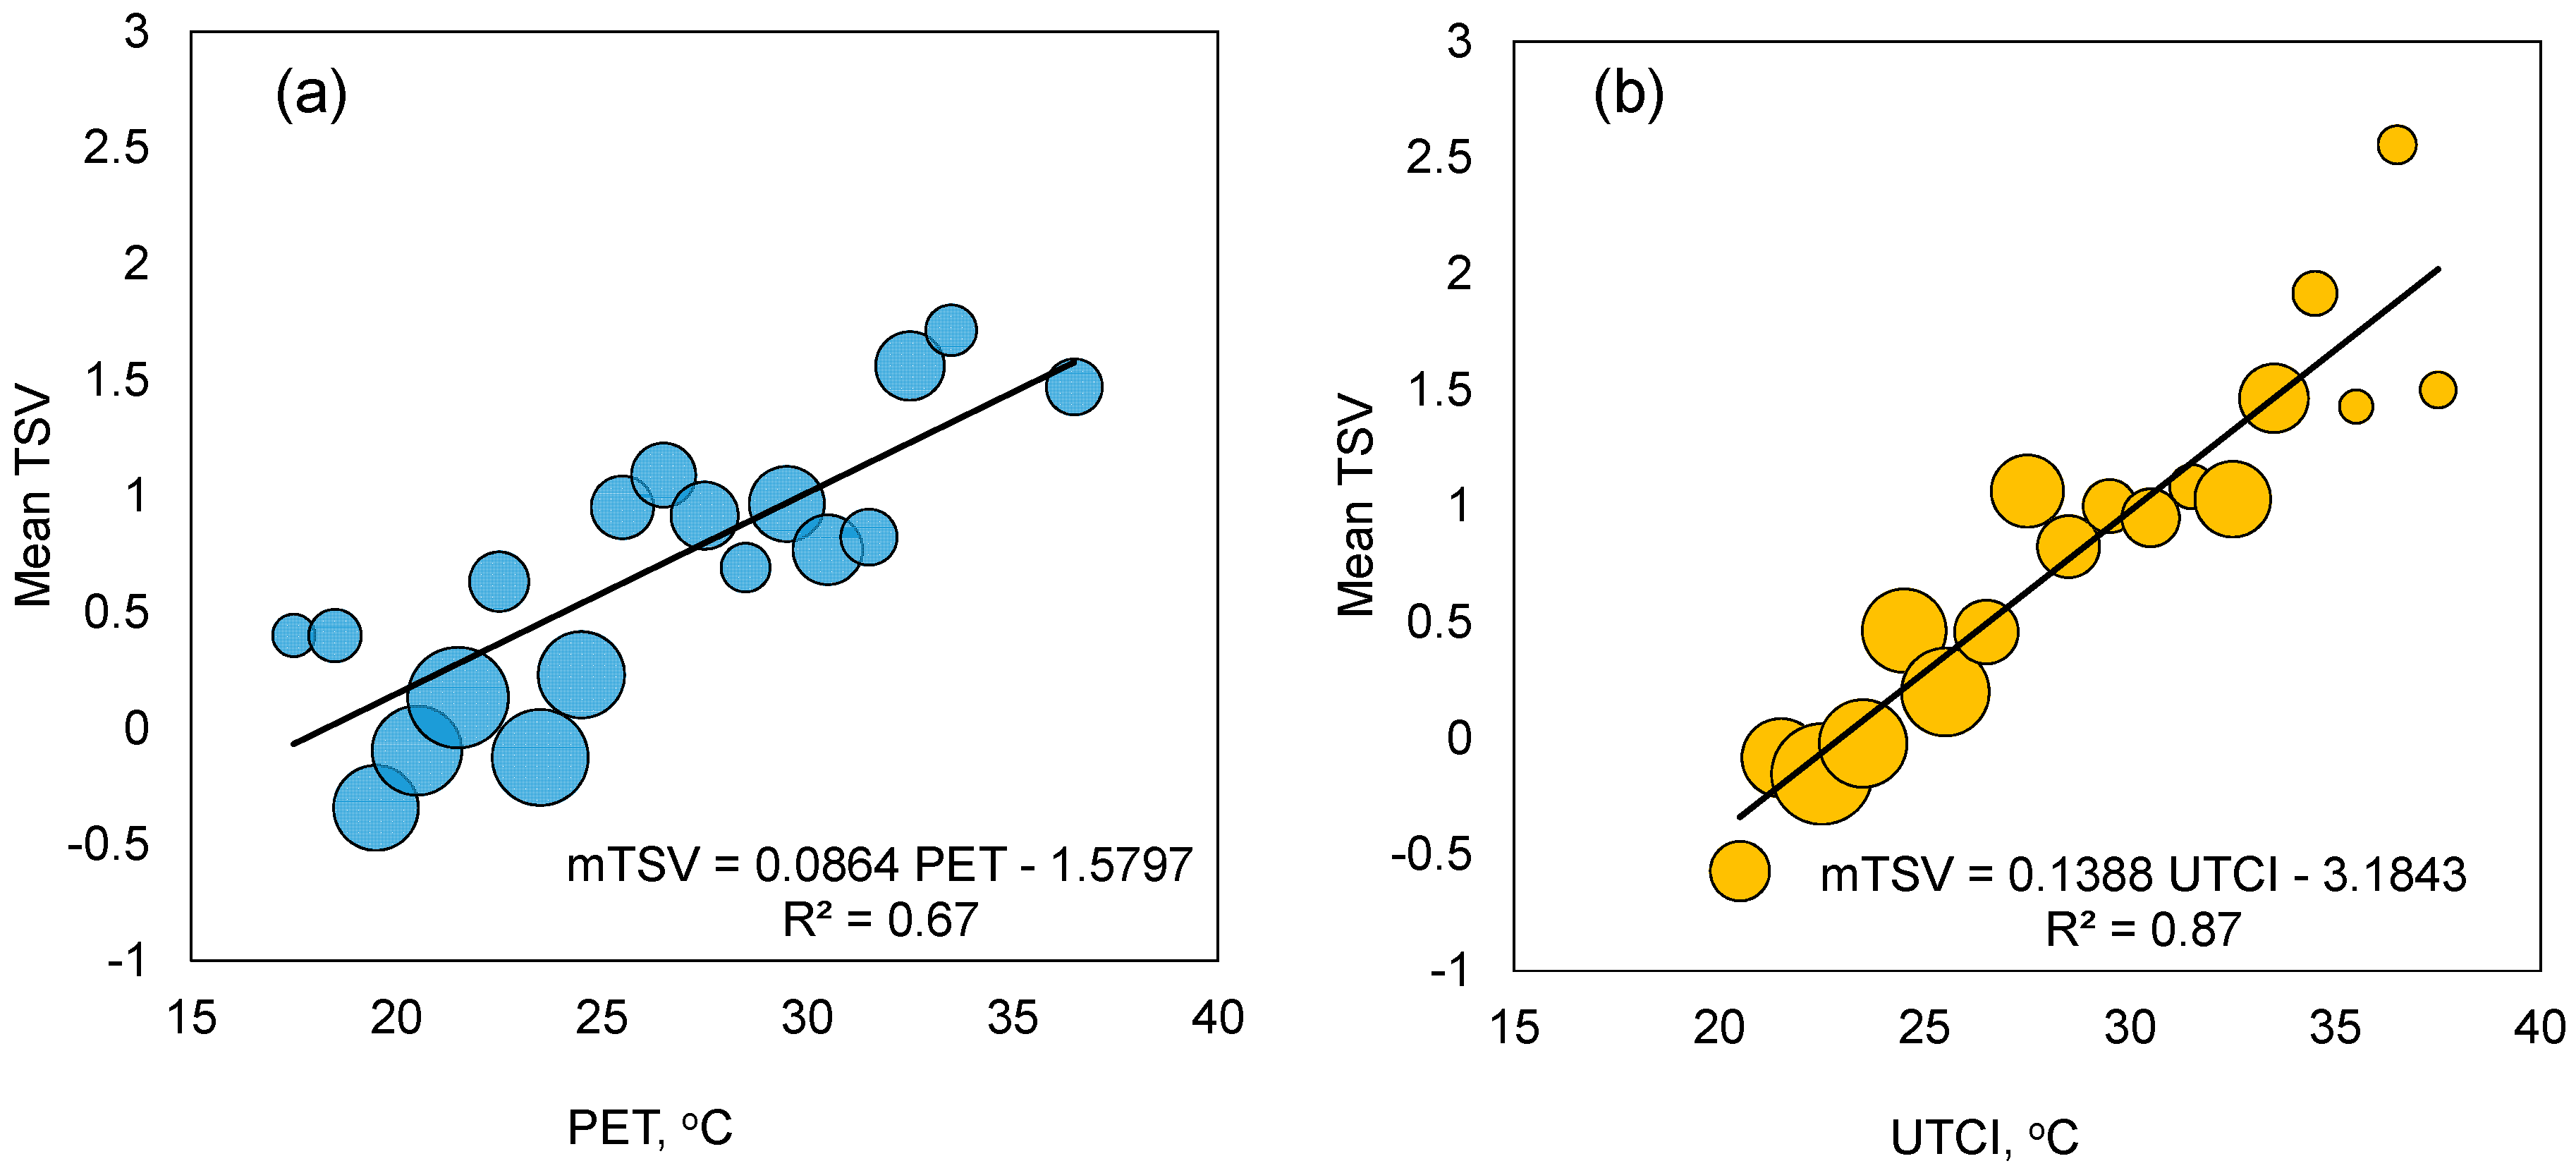
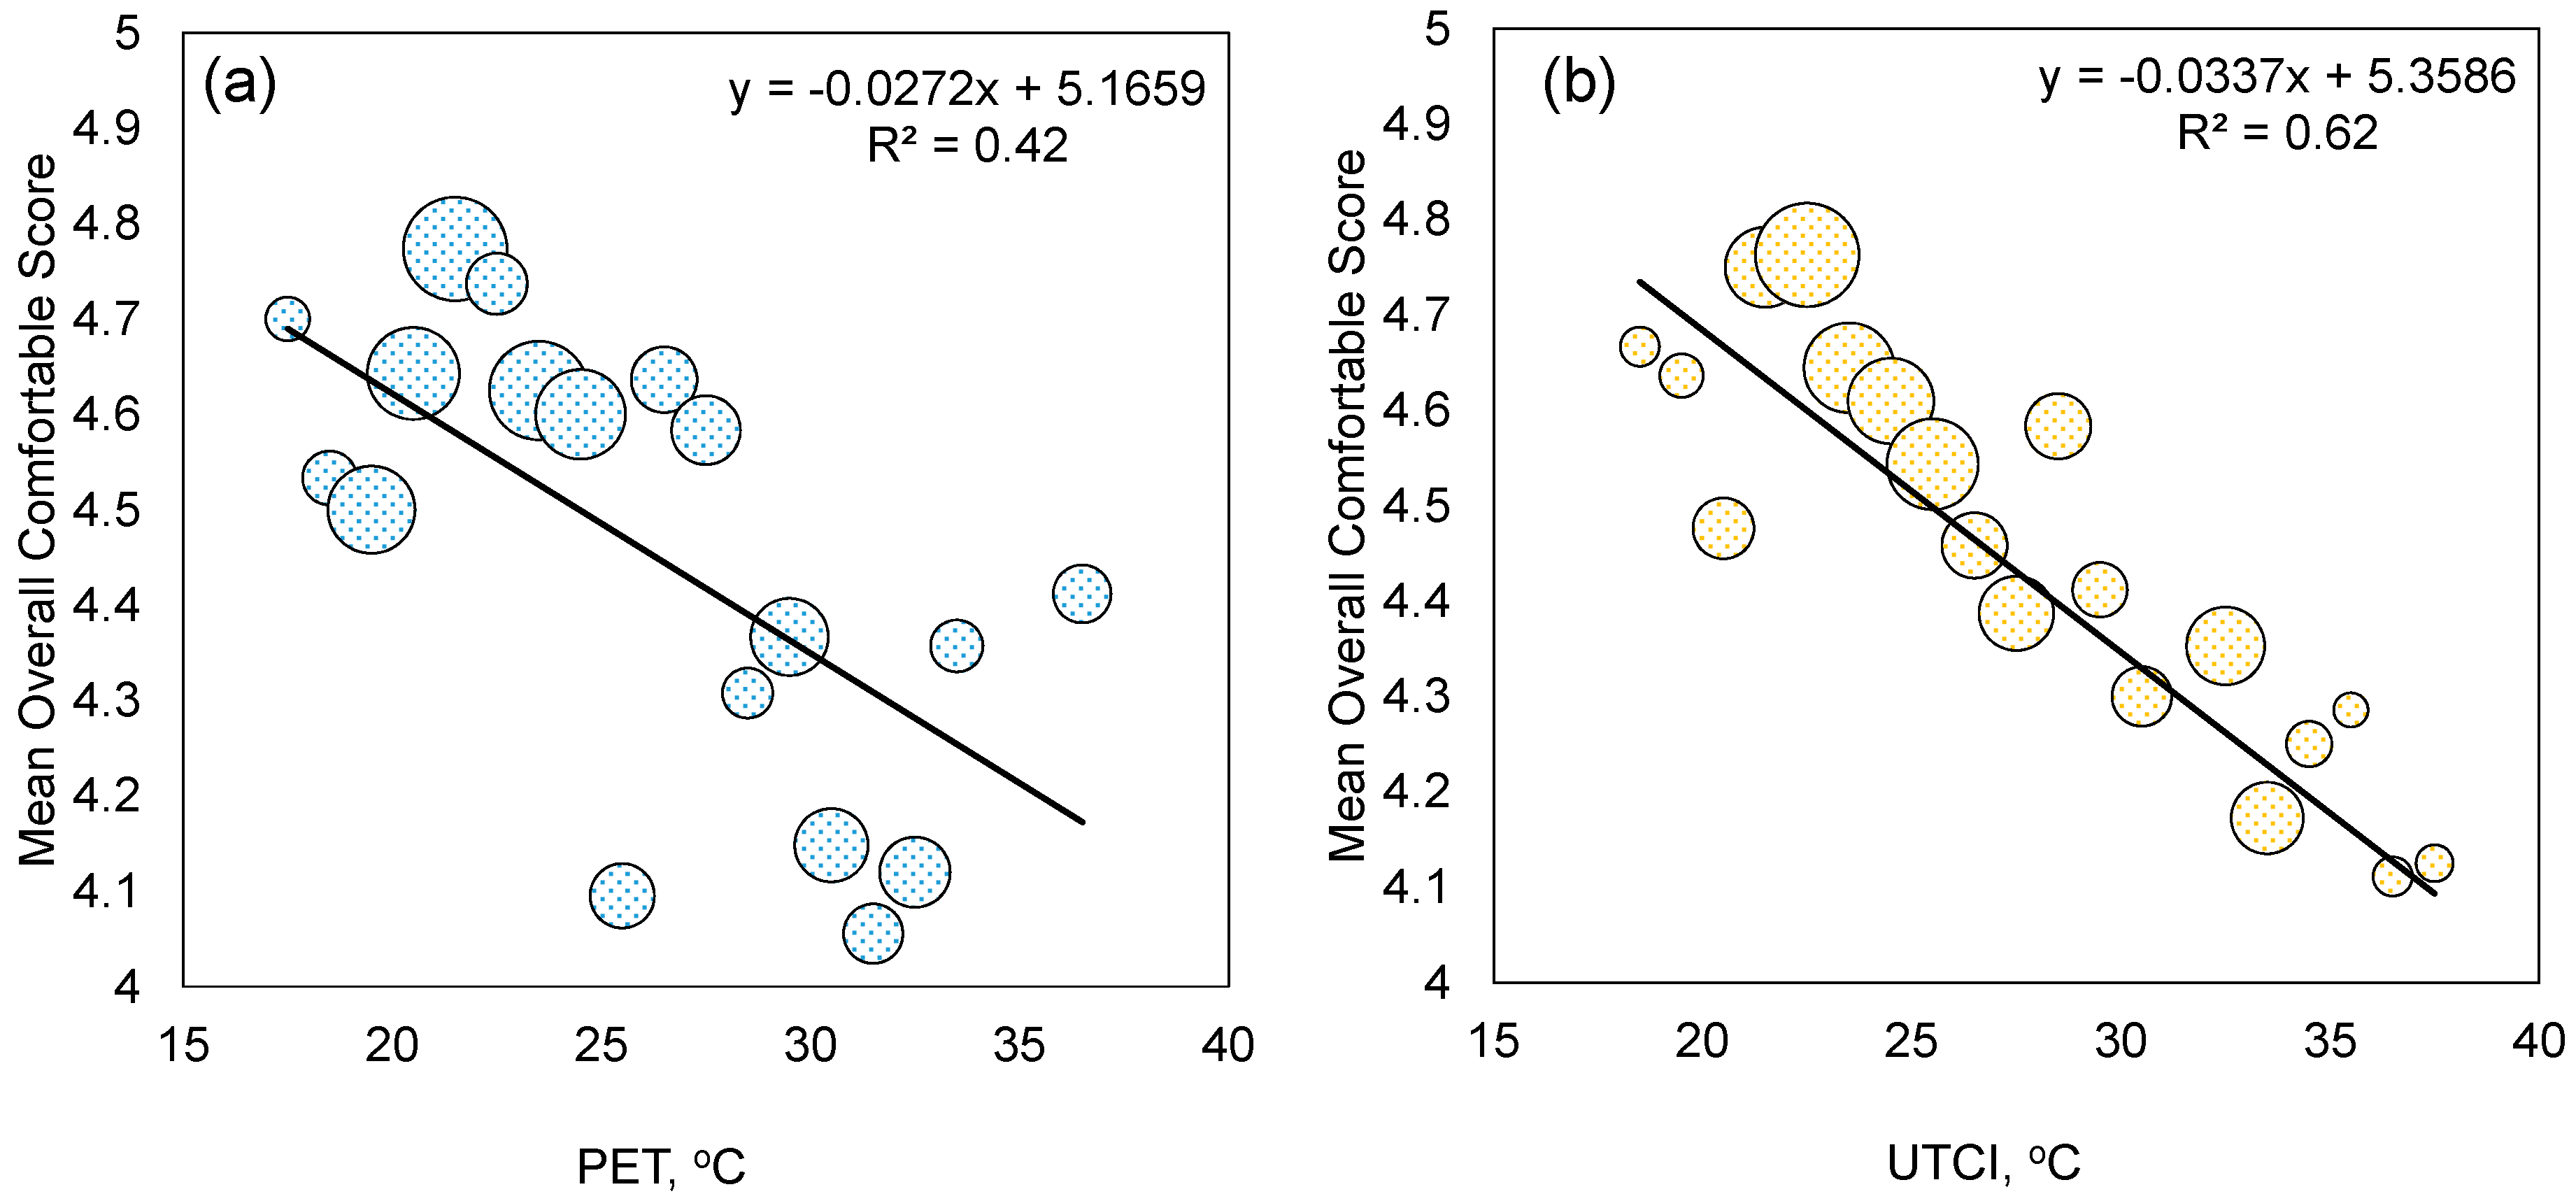
3.4. Correlations between Perceptions and Thermal Indices (PET and UTCI)

Our study has calculated the PET and UTCI values for each observation obtained during the field survey and used the “bin method” [46] to calculate the mean thermal sensation for every 1 K PET or UTCI interval, and the results are plotted in Figure 9 with linear regression applied.
From the R2 values, it can be seen that UTCI provided a better correlation with the mean TSV than PET did. It is not surprising to see that thermal sensation became greater at higher thermal indices. In addition, the slopes for the PET and UTCI regression equations were 0.0864 and 0.1388, which correspond to 11.6 PET/TSV and 7.2 UTCI/TSV, respectively.
Figure 10 depicts the relationships between overall comfort and the thermal indices using a similar method to that applied in Figure 9. People perceived a worse overall comfort as the thermal indices increased. By comparing the values of R2 between Figure 9 and Figure 10, poorer association was found for overall comfort than thermal sensation. The UTCI also showed a better correlation with overall comfort than PET. Due to the similar trend between UTCI and PET and the higher R2 values of UTCI compared to PET, the subsequent analysis used UTCI to further investigate the influences of personal factors and long-term thermal history.

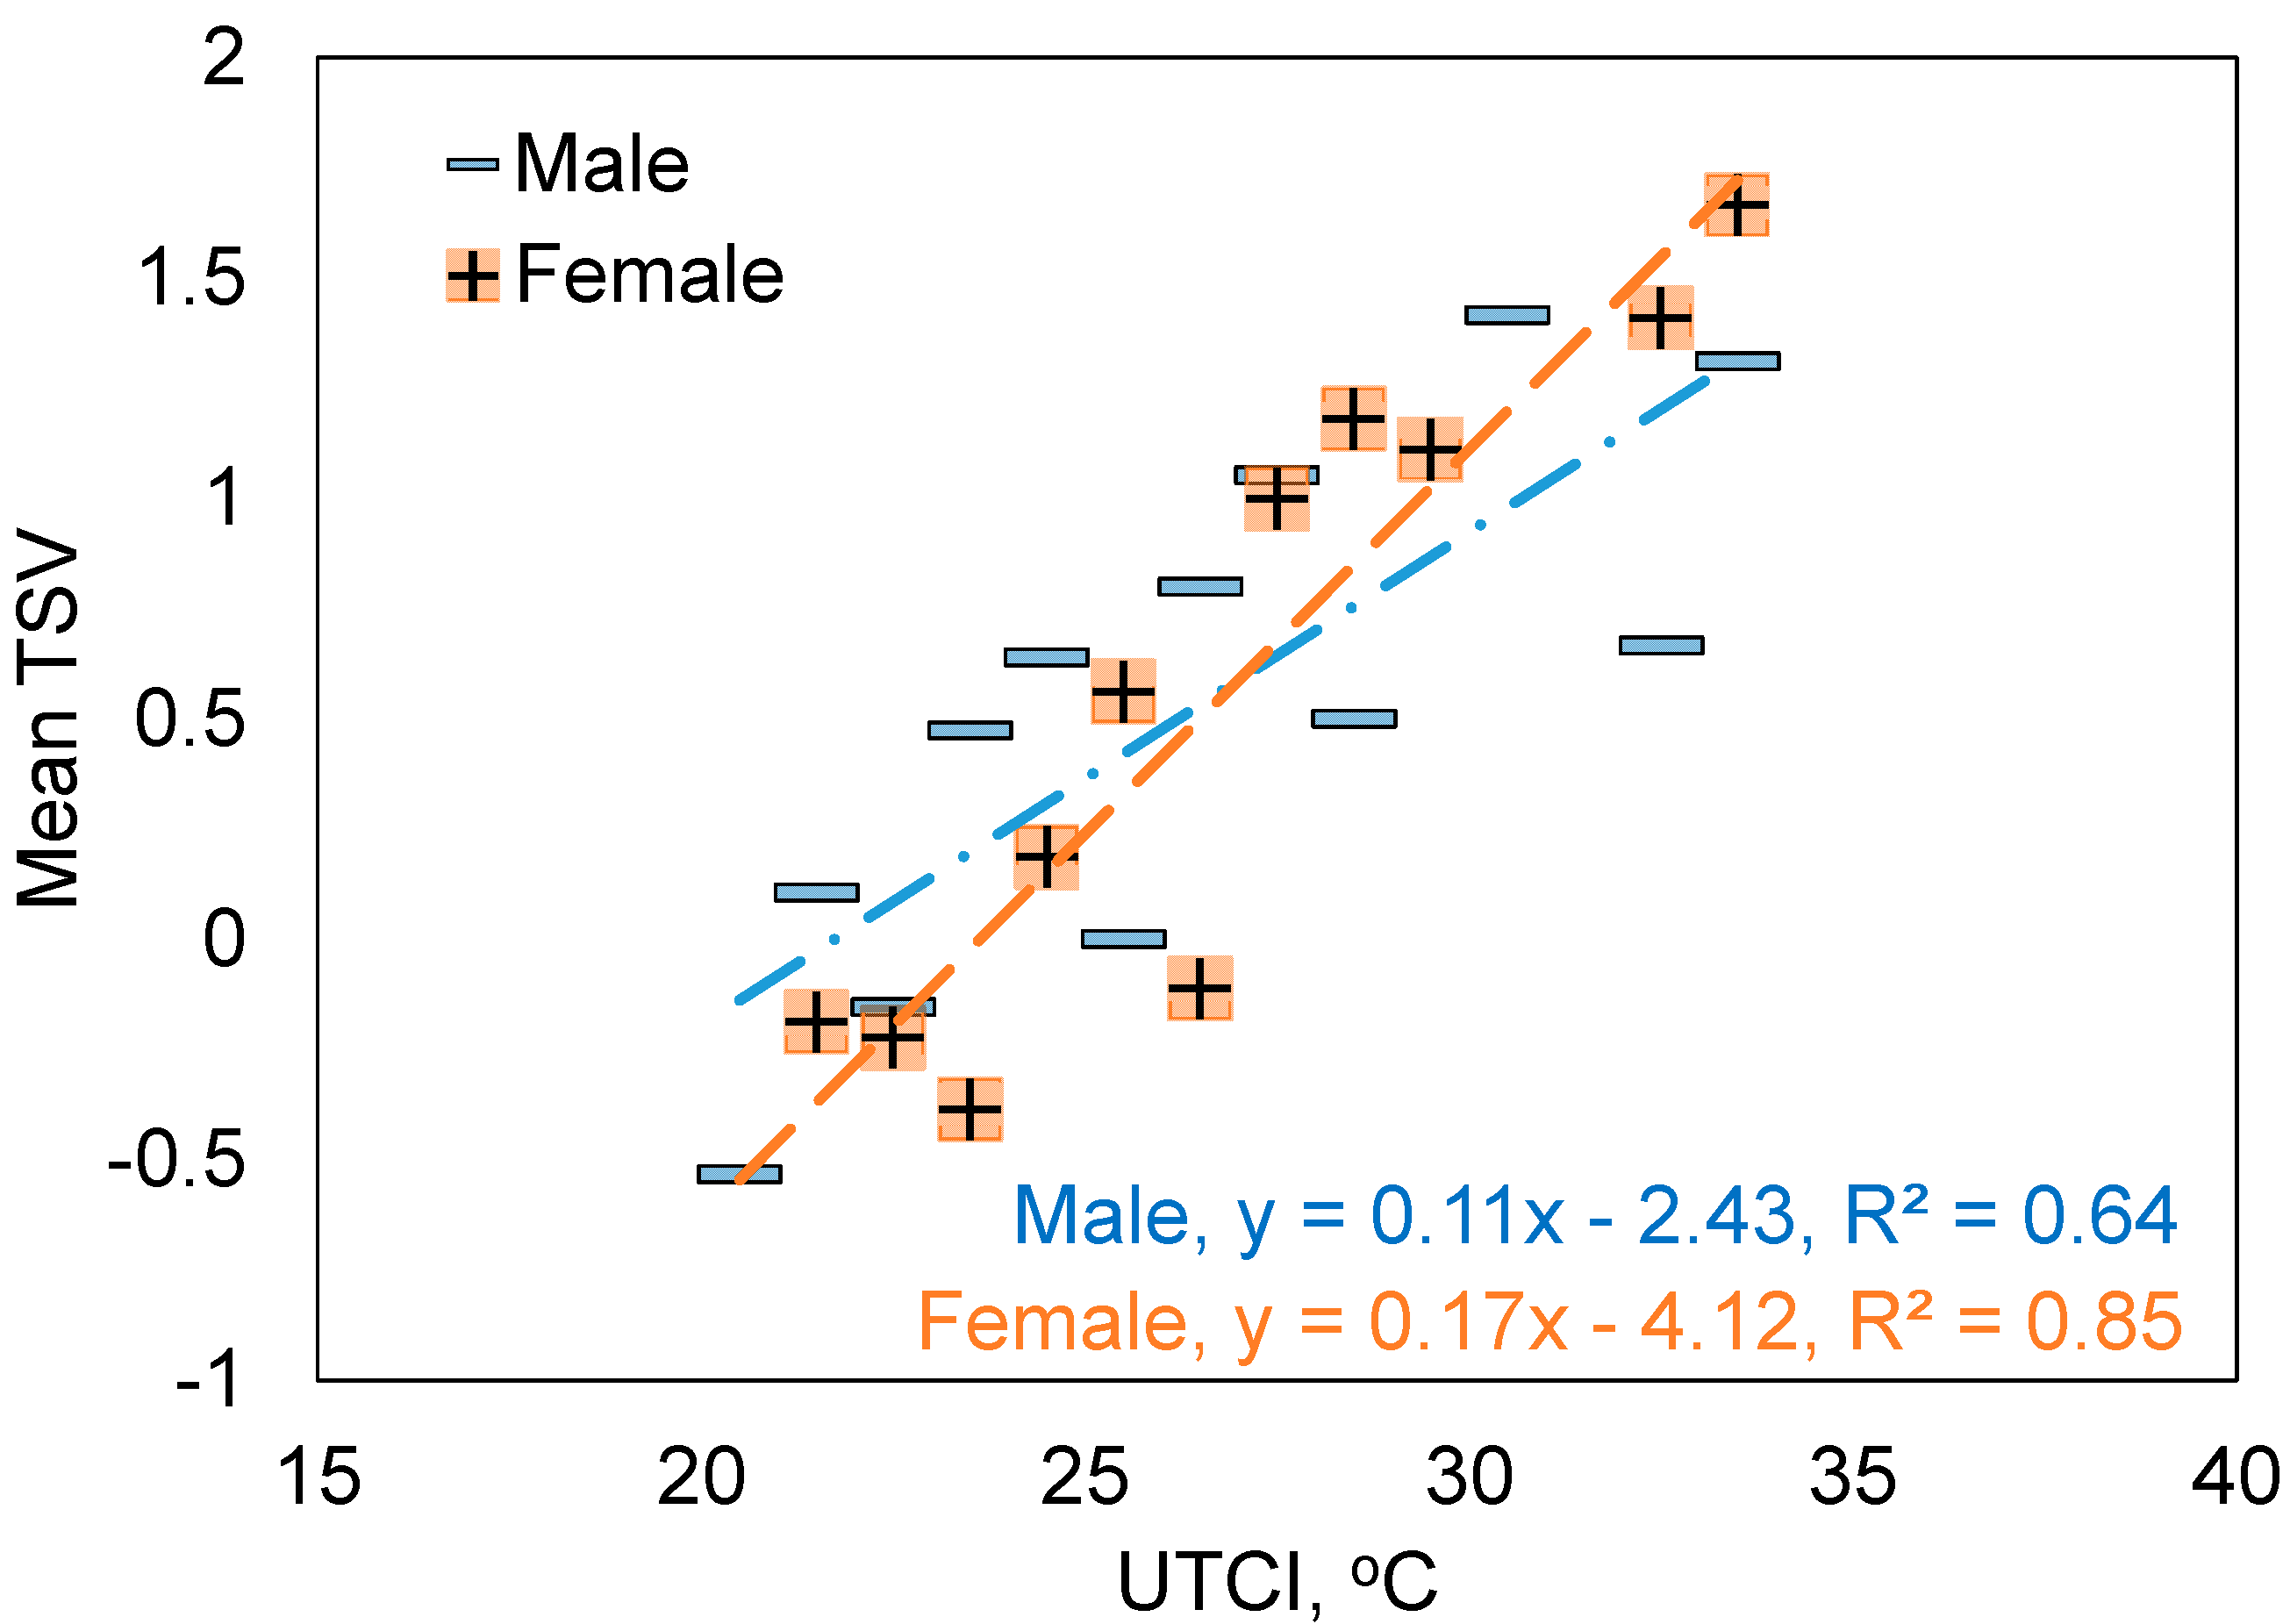
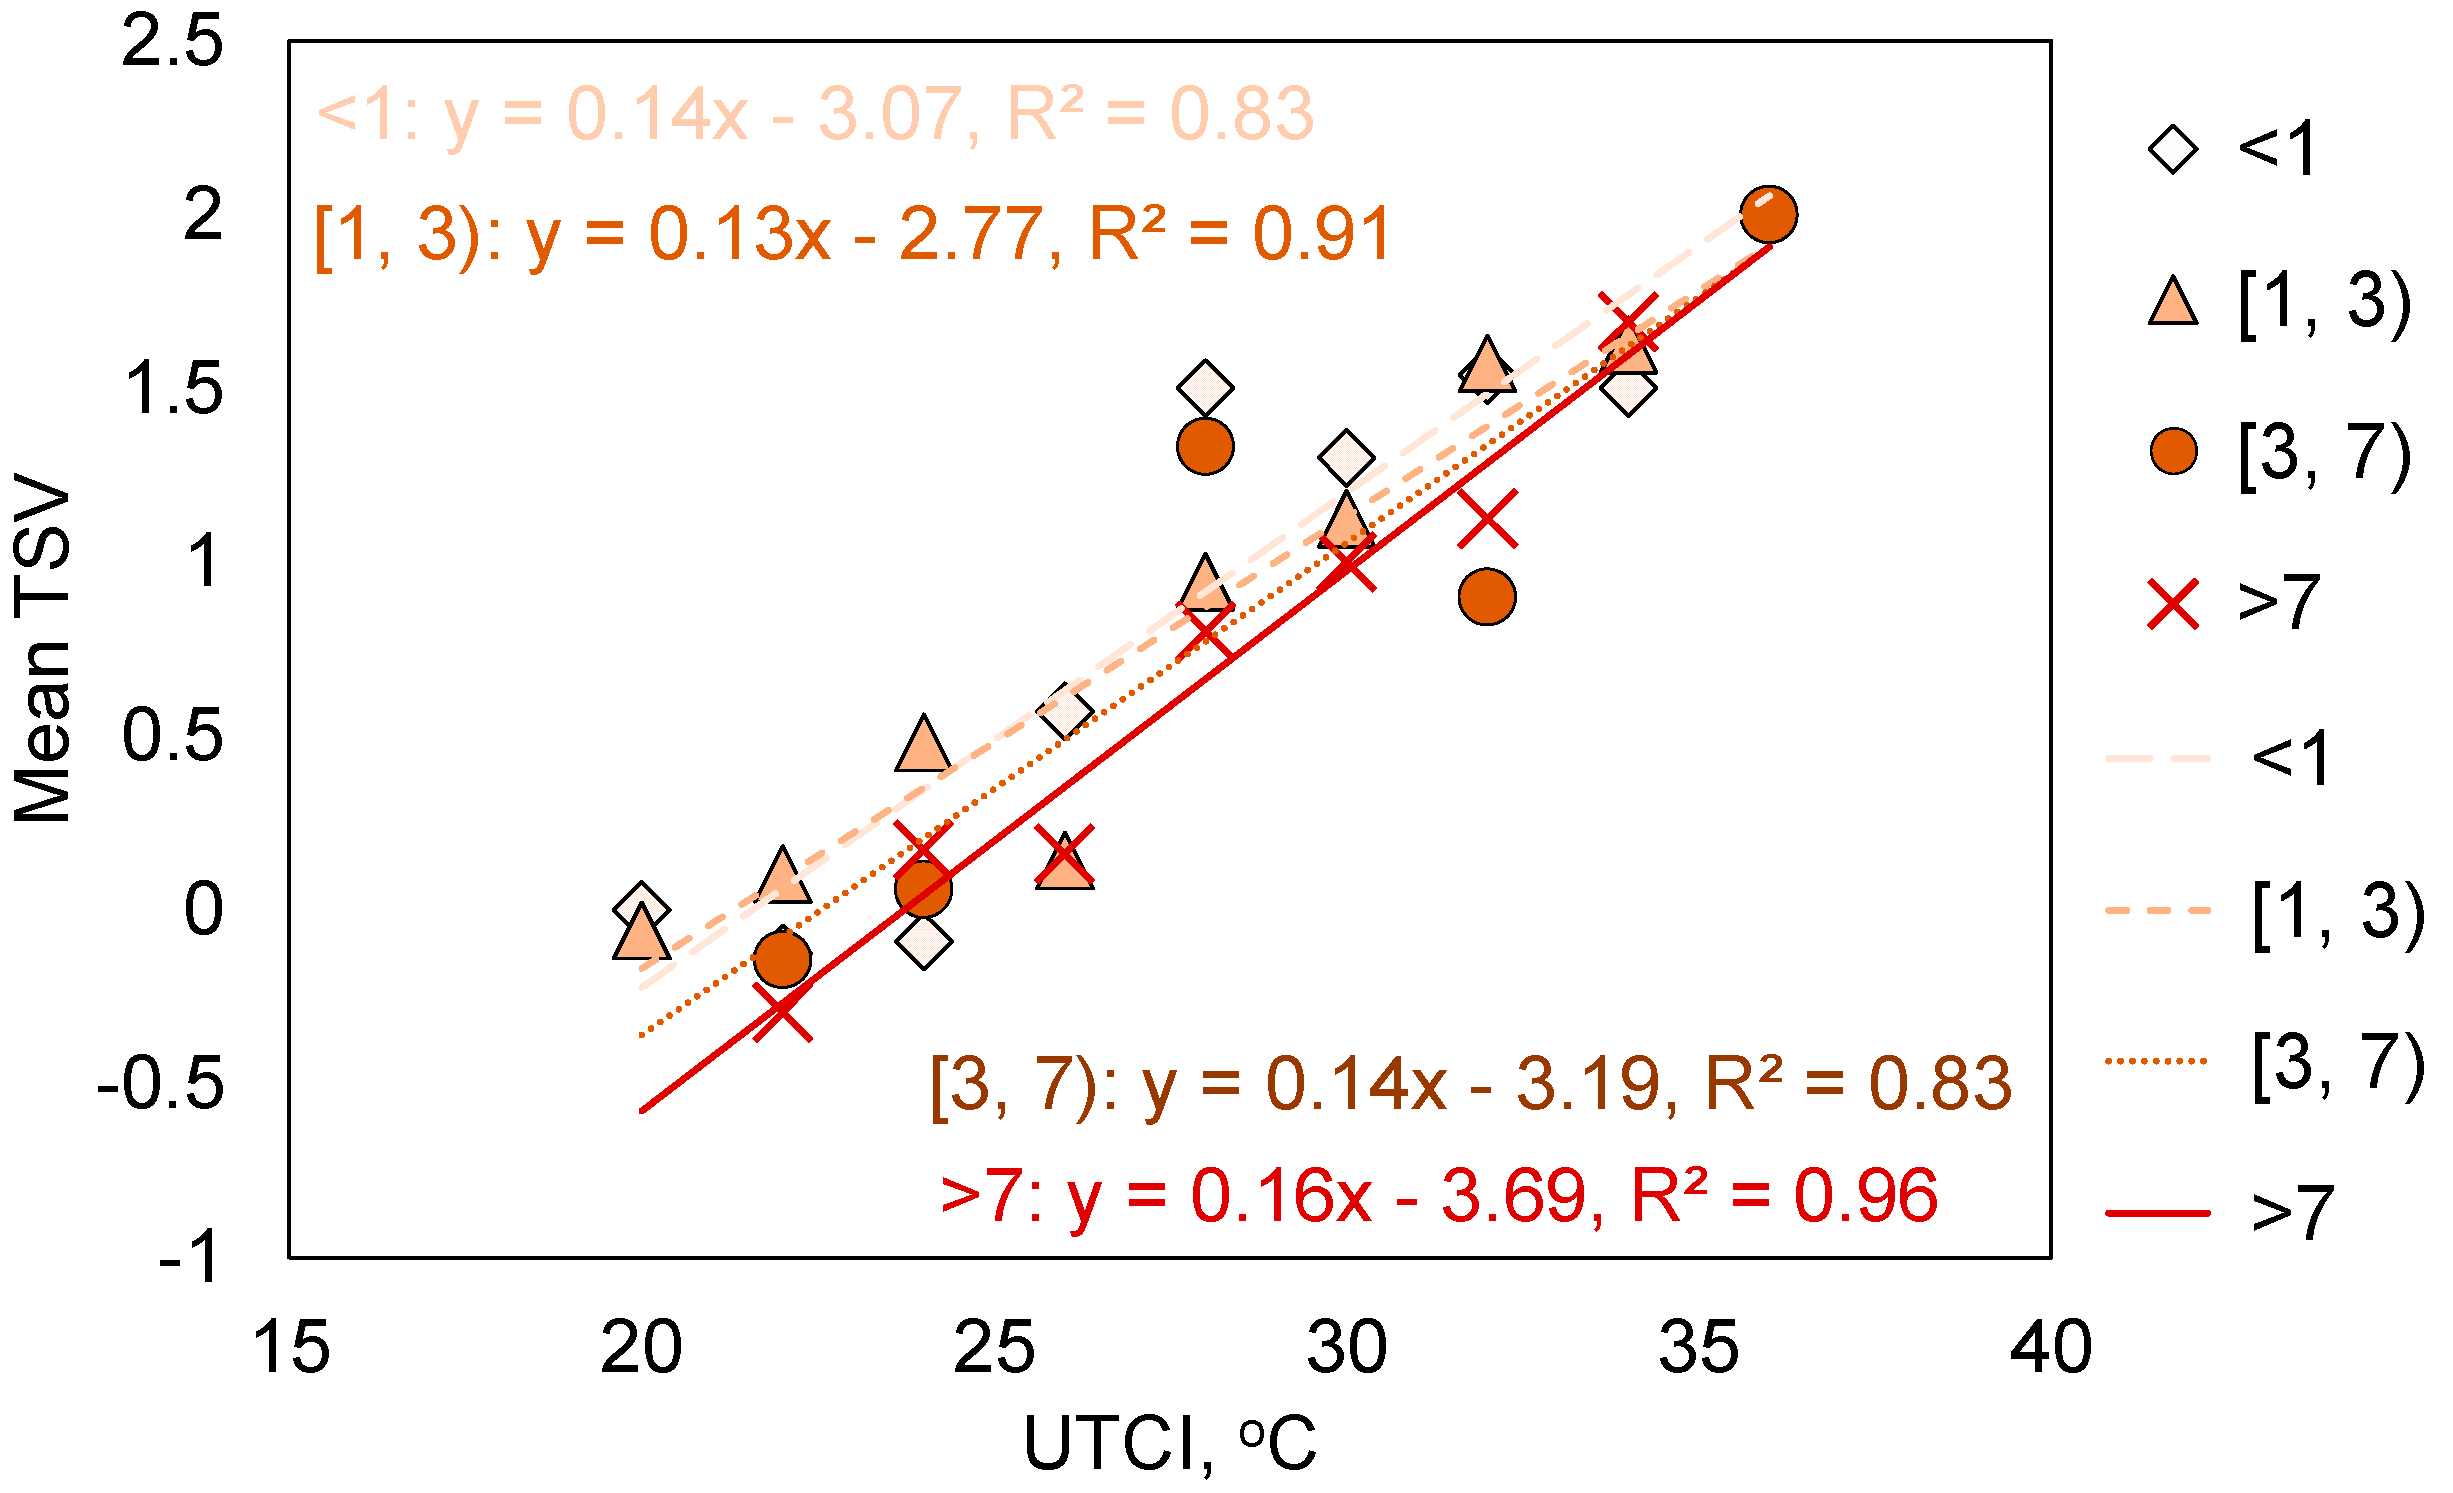
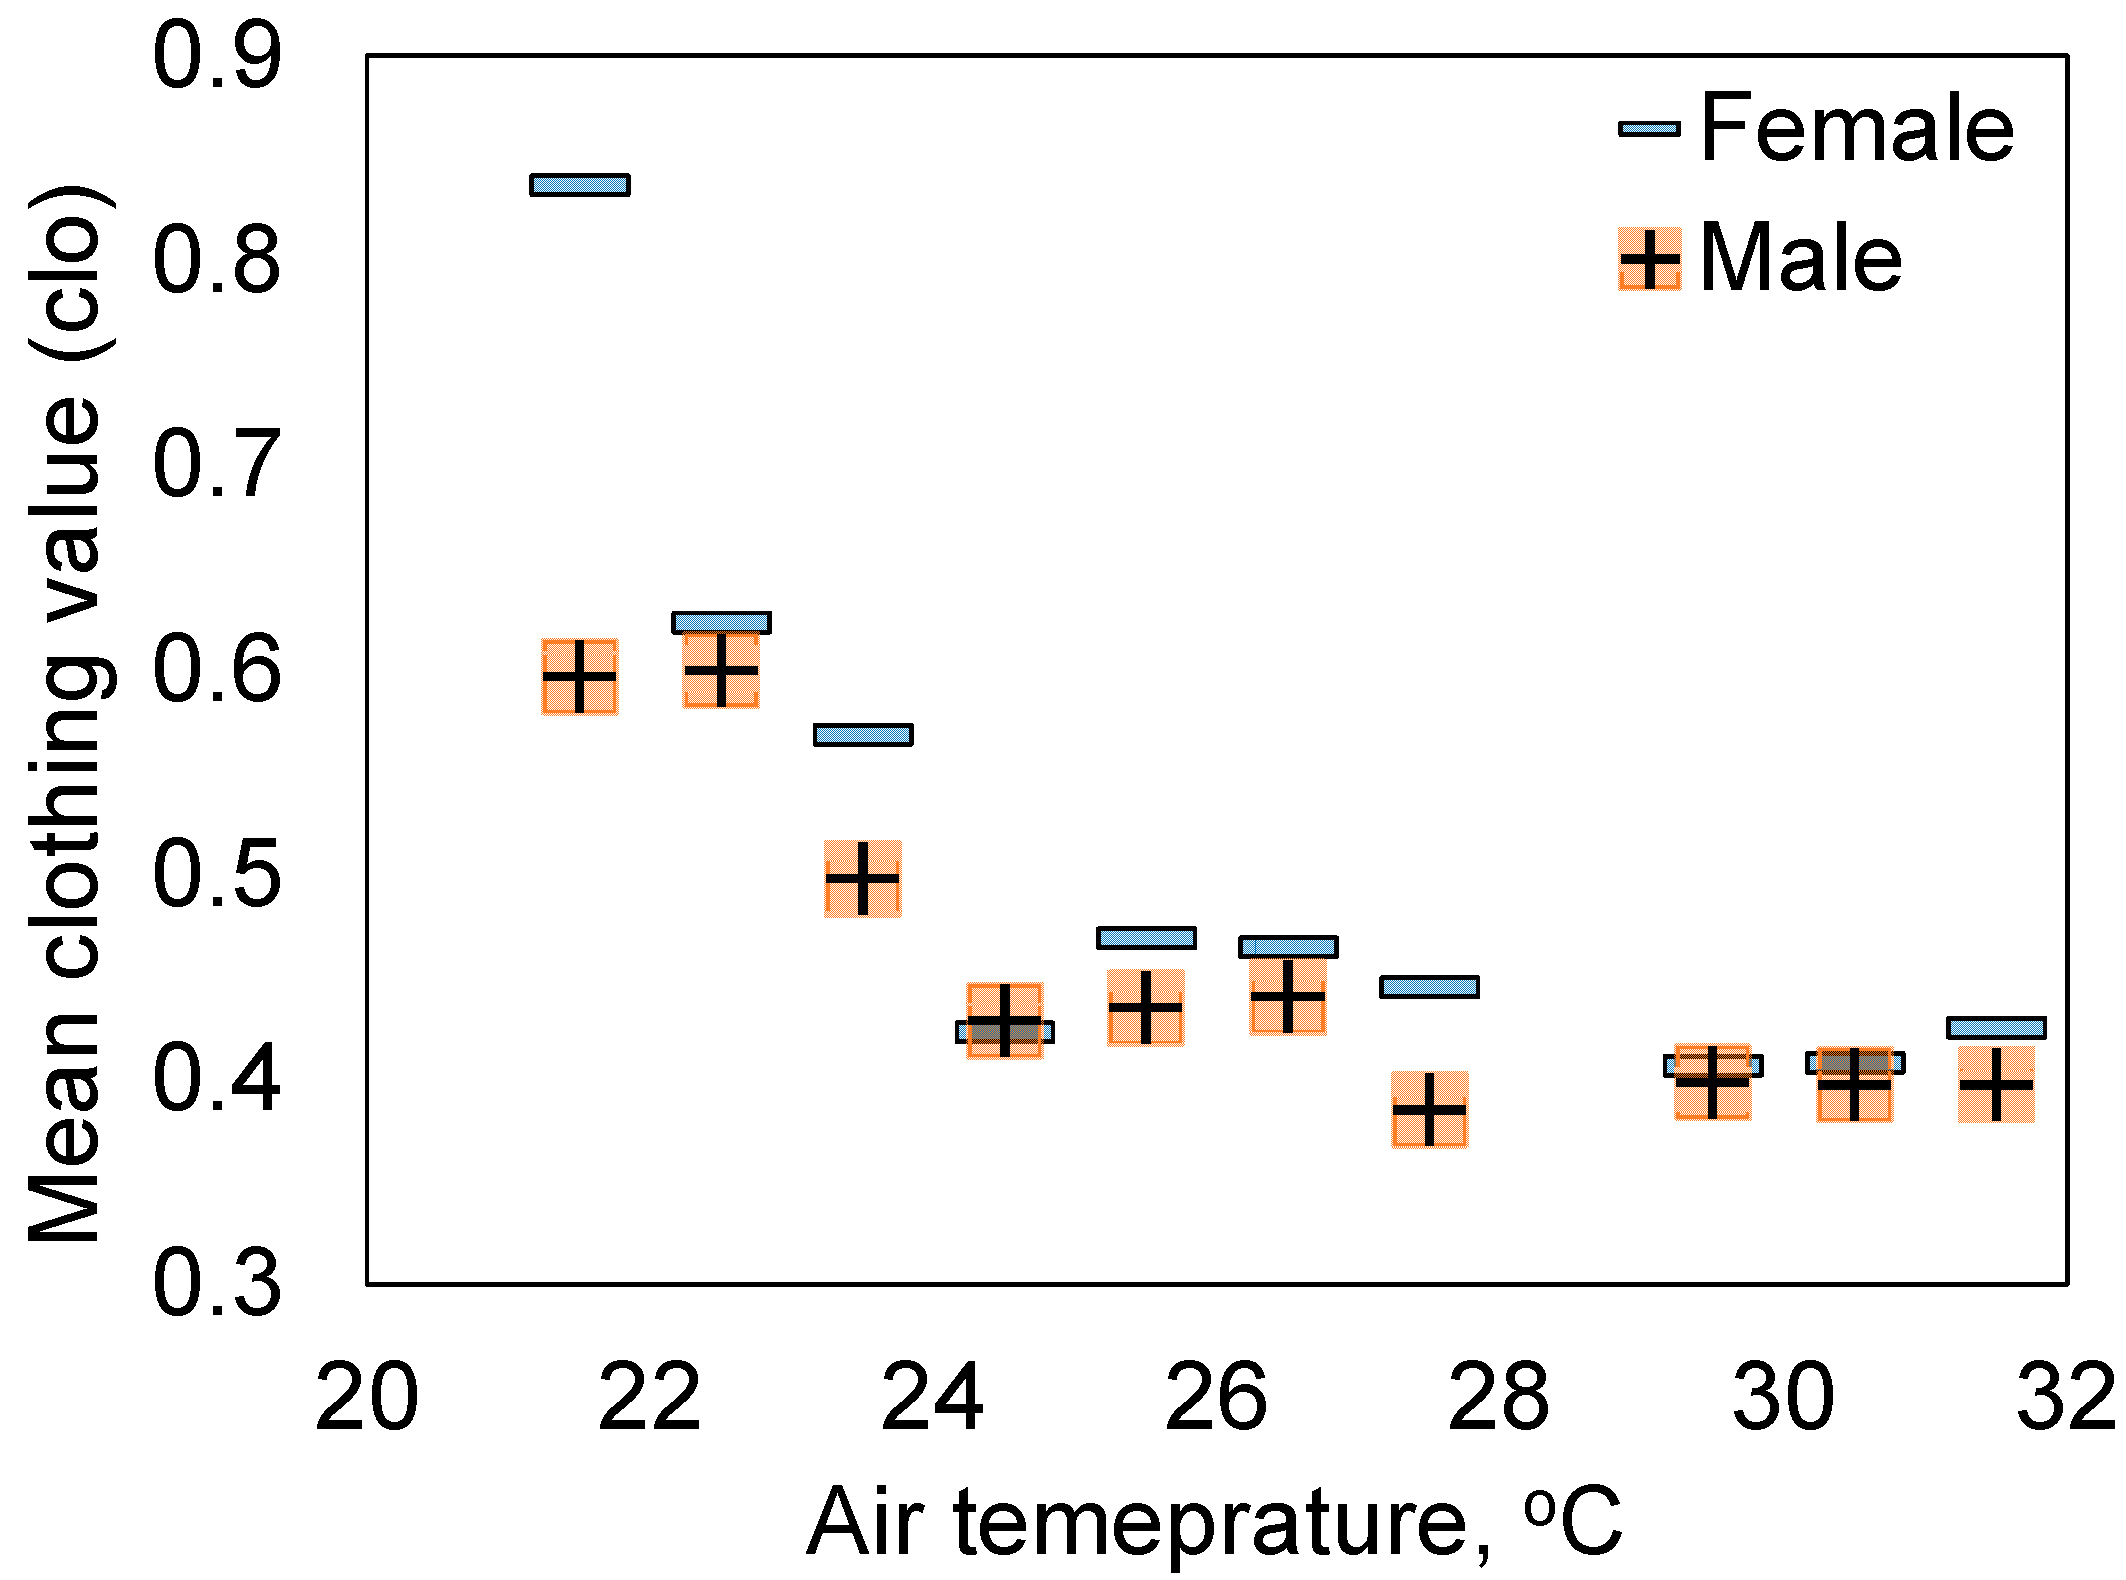
3.5. Influence of Personal Factors

The personal influence was investigated by analyzing the effect of gender and age. Figure 11 uses the “bin method” to plot the mean TSV for every 2-K interval of UTCI for male and female groups. Splitting the data according to gender reduced the number of observations in each data pool. Thus, the 2-K interval was used instead of 1 K to increase the sample size within each interval.
As shown in Figure 11, the slopes for the linearly regressed equations for males and females were 0.11 and 0.17, respectively, showing that males were less thermally sensitive to the outdoor thermal environment than females were the two equations intersect at around 27 °C UTCI. This shows that females in our study felt warmer than males when the UTCI was above 27 °C UTCI, and had a lower TSV than males when UTCI was lower than 27 °C UTCI.
To study the effect of age on outdoor thermal comfort, the dataset was divided into three age groups: younger than 20, from 20 to 50, and older than 50. The “Bin method” was applied to the three age groups, and the mean TSV was calculated for every 2-K interval of UTCI, as shown in Figure 12. Bins with a sample size of less than five were discarded from the analysis. A distinct trend was demonstrated among age groups. While the thermal sensitivity for different groups was similar, notable TSV differences can be found in Figure 12. The <20-years-old age group had the highest thermal sensation while the occupants aged >50 years demonstrated the lowest TSV. It is worth noting that, due to the limited sample size of the elderly age group, the result of the >50 group was concentrated at a lower air temperature region (<26 °C UTCI), and the result may not be representative.

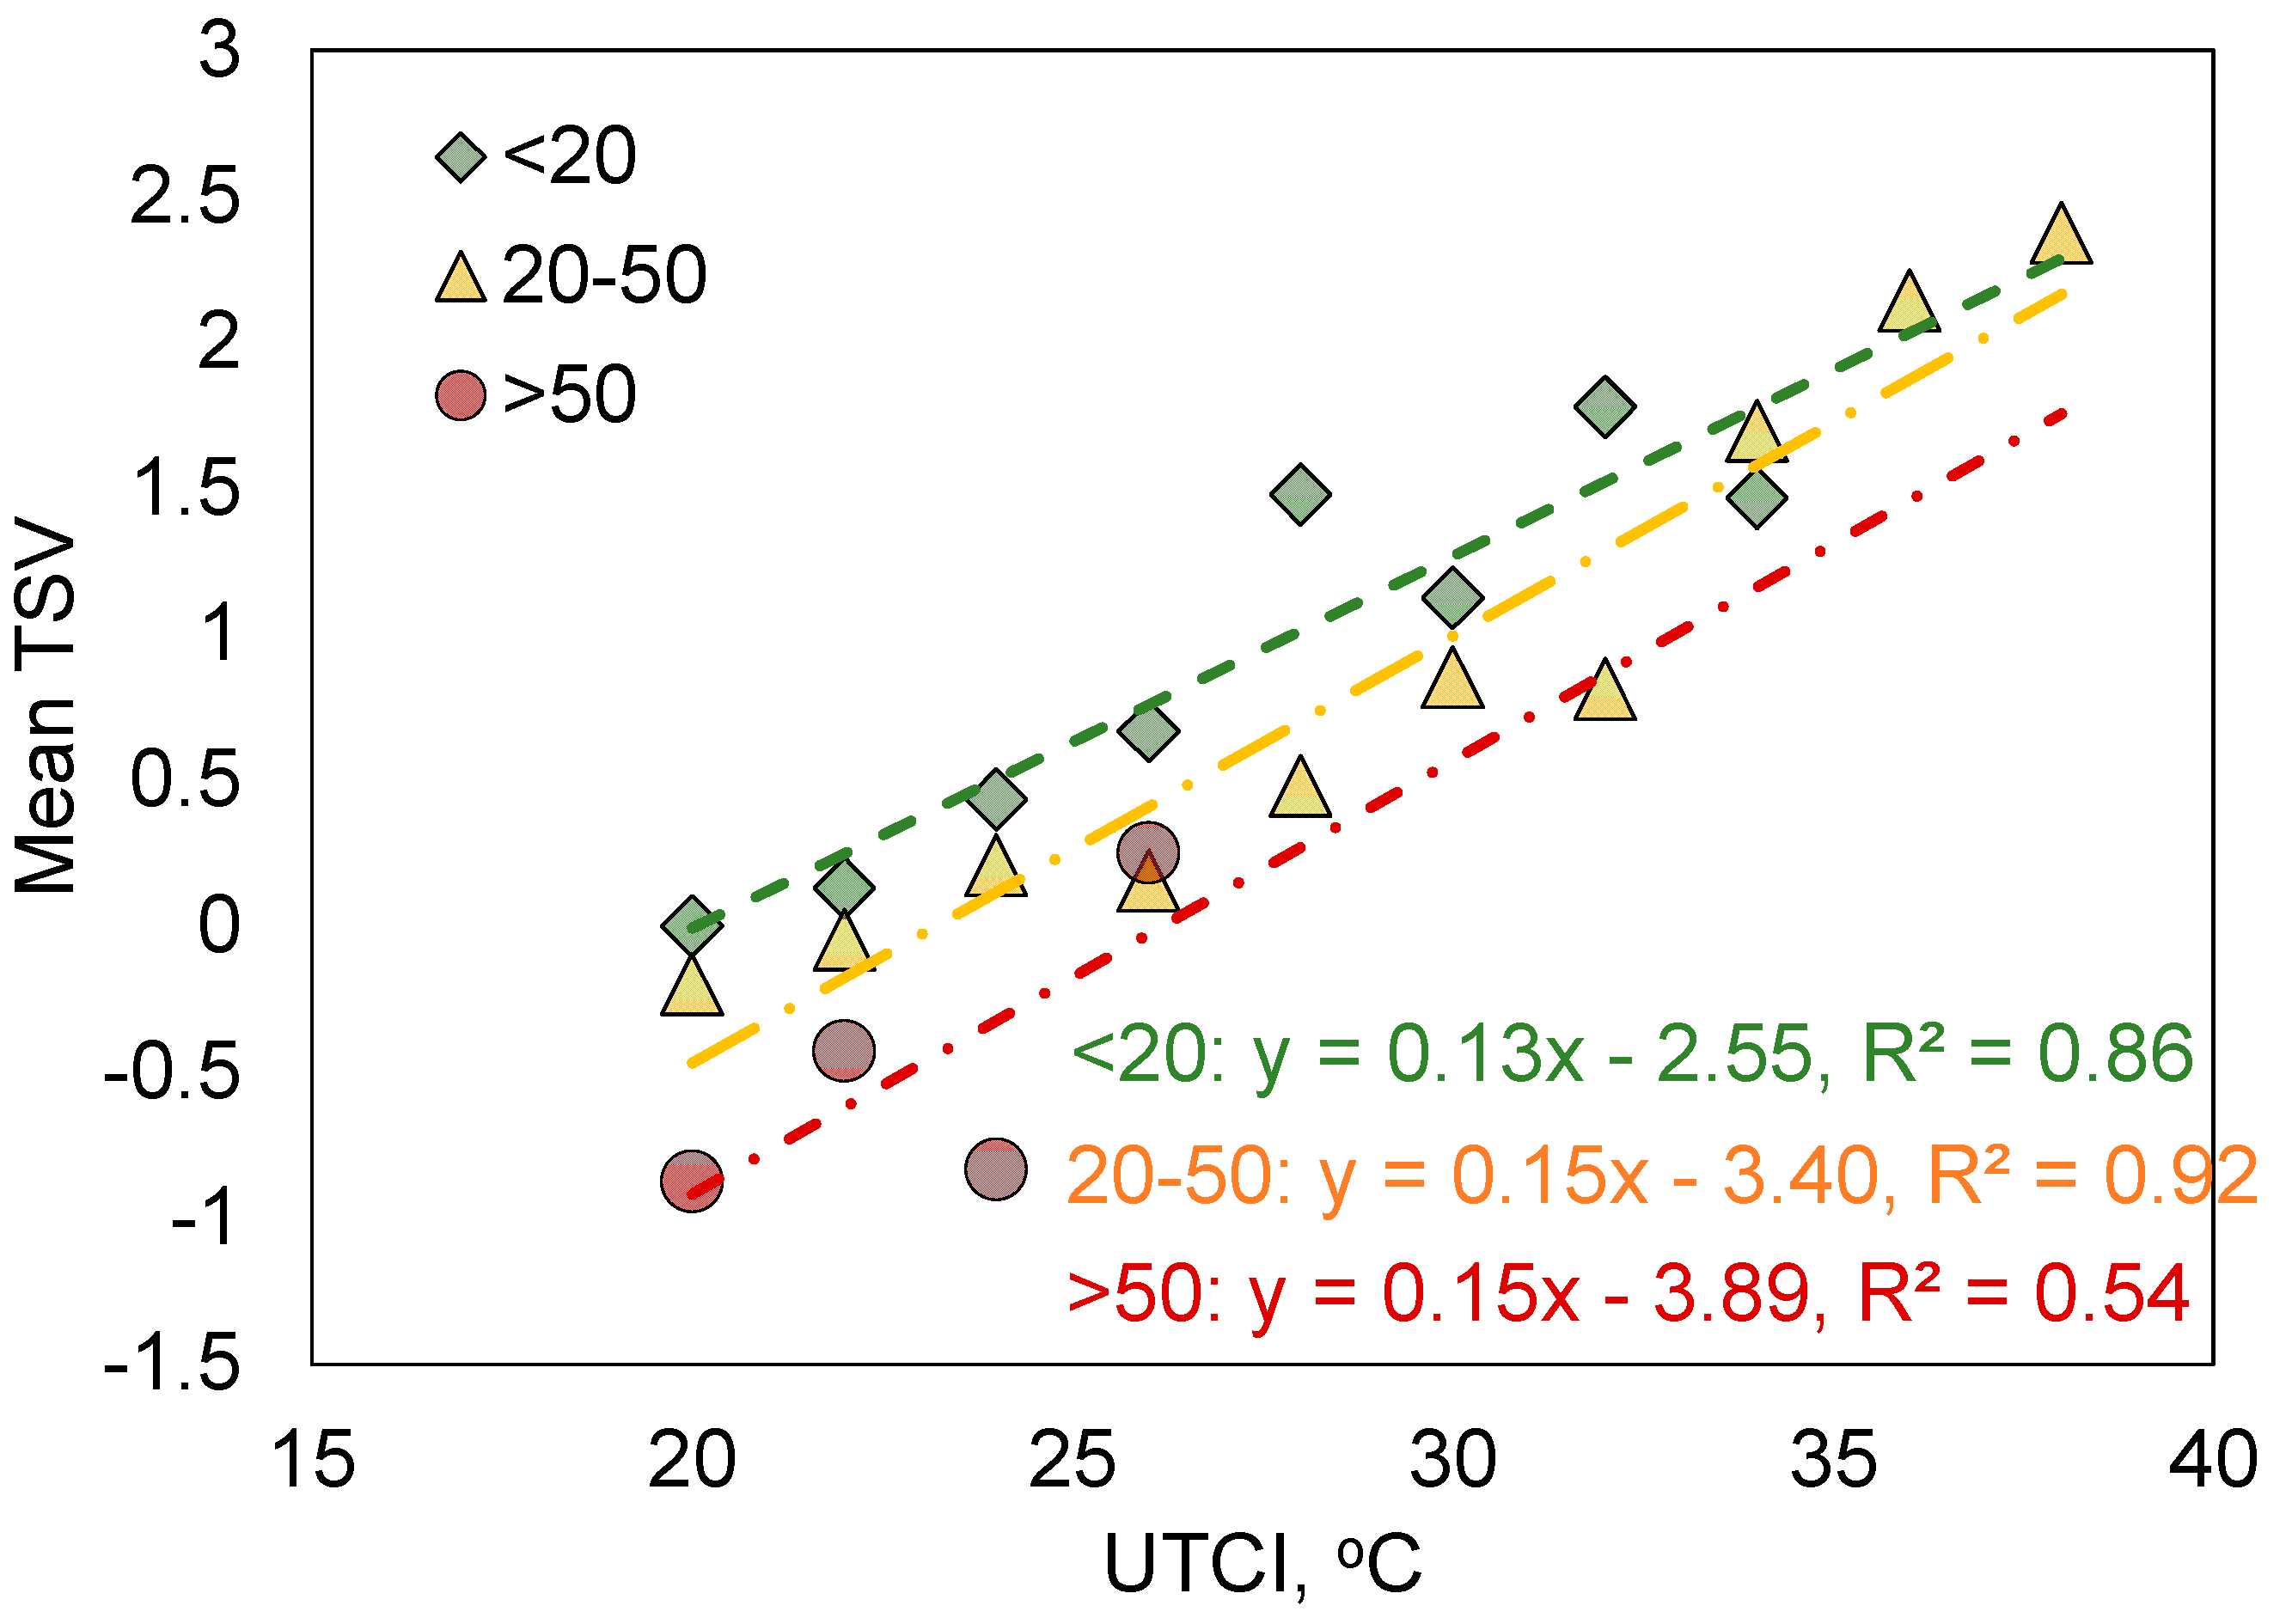
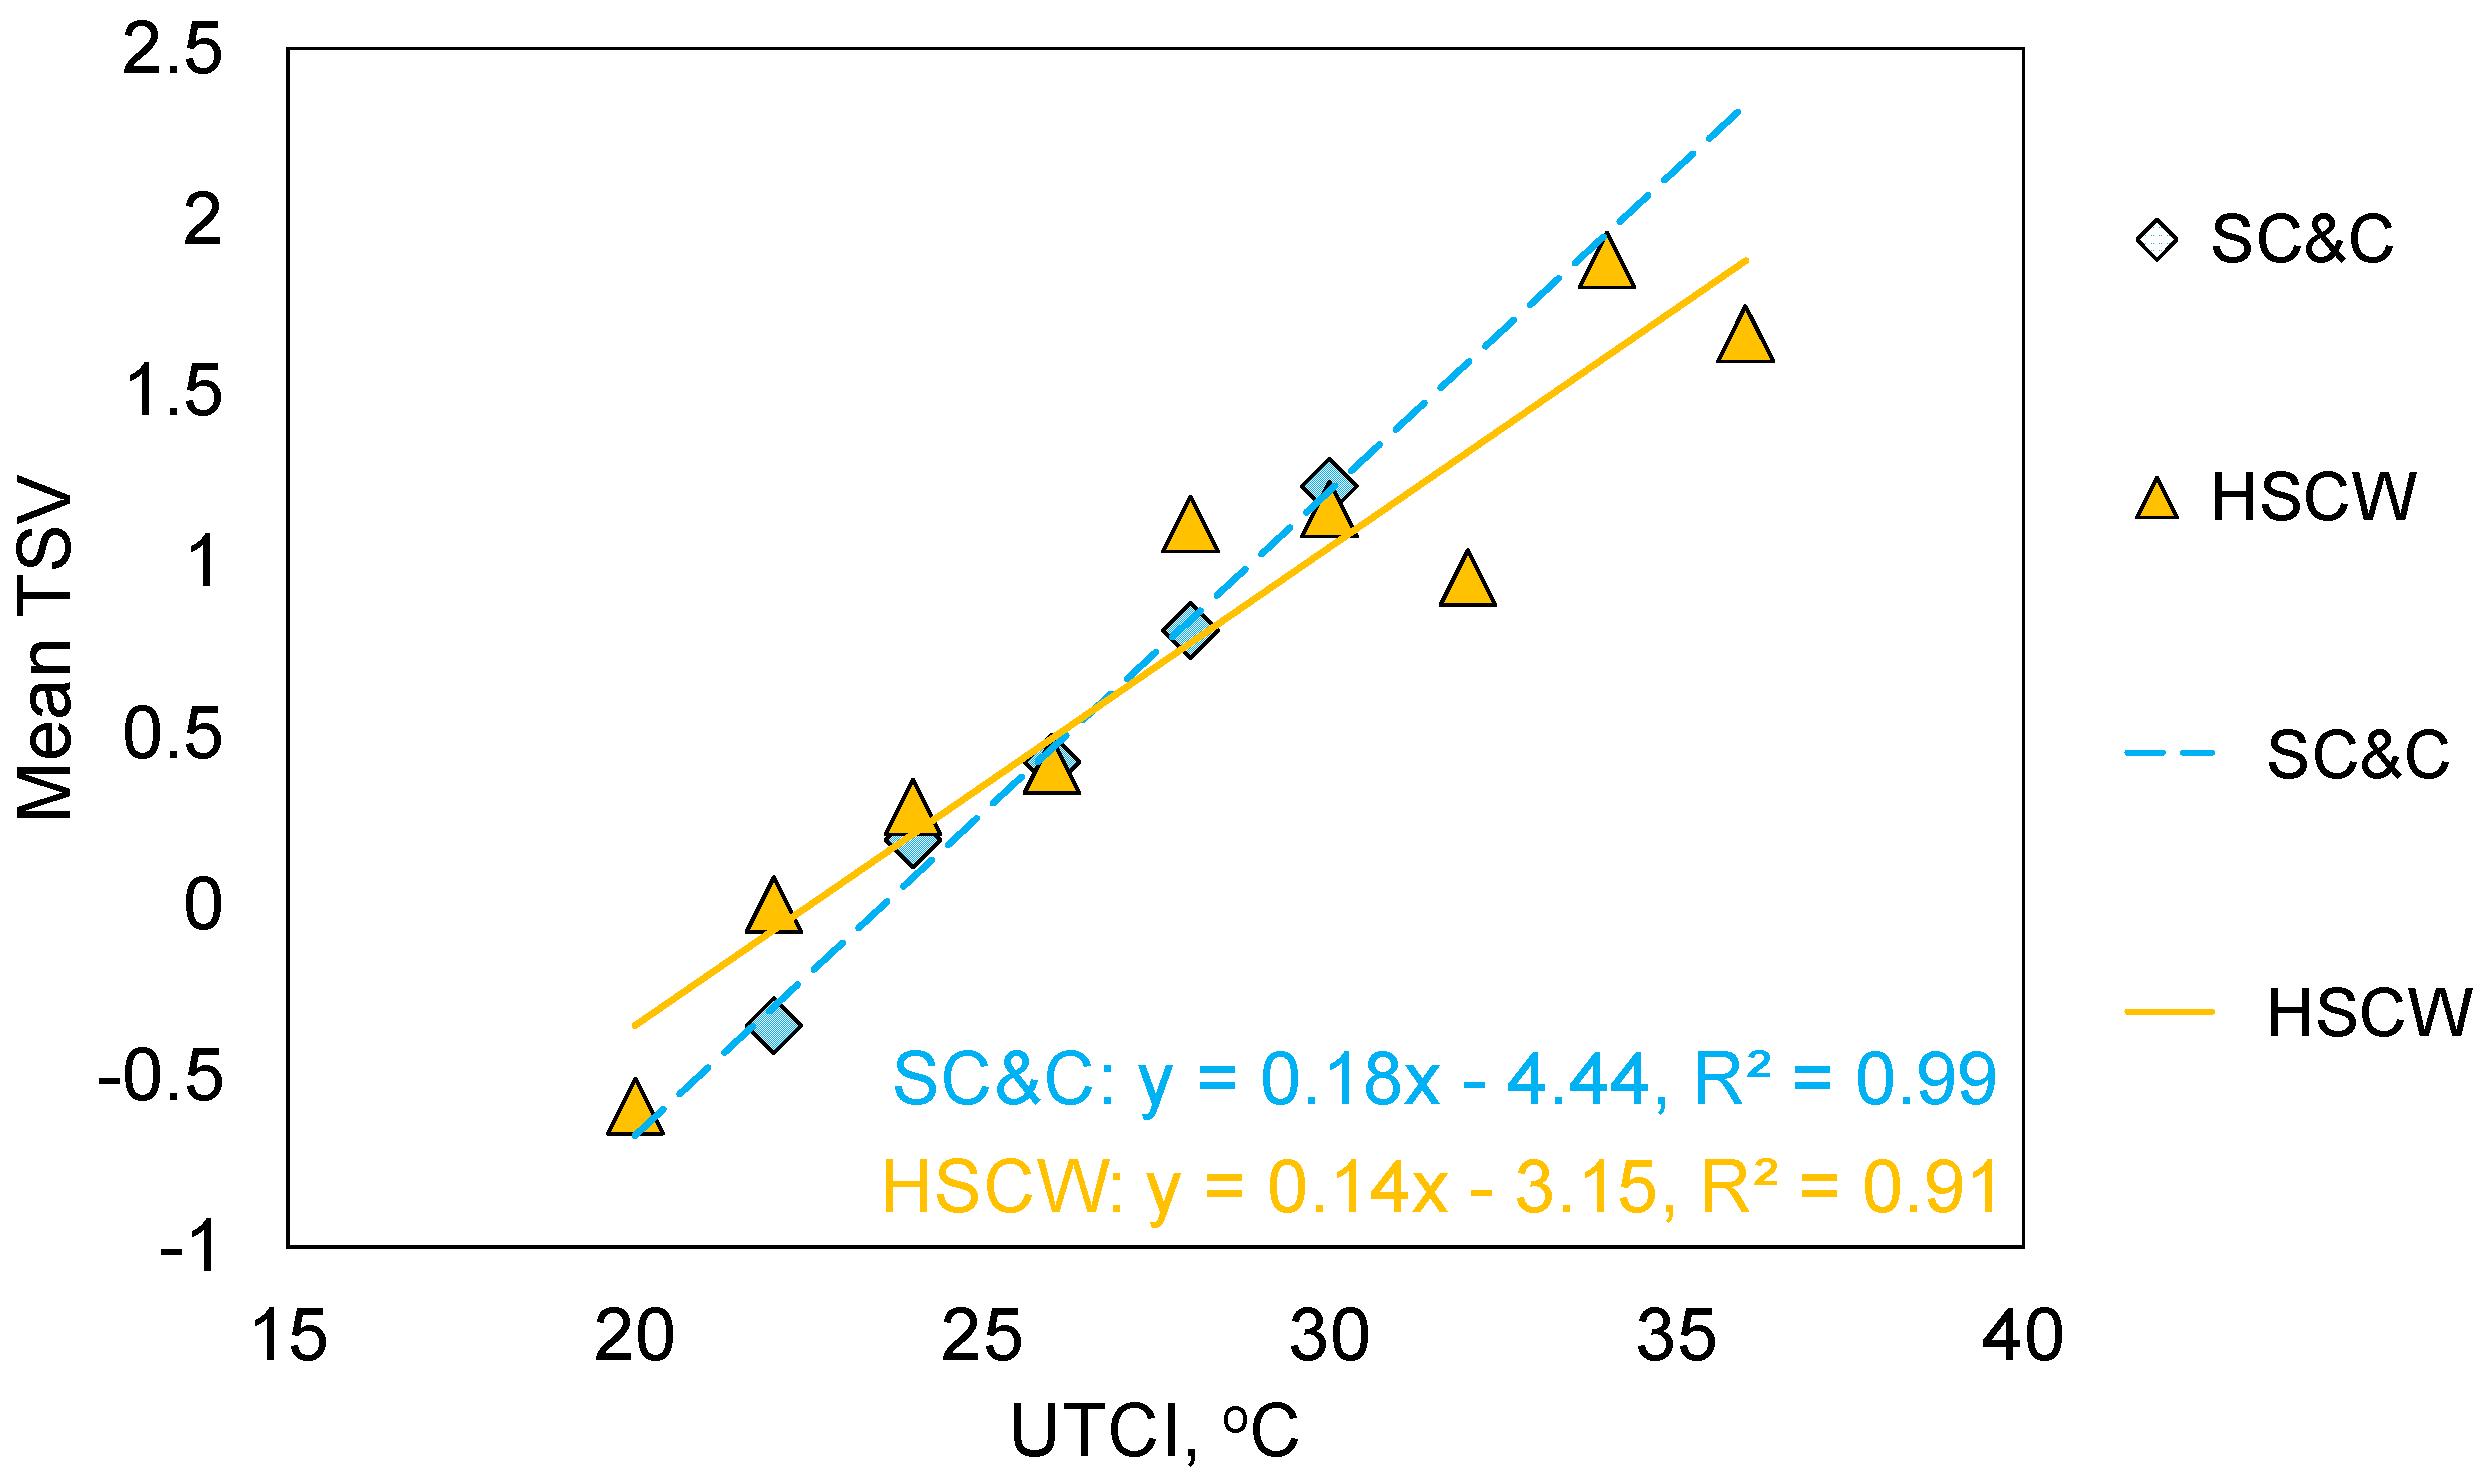
3.6. Influence of Long-Term Thermal History

The influence of long-term thermal history was analyzed by examining the effect of local residence length and hometown climate. Figure 13 demonstrates the distributions of the overall thermal comfort vote for occupants with different lengths of residence in Shanghai. With longer residence duration, occupants became better adapted to the local thermal environment and had a higher overall comfort level. Figure 14 further plots the relationships between UTCI and mean TSV for respondents with different residence lengths. The general pattern shows that longer residence led to a lower TSV during the studied period of our survey.
The observations collected from severe cold (SC), hot summer and warm winter (HSWW), and mild (M) climate zones accounted for less than 5% of the total samples. The analysis was not performed on HSWW and M zones due to the insufficient size of the sample. The data from the SC region were combined with those of the C region to further compare with the data from the hot summer and cold winter (HSCW) region. The HSCW and SC/C regions had 360 and 124 samples, respectively. Figure 15 demonstrates the mean TSV as a function of UTCI for SC/C and HSCW. Respondents from HSCW were less sensitive to UTCI than respondents from the SC and C regions.

4. Discussion

4.1. Comparing with Other Studies

Previous studies have provided insights into the influences of gender and age on human thermal comfort in outdoor spaces. For the effect of gender, some studies [29,47,48] have compared the distributions of the thermal sensation vote for males and females; other studies [21,24,25,26,27,49] have compared the regressed equations between the two genders. Despite the method used, all studies have shown that females were more sensitive to the thermal environment than males were, which agrees with the findings of the current study. Only Cohen et al. [28] reported that in Beer Sheva, Israel, females had shown higher tolerance to cold than males.
For the effect of age, our investigation has demonstrated that older age led to lower thermal sensation in mild and hot seasons, which agrees with the results of Lai et al. [44]. Our study has demonstrated similar sensitivity among all age groups. However, a number of studies [24,25,27,31] have shown that the elderly group was the least sensitive to the outdoor thermal environment among all age groups. It is worth noting that the data of respondents aged >50 in our study were collected under a narrow UTCI range (20–26 °C), and more data might be required to test the findings in wider conditions.
Many researchers [29,50] have discovered that, compared to foreign visitors, local residents have a higher percentage of “neutral” votes. Yang et al. [31] found that the thermal sensation of a local person was about 0.8 units higher than that of a non-local person in Umeå, Sweden. Our study further quantified the effect by showing that the overall comfort increased with longer residence time.

4.2. Clothing Behavior

The adjustment of clothing insulation is an important measure for people to adapt to the outdoor thermal environment, and many studies have documented the clothing behavior of people in their studies. Lai et al. [13] have reviewed and compared clothing behavior from different studies. This study calculates the mean clothing insulation value at different air temperatures, and the results are shown in Figure 16. The clothing insulation decreased rapidly from 21 to 25 °C, but the value became saturated thereafter as it had reached a socially acceptable threshold. In addition to the trend of the mean clothing insulation, the level of diversity (standard deviation) of the clothing insulation worn by occupants also reduced as the air temperature increased. The standard deviation trend of clothing insulation shows that adjusting clothing was a more frequently adopted measure at temperate air temperatures (within the range of our study). Figure 17 separately demonstrates the clothing insulation under different air temperatures by gender. It can be seen that females had more clothing insulation than males, especially at air temperatures between 21 and 27 °C.

4.3. Limitations

There are several limitations of this study. The field survey was conducted in mild and hot seasons. We did not cover conditions of air temperature below 20 °C, but the winter air temperature in Shanghai can frequently be below 5 °C. As this study was only conduced in mild and hot seasons, data should also be collected in a wider thermal environment to study the impact of personal factors in various thermal environments. Accordingly, further studies should be carried out in cold seasons. Individual personal factors may amplify or diminish the influence of other factors when they interact; further analysis should be carried out on a larger dataset to study the interaction between personal factors. In addition, due to the insufficient sample size of HSWW and M climate zones, the analysis was not performed on these two climate regions to examine occupants’ outdoor thermal comfort. More samples should be collected to provide enough data for further analysis, especially for the elderly age group. Thermal comfort is influenced by many factors [51,52,53,54,55,56]. Other personal factors such as personal characteristics, weight, and activity may also have an influence on outdoor thermal comfort, and these factors should be studied further.

5. Conclusions

In order to understand the outdoor thermal comfort from a gender and long-term thermal history perspective, field surveys were conducted from May to October, 2019 in outdoor spaces at a university campus in the humid subtropical climate of Shanghai, China. The field surveys obtained the microclimatic parameters and the subjective perceptions. The analysis of 520 samples has led to the following conclusions:
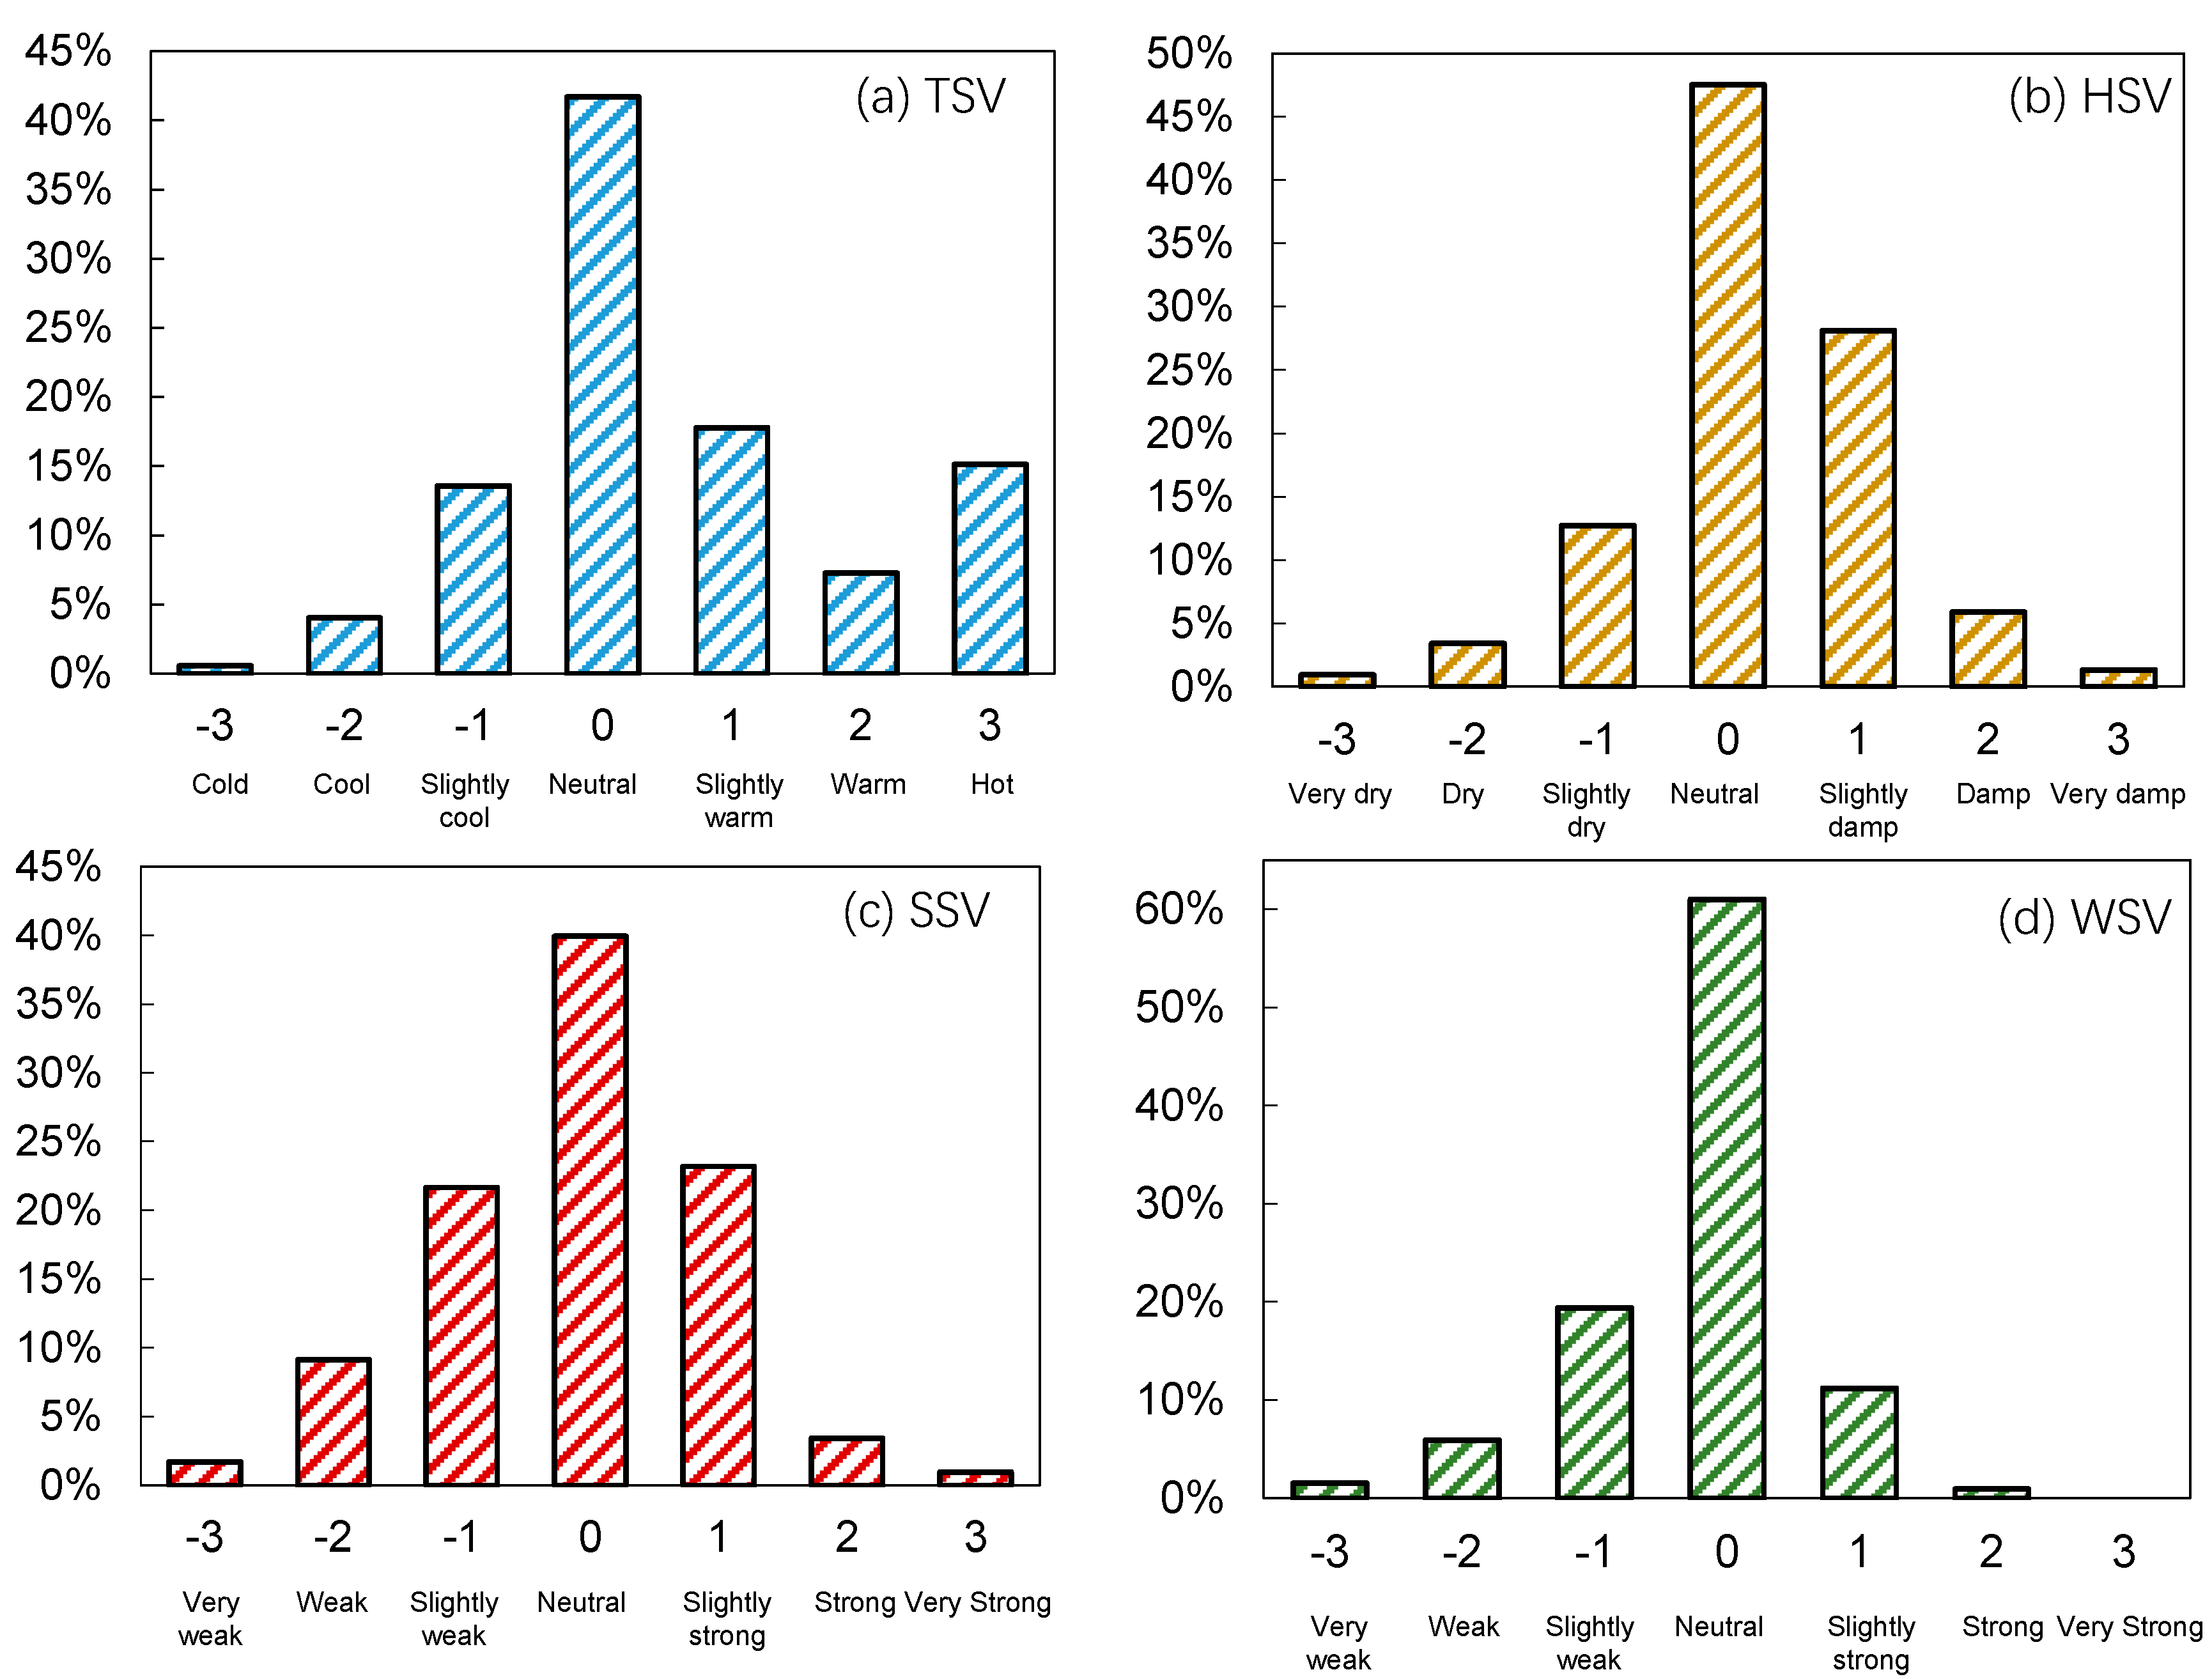
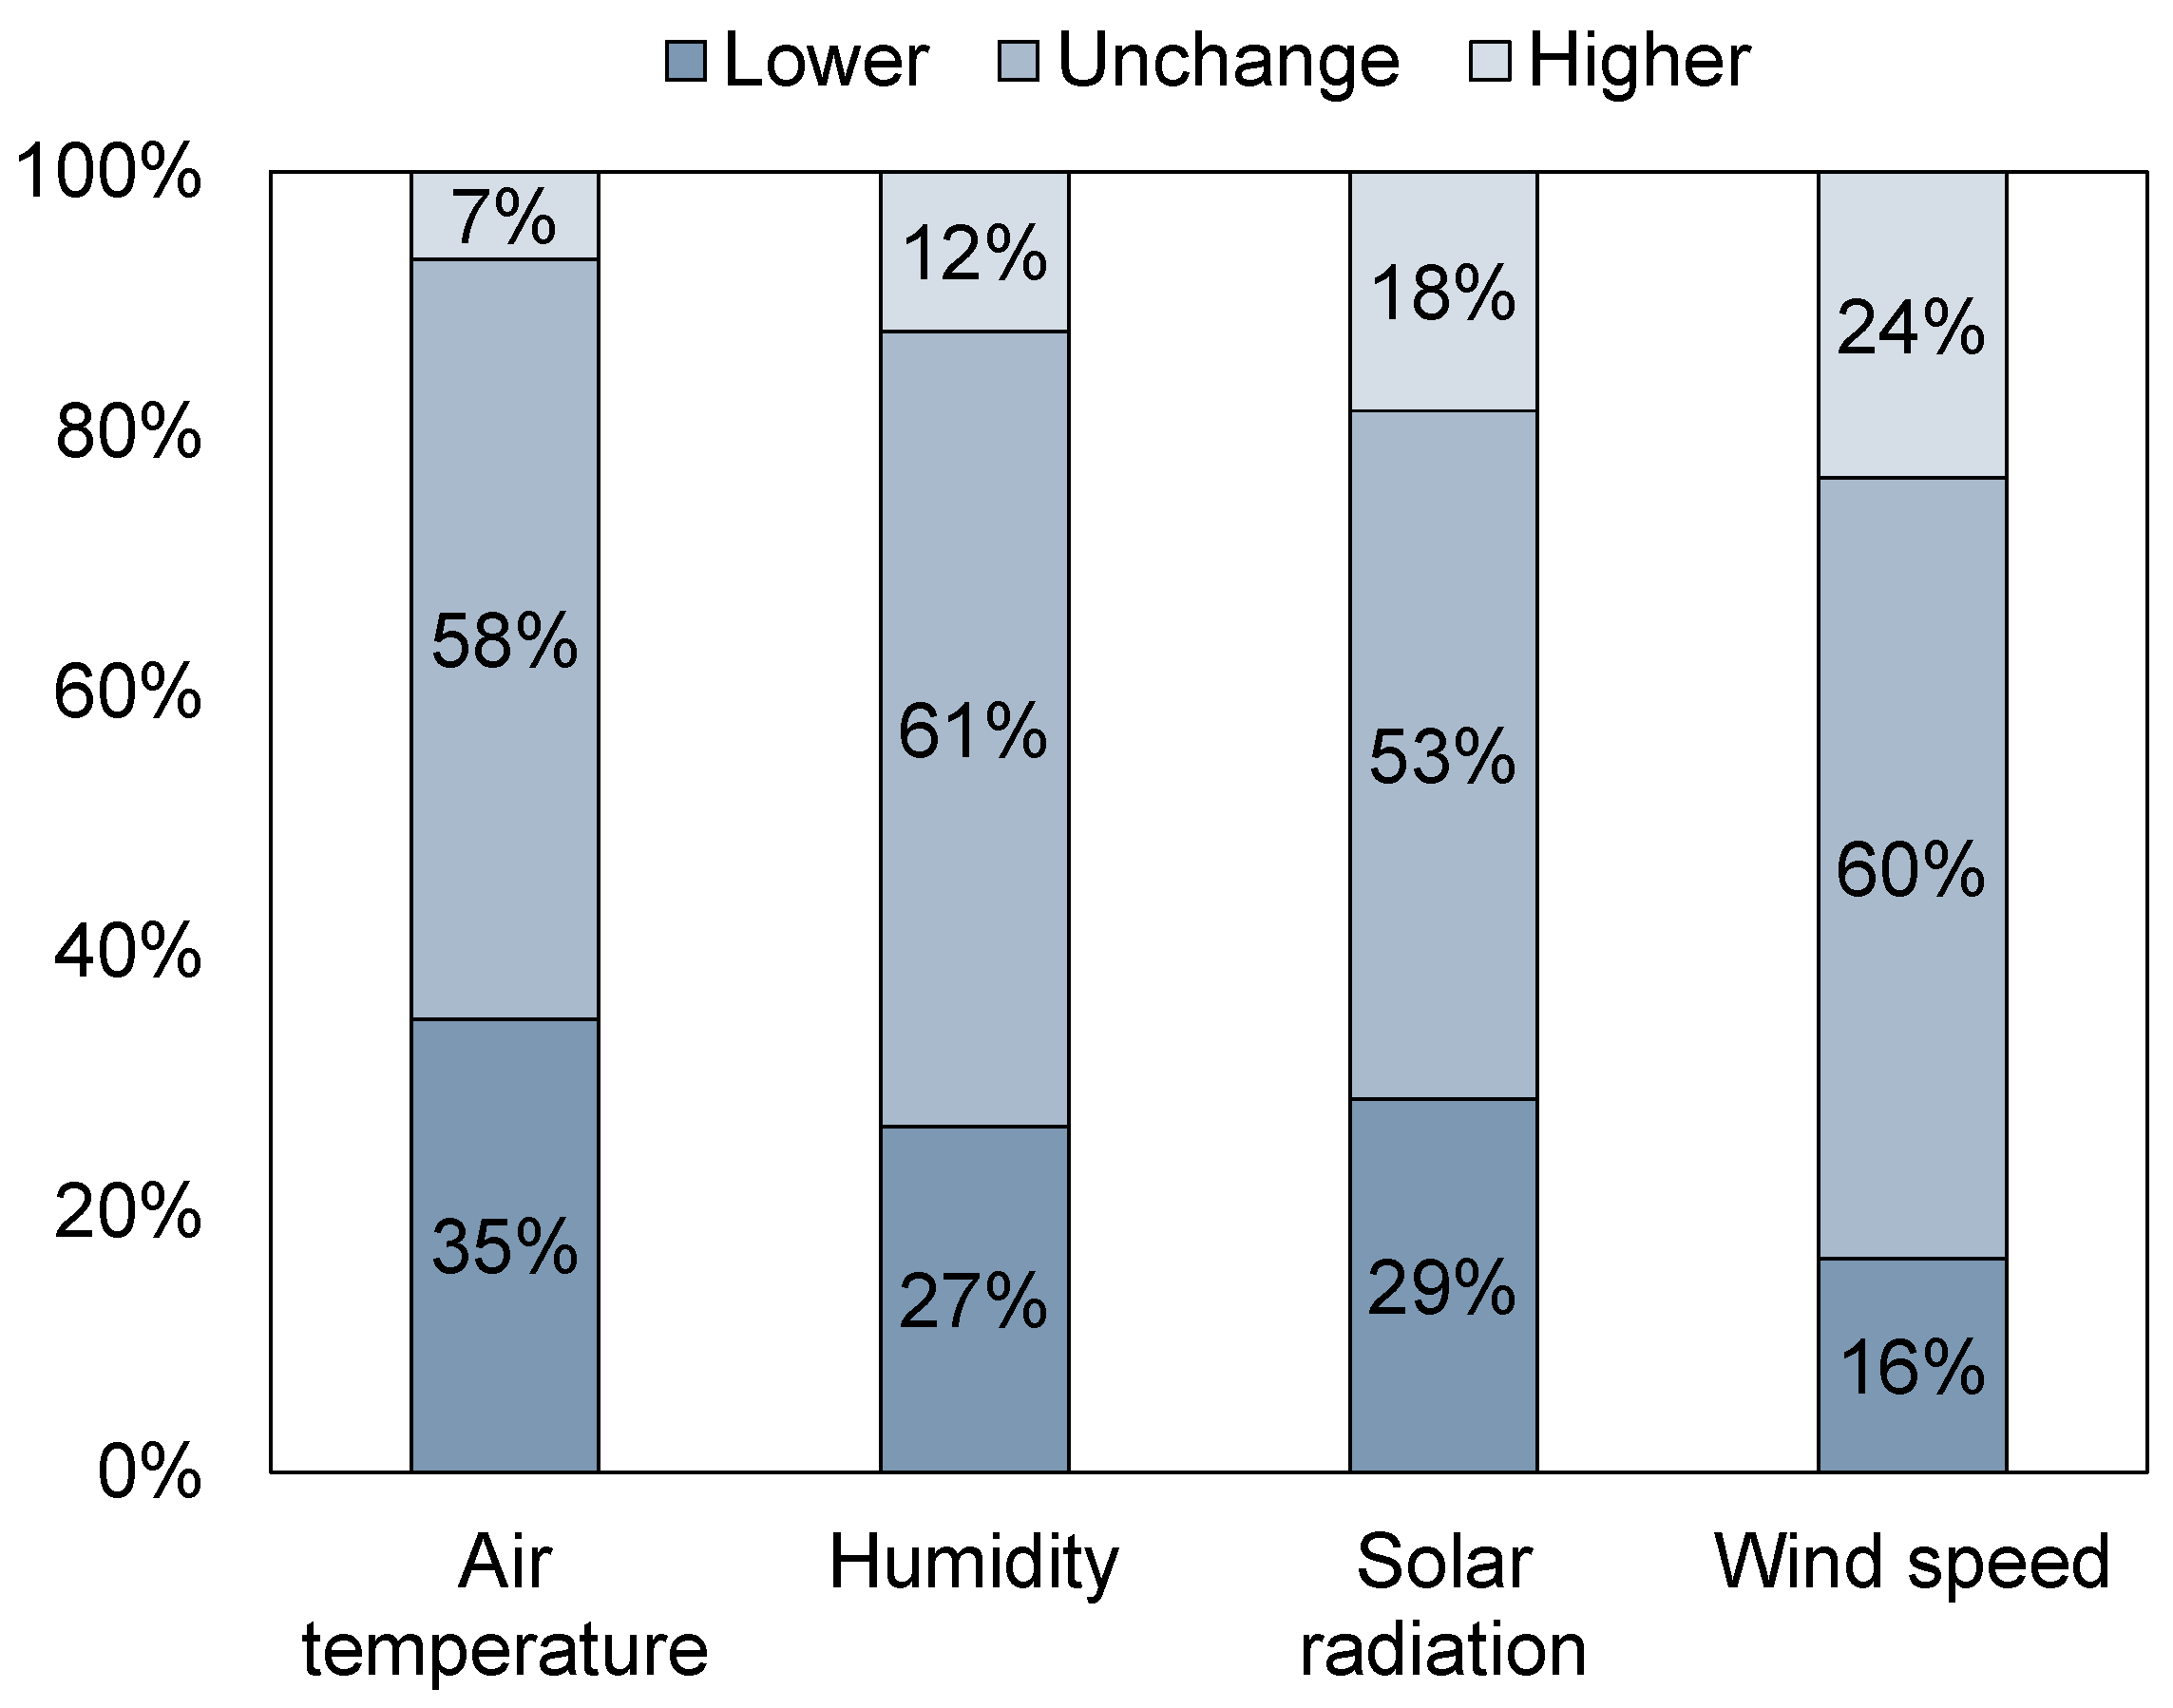
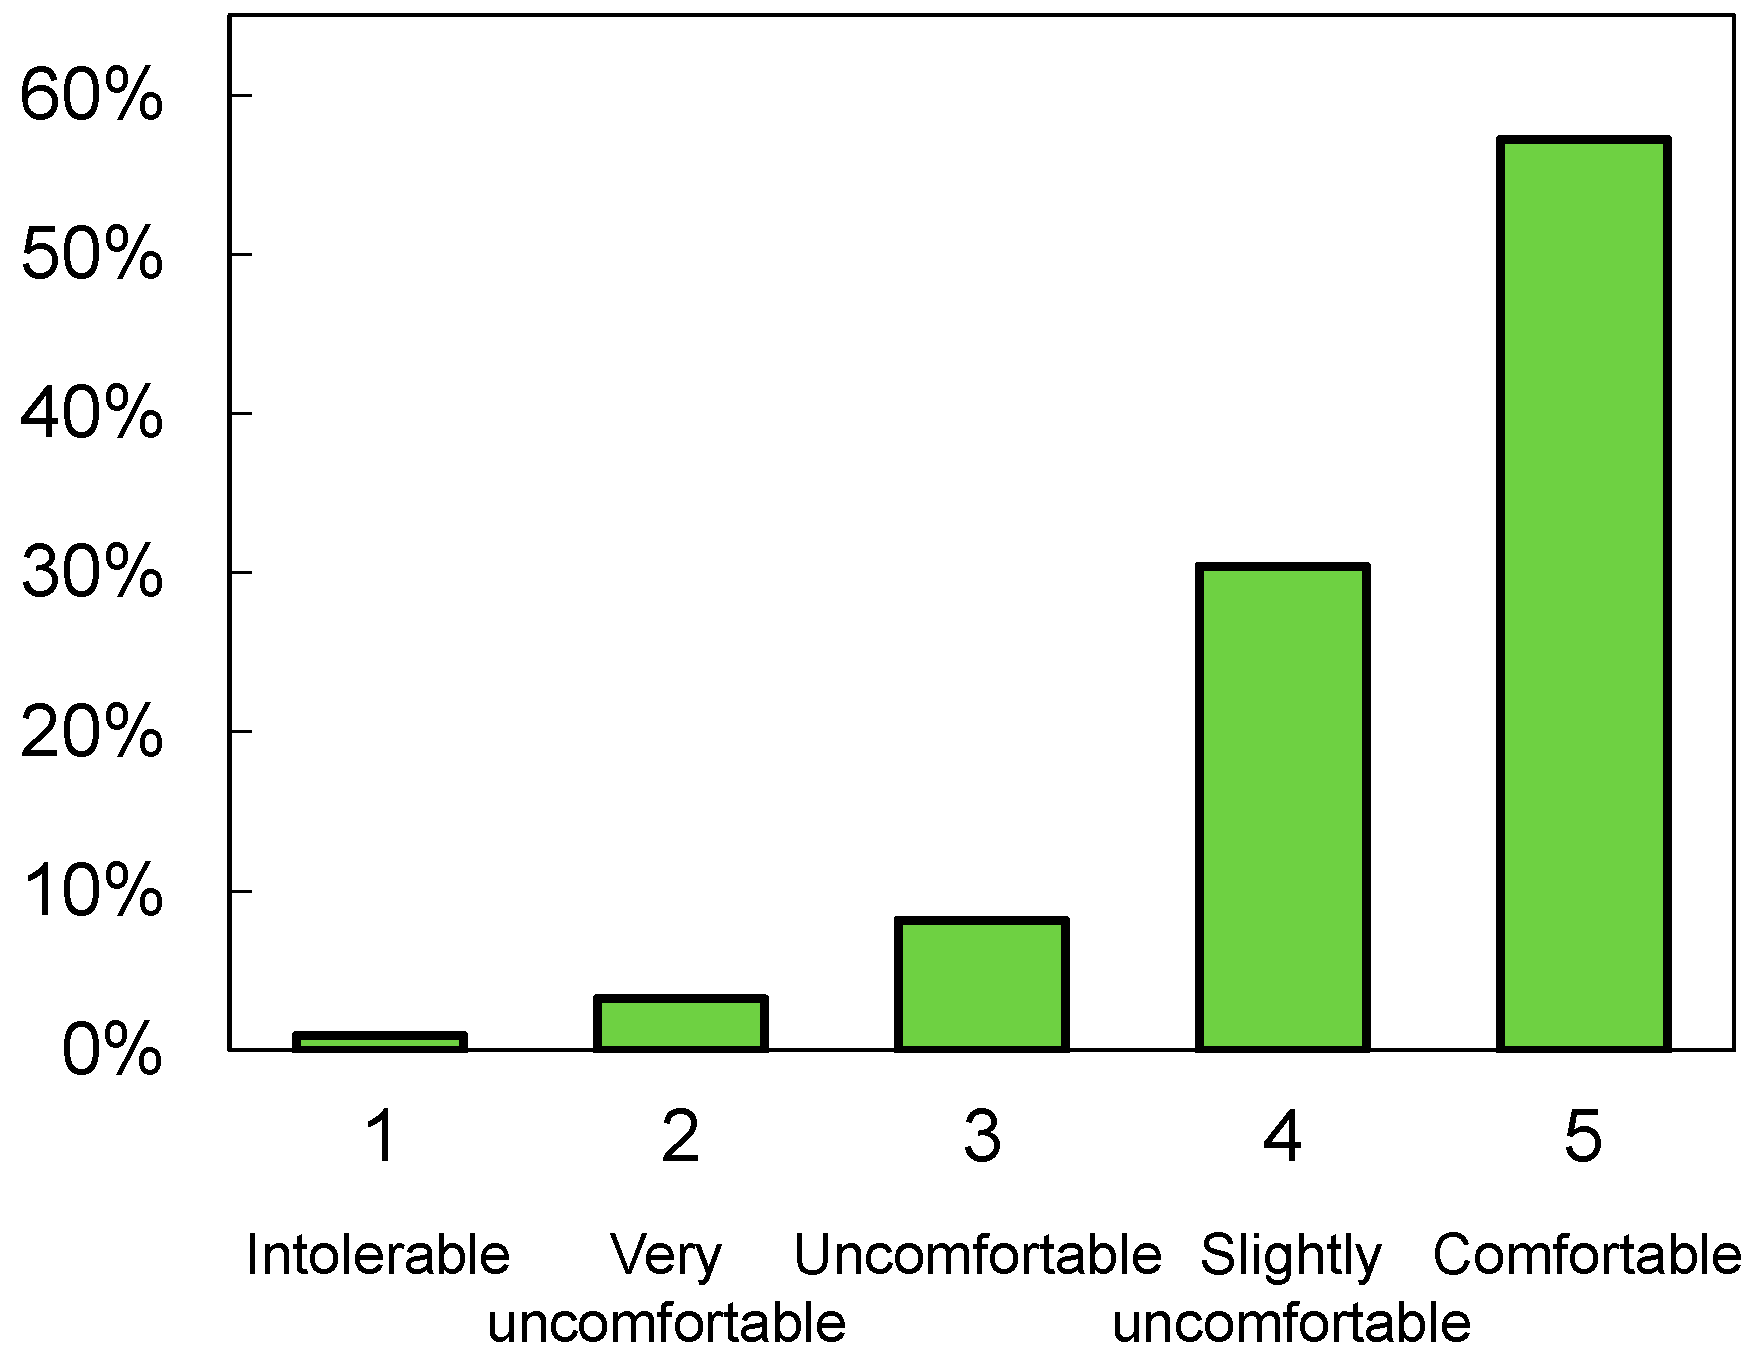
  • The occupants generally accepted the outdoor thermal environment. During the survey, 42%, 48%, 40%, and 62% of the respondents perceived the temperature, humidity, solar radiation, and wind as neutral, respectively. In total, 57% of them felt comfortable, and only 1% and 3% stated that the overall comfort level was intolerable or very uncomfortable, respectively.
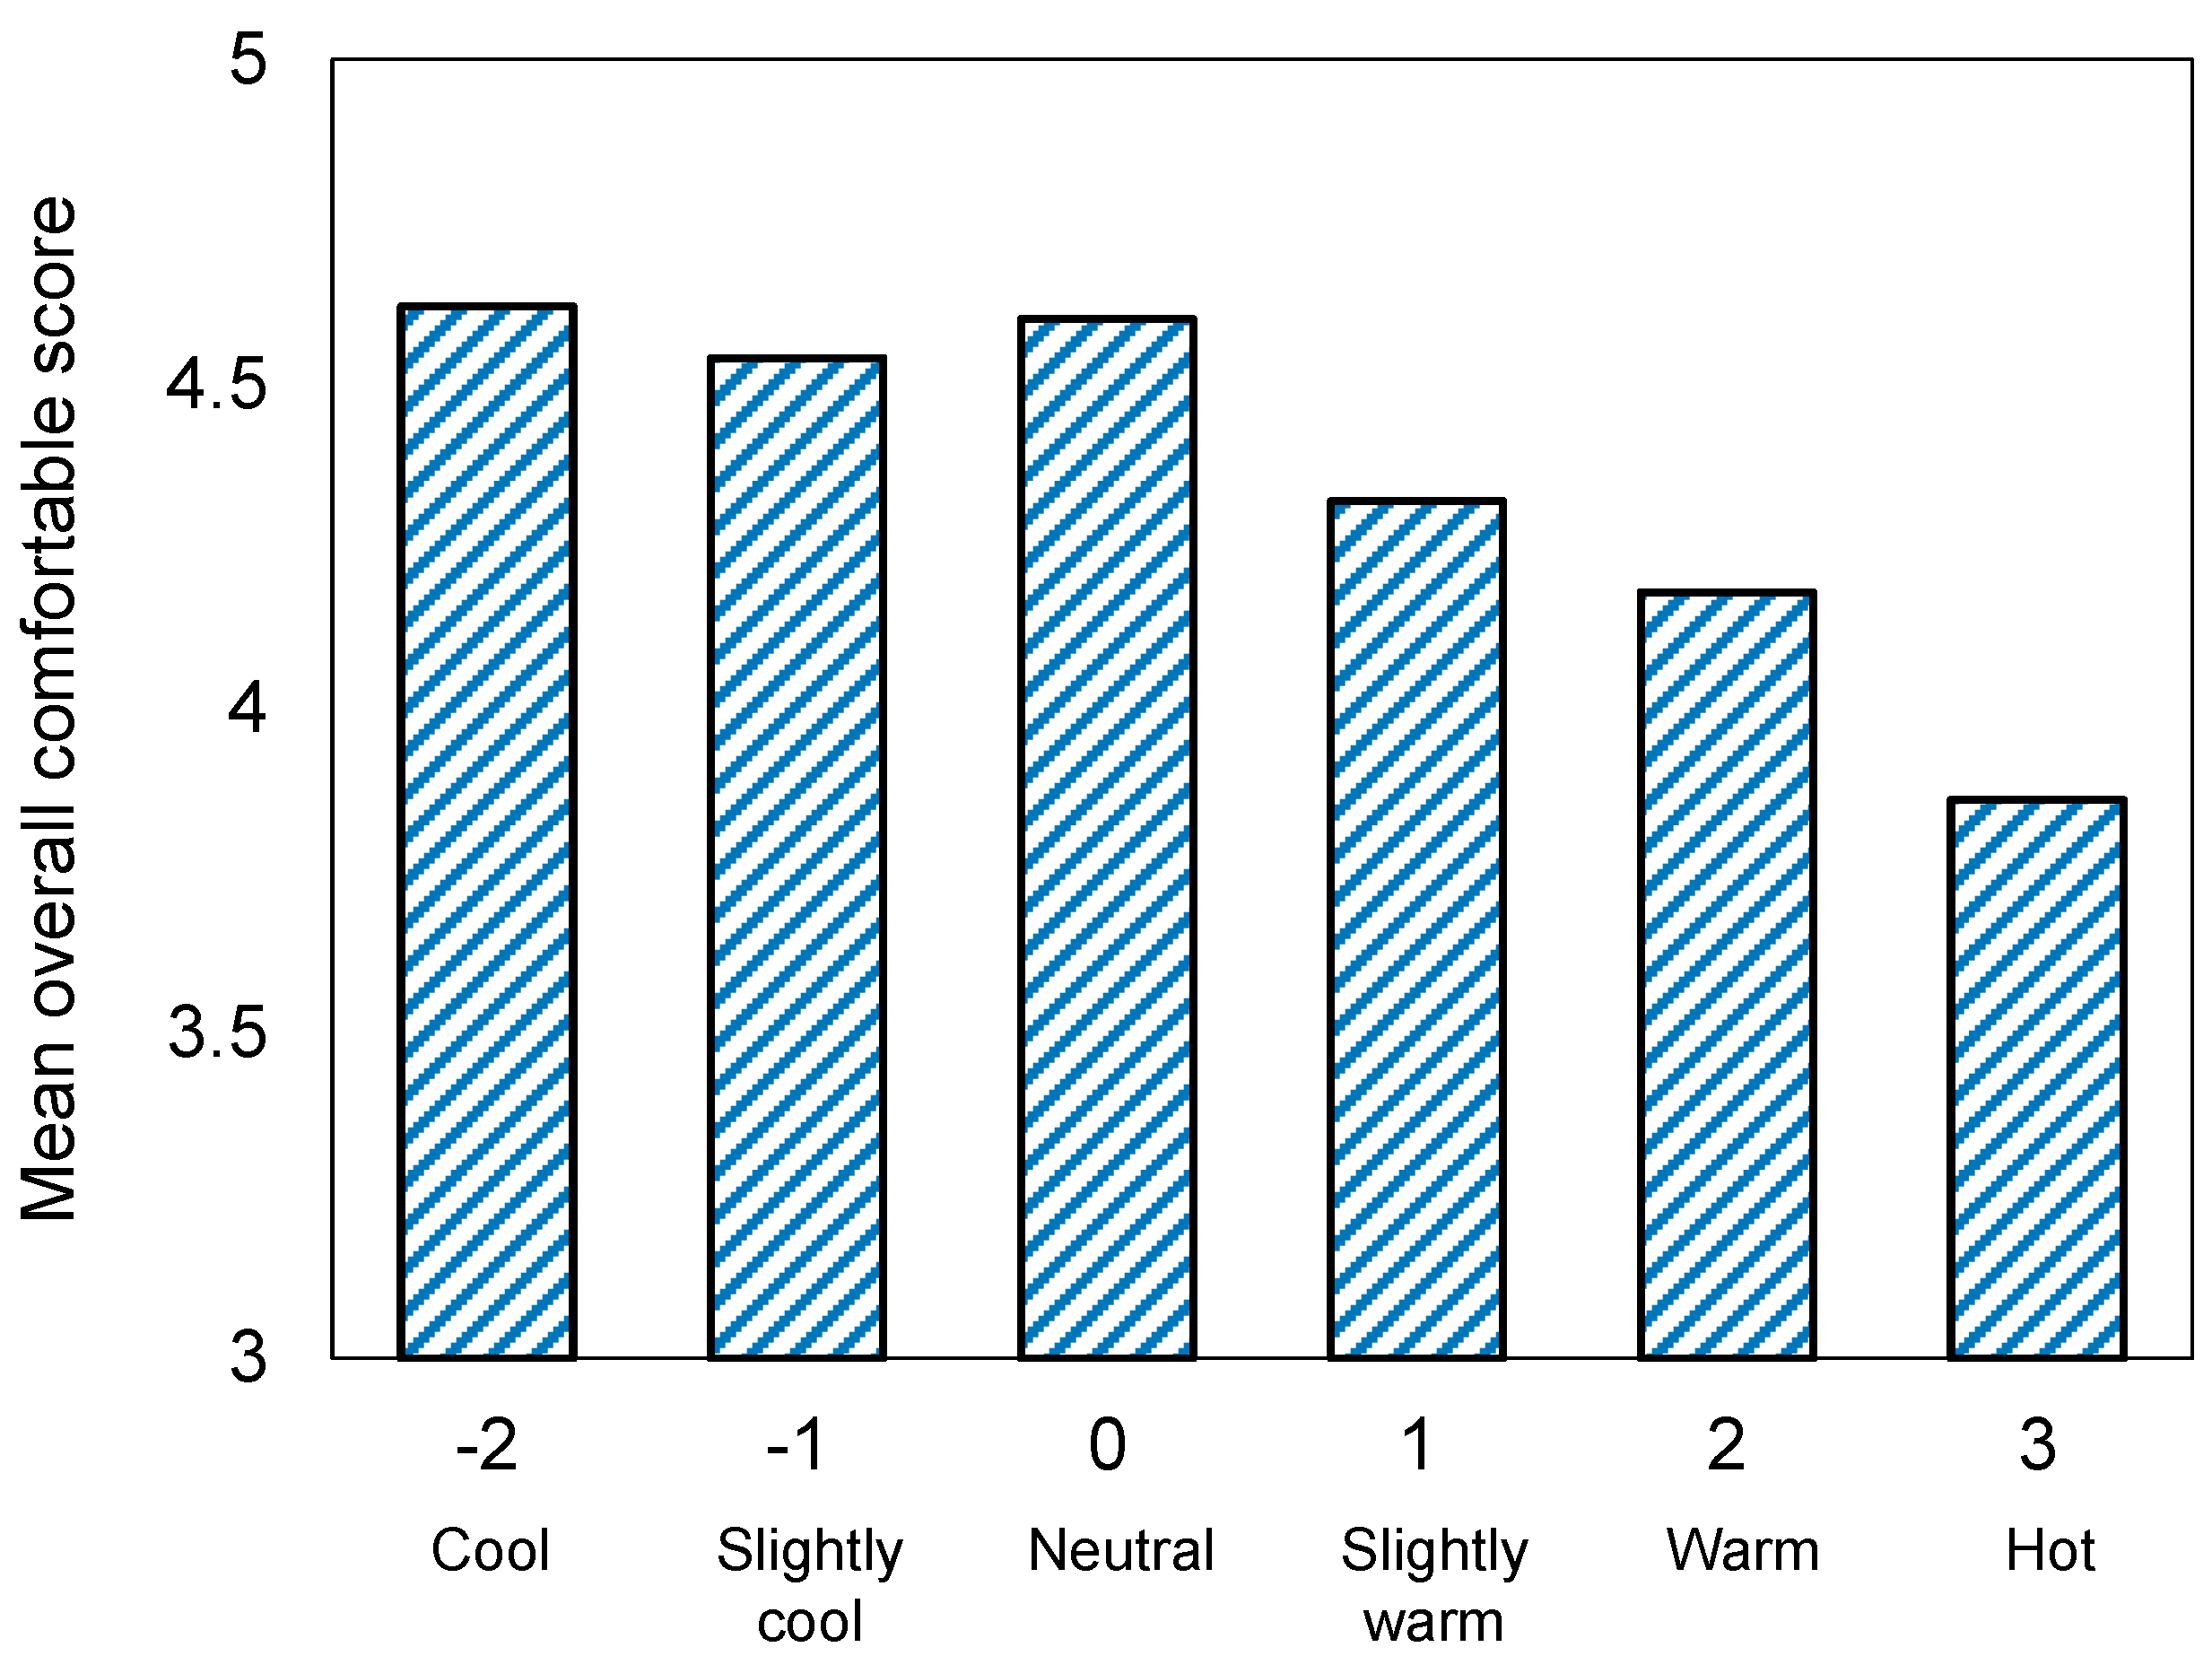
  • UTCI showed a better correlation with the mean thermal sensation than PET did. A 1 K change in UTCI led to a 0.1388 unit change in mean thermal sensation.
  • Female respondents demonstrated a higher sensitivity to the outdoor thermal environment than male respondents did. Different age groups had a similar level of sensitivity, while respondents younger than 20 had the highest TSV.
  • Longer residence length led to a higher overall comfort rating and lower thermal sensation. Interviewees from severe cold and cold climate regions were more sensitive to the changes in UTCI than occupants from hot summer and cold winter climate regions.

Author Contributions

Writing-original draft preparation, J.X.; Project administration, D.L.; Funding acquisition, D.L.; Supervision, D.L. and X.J.; Methodology, X.H. and S.N.S.; Formal analysis, X.H. and Y.W.; Investigation, L.C. and X.L. All authors have read and agree to the published version of the manuscript.

Funding

The research was financially sponsored by the “Chenguang Program” supported by the Shanghai Education Development Foundation and Shanghai Municipal Education Commission through Grant No. 18CG12. This work also received funding from the Shanghai Sailing Program of Science and Technology Commission of Shanghai Municipality through Grant No. 19YF1424800. This research is supported by National Natural Science Foundation of China Grant No. 71804165.

Acknowledgments

The authors are grateful to the undergraduate students at Shanghai Jiao Tong University, Yiran Bao, Hailun Ma, and Linfeng Xu, for their assistance in conducting the field surveys.

Conflicts of Interest

The authors declare no conflict of interest.

References

  1. Population Reference Bureau. 2020 World Population Data Sheet; Population Reference Bureau: Washington, DC, USA, 2020. [Google Scholar]
  2. Mi, J.; Hong, B.; Zhang, T.; Huang, B.; Niu, J. Outdoor thermal benchmarks and their application to climate‒responsive designs of residential open spaces in a cold region of China. Build. Environ. 2020, 169, 106592. [Google Scholar] [CrossRef]
  3. Nikolopoulou, M.; Lykoudis, S. Use of outdoor spaces and microclimate in a Mediterranean urban area. Build. Environ. 2007, 42, 3691–3707. [Google Scholar] [CrossRef] [Green Version]
  4. Lai, D.; Chen, B.; Liu, K. Quantification of the influence of thermal comfort and life patterns on outdoor space activities. Build. Simul. 2019, 13, 113–125. [Google Scholar] [CrossRef]
  5. Lin, T.-P.; Tsai, K.T.; Hwang, R.L.; Matzarakis, A. Quantification of the effect of thermal indices and sky view factor on park attendance. Landsc. Urban Plan. 2012, 107, 137–146. [Google Scholar] [CrossRef]
  6. Aram, F.; Solgi, E.; Baghaee, S.; Higueras García, E.; Mosavi, A.; Band, S.S. How parks provide thermal comfort perception in the metropolitan cores; A case study in Madrid Mediterranean climatic zone. Clim. Risk Manag. 2020, 30. [Google Scholar] [CrossRef]
  7. Aram, F.; Solgi, E.; Garcia, E.H.; Mosavi, A. Urban heat resilience at the time of global warming: Evaluating the impact of the urban parks on outdoor thermal comfort. Environ. Sci. Eur. 2020, 32. [Google Scholar] [CrossRef]
  8. Larriva, M.T.B. Outdoor Thermal and acoustic comfort in autumn for senior citizens in public spaces in Newcastle upon Tyne, UK. Biomed. J. Sci. Tech. Res. 2020, 24. [Google Scholar] [CrossRef]
  9. Lee, D.Y.; Seo, B.M.; Yoon, Y.B.; Hong, S.H.; Choi, J.M.; Lee, K.H. Heating energy performance and part load ratio characteristics of boiler staging in an office building. Front. Energy 2018, 13, 339–353. [Google Scholar] [CrossRef]
  10. Sahdev, R.K.; Kumar, M.; Dhingra, A.K. A comprehensive review of greenhouse shapes and its applications. Front. Energy 2017, 13, 427–438. [Google Scholar] [CrossRef]
  11. Talele, S.; Traylor, C.; Arpan, L.; Curley, C.; Chen, C.F.; Day, J.; Feiock, R.; Hadzikadic, M.; Tolone, W.J.; Ingman, S.; et al. Energy modeling and data structure framework for Sustainable Human-Building Ecosystems (SHBE)—A review. Front. Energy 2018, 12, 314–332. [Google Scholar] [CrossRef]
  12. Zhang, H.; Zhang, C.; Wen, F.; Xu, Y. A comprehensive energy solution for households employing a micro combined cooling, heating and power generation system. Front. Energy 2018, 12, 582–590. [Google Scholar] [CrossRef]
  13. Lai, D.; Lian, Z.; Liu, W.; Guo, C.; Liu, W.; Liu, K.; Chen, Q. A comprehensive review of thermal comfort studies in urban open spaces. Sci. Total Environ. 2020, 742, 140092. [Google Scholar] [CrossRef]
  14. Zhang, L.; Wei, D.; Hou, Y.; Du, J.; Liu, Z.A.; Zhang, G.; Shi, L. Outdoor thermal comfort of urban park—A Case Study. Sustainability 2020, 12, 1961. [Google Scholar] [CrossRef] [Green Version]
  15. Xu, M.; Hong, B.; Jiang, R.; An, L.; Zhang, T. Outdoor thermal comfort of shaded spaces in an urban park in the cold region of China. Build. Environ. 2019, 155, 408–420. [Google Scholar] [CrossRef]
  16. Zhu, Z.; Liang, J.; Sun, C.; Han, Y. Summer outdoor thermal comfort in urban commercial pedestrian streets in severe cold regions of China. Sustainability 2020, 12, 1876. [Google Scholar] [CrossRef] [Green Version]
  17. Lu, M.; Hou, T.; Fu, J.; Wei, Y. The effects of microclimate parameters on outdoor thermal sensation in severe cold cities. Sustainability 2019, 11, 1572. [Google Scholar] [CrossRef] [Green Version]
  18. Ma, X.; Fukuda, H.; Zhou, D.; Wang, M. A Study of the pedestrianized zone for tourists: Urban design effects on humans’ thermal comfort in Fo Shan City, Southern China. Sustainability 2019, 11, 2774. [Google Scholar] [CrossRef] [Green Version]
  19. Nakayoshi, M.; Kanda, M.; Shi, R.; De Dear, R. Outdoor thermal physiology along human pathways: A study using a wearable measurement system. Int. J. Biometeorol. 2015, 59, 503–515. [Google Scholar] [CrossRef]
  20. Lai, D.; Zhou, X.; Chen, Q. Measurements and predictions of the skin temperature of human subjects on outdoor environment. Energy Build. 2017, 151, 476–486. [Google Scholar] [CrossRef]
  21. Lai, D.; Zhou, X.; Chen, Q. Modelling dynamic thermal sensation of human subjects in outdoor environments. Energy Build. 2017, 149, 16–25. [Google Scholar] [CrossRef]
  22. Song, G.S.; Jeong, M.A. Morphology of pedestrian roads and thermal responses during summer, in the urban area of Bucheon city, Korea. Int. J. Biometeorol. 2016, 60, 999–1014. [Google Scholar] [CrossRef]
  23. Nikolopoulou, M.; Steemers, K. Thermal comfort and psychological adaptation as a guide for designing urban spaces. Energy Build. 2003, 35, 95–101. [Google Scholar] [CrossRef]
  24. Amindeldar, S.; Heidari, S.; Khalili, M. The effect of personal and microclimatic variables on outdoor thermal comfort: A field study in Tehran in cold season. Sustain. Cities Soc. 2017, 32, 153–159. [Google Scholar] [CrossRef]
  25. Kruger, E.L.; Drach, P. Identifying potential effects from anthropometric variables on outdoor thermal comfort. Build. Environ. 2017, 117, 230–237. [Google Scholar] [CrossRef]
  26. Shooshtarian, S.; Ridley, I. The effect of individual and social environments on the users thermal perceptions of educational urban precincts. Sustain. Cities Soc. 2016, 26, 119–133. [Google Scholar] [CrossRef]
  27. Krüger, E.L.; Rossi, F.A. Effect of personal and microclimatic variables on observed thermal sensation from a field study in southern Brazil. Build. Environ. 2011, 46, 690–697. [Google Scholar] [CrossRef]
  28. Cohen, P.; Shashua-Bar, L.; Keller, R.; Gil-Ad, R.; Yaakov, Y.; Lukyanov, V.; Bar, P.; Tanny, J.; Cohen, S.; Potchter, O.; et al. Urban outdoor thermal perception in hot arid Beer Sheva, Israel: Methodological and gender aspects. Build. Environ. 2019, 160, 106169. [Google Scholar] [CrossRef]
  29. Lindner-Cendrowska, K.; Blazejczyk, K. Impact of selected personal factors on seasonal variability of recreationist weather perceptions and preferences in Warsaw (Poland). Int. J. Biometeorol. 2018, 62, 113–125. [Google Scholar] [CrossRef] [PubMed] [Green Version]
  30. Chen, L.; Wen, Y.; Zhang, L.; Xiang, W.N. Studies of thermal comfort and space use in an urban park square in cool and cold seasons in Shanghai. Build. Environ. 2015, 94, 644–653. [Google Scholar] [CrossRef]
  31. Yang, B.; Olofsson, T.; Nair, G.; Kabanshi, A. Outdoor thermal comfort under subarctic climate of north Sweden—A pilot study in Umeå. Sustain. Cities Soc. 2017, 28, 387–397. [Google Scholar] [CrossRef]
  32. ASHRAE. ASHRAE Handbook (SI), Fundamentals; American Society of Heating, Refrigerating and Air-Conditioning Engineers, Inc.: Atlanta, GA, USA, 2017. [Google Scholar]
  33. Höppe, P. The physiological equivalent temperature—A universal index for the biometeorological assessment of the thermal environment. Int. J. Biometeorol. 1999, 43, 71–75. [Google Scholar] [CrossRef]
  34. Jendritzky, G.; De Dear, R.; Havenith, G. UTCI—Why another thermal index? Int. J. Biometeorol. 2012, 56, 421–428. [Google Scholar] [CrossRef] [Green Version]
  35. Matzarakis, A.; Rutz, F.; Mayer, H. Modelling radiation fluxes in simple and complex environments: Basics of the RayMan model. Int. J. Biometeorol. 2010, 54, 131–139. [Google Scholar] [CrossRef] [PubMed] [Green Version]
  36. Matzarakis, A.; Rutz, F.; Mayer, H. Modelling radiation fluxes in simple and complex environments—Application of the RayMan model. Int. J. Biometeorol. 2007, 51, 323–334. [Google Scholar] [CrossRef]
  37. Höppe, P. Heat balance modelling. Experientia 1993, 49, 741–746. [Google Scholar] [CrossRef]
  38. Fiala, D.; Havenith, G.; Brode, P.; Kampmann, B.; Jendritzky, G. UTCI-Fiala multi-node model of human heat transfer and temperature regulation. Int. J. Biometeorol. 2012, 56, 429–441. [Google Scholar] [CrossRef] [Green Version]
  39. Brode, P.; Fiala, D.; Blazejczyk, K.; Holmer, I.; Jendritzky, G.; Kampmann, B.; Tinz, B.; Havenith, G. Deriving the operational procedure for the Universal Thermal Climate Index (UTCI). Int. J. Biometeorol. 2012, 56, 481–494. [Google Scholar] [CrossRef] [PubMed] [Green Version]
  40. Lai, D.; Liu, W.; Gan, T.; Liu, K.; Chen, Q. A review of mitigating strategies to improve the thermal environment and thermal comfort in urban outdoor spaces. Sci. Total Environ. 2019, 661, 337–353. [Google Scholar] [CrossRef]
  41. Beck, H.E.; Zimmermann, N.E.; McVicar, T.R.; Vergopolan, N.; Berg, A.; Wood, E.F. Present and future Köppen-Geiger climate classification maps at 1-km resolution. Sci. Data 2018, 5, 180214. [Google Scholar] [CrossRef] [Green Version]
  42. China Meteorological Bureau, Climate Information Center, Climate Data Office and Tsinghua University, Department of Building Science and Technology. China Standard Weather Data for Analyzing Building Thermal Conditions; China Building Industry Publishing House: Beijing, China, 2005. [Google Scholar]
  43. Ministry of Housing and Urban-Rural Development of the People’s Republic of China. Thermal Design Code for Civil Building; Technical Report No. GB50176-2016; China Architecture and Building Press: Beijing, China, 2016.
  44. Lai, D.; Guo, D.; Hou, Y.; Lin, C.; Chen, Q. Studies of outdoor thermal comfort in northern China. Build. Environ. 2014, 77, 110–118. [Google Scholar] [CrossRef]
  45. Yao, J.; Yang, F.; Zhuang, Z.; Shao, Y.; Yuan, P.F. The effect of personal and microclimatic variables on outdoor thermal comfort: A field study in a cold season in Lujiazui CBD, Shanghai. Sustain. Cities Soc. 2018, 39, 181–188. [Google Scholar] [CrossRef]
  46. Lin, T.P.; De Dear, R.; Hwang, R.L. Effect of thermal adaptation on seasonal outdoor thermal comfort. Int. J. Climatol. 2011, 31, 302–312. [Google Scholar] [CrossRef]
  47. Pantavou, K.; Theoharatos, G.; Santamouris, M.; Asimakopoulos, D. Outdoor thermal sensation of pedestrians in a Mediterranean climate and a comparison with UTCI. Build. Environ. 2013, 66, 82–95. [Google Scholar] [CrossRef]
  48. Villadiego, K.; Velay-Dabat, M.A. Outdoor thermal comfort in a hot and humid climate of Colombia: A field study in Barranquilla. Build. Environ. 2014, 75, 142–152. [Google Scholar] [CrossRef]
  49. Galindo, T.; Hermida, M.A. Effects of thermophysiological and non-thermal factors on outdoor thermal perceptions: The Tomebamba Riverbanks case. Build. Environ. 2018, 138, 235–249. [Google Scholar] [CrossRef] [Green Version]
  50. Makaremi, N.; Salleh, E.; Jaafar, M.Z.; GhaffarianHoseini, A. Thermal comfort conditions of shaded outdoor spaces in hot and humid climate of Malaysia. Build. Environ. 2012, 48, 7–14. [Google Scholar] [CrossRef]
  51. Xia, L.; Lan, L.; Tang, J.; Wan, Y.; Lin, Y.; Wang, Z. Bed heating improves the sleep quality and health of the elderly who adapted to no heating in a cold environment. Energy Build. 2020, 210, 109687. [Google Scholar] [CrossRef]
  52. He, M.; Lian, Z.; Chen, P. Evaluation on the performance of quilts based on young people’s sleep quality and thermal comfort in winter. Energy Build. 2019, 183, 174–183. [Google Scholar] [CrossRef]
  53. Lan, L.; Wargocki, P.; Lian, Z. Quantitative measurement of productivity loss due to thermal discomfort. Energy Build. 2011, 43, 1057–1062. [Google Scholar] [CrossRef]
  54. Xiong, J.; Ma, T.; Lian, Z.; De Dear, R. Perceptual and physiological responses of elderly subjects to moderate temperatures. Build. Environ. 2019, 156, 117–122. [Google Scholar] [CrossRef]
  55. Shen, J.; Zhang, X.; Lian, Z. Impact of wooden versus nonwooden interior designs on office workers’ cognitive performance. Percept. Mot. Ski. 2020, 127, 36–51. [Google Scholar] [CrossRef]
  56. Lan, L.; Tsuzuki, K.; Liu, Y.F.; Lian, Z.W. Thermal environment and sleep quality: A review. Energy Build. 2017, 149, 101–113. [Google Scholar] [CrossRef]
Figure 1. China (with climate zones), Shanghai, and the investigated sites at the university campus.
Sustainability 12 09284 g001
Figure 2. Thermal comfort questionnaire used in this study.
Sustainability 12 09284 g002
Figure 3. General climate of Shanghai recorded at a rural station 20 km from the campus: (a) mean, averaged maximum, averaged minimum air temperature, mean monthly relative humidity, and (b) mean wind speed at 10 m above ground [42].
Sustainability 12 09284 g003
Figure 4. An overview of the demographics of respondents: (a) gender, (b) age, (c) length of residence, and (d) hometown climate: severe cold (SC), cold (C), hot summer and cold winter (HSCW), hot summer and warm winter (HSWW), and mild (M).
Sustainability 12 09284 g004
Figure 5. Distributions of: (a) thermal sensation vote (TSV), (b) humidity sensation vote (HSV), (c) sun sensation vote (SSV), and (d) wind sensation vote (WSV).
Sustainability 12 09284 g005
Figure 6. Distributions of preference votes for air temperature, humidity, solar radiation, and wind speed.
Sustainability 12 09284 g006
Figure 7. Thermal comfort vote distribution.
Sustainability 12 09284 g007
Figure 8. Mean overall comfort score for different levels of thermal sensations.
Sustainability 12 09284 g008
Figure 9. Relationships between: (a) physiologically equivalent temperature (PET) and mean TSV, (b) Universal Thermal Climate Index (UTCI) and mean TSV, for all genders and all age groups.
Sustainability 12 09284 g009
Figure 10. Relationships between: (a) PET and mean overall comfort, (b) UTCI and mean overall comfort, for all genders and all age groups.
Sustainability 12 09284 g010
Figure 11. Relationships between mean TSV and UTCI for males and females.
Sustainability 12 09284 g011
Figure 12. Relationships between mean TSV and UTCI for ages of <20, 20–50, and >50 years.
Sustainability 12 09284 g012
Figure 13. Distributions of overall comfort vote for respondents with different residence lengths in Shanghai.
Sustainability 12 09284 g013
Figure 14. Relationships between UTCI and mean TSV for interviewees with different lengths of residence.
Sustainability 12 09284 g014
Figure 15. Relationships between UTCI and mean TSV for interviewees from severe cold (SC) and cold (C) climate regions and hot summer and cold winter (HSCW) climate regions.
Sustainability 12 09284 g015
Figure 16. Clothing value under different air temperatures, with error bars indicating standard deviations.
Sustainability 12 09284 g016
Figure 17. Clothing value under different air temperatures for males and females.
Sustainability 12 09284 g017
Table 1. Sensors used in this study and their specifications.
ParameterSensorRangeAccuracy
Air temperatureS-THB-M002−40–75 °C±0.2 K at 20 °C
Relative humidityS-THB-M0020–100%±3%
Wind speedS-WSET-A0–45 m/s±1.1 m/s
Global radiationS-LIB-MOO30–1280 W/m2±10 W/m2 or ±5%
Table 2. Microclimate thermal conditions during the survey.
Air Temperature (Ta, °C)Relative Humidity (RH, %)Wind Speed (Va, m/s)Global Radiation (G, W/m2)
Site 1: Grand lawn (May, June, July, October)Mean24.568.30.9239.0
Max.33.179.73.51115.6
Min.19.246.60.01.9
Site 2: Lakeside lawn (June, July, October)Mean27.364.90.4232.4
Max.32.878.42.01025.6
Min.20.947.30.013.1
Site 3: Lakeside shade (June, July, October)Mean24.763.00.2100.2
Max.31.878.81.5745.6
Min.20.746.80.03.1
Publisher’s Note: MDPI stays neutral with regard to jurisdictional claims in published maps and institutional affiliations.

