Do Learning Approaches Set the Stage for Emotional Well-Being in College Students?

 , , ,
, , ,  ,
,
Abstract
1. Introduction
1.1. Students’ Well-Being at University
1.2. Learning Approaches and Students’ Well-Being at University
1.3. Big Five and Learning Approaches
1.4. Big Five and Achievement Emotions
1.5. Learning Approaches and Achievement Emotions
1.6. Objectives and Hypotheses
2. Method
2.1. Participants
2.2. Instruments
2.3. Procedure
2.4. Data Analysis
3. Results
3.1. Big Five and Learning Approaches
3.1.1. Bivariate Association
3.1.2. Multiple Regression
3.2. Learning Approaches and Achievement Emotions
3.2.1. Bivariate Association
3.2.2. Multiple Regression
3.3. Big Five and Achievement Emotions
3.3.1. Bivariate Association
3.3.2. Multiple Regression
3.4. Structural Predictions: Personality, Learning Approaches and Achievement Emotions
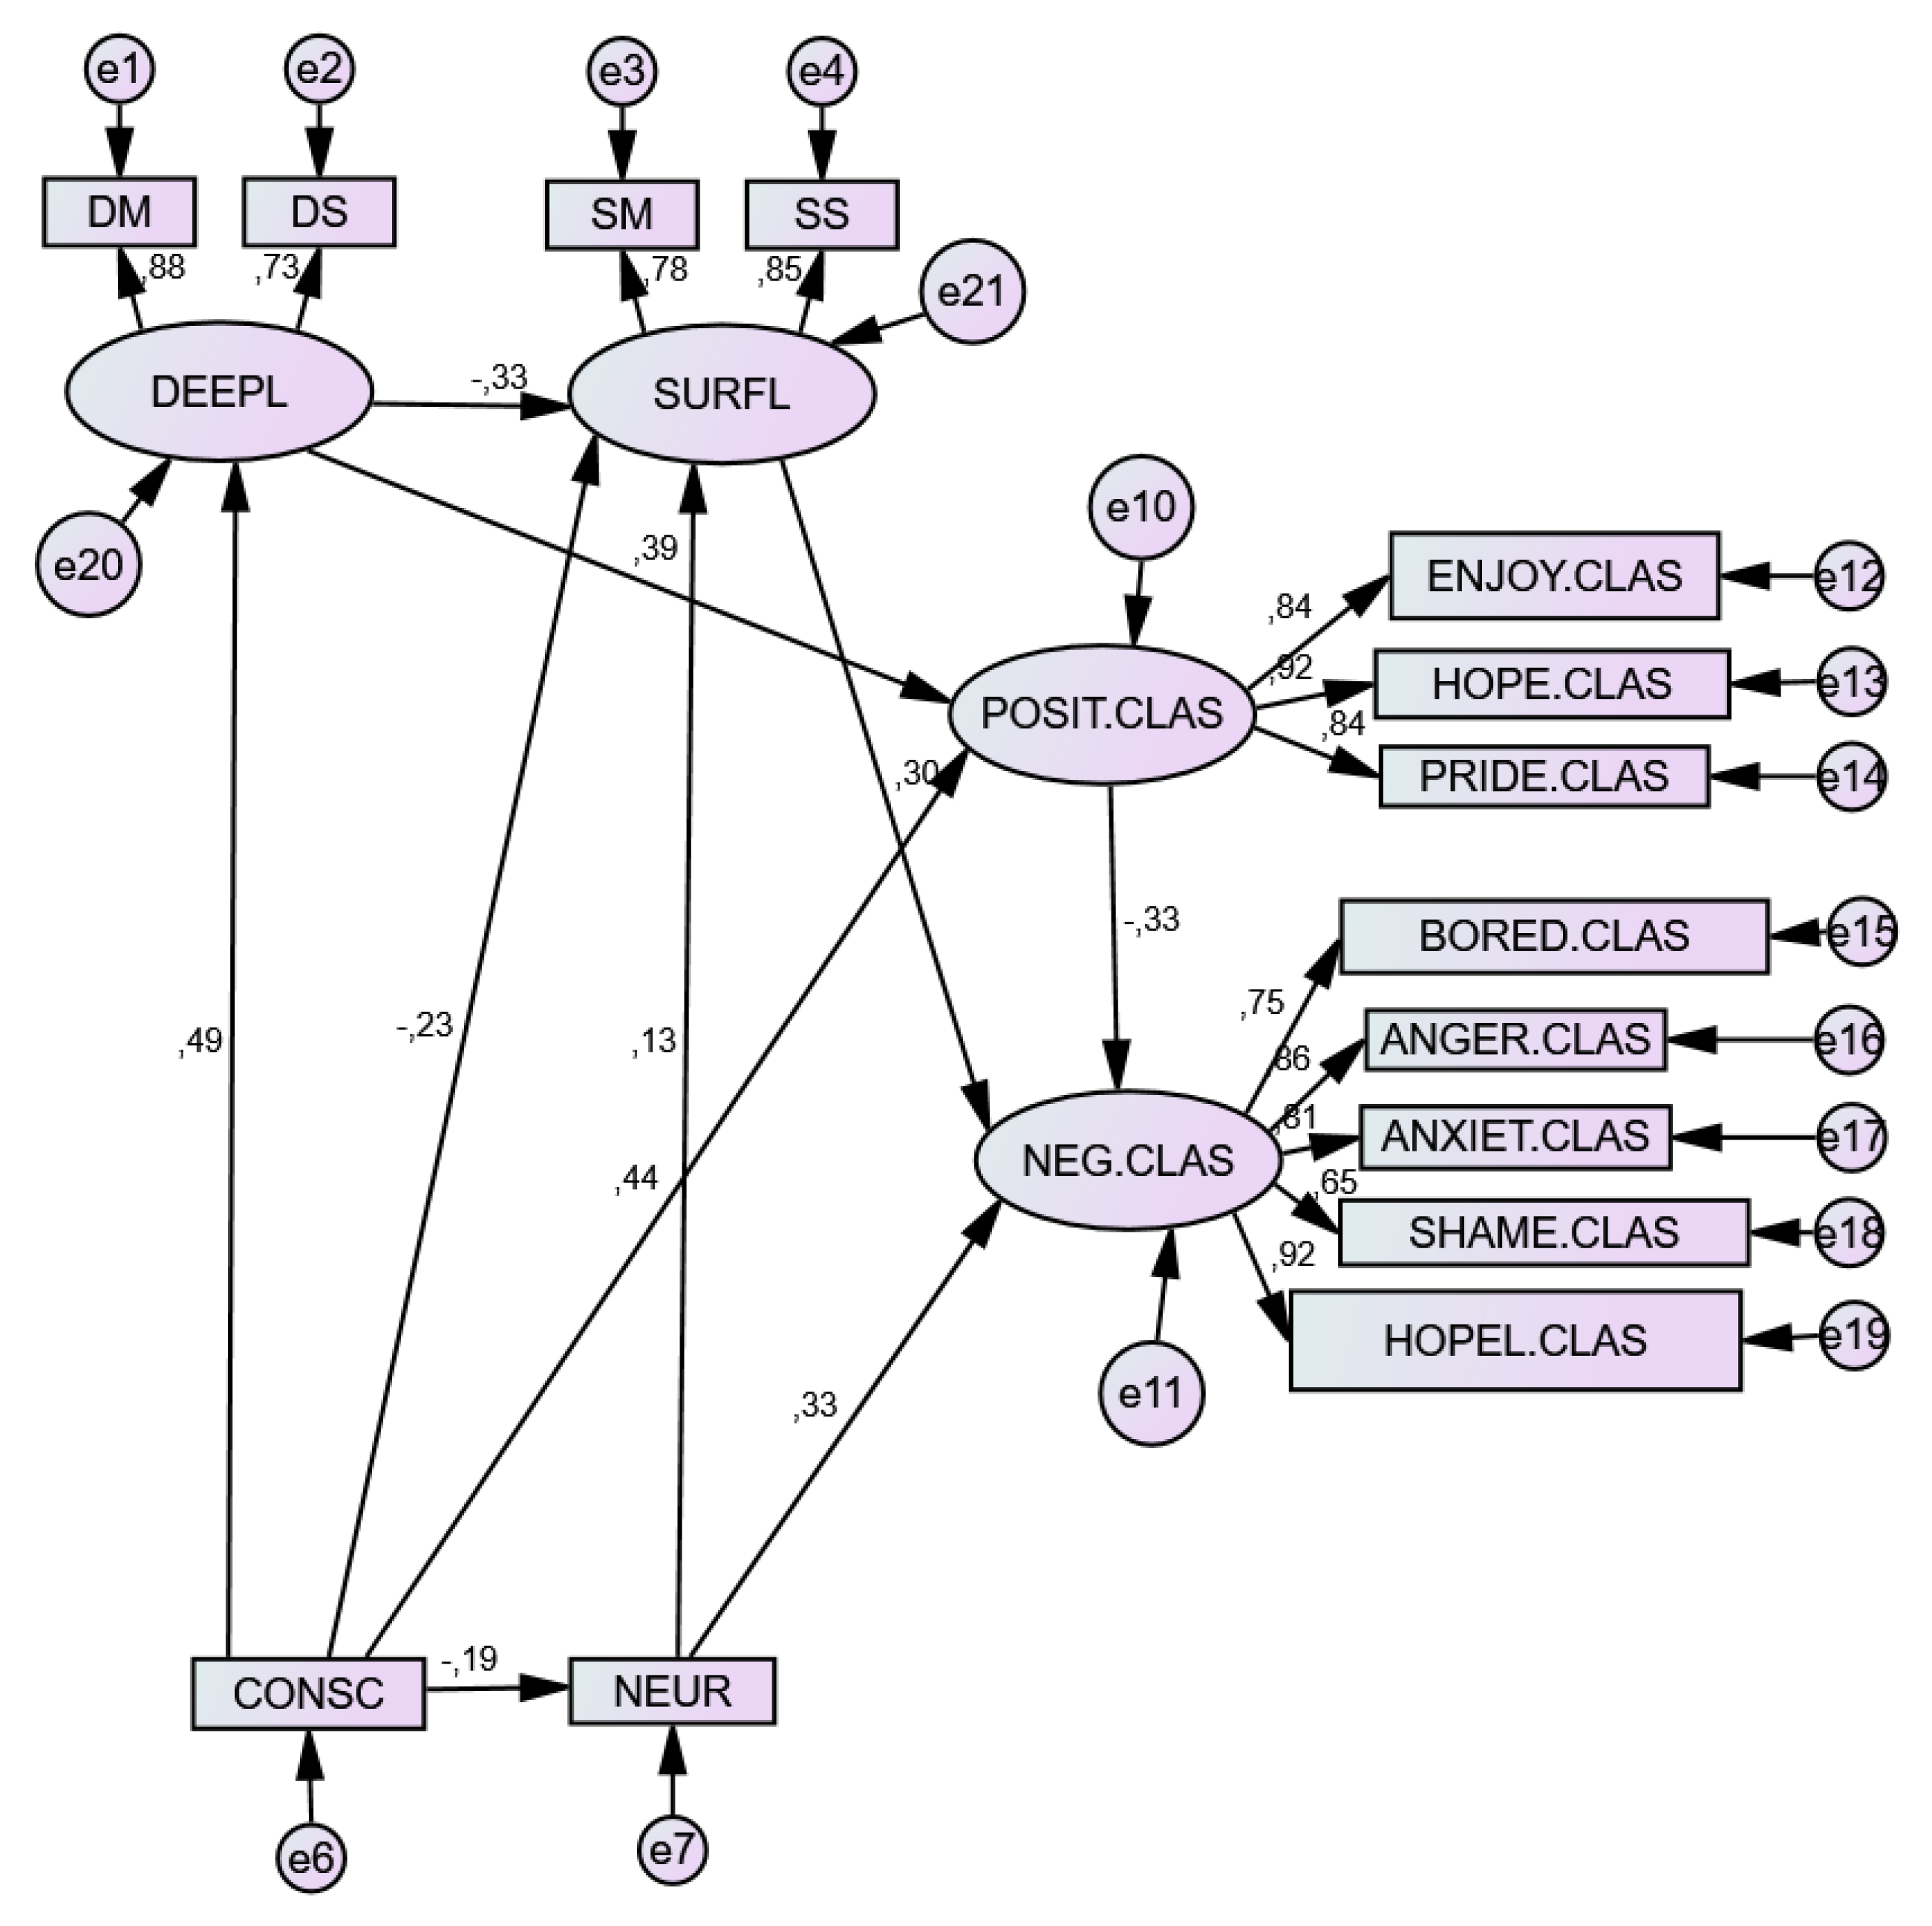
3.5. Model 1. Class
3.5.1. Direct Effects
3.5.2. Indirect Effects
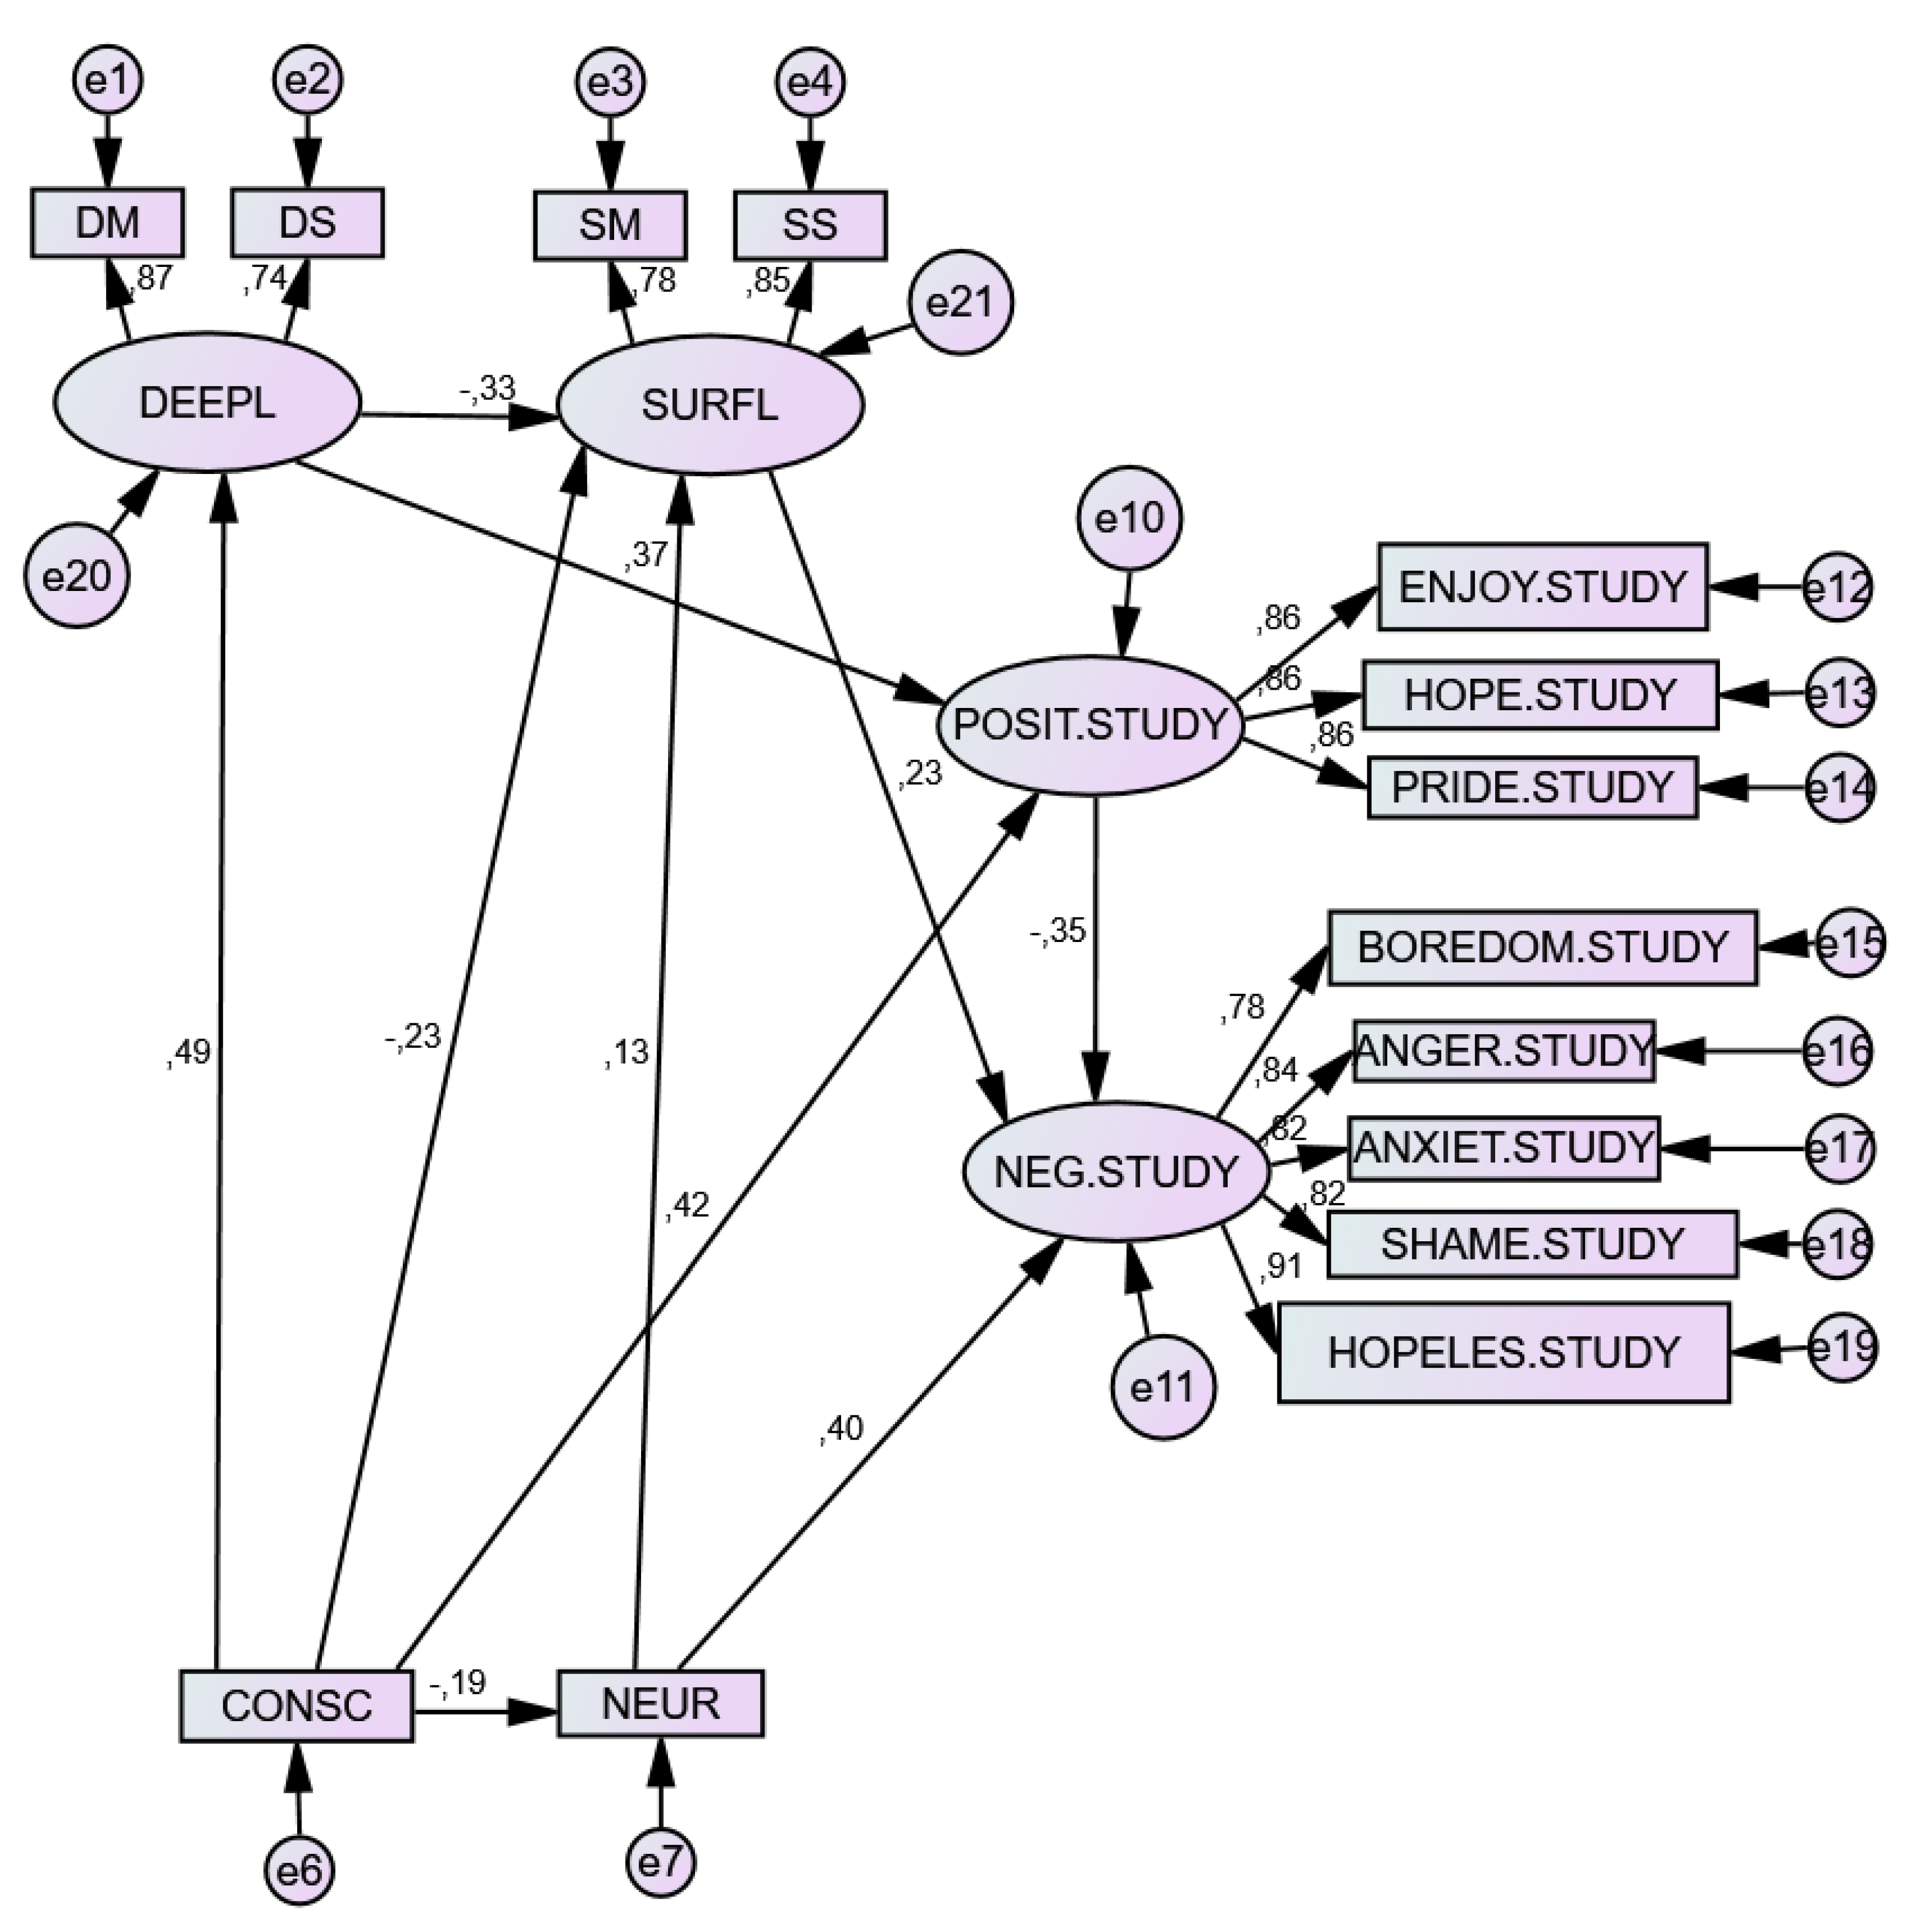
3.6. Model 2. Study Situation
3.6.1. Direct effects
3.6.2. Indirect Effects
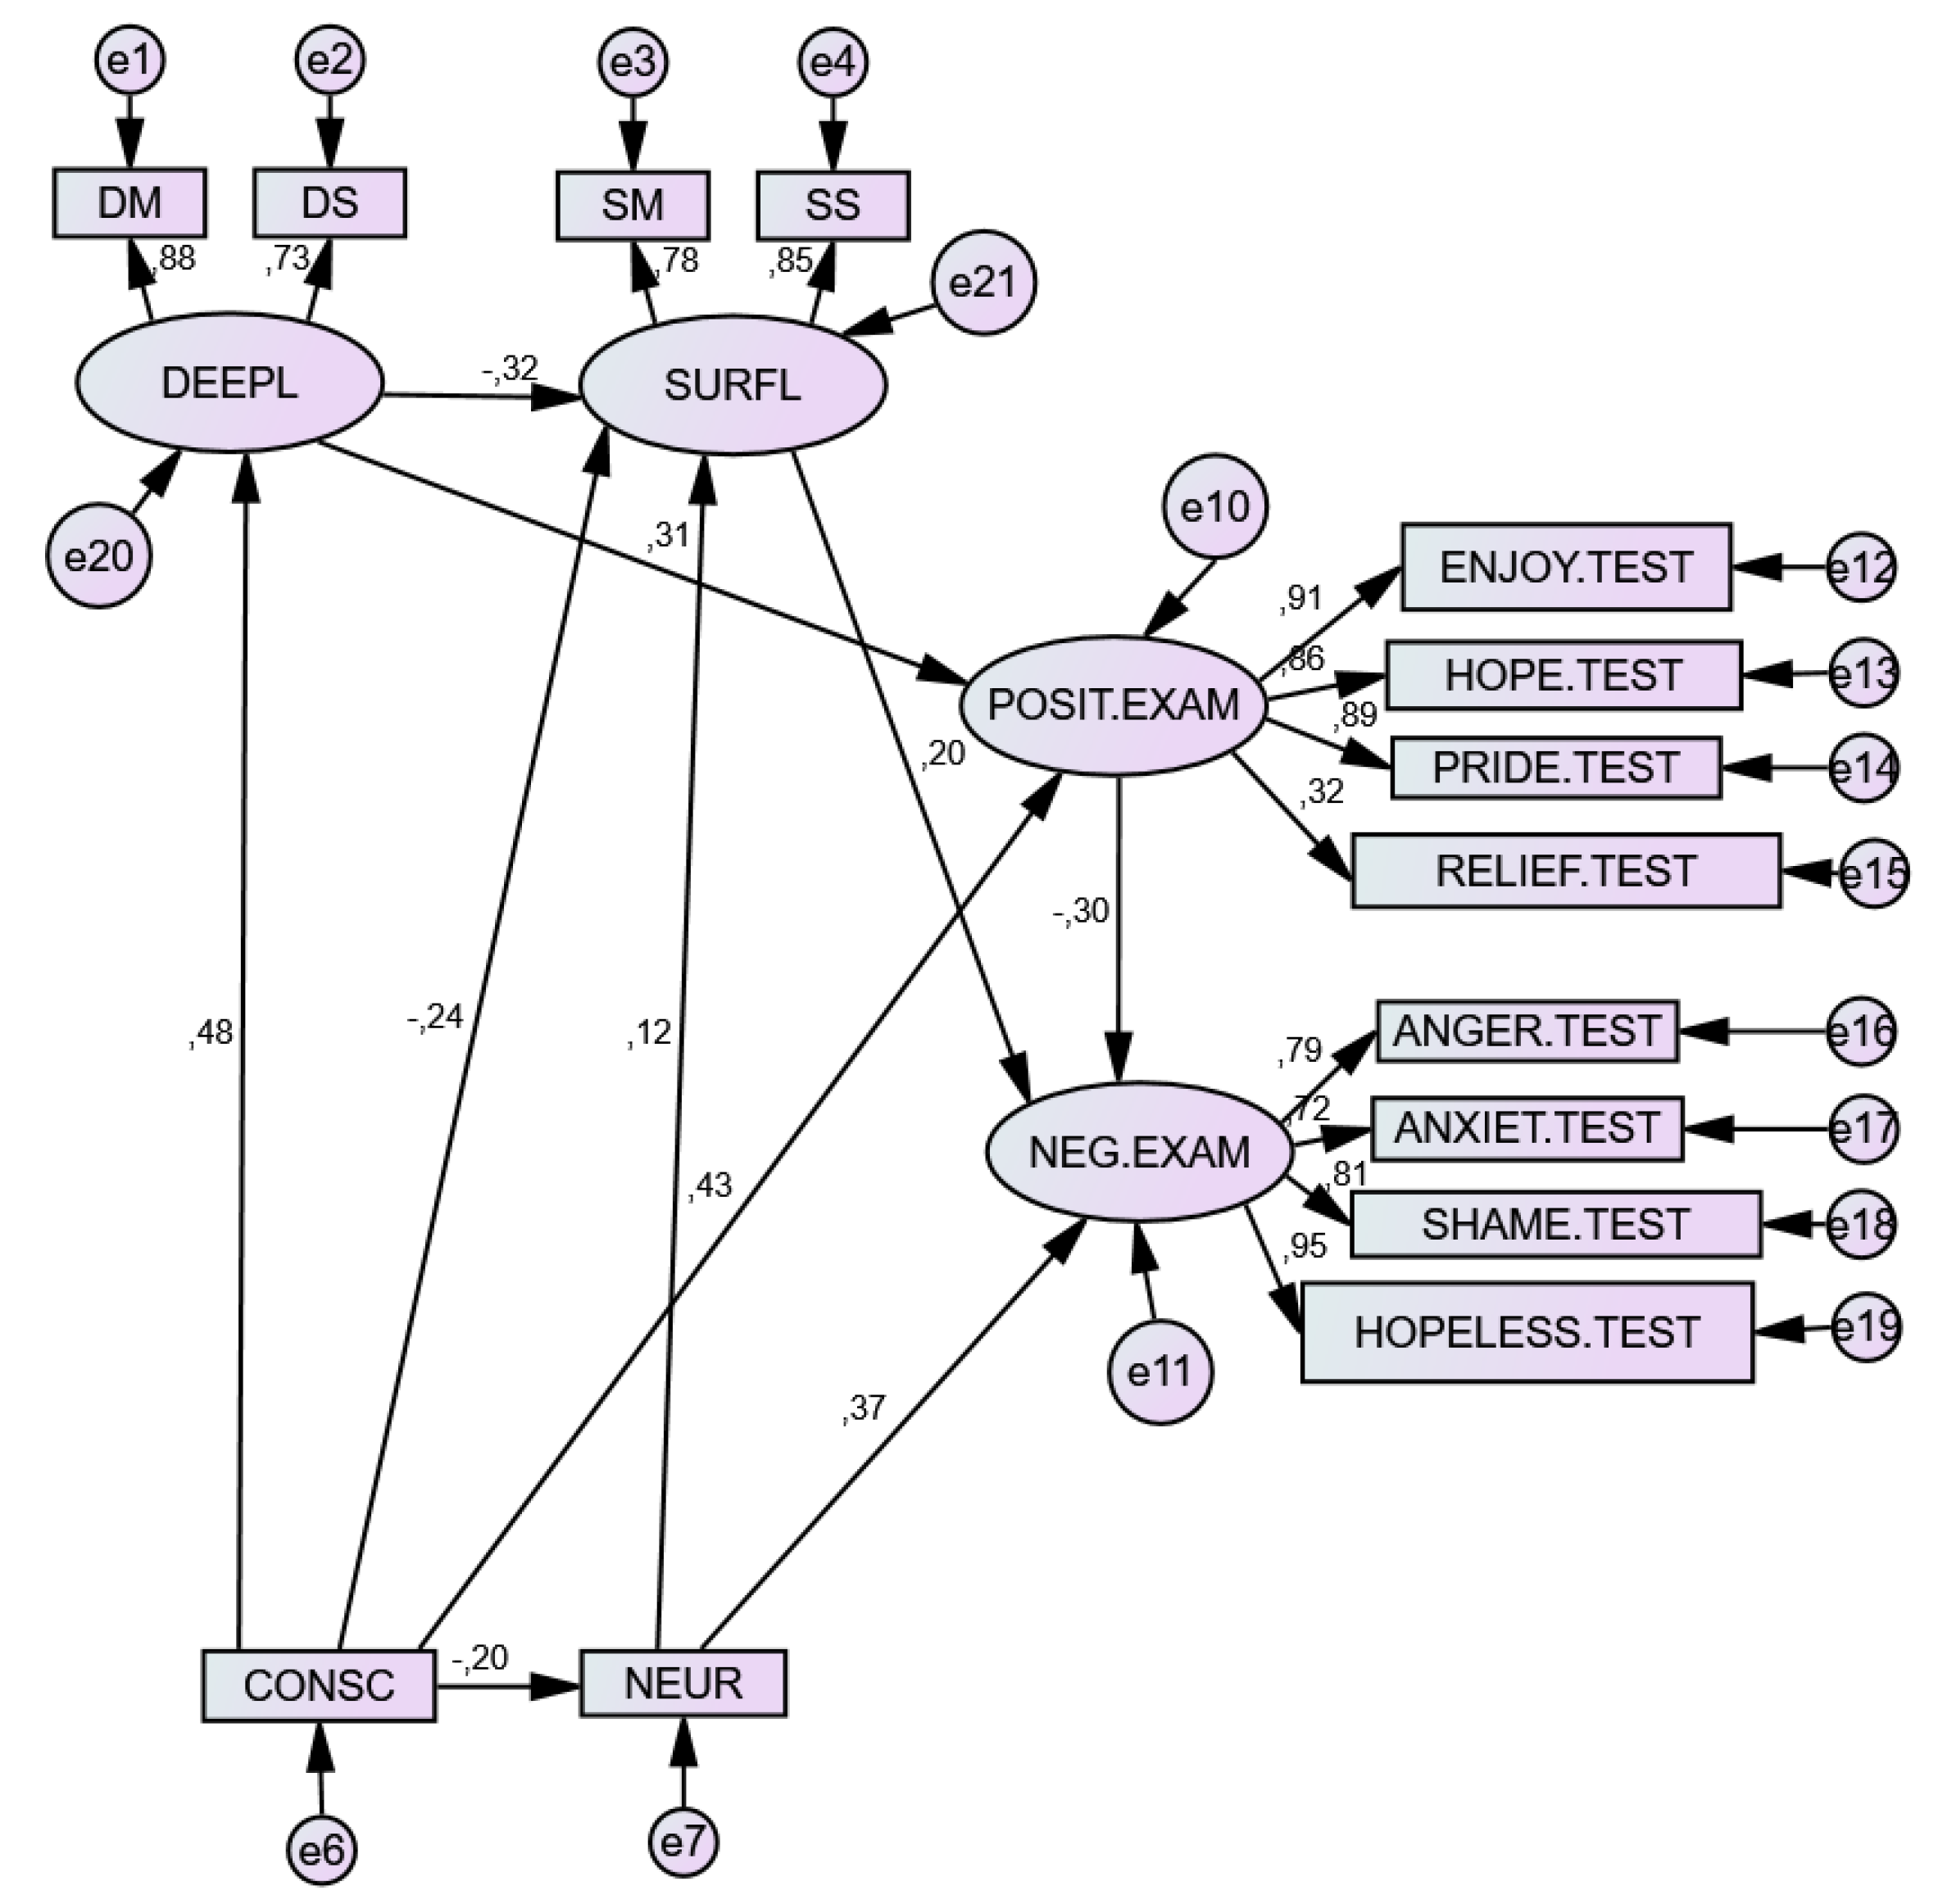
3.7. Model 3. Test Situation
3.7.1. Direct Effects
3.7.2. Indirect Effects
4. Discussion
5. Conclusions
5.1. Limitations and Future Research
5.2. Practical Implications: Psychoeducational Intervention
Author Contributions
Funding
Conflicts of Interest
References
- Denovan, A.; Macaskill, A. Stress and subjective well-being among first year UK undergraduate students. J. Happiness Stud. 2017, 18, 505–525. [Google Scholar] [CrossRef]
- Shokri, O.; Kadivar, P.; Naghsh, Z.; Ghanai, Z.; Daneshvarpour, Z.; Molaei, M. Personality traits, academic stress, and academic performance. J. Educ. Psychol. 2007, 3, 25–48. [Google Scholar]
- Vaez, M.; Laflamme, L. Experienced stress, psychological symptoms, self-rated health and academic achievement: A longitudinal study of Swedish university students. Soc. Behav. Personal. 2008, 36, 183–196. [Google Scholar] [CrossRef]
- Winerman, L. By the numbers: Stress on campus. APA Monit. Psychol. 2017, 48, 88. [Google Scholar]
- de la Fuente, J.; Zapata, L.; Martínez-Vicente, J.M.; Sander, P.; Cardelle-Elawar, M. The role of personal self-regulation and regulatory teaching to predict motivational-affective variables, achievement, and satisfaction: A structural model. Front. Psychol 2015, 6, 399. [Google Scholar] [CrossRef] [PubMed]
- Seligman, M.E.P.; Csikszentmihalyi, M. Positive Psychology—An Introduction. Am. Psychol. 2000, 55, 5–14. [Google Scholar] [CrossRef]
- Stallman, H.M. Psychological distress in university students: A comparison with general population data. Aust. Psychol. 2010, 45, 249–257. [Google Scholar] [CrossRef]
- Karaman, M.A.; Lerma, E.; Vela, J.C.; Watson, J.C. Predictors of academic stress among college students. J. Coll. Couns. 2019, 22, 41–55. [Google Scholar] [CrossRef]
- Douglas, J.A.; Douglas, A.; McClelland, R.J.; Davies, J. Understanding Student Satisfaction and Dissatisfaction: An Interpretive Study in the UK Higher Education Context. Stud. High. Educ. 2015, 40, 329–349. [Google Scholar] [CrossRef]
- Browne, B.A.; Kaldenberg, D.O.; Browne, W.G.; Brown, D.J. Student as Customer: Factors Affecting Satisfaction and Assessments of Institutional Quality. J. Mark. High. Educ. 1998, 8, 1–14. [Google Scholar] [CrossRef]
- Durand-Bush, N.; McNeill, K.; Harding, M.; Dobransky, J. Investigating Stress, Psychological Well-Being, Mental Health Functioning, and Self-Regulation Capacity Among University Undergraduate Students: Is This Population Optimally Functioning? Can. J. Couns. Psychother. 2015, 49, 253–274. [Google Scholar]
- Elassy, N. The Concepts of Quality, Quality Assurance and Quality Enhancement. Qual. Assur. Educ. 2015, 23, 250–261. [Google Scholar] [CrossRef]
- Van der Bijl-Brouwer, M.; Key, T.; Kligyte, G.; Malcolm, B.; Thurgood, C.; Reddy, P. Improving Wellbeing in Universities. In Proceedings of the Relating Systems Thinking and Design—RSD8 Symposium, Chicago, IL, USA, 17–19 October 2019. [Google Scholar]
- Chesser, S.; Murrah, W.; Forbes, S.A. Impact of Personality on Choice of Instructional Delivery and Students’ Performance. Am. J. Distance Educ. 2020, 34, 211–223. [Google Scholar] [CrossRef]
- Kennedy, J.W. The Relationship between the Big Five Personality Traits and Likelihood of Experiencing Flow. Personal. Individ. Differ. 2020, 160, 109931. [Google Scholar] [CrossRef]
- Denovan, A.; Dagnalla, N.; Dhingrab, K.; Grogana, S. Evaluating the Perceived Stress Scale among UK university students: Implications for stress measurement and management. Stud. High. Educ. 2019, 44, 120–133. [Google Scholar] [CrossRef]
- Avry, S.; Chanel, G.; Bétrancourt, M.; Molinari, G. Achievement appraisals, emotions and socio-cognitive processes: How they interplay in collaborative problem-solving? Comput. Hum. 2020, 107, 106267. [Google Scholar] [CrossRef]
- Dyrbye, L.N.; Lipscomb, W.; Thibault, G. Redesigning the learning environment to promote learner well-being and professional development. Acad. Med. 2020, 95, 674–678. [Google Scholar] [CrossRef]
- White, M.A.; Kern, M.L. Positive education: Learning and teaching for wellbeing and academic mastery. Int. J. Wellbeing 2018, 8, 1–17. [Google Scholar] [CrossRef]
- Biggs, J. Assessing Student Approaches to Learning. Aust. Psychol. 1988, 23, 197–206. [Google Scholar] [CrossRef]
- Biggs, J. The Reflective Institution: Assuring and Enhancing the Quality of Teaching and Learning. High. Educ. 2001, 41, 221–238. [Google Scholar] [CrossRef]
- Marton, F. What Does it Take to Learn? Some Implications of an Alternative View of Learning. In Strategies for Research and Development in Higher Education; Entwistle, N.J., Ed.; Swets and Zeitlinger: Amsterdam, The Netherland, 1976; pp. 32–43. [Google Scholar]
- Biggs, J.; Tang, C. Teaching for Quality Learning at University; Open University Press: Berkshire, UK, 2011; p. 106267. [Google Scholar] [CrossRef]
- Biggs, J.; Tang, C. Train-the-Trainers: Implementing Outcomes-Based Teaching and Learning in Malaysian Higher Education. Malays. J. Learn. Instr. 2011, 8, 1–19. [Google Scholar] [CrossRef]
- Entwistle, N.J.; Ramsden, P. Understanding Student Learning; Croom Helm: London, UK, 1983. [Google Scholar]
- Entwistle, N.J. Teaching for Understanding at University: Deep Approaches and Distinctive Ways of Thinking; Palgrave Macmillan: Basingstoke, UK, 2009. [Google Scholar]
- Entwistle, N.J. Student Learning and Academic Understanding: A Research Perspective and Implications for Teaching; Elsevier: New York, NY, USA; Oxford, UK, 2018. [Google Scholar]
- Asikainen, H.; Parpala, A.; Lindblom-Yl€anne, S.; Vanthournout, G.; Coertjens, L. The development of approaches to learning and perceptions of the teaching-learning environment during bachelor level studies and their relation to study success. High. Educ. Stud. 2014, 4, 24–36. [Google Scholar] [CrossRef]
- Asikainen, H.; Parpala, A.; Virtanen, V.; Lindblom-Ylanne, S. The relationship between student learning process, study success and the nature of assessment: A qualitative study. Stud. Educ. Eval. 2013, 39, 211–217. [Google Scholar] [CrossRef]
- Asikainen, H.; Gijbels, D. Do students develop towards more Deep approaches to learning during studies? A systematic review on the development of students’ deep and surface approaches to learning in higher education. Educ. Psychol. Rev. 2017, 29, 205–234. [Google Scholar] [CrossRef]
- de la Fuente, J.; Pichardo, M.C.; Justicia, F.; García-Berbén, A. Learning approaches, Self-Regulation and achievement in three European universities. Psicothema 2008, 20, 705–711. [Google Scholar] [PubMed]
- Monroy, F.; González-Geraldo, J.L. Measuring learning: Discrepancies between conceptions of and approaches to learning. Educ. Stud. 2018, 44, 81–98. [Google Scholar] [CrossRef]
- Parpala, A.; Lindblom-Ylänne, S.; Komulainen, E.; Litmanen, T.; Hirsto, L. Students’ approaches to learning and their experiences of the teaching-learning environment in different disciplines. Br. J. Educ. Psychol. 2010, 80, 269–282. [Google Scholar] [CrossRef]
- Sam, L. Relationship between Learning Approaches and Academic Achievement of Accounting Education Students. Int. J. Sci. Res. Publ. 2020, 10, 919–923. [Google Scholar] [CrossRef]
- Barros, R.; Monteiro, A.; Nejmedinne, F.; Moreira, J.A. The Relationship between Students’ Approach to Learning and Lifelong Learning. Psychology 2012, 4, 792–797. [Google Scholar] [CrossRef][Green Version]
- Rubin, M.; Scevak, J.; Southgate, E.; Macqueen, S.; Williams, P.; Douglas, H. Older women, deeper learning, and greater satisfaction at university: Age and gender predict university students’ learning approach and degree satisfaction. J. Divers. High. Educ. 2018, 11, 82–96. [Google Scholar] [CrossRef]
- Tho, N.D.; Trang, N.T.; Gregory, S. Positivity and quality of college life of business students: The mediating role of learning approaches. Stud. Educ. Eval. 2020, 66, 100908. [Google Scholar] [CrossRef]
- Korhonen, J.; Linnanmäki, K.; Aunio, P. Learning difficulties, academic well-being and educational dropout: A person-centred approach. Learn. Individ. Differ. 2014, 31, 1–10. [Google Scholar] [CrossRef]
- Heikkilä, A. University Students’ Approaches to Learning, Self-Regulation, and Cognitive and Attributional Strategies. Connections with Well-Being and Academic Success. Ph.D. Thesis, University of Helsinki, Helsinki, Finland, 2011. [Google Scholar]
- Muñoz-García, A. Is religión Independent of Students´ Approaches to Learning. Studia Psychol. 2013, 55, 215. [Google Scholar] [CrossRef]
- Baeten, M.; Dochy, F.; Struyven, K.; Parmentier, E.; Vanderbruggen, A. Student-centred learning environments: An investigation into student teachers’ instructional preferences and approaches to learning. Learn. Environ. Res. 2015, 19, 443–462. [Google Scholar] [CrossRef]
- Miller, Z.; Godfroid, A. Emotions in incidental language learning: An individual approach. Stud. Second Lang. Acquis. 2020, 42, 115–141. [Google Scholar] [CrossRef]
- Ruohoniemi, M.; Parpala, A.; Lindblom-Ylänne, S.; Katajavuori, N. Relationships Between Students’ Approaches to Learning, Perceptions of the Teaching, Learning Environment, and Study Success: A Case Study of Third-Year Veterinary Students. J. Vet. Med. Educ. 2010, 37, 282–288. [Google Scholar] [CrossRef]
- Moreira, P.A.; Inman, R.A.; Rosa, I.; Cloninger, K.; Duarte, A.; Cloninger, C.R. The psychobiological model of personality and its association with student approaches to learning: Integrating temperament and character. Scand. J. Educ. Res. 2020, 1–17. [Google Scholar] [CrossRef]
- Von Stumm, S.; Furnham, A.F. Learning approaches: Associations with typical intellectual engagement, intelligence and the big five. Personal. Individ. Differ. 2012, 53, 720–723. [Google Scholar] [CrossRef]
- Busato, V.V.; Prins, F.J.; Elshout, J.J.; Hamaker, C. Intellectual ability, learning style, personality, achievement motivation and academic success of psychology students in higher education. Personal. Individ. Differ. 2000, 29, 1057–1068. [Google Scholar] [CrossRef]
- Farsides, T.; Woodfield, R. Individual differences and undergraduate academic success: The roles of personality, intelligence, and application. Personal Individ. Differ. 2003, 34, 1225–1243. [Google Scholar] [CrossRef]
- Lievens, F.; Ones, D.S.; Dilchert, S. Personality scale validities increase throughout medical school. J. Appl. Psychol. 2009, 94, 1514–1535. [Google Scholar] [CrossRef] [PubMed]
- Chamorro-Premuzic, T.; Furnham, A. Personality predicts academic performance: Evidence from two longitudinal university samples. J. Res. Personal. 2003, 37, 319–338. [Google Scholar] [CrossRef]
- Zhang, L.F. Does the Big Five predict learning approaches? Personal. Individ. Differ. 2003, 34, 1431–1446. [Google Scholar] [CrossRef]
- Chamorro-Premuzic, T.; Furnham, A. Personality, intelligence and approaches to learning as predictors of academic performance. Personal. Individ. Differ. 2008, 44, 1596–1603. [Google Scholar] [CrossRef]
- Abe, J.A.A. Big Five, linguistic styles, and successful online learning. Internet High. Educ. 2020, 45, 100724. [Google Scholar] [CrossRef]
- Sorić, I.; Penezić, Z.; Burić, I. Big Five personality traits, cognitive appraisals and emotion regulation strategies as predictors of achievement emotions. Psihol. Teme 2013, 22, 325–349. [Google Scholar]
- Pekrun, R.; Loderer, K. Emotions and learning from multiple representations and perspectives. In Handbook of Learning from Multiple Representations and Perspectives; Meter, P.V., List, A., Lombardi, D., Kendeou, P., Eds.; Routlegd: New York, NY, USA, 2020. [Google Scholar]
- Loderer, K.; Gentsch, K.; Duffy, M.C.; Zhuc, M.; Xie, X.; Chavarría, J.A.; Vogl, E.; Soriano, C.; Scherer, K.R.; Pekrun, R. Are concepts of achievement-related emotions universal across cultures? A semantic profiling approach. Cogn. Emot. 2020, 1–10. [Google Scholar] [CrossRef]
- Karagiannopoulou, E.; Milienos, F.S.; Athanasopoulos, V. Associations Between Defense Styles, Approaches to Learning, and Achievement Among University Students. Front. Educ. 2018, 3, 53. [Google Scholar] [CrossRef]
- Karagiannopoulou, E.; Milienos, F.S.; Kamtsios, S.; Rentzios, C. Do defence styles and approaches to learning ‘fit together’ in students’ profiles? Differences between years of study. Educ. Psychol. 2020, 40, 570–591. [Google Scholar] [CrossRef]
- de la Fuente, J.; Paoloni, P.; Kauffman, D.; Yilmaz Soylu, M.; Sander, P.; Zapata, L. Big Five, Self-Regulation, and Coping Strategies as Predictors of Achievement Emotions in Undergraduate Students. Int. J. Environ. Res. Public Health 2020, 17, 3602. [Google Scholar] [CrossRef] [PubMed]
- Sander, P.; de la Fuente, J. Modelling students’ academic confidence, personality and academic emotions. Curr. Psychol. 2020. [Google Scholar] [CrossRef]
- Monteiro, S.C.; da Silva Almeida, L.; Vasconcelos, R.M.D.C.F. Abordagens à aprendizagem, autorregulação e motivação: Convergência no desempenho acadêmico excelente. Learning approaches, self-regulation and motivation: Converging in excellent academic performance. Revista Brasileira Orientação Profissional 2012, 13, 153–162. [Google Scholar]
- Endedijk, M.D.; Vermunt, J.D. Relations between student teachers’ learning patterns and their concrete learning activities. Stud. Educ. Eval. 2013, 39, 56–65. [Google Scholar] [CrossRef]
- Vermunt, J.D. Relations between student learning patterns and personal and contextual factors and academic performance. High. Educ. 2005, 49, 205–234. [Google Scholar] [CrossRef]
- de la Fuente, J.; Sander, P.; Kauffman, D.; Yilmaz-Soylu, M. Differential Effects of Self- vs External- Regulation on Learning Approaches, Academic Achievement and Satisfaction in Undergraduate Students. Front. Psychol. 2020, 11, 1773. [Google Scholar] [CrossRef]
- Entwistle, N.; McCune, V.; Hounsell, J. Investigating ways of enhancing university teaching-learning environments: Measuring students’ approaches to studying and perceptions of teaching. In Powerful Learning Environments: Unravelling Basic Components and Dimensions, 1st ed.; de Corte, E., Verschaffel, L., Entwistle, N., van Merriënboer, J., Eds.; Pergamon: Amsterdam, The Netherlands, 2003; p. 89. [Google Scholar]
- Kulakow, S. How autonomy support mediates the relationship between self-efficacy and approaches to learning. J. Educ. Res. 2020, 113, 13–25. [Google Scholar] [CrossRef]
- Obergriesser, S.; Stoeger, H. Students’ emotions of enjoyment and boredom and their use of cognitive learning strategies–How do they affect one another? Learn. Instr. 2020, 66, 101285. [Google Scholar] [CrossRef]
- Schweder, S. The role of control strategies, self-efficacy, and learning behavior in self-directed learning. Int. J. Sch. Educ. Psychol. 2019, 7, 29–41. [Google Scholar] [CrossRef]
- Mohr, S.; Grahn, H.; Krohne, C.; Brätz, J.; Guse, A.H. Academic emotions during an interprofessional learning episode in a clinical context: Assessing within-and between-variation. J. Interprof. Care 2020, 1–9. [Google Scholar] [CrossRef]
- Boekaerts, M. Understanding students’ affective processes in the classroom. In Emotion in Education; Schutz, P.A., Pekrun, R., Eds.; Elsevier: San Diego, CA, USA, 2007; pp. 37–56. [Google Scholar]
- Schweder, S. Mastery goals, positive emotions and learning behavior in self-directed vs. teacher-directed learning. Eur. J. Psychol. Educ. 2020, 35, 205–223. [Google Scholar] [CrossRef]
- de la Fuente, J.; Lahortiga-Ramos, F.; Laspra-Solís, C.; Maestro-Martín, C.; Alustiza, I.; Aubá, E.; Martín-Lanas, R. A Structural Equation Model of Achievement Emotions, Coping Strategies and Engagement-Burnout in Undergraduate Students: A Possible Underlying Mechanism in Facets of Perfectionism. Int. J. Environ. Res. Public Health 2020, 17, 2106. [Google Scholar] [CrossRef]
- Carrasco, M.A.; Holgado, P.; del Barrio, M.V. Dimensionalidad del cuestionario de los cinco grandes (BFQ-N) en población Española Dimensionality of the Big Five questionnaire (BFQ-N) in Spanish population. Psicothema 2005, 17, 286–291. [Google Scholar]
- Barbaranelli, C.; Caprara, G.V.; Rabasca, A.; Pastorelli, C. A questionnaire for measuring the Big Five in late childhood. Personal. Individ. Differ. 2003, 34, 645–664. [Google Scholar] [CrossRef]
- de la Fuente, J. Five Scale, BFQ-U. Adaptation for Young University Students; University of Almería: Almería, Spain, 2014. [Google Scholar]
- Biggs, J.; Kember, D.; Leung, D.Y.P. The revised two-factor study process questionnaire: R-SPQ-2F. Br. J. Educ. Psychol. 2001, 71, 133–149. [Google Scholar] [CrossRef]
- Justicia, F.; Pichardo, M.C.; Cano, F.; Berbén, A.B.; de la Fuente, J. The revised two-factor study process questionnaire (RSPQ-2F): Exploratory and confirmatory factor analyses at item level. Eur. J. Psychol. Educ. 2008, 23, 355–372. [Google Scholar] [CrossRef]
- Pekrun, R.; Goetz, T.; Perry, R.P. Academic Emotions Questionnaire (AEQ)—User’s Manual; Department of Psychology, University of Munich: Munich, Germany, 2005; Available online: https://es.scribd.com/doc/217451779/2005-AEQ-Manual (accessed on 24 August 2020).
- de la Fuente, J.; Martínez-Vicente, J.M.; Peralta-Sánchez, F.J.; Garzón-Umerenkova, A.; Vera, M.M.; Paoloni, P. Applying the SRL vs. ERL Theory to the Knowledge of Achievement Emotions in Undergraduate University Students. Front. Psychol. 2019, 10, 2070. [Google Scholar] [CrossRef]
- de la Fuente, J.; López, M.; Zapata, L.; Sollinas, G.; Fadda, S. Improving mental health through an online self-assessment and self-help e-Utility in university students. In Progress in Education; Nata, R.V., Ed.; Nova Publisher: New York, NY, USA, 2015; Volume 33, pp. 63–74. [Google Scholar]
- Tabachnick, B.G.; Fidell, L.S. Cleaning up your act: Screening data prior to analysis. Using Multivar. Stat. 2001, 5, 61–116. [Google Scholar]
- Buelow, M.T.; Cayton, C. Relationships between the Big Five personality characteristics and performance on behavioral decision making tasks. Personal. Individ. Differ. 2020, 160, 109931. [Google Scholar] [CrossRef]
- Chamorro-Premuzic, T.; Furnham, A. Mainly Openness: The relationship between the Big Five personality traits and learning approaches. Learn. Individ. Differ. 2009, 19, 524–529. [Google Scholar] [CrossRef]
- Ranelluci, J.; Hall, N.C.; Goetz, T. Achievement goals, emotions, learning, and performance: A process model. Motiv. Sci. 2015, 1, 98–120. [Google Scholar] [CrossRef]
- Trigwell, K.; Ellis, R.A.; Han, F. Relations between students’ approaches to learning, experienced emotions and outcomes of learning. Stud. High. Educ. 2012, 37, 811–824. [Google Scholar] [CrossRef]
- Sharp, J.G.; Sharp, J.C.; Young, E. Academic boredom, engagement and the achievement of undergraduate students at university: A review and synthesis of relevant literature. Res. Pap. Educ. 2020, 35, 144–184. [Google Scholar] [CrossRef]
- Boekaerts, M.; Pekrun, R. Emotions and emotion regulation in academic settings. In Handbook of Educational Psychology, 3rd ed.; Corno, L., Anderman, E.M., Eds.; Routledge: New York, NY, USA, 2016; pp. 76–91. [Google Scholar]
- de la Fuente, J.; Amate, J.; González-Torres, M.C.; Artuch, R.; García-Torrecillas, J.M.; Fadda, S. Effects of Levels of Self-Regulation and Regulatory Teaching on Strategies for Coping with Academic Stress in Undergraduate Students. Front. Psychol. 2020, 11, 22. [Google Scholar] [CrossRef]
- Fiedler, K.; Beier, S. Affect and cognitive processes in educational contexts. In International Handbook of Emotion in Education; Pekrun, R., Linnenbrink-Garcia, L., Eds.; Routledge: New York, NY, USA, 2014; pp. 36–55. [Google Scholar]
- Padang, P.A.P. How Is the Student’s Personality in Implementing Science and Technology for Entrepreneurship Learning with a Production-Based Learning Approach in Higher Education? J. Eng. Appl. Sci. 2020, 15, 213–219. [Google Scholar] [CrossRef]
- de la Fuente, J.; Paoloni, P.V.; Vera-Martínez, M.M.; Garzón-Umerenkova, A. Effect of Levels of Self-Regulation and Situational Stress on Achievement Emotions in Undergraduate Students: Class, Study and Testing. Int. J. Environ. Res. Public Health 2020, 17, 4293. [Google Scholar] [CrossRef]
- Acee, T.W.; Kim, H.; Kim, H.J.; Kim, J.-C.; Ning, H.R.; Chu, R.; Kim, M.; Cho, Y.; Wicker, F.W. Academic boredom in under- and over-challenging situations. Contemp. Educ. Psychol. 2010, 35, 17–27. [Google Scholar] [CrossRef]
- Richardson, J.T.E. Approaches to Learning or Levels of Processing: What did Marton and Säljö (1976a) Really Say? The Legacy of the Work of the Göteborg Group in the 1970s. Interchange 2015, 46, 239–269. [Google Scholar] [CrossRef]
- Richardson, M.; Abraham, C.; Bond, R. Psychological correlates of university students’ academic performance: A systematic review and meta-analysis. Psychol. Bull. 2012, 138, 353–387. [Google Scholar] [CrossRef]
- Kaplan, A.; Patrick, H. Learning environments and motivation. In Handbook of Motivation at School; Wentzel, K.R., Miele, D.B., Eds.; Routledge: New York, NY, USA, 2016; pp. 251–275. [Google Scholar]
- Vecchione, M.; Alessandri, G.; Barbaranelli, C.; Caprara, G. Gender differences in the Big Five personality development: A longitudinal investigation from late adolescence to emerging adulthood. Personal. Individ. Differ. 2012, 53, 740–746. [Google Scholar] [CrossRef]
- Bost, L.W.; Riccomini, P.J. Effective instruction. Remedial Spec. Educ. 2006, 27, 301–311. [Google Scholar] [CrossRef]
- Du Plessis, A.E. Teacher and Student Well-being: The Policy Link. In Out-of-Field Teaching and Education Policy; Springer: Singapore, 2020; pp. 173–205. [Google Scholar]
- Vansteenkiste, M.; Sierens, E.; Goossens, L.; Soenens, B.; Dochy, F.; Mouratidis, A.; Beyers, W. Identifying configurations of perceived teacher autonomy support and structure: Associations with self-regulated learning, motivation and problem behavior. Learn. Instr. 2012, 22, 431–439. [Google Scholar] [CrossRef]
- Yerdelen, S.; Sungur, S. Multilevel Investigation of Students’ Self-Regulation Processes in Learning Science: Classroom Learning Environment and Teacher Effectiveness. Int. J. Sci. Math. Educ. 2019, 17, 89–110. [Google Scholar] [CrossRef]
- Reindl, M.; Tulis, M.; Dresel, M. Profiles of emotional and motivational self-regulation following errors: Associations with learning. Learn. Individ. Differ. 2020, 77, 101806. [Google Scholar] [CrossRef]
- Li, C. A positive psychology perspective on chinese EFL students’ trait emotional intelligence, foreign language enjoyment and EFL learning achievement. J. Multiling. Multicult. Dev. 2020, 41, 246–263. [Google Scholar] [CrossRef]
- Cao, Y.; Postareff, L.; Lindblom-Ylanne, L.; Toom, A. Teacher educators’ approaches to teaching and connections with their perceptions of the closeness of their research and teaching. Teach. Teach. Educ. 2019, 85, 125–136. [Google Scholar] [CrossRef]


| Learning Approaches | E | C | N | A | O |
|---|---|---|---|---|---|
| DEEP MOTIV | 0.232 ** | 0.413 ** | −0.098 * | 0.226 ** | 0.404 ** |
| DEEP STRAT | 0.194 ** | 0.413 ** | −0.049 | 0.155 ** | 0.312 ** |
| DEEP APPR | 0.227 ** | 0.458 ** | −0.083 * | 0.208 ** | 0.394 ** |
| SURFACE MOTI | −0.129 ** | −0.365 ** | 0.129 ** | −0.140 * | −0.222 ** |
| SURFACE STRAG | −0.097 * | −0.343 ** | 0.197 ** | −0.0143 * | −0.249 ** |
| SURFACE APPR | −0.139 ** | −0.387** | 0.188 ** | −0.148 ** | −0.254 ** |
| Learning Approaches | E | C | N | A | O | Effect | R Square |
|---|---|---|---|---|---|---|---|
| DEEP MOT | −0.017 | 0.294 ** | −0.005 | 0.005 | 0.276 ** | F(5511) = 31.521 ** | 0.234 |
| DEEP STRAT | 0.001 | 0.381 ** | 0.040 | −0.045 | 0.155 ** | F(5511) = 25.664 ** | 0.201 |
| DEEP APPRO | −0.112 | 0.374 ** | −0.019 | −0.022 | 0.240 ** | F(5511) = 35.346 ** | 0.246 |
| SURF MOT | 0.026 | −0.333 ** | 0.076 * | 0.050 | −0.069 | F(5511) = 15.401 ** | 0.131 |
| SURF STRAT | 0.072 | −0.279 ** | 0.139 ** | 0.082 | −0.183 ** | F(5511) = 17.967 ** | 0.149 |
| SURF APPRO | 0.039 | −0.320 ** | 0.129 ** | 0.068 | −0.137 ** | F(5511) = 19.279 ** | 0.160 |
| CLASS | DM | DS | DA | SM | SS | SA |
| Positive | 0.521 ** | 0.413 ** | 0.516 ** | −0.327 *** | −0.328 ** | −0.344 ** |
| Enjoyment | 0.515 ** | 0.387 ** | 0.542 ** | −0.329 ** | −0.336 ** | −0.356 ** |
| Hope | 0.479 ** | 0.395 ** | 0.396 ** | −0.326 ** | −0.307 ** | −0.346 ** |
| Pride | 0.413 ** | 0.350 ** | 0.374 ** | −0.293 ** | −0.232 ** | −0.279 ** |
| Negative | −0.224 ** | −0.150 ** | −0.212 ** | 0.327 ** | 0.344 ** | 0.371 ** |
| Boredom | −0.334 ** | −0.260 ** | −0.361 ** | 0.394 ** | 0.429 ** | 0.448 ** |
| Anger | −0.249 ** | −0.175 ** | −0.242 ** | 0.366 ** | 0.373 ** | 0.405 ** |
| Anxiety | −0.161 ** | −0.075 * | −0.146 ** | 0.213 ** | 0.272 ** | 0.270 ** |
| Shame | −0.126 ** | −0.046 | −0.097 * | 0.221 ** | 0.249 ** | 0.262 ** |
| Hopelessness | −0.263 ** | −0.187 * | −0.230 ** | 0.299 ** | 0.330 ** | 0.352 ** |
| STUDY | DM | DS | DA | SM | SS | SA |
| Positive | 0.472 ** | 0.395 ** | 0.478 ** | −0.351 ** | −0.343 ** | −0.373 ** |
| Enjoyment | 0.538 ** | 0.444 ** | 0.542 ** | −0.329 ** | −0.366 ** | −0.356 ** |
| Hope | 0.394 ** | 0.328 ** | 0.396 ** | −0.326 ** | −0.307 ** | −0.346 ** |
| Pride | 0.369 ** | 0.313 ** | 0.374 ** | −0.293 ** | −0.232 ** | −0.279 ** |
| Negative | −0.296 ** | −0.183 ** | −0.266 ** | 0.363 ** | 0.391 ** | 0.413 ** |
| Boredom | −0.388 ** | −0.263 ** | −0.361 ** | 0.394 ** | 0.429 ** | 0.488 ** |
| Anger | −0.257 ** | −0.175 ** | −0.242 ** | 0.366 ** | 0.373 ** | 0.405 ** |
| Anxiety | −0.168 * | −0.094 | −0.146 * | 0.213 ** | 0.272 ** | 0.270 ** |
| Shame | −0.133 * | −0.046 | −0.097 * | 0.221 ** | 0.241 ** | 0.262 ** |
| Hopelessness | −0.263 ** | −0.154 * | −0.230 ** | 0.229 ** | 0.330 ** | 0.372 ** |
| TEST | DM | DS | DA | SM | SS | SA |
| Positive | 0.438 ** | 0.339 ** | 0.427 ** | −0.280 ** | −0.264 ** | −0.298 ** |
| Enjoyment | 0.441 ** | 0.322 ** | 0.427 ** | −0.267 ** | −0.278 ** | −0.298 ** |
| Hope | 0.396 ** | 0.336 ** | 0.405 ** | −0.279 ** | −0.257 ** | −0.298 ** |
| Pride | 0.371 ** | 0.284 ** | 0.359 ** | −0.238 ** | −0.188 ** | −0.238 ** |
| Relief | 0.080 * | 0.070 * | 0.84 * | −0.059 | −0.012 | −0.039 |
| Negative | −0.208 ** | −0.85 | −0.161 ** | 0.237 ** | 0.307 ** | 0.307 ** |
| Anger | −0.196 ** | −0.087 * | −0.156 ** | 0.297 ** | 0.318 ** | 0.334 ** |
| Anxiety | −0.131 ** | −0.048 | −0.099 ** | 0.100 ** | 0.195 ** | 0.175 ** |
| Shame | −0.067 | −0.006 | −0.036 | 0.175 ** | 0.170 ** | 0.197 ** |
| Hopelessness | −0.228 ** | −0.115 ** | −0.189 * | 0.293 ** | 0.325 ** | 0.342 ** |
| CLASS | DM | DS | DA | SM | SS | SA |
| Enjoyment | 0.333 *** | 0.109 | 0.251 ** | −0.129 | −0.069 | −0.086 |
| Hope | 0.166 * | 0.242 ** | 0.221 ** | −0.035 | −0.125 | −0.114 |
| Pride | 0.004 | 0.071 | 0.036 | −0.011 | 0.000 | 0.015 |
| Boredom | −0.171 ** | −0.174 * | −0.183 ** | −0.107 | 0.245 *** | 0.208 ** |
| Anger | −0.226 ** | −0.194 * | −0.227 ** | −0.065 | −0.173 * | 0.137 |
| Anxiety | −0.055 | 0.097 | 0.027 | −0.075 | −0.006 | −0.048 |
| Shame | 0.084 | −0.003 | 0.048 | −0.021 | 0.011 | 0.008 |
| Hopelessness | −0.151 * | −0.149 * | −0.169 * | 0.360 *** | 0.267 *** | 0.335 ** |
| F(8431) | 24.260 | 14.996 | 23.940 *** | 12.779 | 14.798 | 15.559 ** |
| R square | 0.310 | 0.210 | 0.310 | 0.191 | 0.215 | 0.231 |
| STUDY | DM | DS | DA | SM | SS | SA |
| Enjoyment | 0.588 *** | 0.470 *** | 0.585 *** | −0.076 | −0.204 *** | −0.160 * |
| Hope | −0.013 | 0.035 | 0.007 | −0.060 | −0.068 | −0.091 |
| Pride | −0.139 * | −0.081 | −0.119 | −0.157 * | 0.055 | −0.023 |
| Boredom | −0.245 *** | −0.107 | −0.185 ** | 0.212 ** | 0.273 *** | 0.243 ** |
| Anger | 0.107 | 0.029 | 0.069 | 0.234 ** | 0.157 * | 0.221 ** |
| Anxiety | −0.047 | −0.061 | −0.064 | −0.084 | −0.032 | −0.060 |
| Shame | 0.099 | 0.198 * | 0.178 ** | 0.014 | −0.076 | −0.048 |
| Hopelessness | −0.087 | −0.085 | −0.106 | −0.093 | 0.036 | −0.007 |
| F(8420) | 29.714 *** | 17.149 ** | 29.583 *** | 17.357 ** | 19.783 ** | 21.003 *** |
| R square | 0.364 | 0.248 | 0.365 | 0.251 | 0.269 | 0.298 |
| TEST | DM | DS | DA | SM | SS | SA |
| Enjoyment | 0.334 *** | 0.211 ** | 0.334 *** | −0.142 | −0.242 ** | −0.196 * |
| Hope | 0.194 ** | 0.294 *** | 0.194 ** | −0.068 | −0.016 | −0.054 |
| Pride | −0.20 | −0.009 | −0.020 | −0.051 | 0.016 | −0.018 |
| Relief | −0.037 | −0.075 | −0.037 | 0.038 | 0.006 | 0.022 |
| Anger | −0.153 * | −0.115 | −0.153 * | 0.243 ** | 0.257 ** | 0.268 ** |
| Anxiety | −0.019 | 0.121 | 0.019 | −0.204 ** | −0.054 | −0.132 * |
| Shame | 0.160 * | 0.134 * | 0.160 * | −0.054 | −0.167 * | −0.117 |
| Hopelessness | −0.031 | −0.024 | −0.031 | 0.164 * | 0.194 * | 0.201 * |
| F(8420) | 18.034 | 11.054 | 18.304 ** | 9.460 | 11.780 | 12.323 ** |
| R square | 0.259 | 0.179 | 0.259 | 0.152 | 0.182 | 0.192 |
| CLASS | E | C | N | A | O |
| Positive | 0.380 ** | 0.586 ** | −0.146 ** | 0.325 ** | 0.523 ** |
| Enjoyment | 0.285 ** | 0.482 ** | −0.152 ** | 0.275 ** | 0.517 ** |
| Hope | 0.382 ** | 0.628 ** | −0.204 ** | 0.341 ** | 0.417 ** |
| Pride | 0.369 ** | 0.505 ** | −0.066 | 0.277 ** | 0.413 ** |
| Negative | −0.246 ** | −0.426 ** | 0.369 ** | −0.237 ** | −0.373 ** |
| Boredom | −0.081 * | −0.437 ** | 0.335 ** | −0.193 ** | −0.202 ** |
| Anger | −0.177 ** | −0.384 ** | 0.338 ** | −0.304 ** | −0.206 ** |
| Anxiety | −0.233 ** | −0.272 ** | 0.418 ** | −0.160 ** | −0.332 ** |
| Shame | −0.312 ** | −0.199 ** | 0.338 ** | −0.142 ** | −0.292 ** |
| Hopelessness | −0.172 ** | −0.400 ** | 0.374 ** | −0.222 ** | −0.354 ** |
| STUDY | E | C | N | A | O |
| Positive | 0.366 ** | 0.566 ** | −0.168 ** | 0.313 ** | 0.505 ** |
| Enjoyment | 0.292 ** | 0.526 ** | −0.112 ** | 0.291 ** | 0.459 ** |
| Hope | 0.357 ** | 0.528 ** | −0.225 ** | 0.306 ** | 0.476 ** |
| Pride | 0.303 ** | 0.505 ** | −0.079 * | 0.277 ** | 0.397 ** |
| Negative | −0.208 ** | −0.400 ** | 0.459 ** | −0.204 ** | −0.356 ** |
| Boredom | −0.153 ** | −0.515 ** | 0.339 ** | −0.251 ** | −0.296 ** |
| Anger | −0.068 ** | −0.340 ** | 0.443 ** | −0.213 ** | −0.233 ** |
| Anxiety | −0.162 ** | −0.255 ** | 0.438 ** | −0.110 ** | −0.274 ** |
| Shame | −0.251 ** | −0.254 ** | 0.412 ** | −0.170 ** | −0.190 ** |
| Hopelessness | −0.231 ** | −0.248 ** | 0.441 ** | −0.215 ** | −0.274 ** |
| TEST | E | C | N | A | O |
| Positive | 0.352 ** | 0.534 ** | −0.176 ** | 0.245 ** | 0.480 ** |
| Enjoyment | 0.292 ** | 0.485 ** | −0.110 ** | 0.200 ** | 0.435 ** |
| Hope | 0.327 ** | 0.535 ** | −0.269 ** | 0.268 ** | 0.469 ** |
| Pride | 0.341 ** | 0.498 ** | −0.137 ** | 0.265 ** | 0.411 ** |
| Relief | 0.099 * | 0.215 ** | 0.086 * | 0.168 ** | 0.120 * |
| Negative | −0.104 ** | −0.234 ** | 0.486 ** | −0.124 ** | −0.275 ** |
| Anger | −0.061 | −0.258 ** | 0.415 ** | −0.205 ** | −0.257 ** |
| Anxiety | −0.070 | −0.108 * | 0.438 ** | −0.025 | −0.220 ** |
| Shame | −0.142 ** | −0.217 ** | 0.394 ** | −0.133 ** | −0.197 ** |
| Hopelessness | −0.104 * | −0.234 ** | 0.405 ** | −0.212 ** | −0.348 ** |
| CLASS | E | C | N | A | O |
| Enjoyment | −0.085 | −0.158 * | 0.022 | 0.079 | 0.233 ** |
| Hope | 0.256 ** | 0.535 ** | −0.161 * | 0.230 ** | 0.323 ** |
| Pride | 0.248 ** | 0.105 | −0.181 ** | 0.042 | −0.019 |
| Boredom | 0.201 * | −0.211 ** | 0.158 * | 0.286 ** | 0.171 * |
| Anger | −0.179 * | −0.079 | 0.041 | −0.482 ** | 0.129 * |
| Anxiety | −0.044 | 0.029 | 0.271 ** | −0.046 | −0.097 |
| Shame | −0.271 ** | 0.105 | 0.034 | −0.079 | −0.029 |
| Hopelessness | 0.225 ** | −.105 | −0.060 | 0.061 | −0.245 ** |
| F(8416) | 17.357 ** | 40.505 ** | 10.489 ** | 10.447 ** | 26.849 ** |
| R square | 0.250 | 0.436 | 0.166 | 0.168 | 0.339 |
| STUDY | E | C | N | A | O |
| Enjoyment | 0.165 * | 0.063 | 0.005 | 0.126 | 0.435 *** |
| Hope | 0.239 ** | 0.202 ** | −0.100 | 0.228 ** | 0.102 |
| Pride | 0.054 | 0.185 ** | 0.134 | −0.060 | −0.087 |
| Boredom | −0.051 | −0.494 ** | −0.001 | −0.053 | −0.011 |
| Anger | 0.304 ** | 0.197 * | 0.171 * | −0.131 | 0.205 ** |
| Anxiety | −0.157 ** | −0.068 | 0.078 | −0.195 * | −0.121 |
| Shame | −0.261 ** | 0.025 | 0.199 * | −0.097 | −0.050 |
| Hopelessness | 0.154 | 0.109 | 0.077 | 0.069 | −0.229 ** |
| F(8402) | 12.930 *** | 32.081 ** | 14.915 *** | 6.208 ** | 22.808 ** |
| R square | 0.205 | 0.248 | 0.230 | 0.112 | 0.317 |
| TEST | E | C | N | A | O |
| Enjoyment | −0.069 | −0.027 | 0.124 | −0.118 | 0.118 |
| Hope | 0.200 * | 0.384 *** | −0.144 * | 0.199 * | 0.238 ** |
| Pride | 0.271 ** | 0.179 * | −0.009 | 0.130 | 0.090 |
| Relief | −0.095 | 0.022 | −0.016 | 0.078 | 0.013 |
| Anger | 0.191 ** | −0.168 ** | 0.239 ** | −0.243 ** | −0.075 |
| Anxiety | 0.107 | 0.219 ** | 0.269 ** | 0.141 * | −0.010 |
| Shame | −0.102 | 0.017 | 0.109 | 0.000 | 0.137 * |
| Hopelessness | −0.142 | −0.122 | −0.073 | 0.036 | −0.198 * |
| F(8420) | 9.146 ** | 26.486 ** | 17.207 ** | 6.045 ** | 19.359 ** |
| R square | 0.157 | 0.343 | 0.253 | 0.106 | 0.279 |
| Model | Chi Square | DF | Chi/df | NFI | RFI | TLI | CFI | RMSEA | Hoelter 05−01 |
|---|---|---|---|---|---|---|---|---|---|
| 0.CL(BF) | 863,666 *** | 110 | 7.85 | 0.865 | 0.812 | 0.880 | 0.832 | 0.066 | 246–267 |
| 0.STU(BF) | 1,088,044 *** | 111 | 9.80 | 0.849 | 0.792 | 0.849 | 0.862 | 0.075 | 197–214 |
| 0.TES(BF) | 931,255 *** | 111 | 8.31 | 0.854 | 0.799 | 0.869 | 0.868 | 0.069 | 230–250 |
| 1.Class (C&N) | 502,808 *** | 69 | 7.28 | 0.917 | 0.907 | 0.920 | 0.900 | 0.080 | 175–194 |
| 2. Study (C&N) | 504,705 *** | 69 | 7.31 | 0.948 | 0.928 | 0.924 | 0.939 | 0.078 | 193–204 |
| 3. Test (C&N) | 508,201 *** | 69 | 7.36 | 0.929 | 0.914 | 0.907 | 0.903 | 0.069 | 246–268 |
| Variables | CONS | NEUR | DA | SA | POSEM | NEGEM |
|---|---|---|---|---|---|---|
| NEUR | −0.194 | |||||
| DA | 0.489 | 0.484 | ||||
| SA | −0.234 | −0.321 | ||||
| DM | 0.875 | |||||
| DS | 0.733 | |||||
| SM | 0.783 | |||||
| SS | 0.846 | |||||
| POSEM | 0.436 | 0.391 | ||||
| NEGEM | 0.328 | 0.296 | −0.298 | |||
| ENJOYMENT | 0.920 | |||||
| HOPE | 0.843 | |||||
| PRIDE | 0.836 | |||||
| BOREDOM | 0.748 | |||||
| ANGER | 0.861 | |||||
| ANXIETY | 0.811 | |||||
| SHAME | 0.654 | |||||
| HOPELE | 0.918 |
| Variables | CONS | NEUR | DA | SA | POSEM | NEGEM |
|---|---|---|---|---|---|---|
| NEUR | ||||||
| DA | ||||||
| SA | −0.183 | |||||
| DM | 0.358 | |||||
| DS | 0.428 | |||||
| SM | −0.353 | 0.099 | −0.275 | |||
| SS | −0.326 | 0.107 | −0.255 | |||
| POSEM | 0.191 | |||||
| NEGEM | −0.393 | 0.037 | −0.224 | |||
| ENJOYM | 0.529 | 0.330 | ||||
| HOPE | 0.577 | 0.360 | ||||
| PRIDE | 0.529 | 0.327 | ||||
| BOREDOM | −0.294 | 0.273 | −0.168 | 0.221 | −0.245 | |
| ANGER | −0.338 | 0.314 | −0.193 | 0.255 | −0.282 | |
| ANXIETY | −0.319 | 0.296 | −0.182 | 0.240 | −0.266 | |
| SHAME | −0.257 | 0.239 | −0.147 | 0.193 | −0.214 | |
| HOPELE | −0.360 | 0.335 | −0.206 | 0.272 | −0.310 |
| Variables | CONS | NEUR | DA | SA | POSEM | NEGEM |
|---|---|---|---|---|---|---|
| NEUR | −0.195 | |||||
| DA | 0.486 | |||||
| SA | −0.225 | 0.130 | −0.332 | |||
| DM | 0.869 | |||||
| DS | 0.738 | |||||
| SM | 0.776 | |||||
| SS | 0.853 | |||||
| POSEM | 0.417 | 0.374 | ||||
| NEGEM | 0.401 | 0.233 | −0.348 | |||
| ENJOYMT | 0.865 | |||||
| HOPE | 0.860 | |||||
| PRIDE | 0.864 | |||||
| BOREDOM | 0.777 | |||||
| ANGER | 0.845 | |||||
| ANXIETY | 0.822 | |||||
| SHAME | 0.820 | |||||
| HOPELE | 0.913 |
| Variables | CONS | NEUR | DA | SA | POSEM | NEGEM |
|---|---|---|---|---|---|---|
| NEUR | −0.187 | |||||
| DA | 0.182 | |||||
| SA | −0.383 | −0.208 | ||||
| DM | 0.423 | |||||
| DS | −0.359 | |||||
| SM | −0.320 | 0.110 | −0.283 | |||
| SS | −0.352 | 0.101 | −0.253 | |||
| POSEM | 0.182 | |||||
| NEGEM | −0.187 | 0.030 | ||||
| ENJOYMT | 0.515 | 0.324 | ||||
| HOPE | 0.518 | 0.322 | ||||
| PRIDE | 0.515 | 0.323 | ||||
| BOREDOM | −0.298 | 0.335 | −0.161 | 0.181 | −0.271 | |
| ANGER | −0.323 | 0.364 | −0.175 | 0.197 | −0.294 | |
| ANXIETY | −0.315 | 0.355 | −0.171 | 0.192 | −0.286 | |
| SHAME | −0.314 | 0.354 | −0.170 | 0.1910 | −0.286 | |
| HOPELE | −0.349 | 0.394 | −0.189 | 0.213 | −0.318 |
| Variables | CONS | NEUR | DA | SA | POSEM | NEGEM |
|---|---|---|---|---|---|---|
| NEUR | −0.201 | |||||
| DA | 0.485 | |||||
| SA | −0.243 | 0.125 | −0.323 | |||
| DM | 0.875 | |||||
| DS | 0.734 | |||||
| SM | 0.779 | |||||
| SS | 0.851 | |||||
| POSEM | 0.426 | 0.306 | ||||
| NEGEM | 0.369 | 0.198 | −0.298 | |||
| ENJOYMENT | 0.980 | |||||
| HOPE | 0.856 | |||||
| PRIDE | 0.886 | |||||
| RELIEF | 0.319 | |||||
| ANGER | 0.792 | |||||
| ANXIETY | 0.716 | |||||
| SHAME | 0.811 | |||||
| HOPELE | 0.951 |
| Variables | CONS | NEUR | DA | SA | POSEM | NEGEM |
|---|---|---|---|---|---|---|
| NEUR | −0.182 | |||||
| DA | ||||||
| SA | −0.182 | |||||
| DM | 0.424 | 0.252 | ||||
| DS | 0.357 | 0.275 | ||||
| SM | −0.325 | 0.97 | ||||
| SS | 0.355 | 0.106 | ||||
| POSEM | 0.148 | |||||
| NEGEM | −0.328 | 0.025 | −0.155 | |||
| ENJOYMT | 0.521 | 0.278 | ||||
| HOPE | 0.491 | 0.262 | ||||
| PRIDE | 0.509 | 0.271 | ||||
| RELIEF | 0.183 | 0.98 | ||||
| ANGER | −0.260 | 0.312 | −0.123 | 0.157 | −0.236 | |
| ANXIETY | 0.282 | −0.111 | 0.142 | −0.213 | ||
| SHAME | 0.319 | −0.126 | 0.161 | −0.241 | ||
| HOPELE | 0.375 | −0.148 | 0.188 | −0.283 |
© 2020 by the authors. Licensee MDPI, Basel, Switzerland. This article is an open access article distributed under the terms and conditions of the Creative Commons Attribution (CC BY) license (http://creativecommons.org/licenses/by/4.0/).
Share and Cite
de la Fuente, J.; Peralta-Sánchez, F.J.; Martínez-Vicente, J.M.; Santos, F.H.; Fadda, S.; Gaeta-González, M.L. Do Learning Approaches Set the Stage for Emotional Well-Being in College Students? Sustainability 2020, 12, 6984. https://doi.org/10.3390/su12176984
de la Fuente J, Peralta-Sánchez FJ, Martínez-Vicente JM, Santos FH, Fadda S, Gaeta-González ML. Do Learning Approaches Set the Stage for Emotional Well-Being in College Students? Sustainability. 2020; 12(17):6984. https://doi.org/10.3390/su12176984
Chicago/Turabian Stylede la Fuente, Jesús, Francisco Javier Peralta-Sánchez, José Manuel Martínez-Vicente, Flavia H. Santos, Salvatore Fadda, and Martha Leticia Gaeta-González. 2020. "Do Learning Approaches Set the Stage for Emotional Well-Being in College Students?" Sustainability 12, no. 17: 6984. https://doi.org/10.3390/su12176984
APA Stylede la Fuente, J., Peralta-Sánchez, F. J., Martínez-Vicente, J. M., Santos, F. H., Fadda, S., & Gaeta-González, M. L. (2020). Do Learning Approaches Set the Stage for Emotional Well-Being in College Students? Sustainability, 12(17), 6984. https://doi.org/10.3390/su12176984