1. Introduction
Currently, there are a number of management approaches that contribute to increasing competitiveness and business development capacity. Some businesses are targeting environmental practices to improve process activities and improve public image. Many businesses are concerned about the tools, methods, and techniques that help streamline process resource utilization. Most are involved in corporate social responsibility activities to improve their public image. These CSR activities are complementary to processes streamlining actions. Sustainability is addressed in many companies [
1,
2,
3]. The three dimensions of sustainability are addressed: social, economic, and environmental. Some organizations address cumulatively the three responsibilities, others partially. Involvement in sustainable development is not mandatory at the national or international level. Sustainability reporting is also optional [
4], but many businesses report their sustainability to improve their impact on stakeholders. From a production efficiency perspective, lean manufacturing or lean production, often simply “lean”, involves reducing the amount of waste without minimizing production capacity [
5]. These goals can be achieved by using less resources to generate the same result. Operations management plays an important role in delivering positive results. The interaction between lean and sustainability is addressed in specialized literature, highlighting the benefits of the integrated use of the two concepts [
2,
3,
4,
5,
6]. The approach of the two concepts, lean production and sustainability, within enterprises can contribute to increasing the competitiveness, capacity to develop, and make more efficient use of organizational resources (human, financial, informational, and material resources) [
5,
6,
7,
8].
In 2017, Cherrafi et al. stated that there was no study showing the relationship between sustainability and lean. Prior to 2012, most studies presented that sustainability and lean benefits were particularly limited to environmental responsibility [
6,
7,
8]. After 2012, research into the integrated approach of the two concepts began to intensify [
5].
The structure of the paper is as follows: a literature review of the concepts of sustainability, lean, and enterprise games, methods, and industry needs research using a questionnaire is conducted; followed by a presentation (introduction) of a new instrument; and a new enterprise game is developed by the authors (which integrates sustainability and lean concepts to address industry needs).
The objective of the paper is to introduce a new enterprise game and indicator developed by the authors following the research in the interdisciplinary domain related to two concepts: sustainability and lean. These two concepts are considered here together, and integrated with similarities and complementarities which should lead to improvement in companies’ competitiveness.
3. Methods
For each part of the paper we use specific methods.
In the first part we conducted a literature review to evaluate qualitatively and empirically the concepts of sustainability, lean, and enterprise games, and the possibility to integrate the first two concepts into a new instrument applied into a new enterprise game. The authors have identified a number of improvements that develop a sustainable development into an enterprise. The number of improvements we have structured in the form of 12 principles (S1–S12,
Table 2). Then, the authors identified a number of improvements made by the lean concept. We have structured the number of improvements in the form of 12 principles (L1–L12,
Table 3). Following the identification of the 12 principles of sustainability and 12 principles of lean, the authors identify a number of similarities and complementarities in order to increase the interest of enterprises in implementing the tools targeted by the two concepts (
Table 4). The similarities and complementarities are included in the market research (online survey), and then in the new algorithm of the new game developed by the authors.
Using an online survey, we collected data regarding the needs to use “lean” and “sustainability” tools within companies in our region. The survey contained a total of 14 questions, out of which 10 structured question with predetermined response options (dichotomic answers, multiple answers and a five-point Likert scale), while the rest of them were structured for open response options. The purpose of the survey was to identify which tools of “lean” and “sustainability” concepts are used within the companies, how and what training tools they used, which are the reported benefits of using the tools, and if the companies create an annual sustainability report.
Addressing the sustainability and lean concepts is very important for organizational competitiveness. A number of important directions have been identified through this online survey. Based on the “Interaction matrix between lean operation and sustainability criteria in the management process (
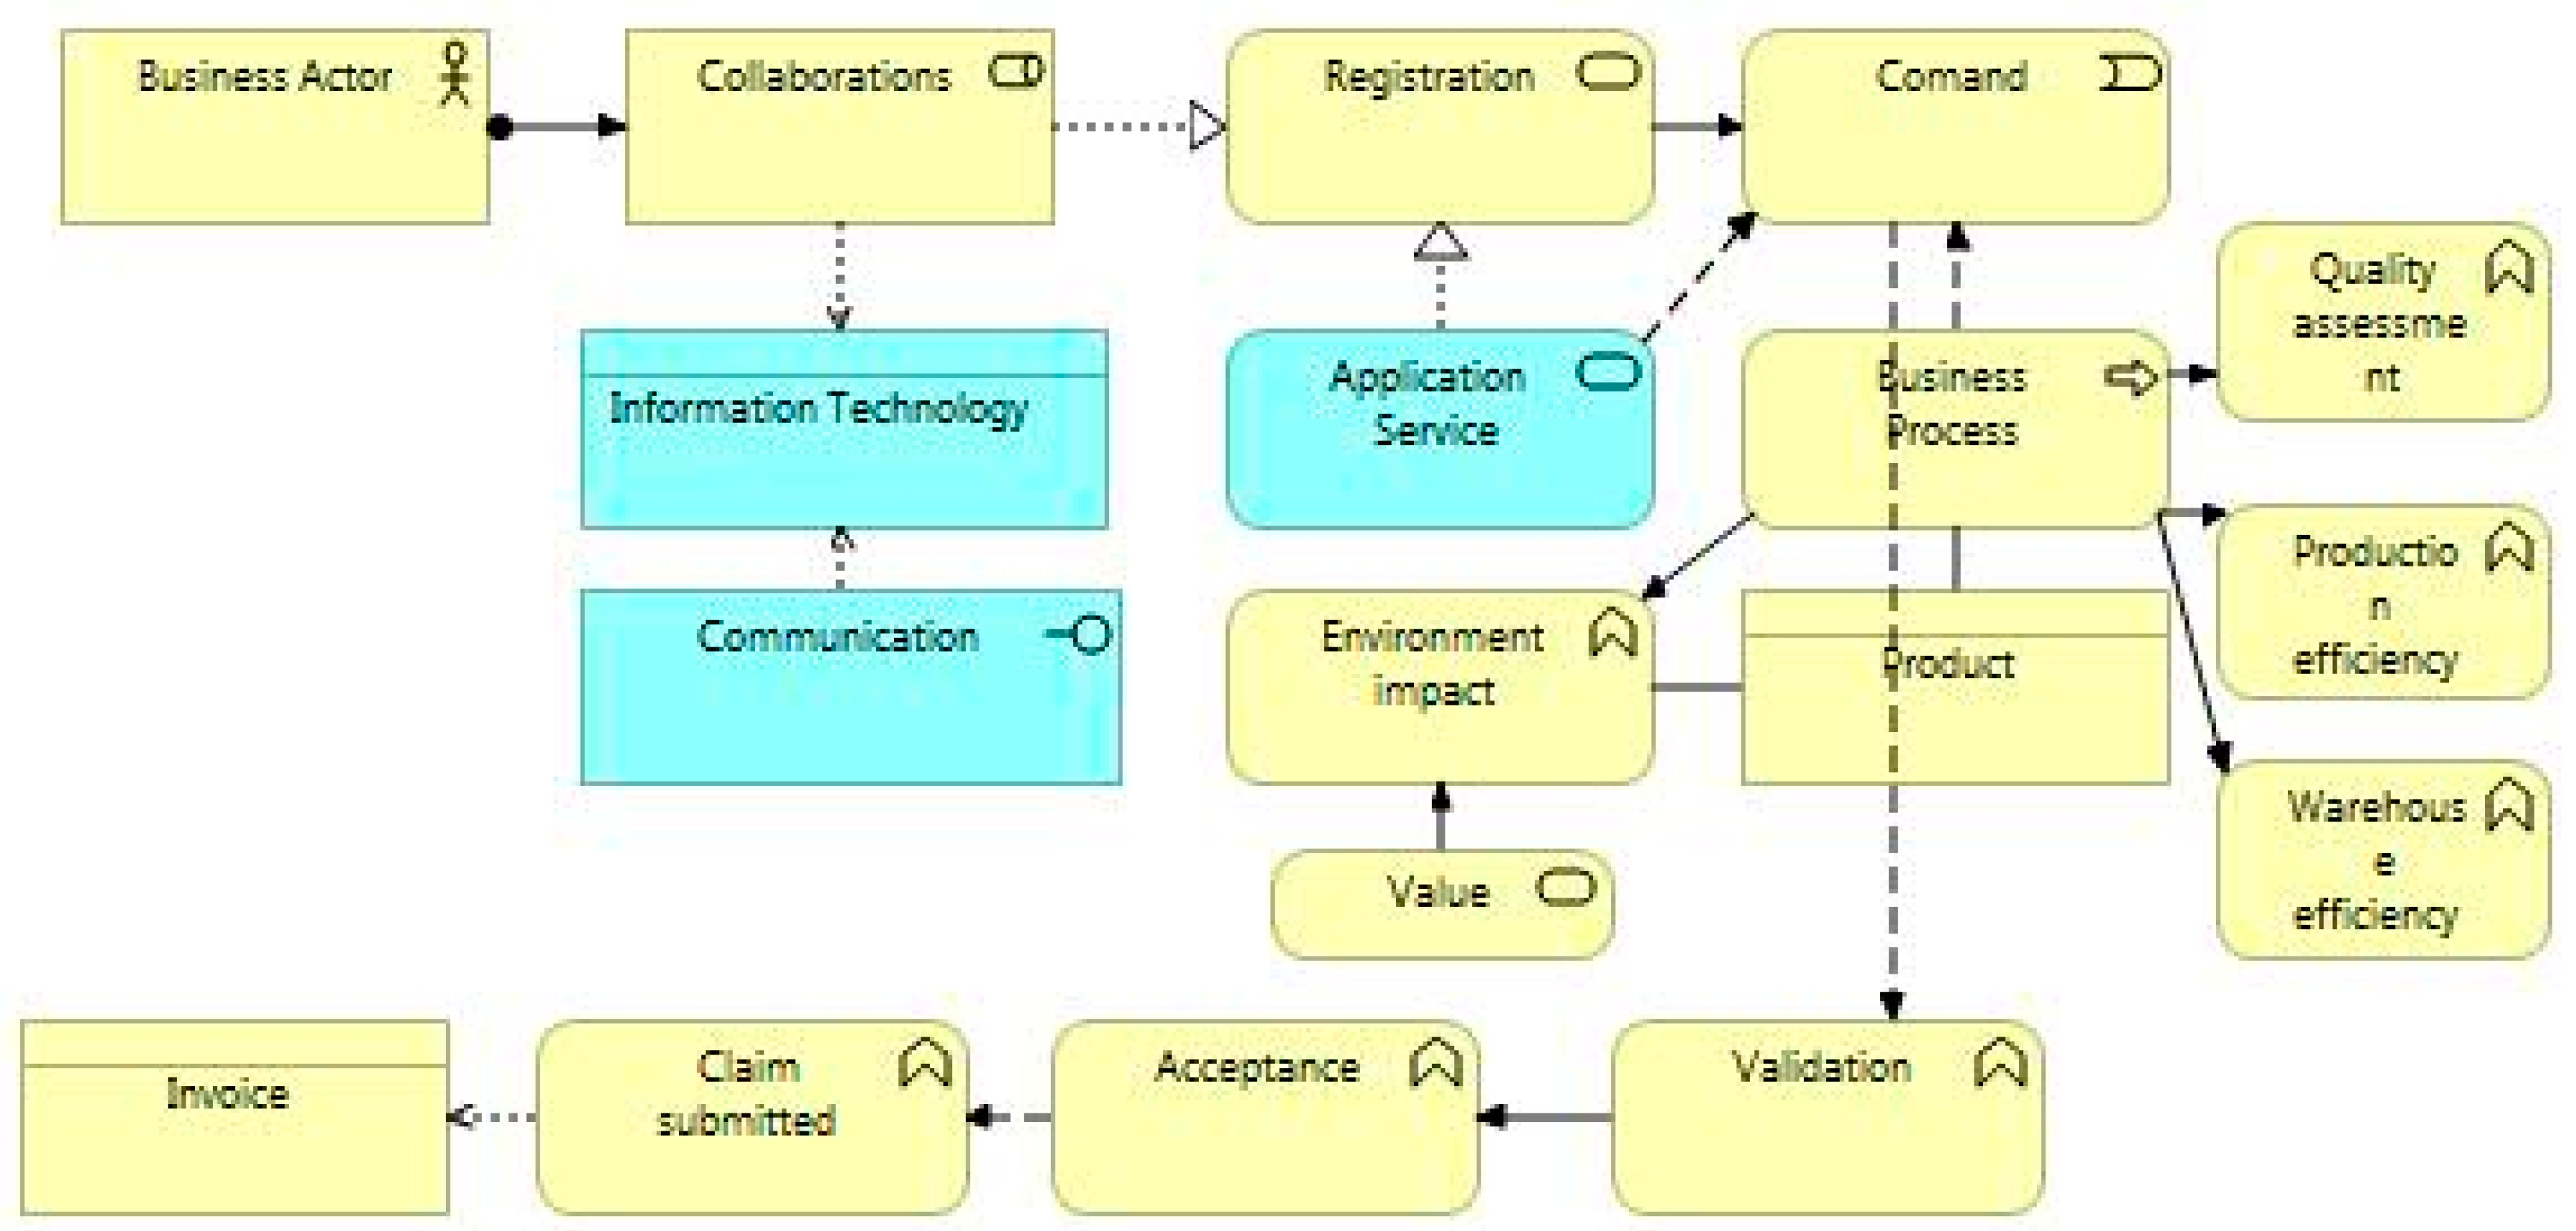
Table 4)”, and the results of the online market research, the authors developed a new game. Our approach, based on an enterprise game, proposes a number of improvements to the enterprise’s issues. In
Figure 2 are presented the enterprise architecture (EA) issues. There are several EAs, as follows: EA developed by Sparx Systems in Australia, BIZZdesign developed by IBM in Netherland, PowerDesigner developed by Novalys in France, ArchiMate developed by team from the Telematica Instituut in cooperation with Dutch partners from government, industry and academia in the Netherlands. We used ArchiMate
® to build the enterprise architecture. This is one of the open standards hosted by The Open Group
® and is fully aligned with TOGAF
®. Enterprise issues solved by our enterprise game are: enterprise management, production efficiency, warehouse efficiency, quality assessment, customer relationship management (CRM), and environmental impact.
Using on the survey results, we design and tested an enterprise game. The game follows the framework of an enterprise game, considering the simulation of an enterprise classical functions and departments, jobs implemented in order that the enterprise activity is simulated in rounds (like work days or shifts). The purpose of the game is to improve the activity results in successive rounds, using sustainability and lean tools. A scorecard is used to compute the key performance indicators (KPIs), and the main indicator used here is an aggregate one from sustainability and lean indicators.
4. Results of the “Lean” and “Sustainability” Surveys
A total of 65 valid responses (N) were obtained from companies’ employees situated in the western region of Romania and represent the database for our descriptive statistics and main results. We have conducted statistical analysis on our survey result by computing in SPSS the standard deviation (Std. Dev. or SD) to determine if our responses are concentrated around the mean and standard error (Std. Err or SE) to indicate the reliability of the mean.
From
Figure 3 we can observe that most respondents are from the administrative or support department (43.08%), followed by the technical department (35.38%). The answers have been obtained from the following areas: production areas (21.54%), thus recoding smaller percentages for production managers (16.92%), and respective production operators (4.62%).
After coding our responses with “1” for production/operator, “2” for production/manager, “3” for administrative/support, and “4” for technical department, in
Table 6 we can observe the distribution of respondents based on company department. Looking at the mean (3.09) and SD (0.843) values we can observe that most of the respondents are from the administrative/support and technical department.
Figure 4 presents the percentage of respondents based on the companies’ business sector, from which we can observe that half of the respondents are from companies operating in the automotive business sector (50.70%). The high percentage was to be expected due to the large number of companies situated in the western region of Romania operating in this specific business sector.
Table 7 show the distribution of respondents based on company industry. We coded with values from 1 to 8 the industries that can be found in the Western Region of Romania: automotive, IT and C; data processing and analysis; chemical, food, and beverage retail; furniture; and included possible responses for “other industries”, respectively “not specified”. The high value of the SD (2.317) indicates a wide distribution of responses, meaning that we obtained several responses for each industry, while the mean (2.60) and SE (0.287) values, show that the responses are concentrated around the first two industries: automotive and IT and C.
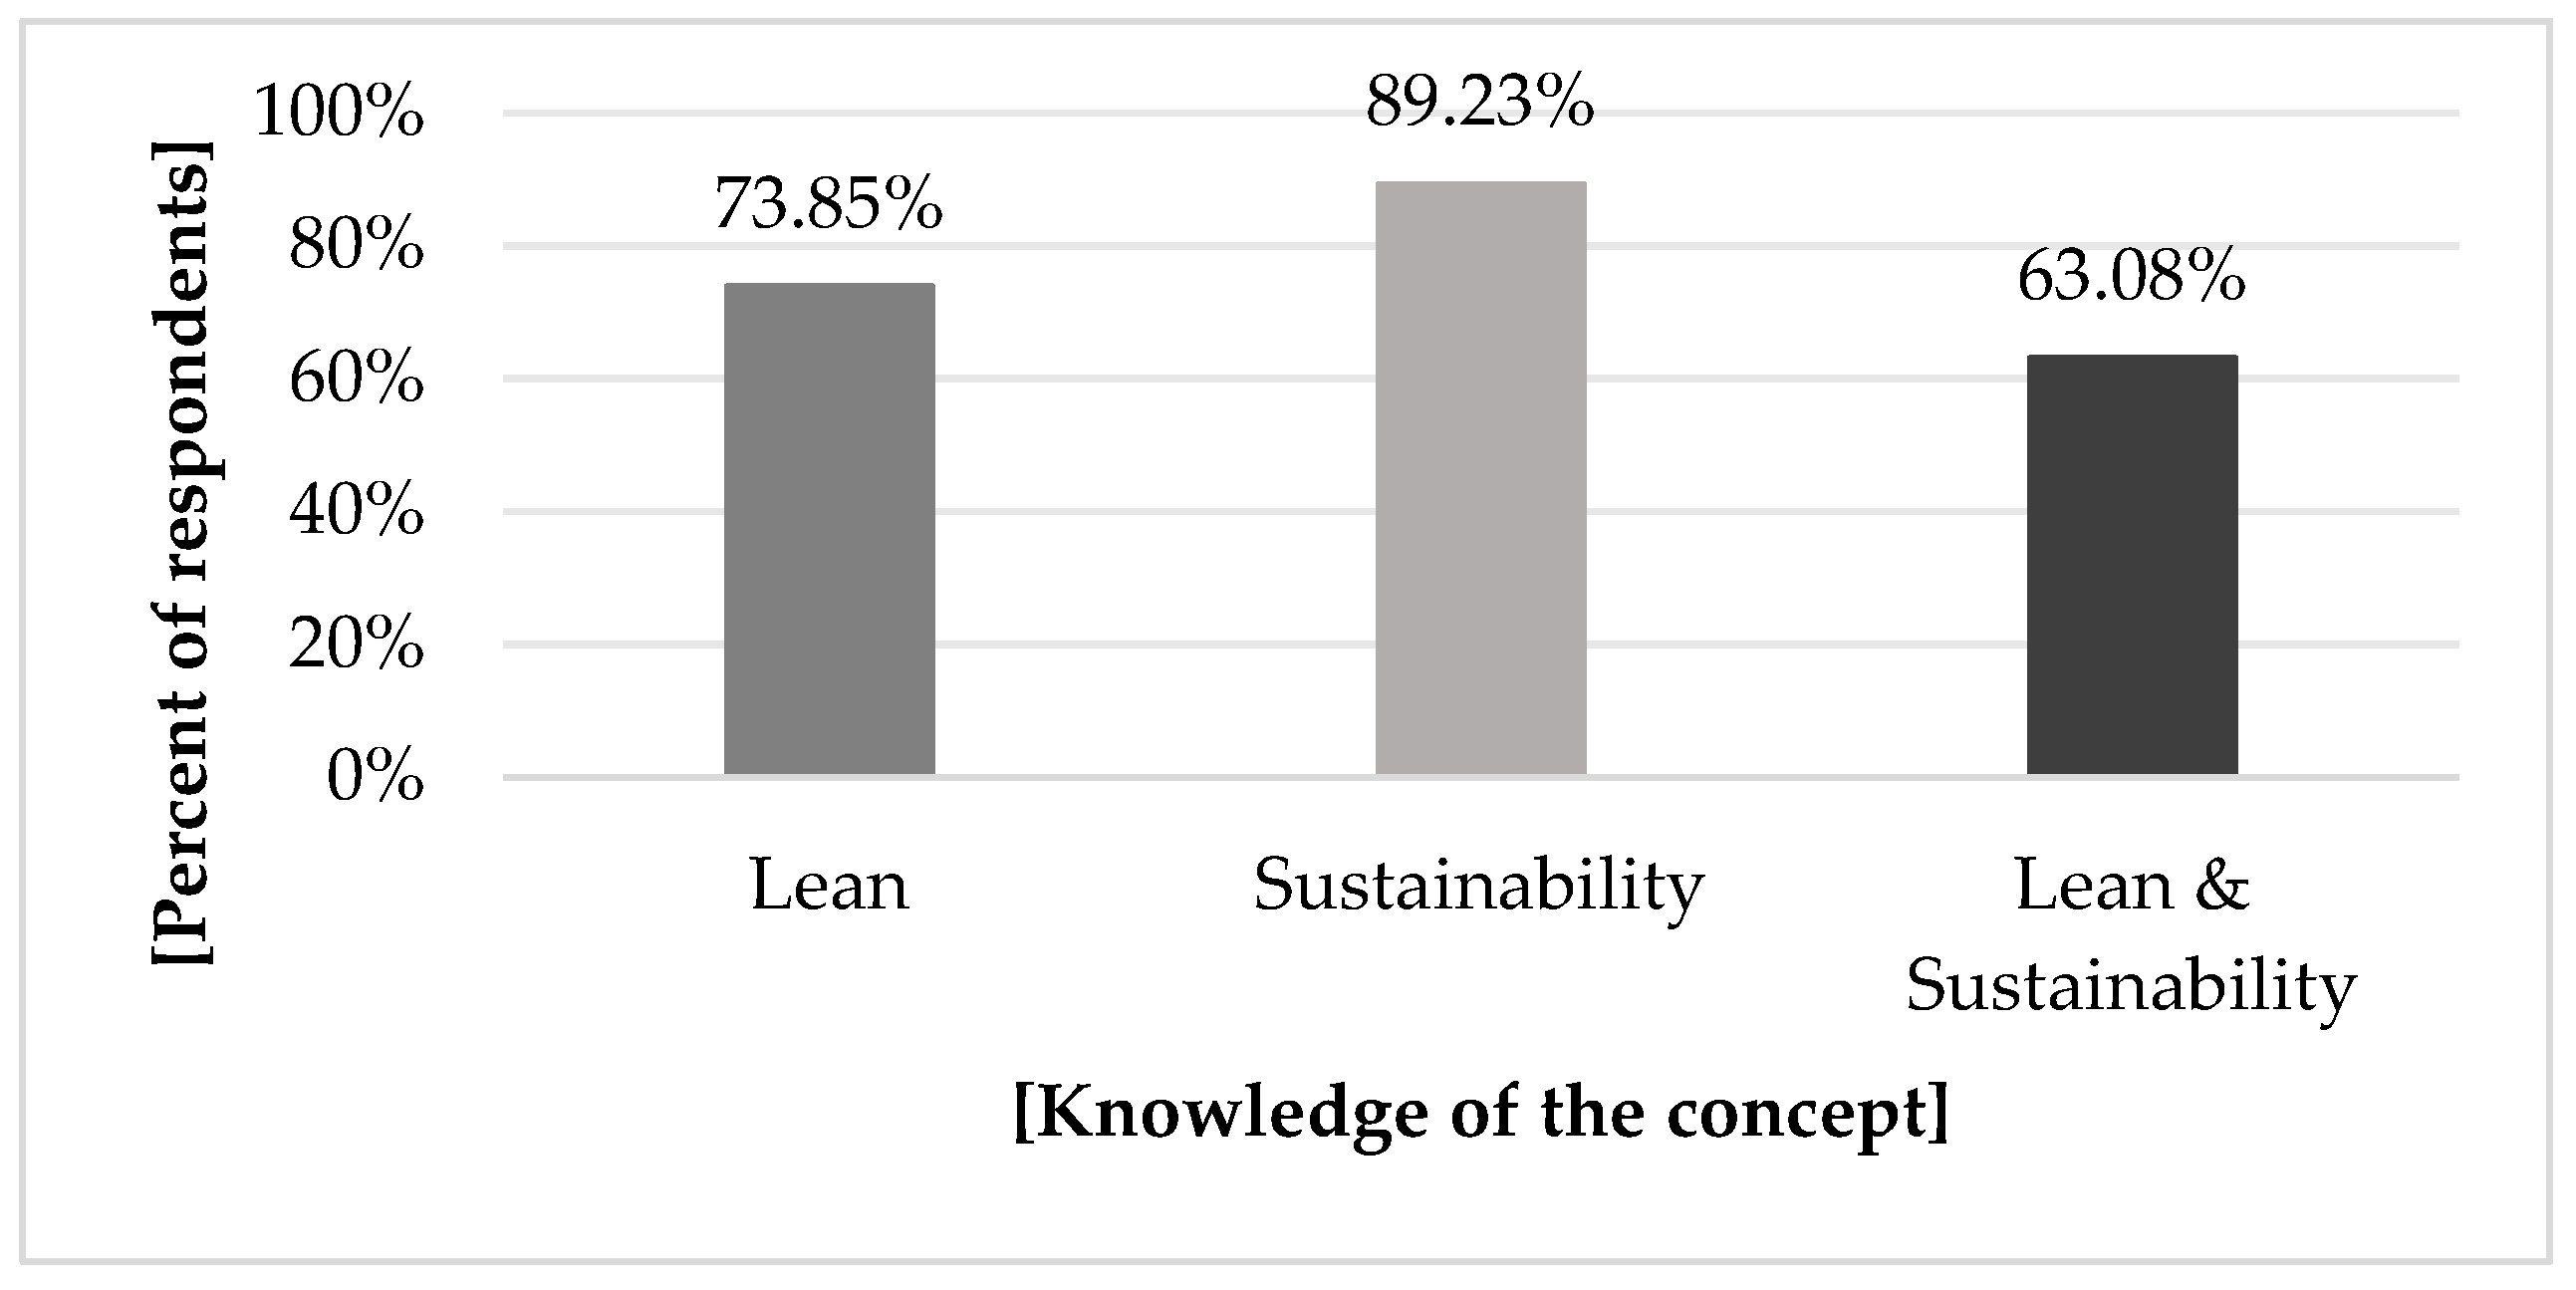
Figure 5 describes the percentage of respondents’ knowledge of the “lean” and “sustainability” concept, showing us that individually asking about the concepts 73.85% have knowledge about the “lean” concept, while 89.23% about the “sustainability” concept. Additionally, 63.08% of respondents have knowledge regarding both concepts.
In
Table 8, we observe the small values of SD and SE describing a normal distribution in relation to the Mean, taking in consideration that we coded with “1” knowing the lean, sustainability, respectively both concepts, while with “0” not knowing the lean or sustainability concept, respectively knowing at least one. Our results clearly indicate that, statistically, there are more than 2/3 respondent that have knowledge of one or both concepts.
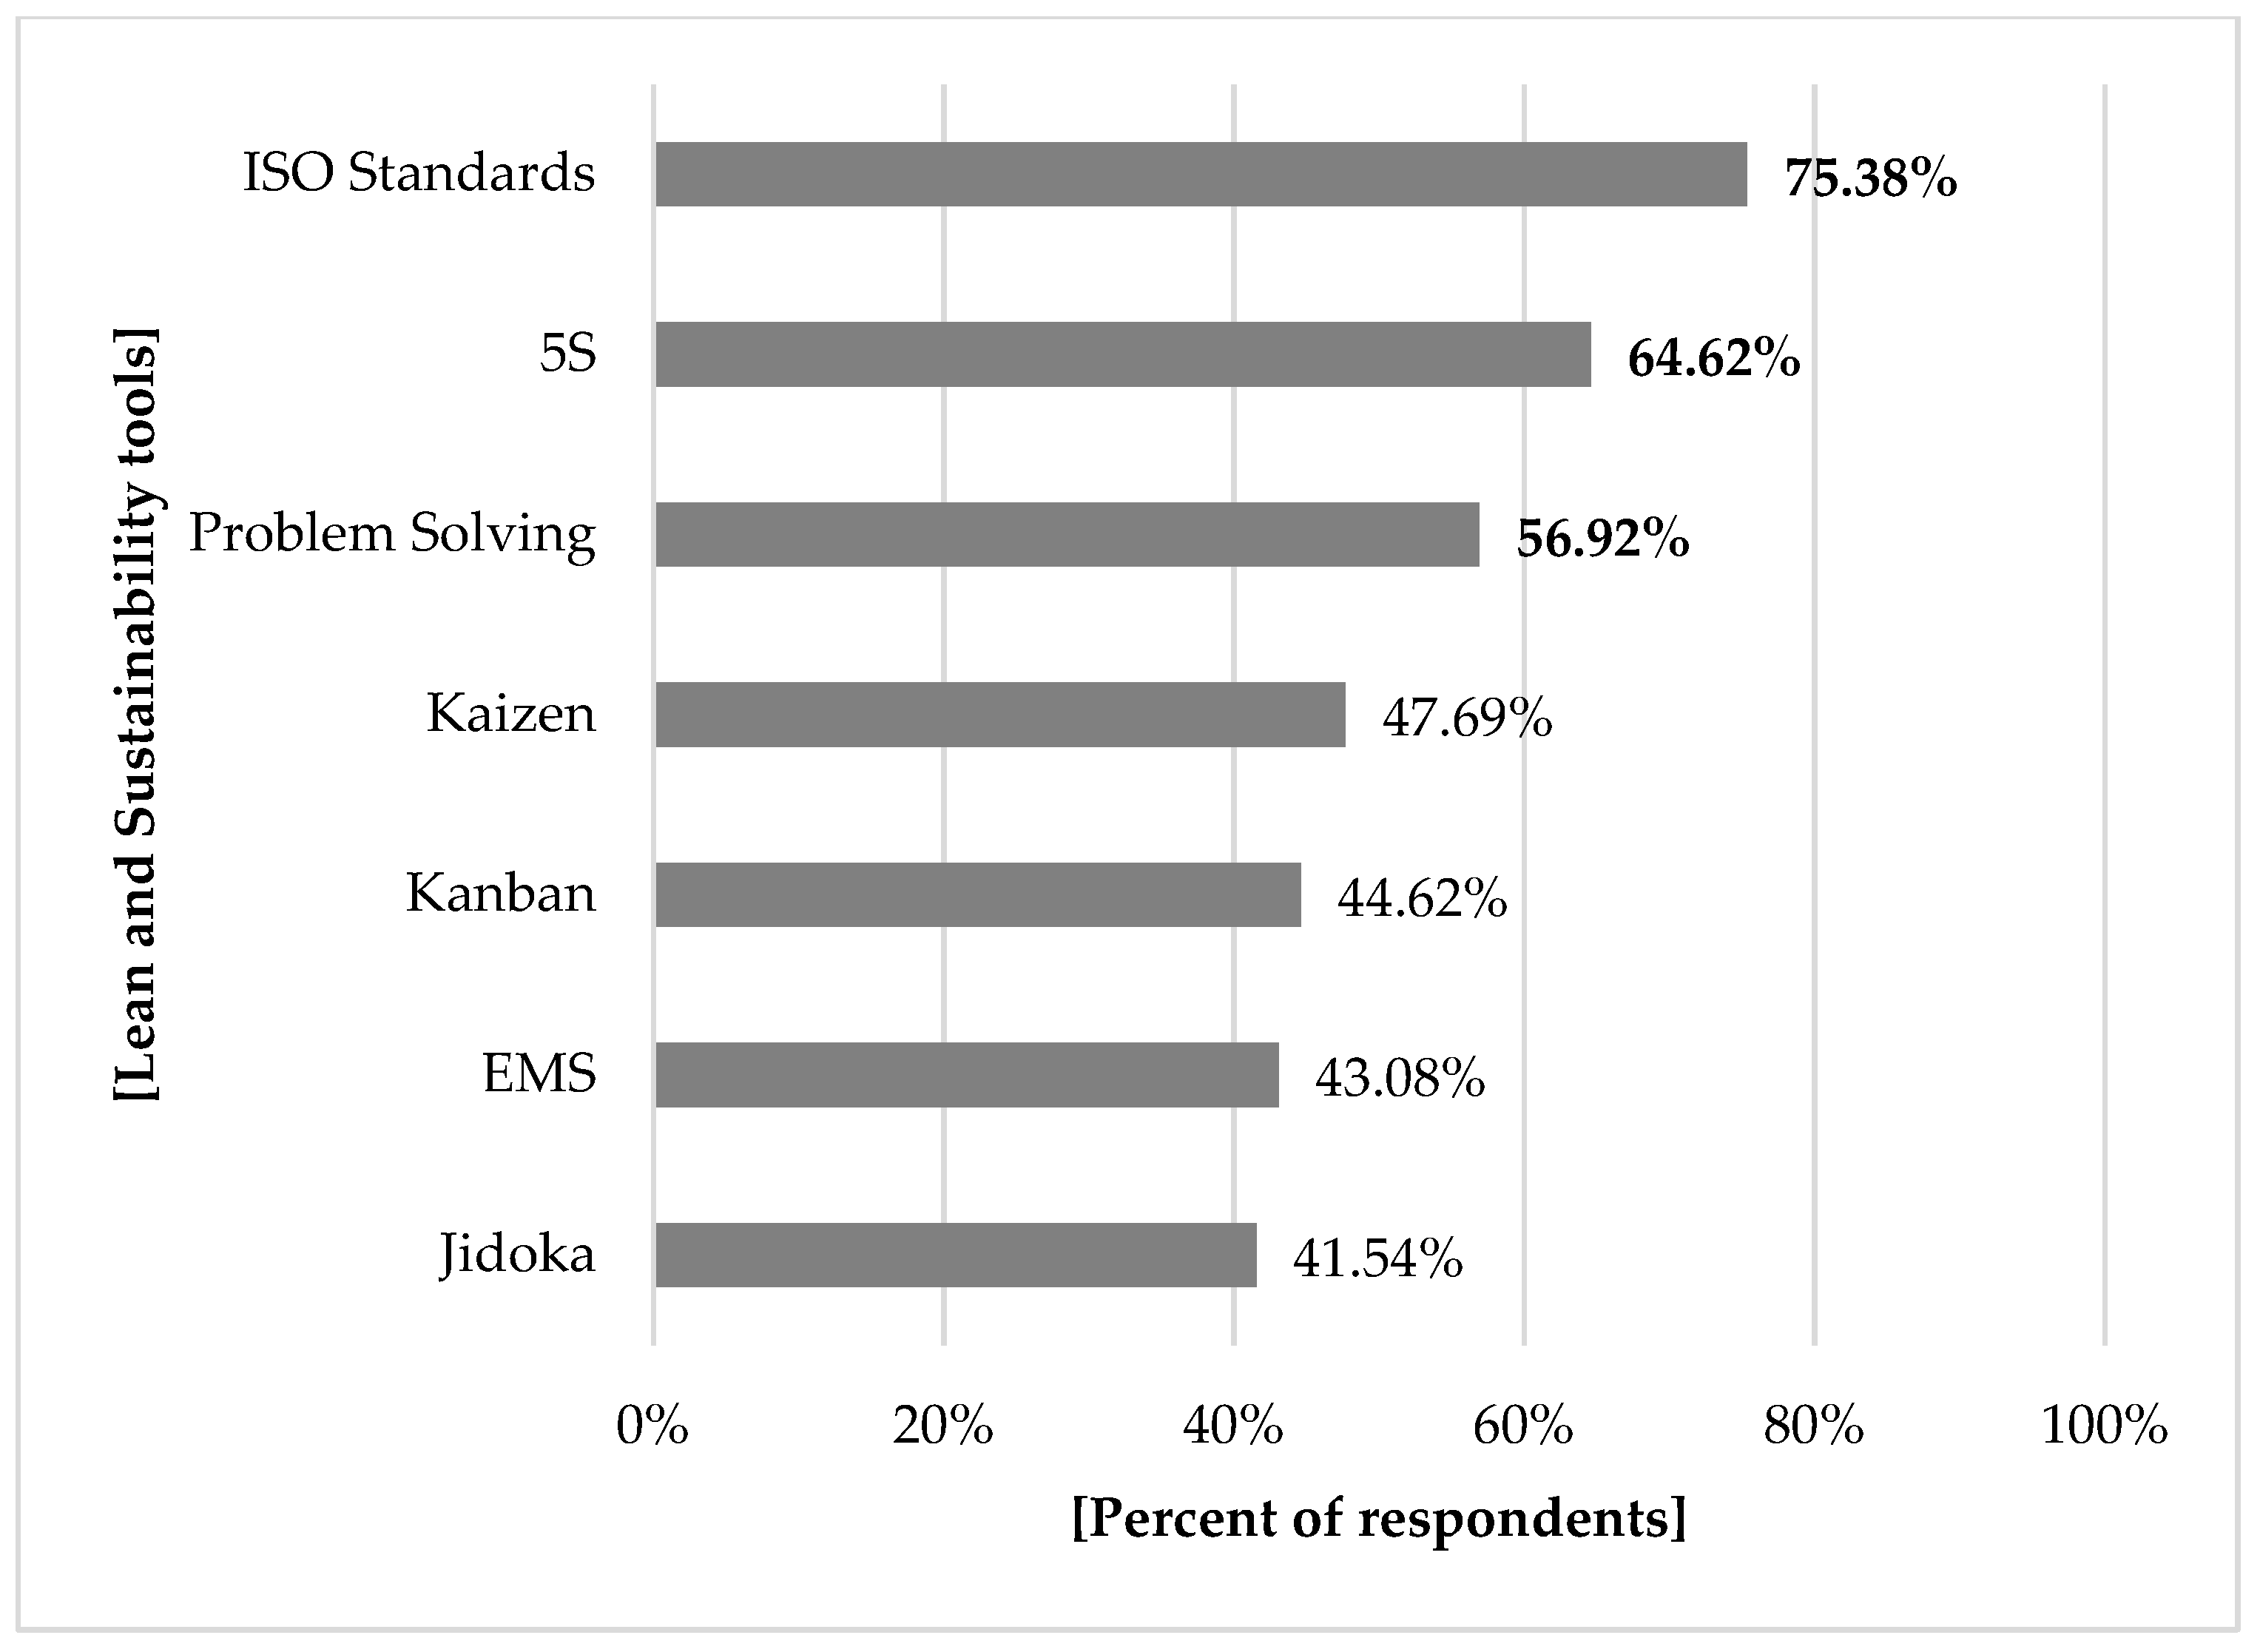
Our survey contained a structured question with predetermined answers regarding the particular “lean” and “sustainability” tools used (a total of 23 tools) by the respondents.
Figure 6 presents the top seven “lean” and “sustainability” tools and we can observe that ISO Standards (75.38%), 5S (64.62%), and Problem Solving (56.62%) are the most used tools in the interviewed companies. The other ones recorded over 40% of responses: Kaizen (47.69%), Kanban (44.62%), EMS—Environmental Management System (43.08%), and Jidoka (41.54%) and are entitled to be included in our top seven “lean” and “sustainability” tools used by respondents.
After coding our responses with “1” for “Yes, I use this tool” and “0” for “No, but it’s implemented in the company”, in
Table 9 we can observe the relative small SD and SE values indicating that the responses are more concentrated around value “1”, thus can be included in the top seven “lean” and “sustainability” tools used by respondents.
The same structured question with predetermined answers regarding “lean” and “sustainability” tools shows the ones not particular used by respondents but implemented in the company. Thus,
Figure 7 presents the top seven “lean” and “sustainability” tools not particular used by respondents but implemented in the company. We can observe that Kaikaku (89.23%), SMED—Single-Minute Exchange of Dies (83.08%), and Six Sigma (81.54%) are the most implemented tools, while six of them: JIT (Just in Time), Bottleneck Analysis, SFM (Shop Floor Management), GRI (Global Report Initiative), EMAS (Eco Management and Audit Scheme), and RECP (Resource Efficient and Cleaner Production) record the same value (78.46%).
Using the same responses coding principle, as mentioned above, in
Table 10 we present the computed values of the SD, SE and Mean for the tools included in the top seven “lean” and “sustainability” tools not used by respondents but implemented in the company. The small values of the Mean indicate that the responses are more concentrated around value “0”, meaning that the tools are not particularly used by respondents, but they do have knowledge of them being used in the company.
Figure 8 presents (a) the percentage of respondents receiving training for the lean tools used (52.31%), while (b) for the ones receiving training for the sustainability tools used (36.91%), showing that the distribution for receiving and not receiving training are all most the same (50–50%).
Table 11 show the distribution of respondents being trained for the “lean” and “sustainability” tools they use. We coded their answers with the following values: “1” for receiving training and “0” for not receiving values. Looking at the mean, SE, and SD values we observe that the answers are divided almost evenly between “receiving training” and “not receiving training”.
Figure 9 presents the percentage of respondents by the type of training received for the used “lean” and “sustainability” tools. A standing out observations is that 44.62% did not receive training or we recorded missing values, while 29.23% received internal company training, and others are self-taught (6.15%).
To analyze the type of training received for the used methods,
Table 12, we agreed on five possible answers: “0” for none/missing values, “1” for self-taught”, “2” for in house training/in company training, “3” for external experts—in house training and “4” for external experts—course/workshop. The relative high values of the mean (1.34) and SD (1.384) suggest that the answers are concentrated around no training received/missing values.
We provided the list of the 17 Sustainable Development Goals (for reference see
Table 1) in order to find out if they are pursued by the company. Thus,
Figure 10 reports the top seven goals identified as pursued by the company and we observed that the main pursued goals are: decent work and economic growth (69.23%); industry innovation and infrastructure (64.62%); and responsible consumption and production (61.54%).
Out of the 17 Sustainable Development Goals presented in the first part of our paper (
Table 1), we identify the top seven Sustainable Development Goals pursued by companies involved in our study, based on a frequency of appearance analysis. To analyze the distribution of our answers we coded with “0” for “No, it isn’t an objective of the company”, “1” for “Yes, it’s an objective of the company” and “2” for “I don’t have knowledge about this”. The values of the mean and SD indicate that the answers are more concentrated around value 1, thus the seven goals can be included in our top,
Table 13.
Figure 11 presents (a) the percentage of respondents considering lean tools useful for the company (72.31%), while (b) the percentage of respondents considering sustainability tools useful for the company (84.62%), showing a mainly positive perception upon the overall usefulness on the tools.
Being a dichotomic response question, we coded the answers with “0” for not considering the tools useful, and “1” for considering the tools useful, thus the mean (0.72, respectively 0.85) and SD (0.451, respectively 0.364) show that the answers are concentrate around value 1, indicating a large number of respondents considering the tools useful for their company (see
Table 14).
Using a five-point Likert Scale
Figure 12 presents the cumulative percentage of high and maximum values for the order of each benefits in the companies’ activity based on respondents’ perception: quality assurance (89.23%), working standards (81.54%), and visual management (78.46%) being the top activities in which “lean” and “sustainability” tool implementation brought benefits.
Based on our five-point Likert scale, the high mean and SD values,
Table 15, indicate that responses are concentrated around high and maximum values (4 and 5, respectively) based on respondents’ perception upon the activities in which “lean” and “sustainability” tool implementation brought benefits.
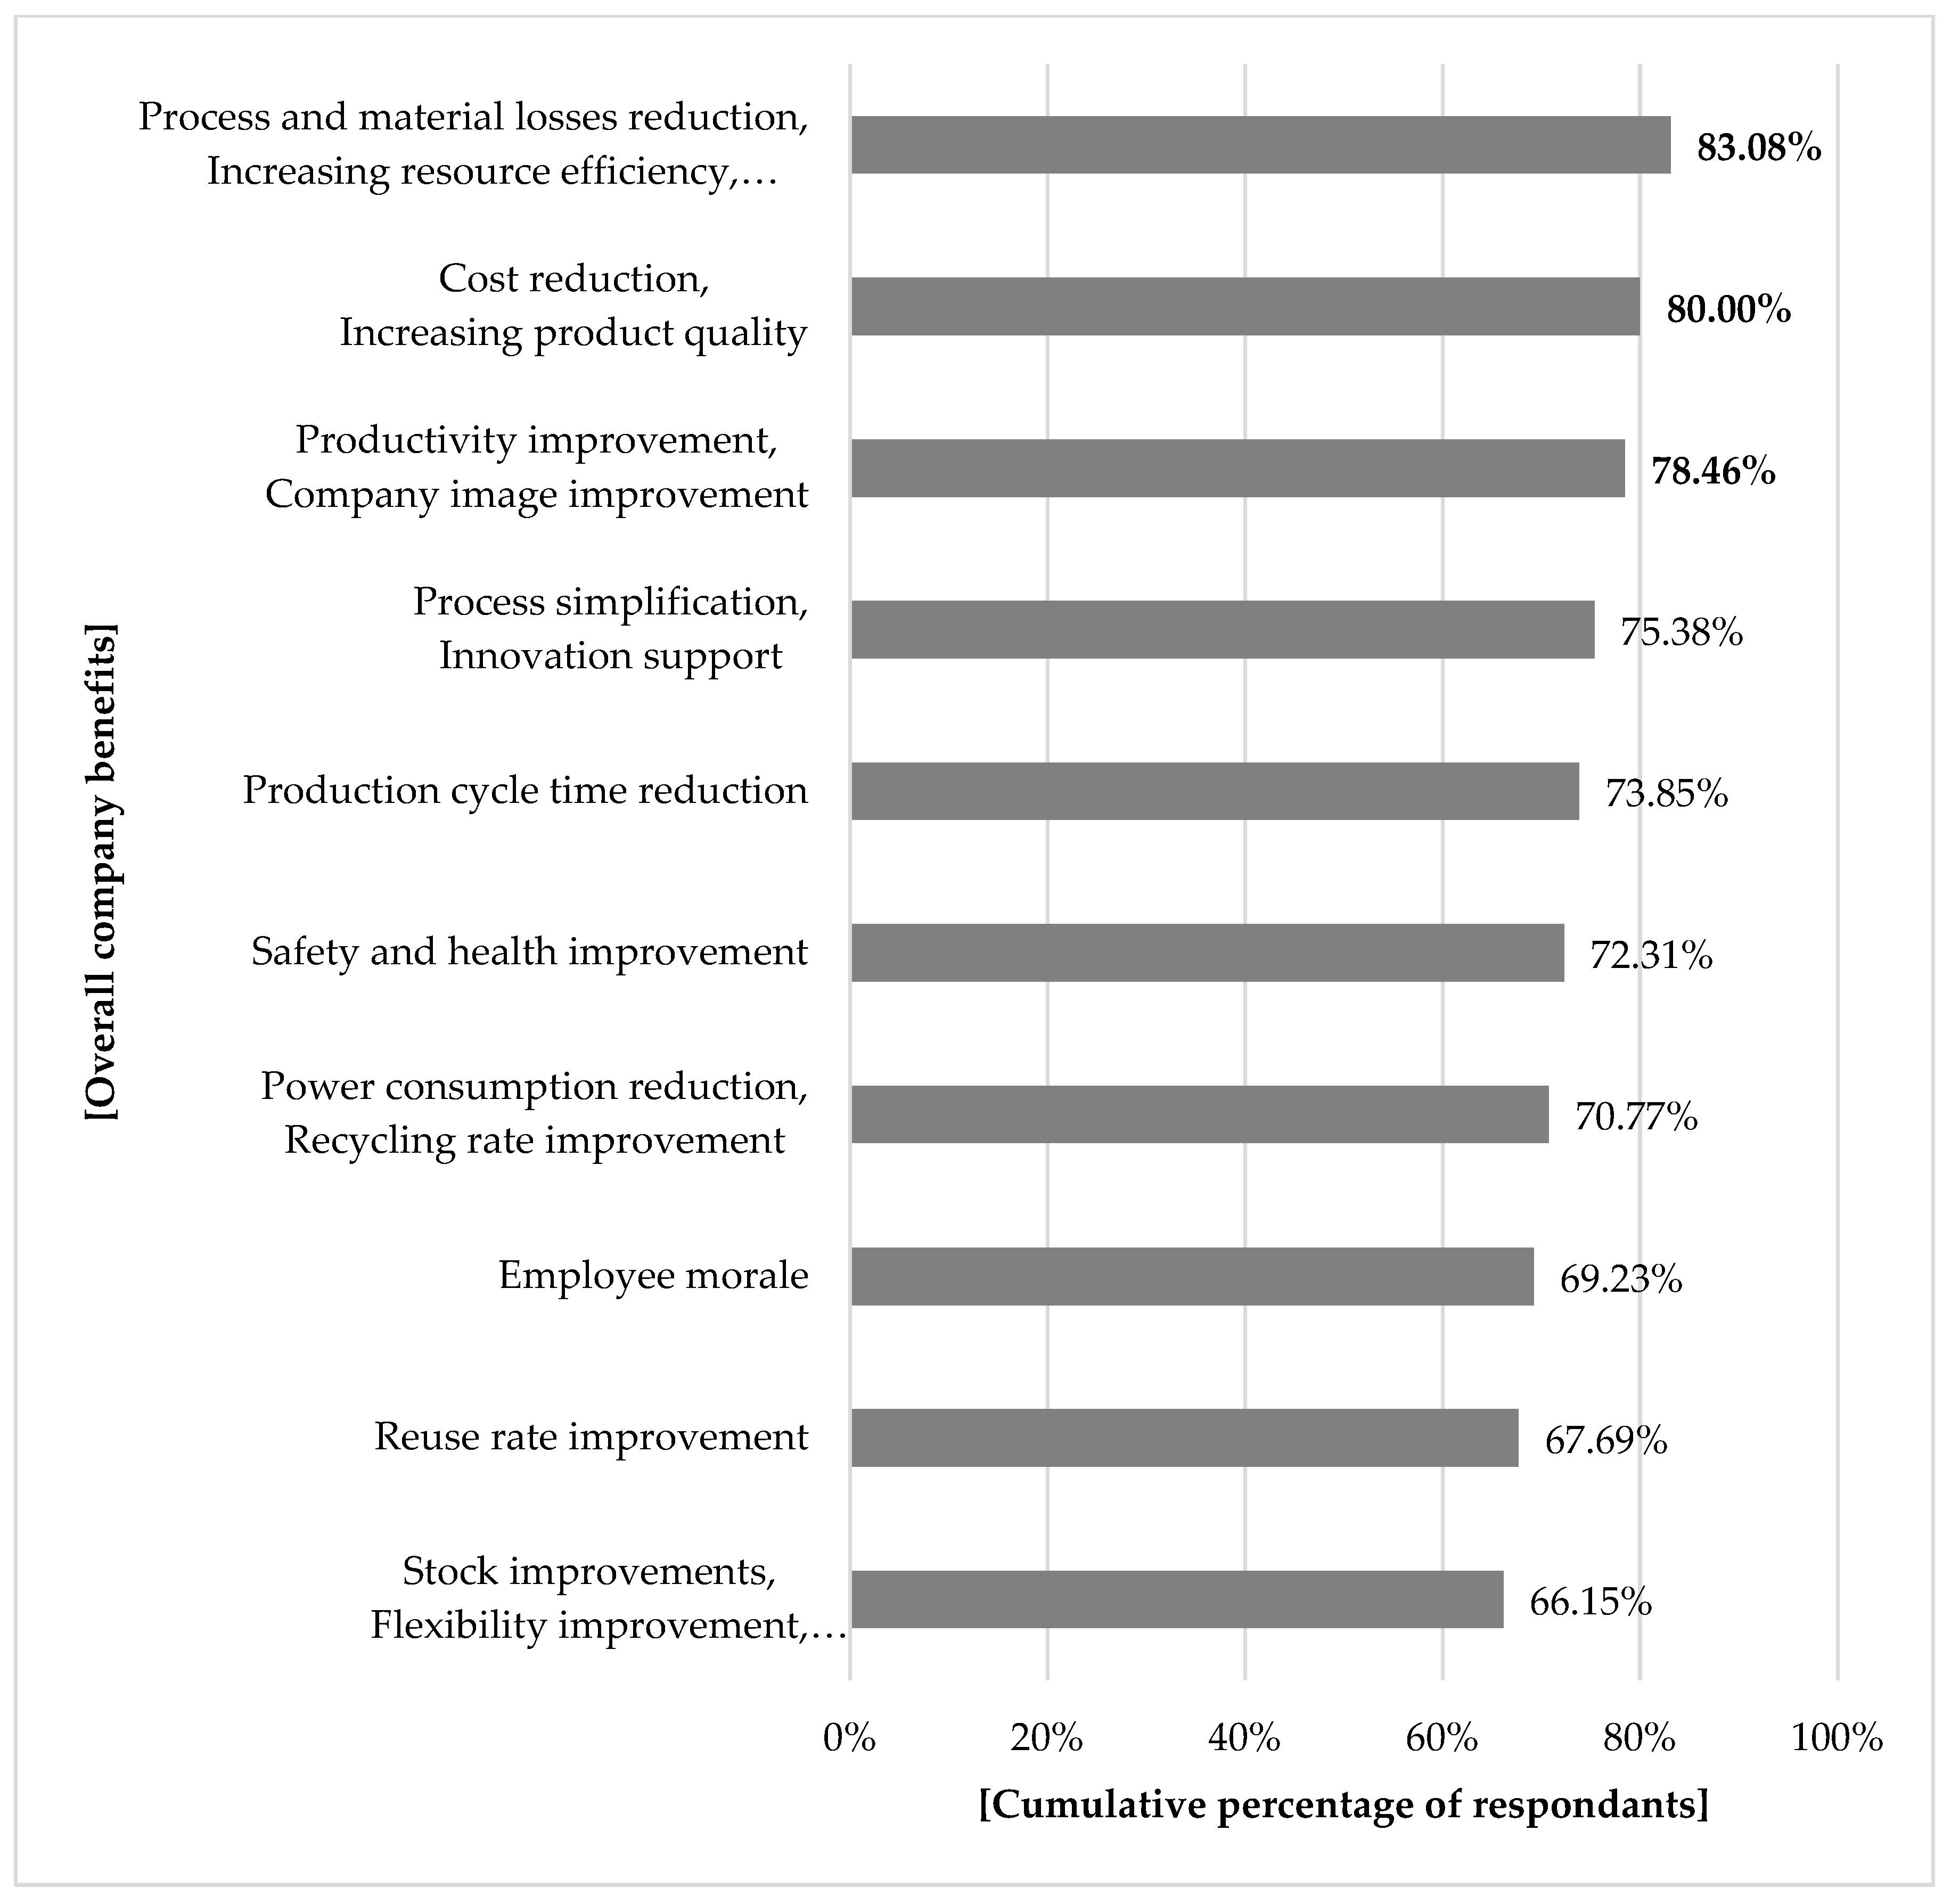
Using a five-point Likert Scale
Figure 13 presents the cumulative percentage of high and maximum values for respondents’ perception upon each overall company benefit brought by “lean” and “sustainability” tool implementation. Since some company benefits reported the same value, we placed them in groups. Focusing on the first three groups of benefits: Process and Material Losses Reduction, Increasing Resource Efficiency and Customer Satisfaction (83.08%), Cost Reduction and Increasing Product Quality (80.00%), and Productivity Improvement and Company Image Improvement (78.46%) we can also consider them high priority objectives for the overall company activity and the main reason for which companies implement “lean” and “sustainability” tools.
Using the same responses coding principle for the five-point Likert scale, as mentioned above, in
Table 16 we present the computed values of the SD, SE, and mean for the top overall company benefits brought by the “lean” and “sustainability” tools implementation and observed by the company employees. the high mean and SD values indicate that responses are concentrate around high and maximum values (4 and 5, respectively) based on respondents’ perceptions upon the observed overall company benefits.
Recoding our five-point Likert scale to a three-point Likert scale for a better view of the results,
Figure 14 presents the frequencies of appearance for the most common drawbacks in the company’s activity. From our respondents’ experience, the most common drawbacks with low frequency appearance are: Over-production (46.15%), Transport (46.15%), Material or Product Stocks (43.08%), Over-processing (41.54%) and Motion (41.54%), while the most drawbacks with high frequency of appearance are Waiting (46.16%) and Defects or Scrap (40.00%).
Based on our observations, the high mean and SD values,
Table 17, indicate that the answers regarding the company’s activity drawback frequencies are concentrated around the middle area, with two of them being in the high and maximum area (“Defect or Scrap” and “Waiting”) thus probably influenced by the company’s business industry sector. For a better understanding of our results see
Figure 14, in which we recoded our five-point Likert scale to a three-point Likert scale.
From
Figure 15 we can observe that a high percentage of respondents have the knowledge of an annual sustainability report out of which 26.15% use an unstandardized report, while 30.77% create a standardized report based on the GRI (Global Report Initiative) recommendations. The rest of the respondents replied that the company does not create an annual sustainability report (7.69%) and a considerable percent replied as not having knowledge about all of the company’s annual reports (35.38%).
To observe the existence of an annual sustainability report in the company we agreed on five possible answers: “0” for “No annual report”, “1” for “Yes, standardized (using GRI)”, “2” for “YES, unstandardized” and “3” for “I don’t know”. The relative high values of the mean (1.89) and SD (0.986) suggest that the answers are concentrated around existing an annual report standardized or not,
Table 18. Another thing that the values suggest it that a considerable amount of respondent do not have knowledge about an existing report. For a better understanding of our results see
Figure 15.
5. Proposal for a New Method and Enterprise Game
The new instrument/game proposed (developed by the authors) can be described using the MOSTO model (Mission, Objectives, Strategy, Tactics, and Operationalization) as follows:
Mission: Raise awareness regarding the necessity for improvement of anyone’s activity in order to be competitive and sustainable.
Objectives: To decrease/eliminate non-value-added activities (wastes) and increase value-added activities.
Strategy: Integrated use of lean and sustainability tools.
Tactics: Use of enterprise games which integrate lean and sustainability tools.
Operationalization: Using the SLIM game.
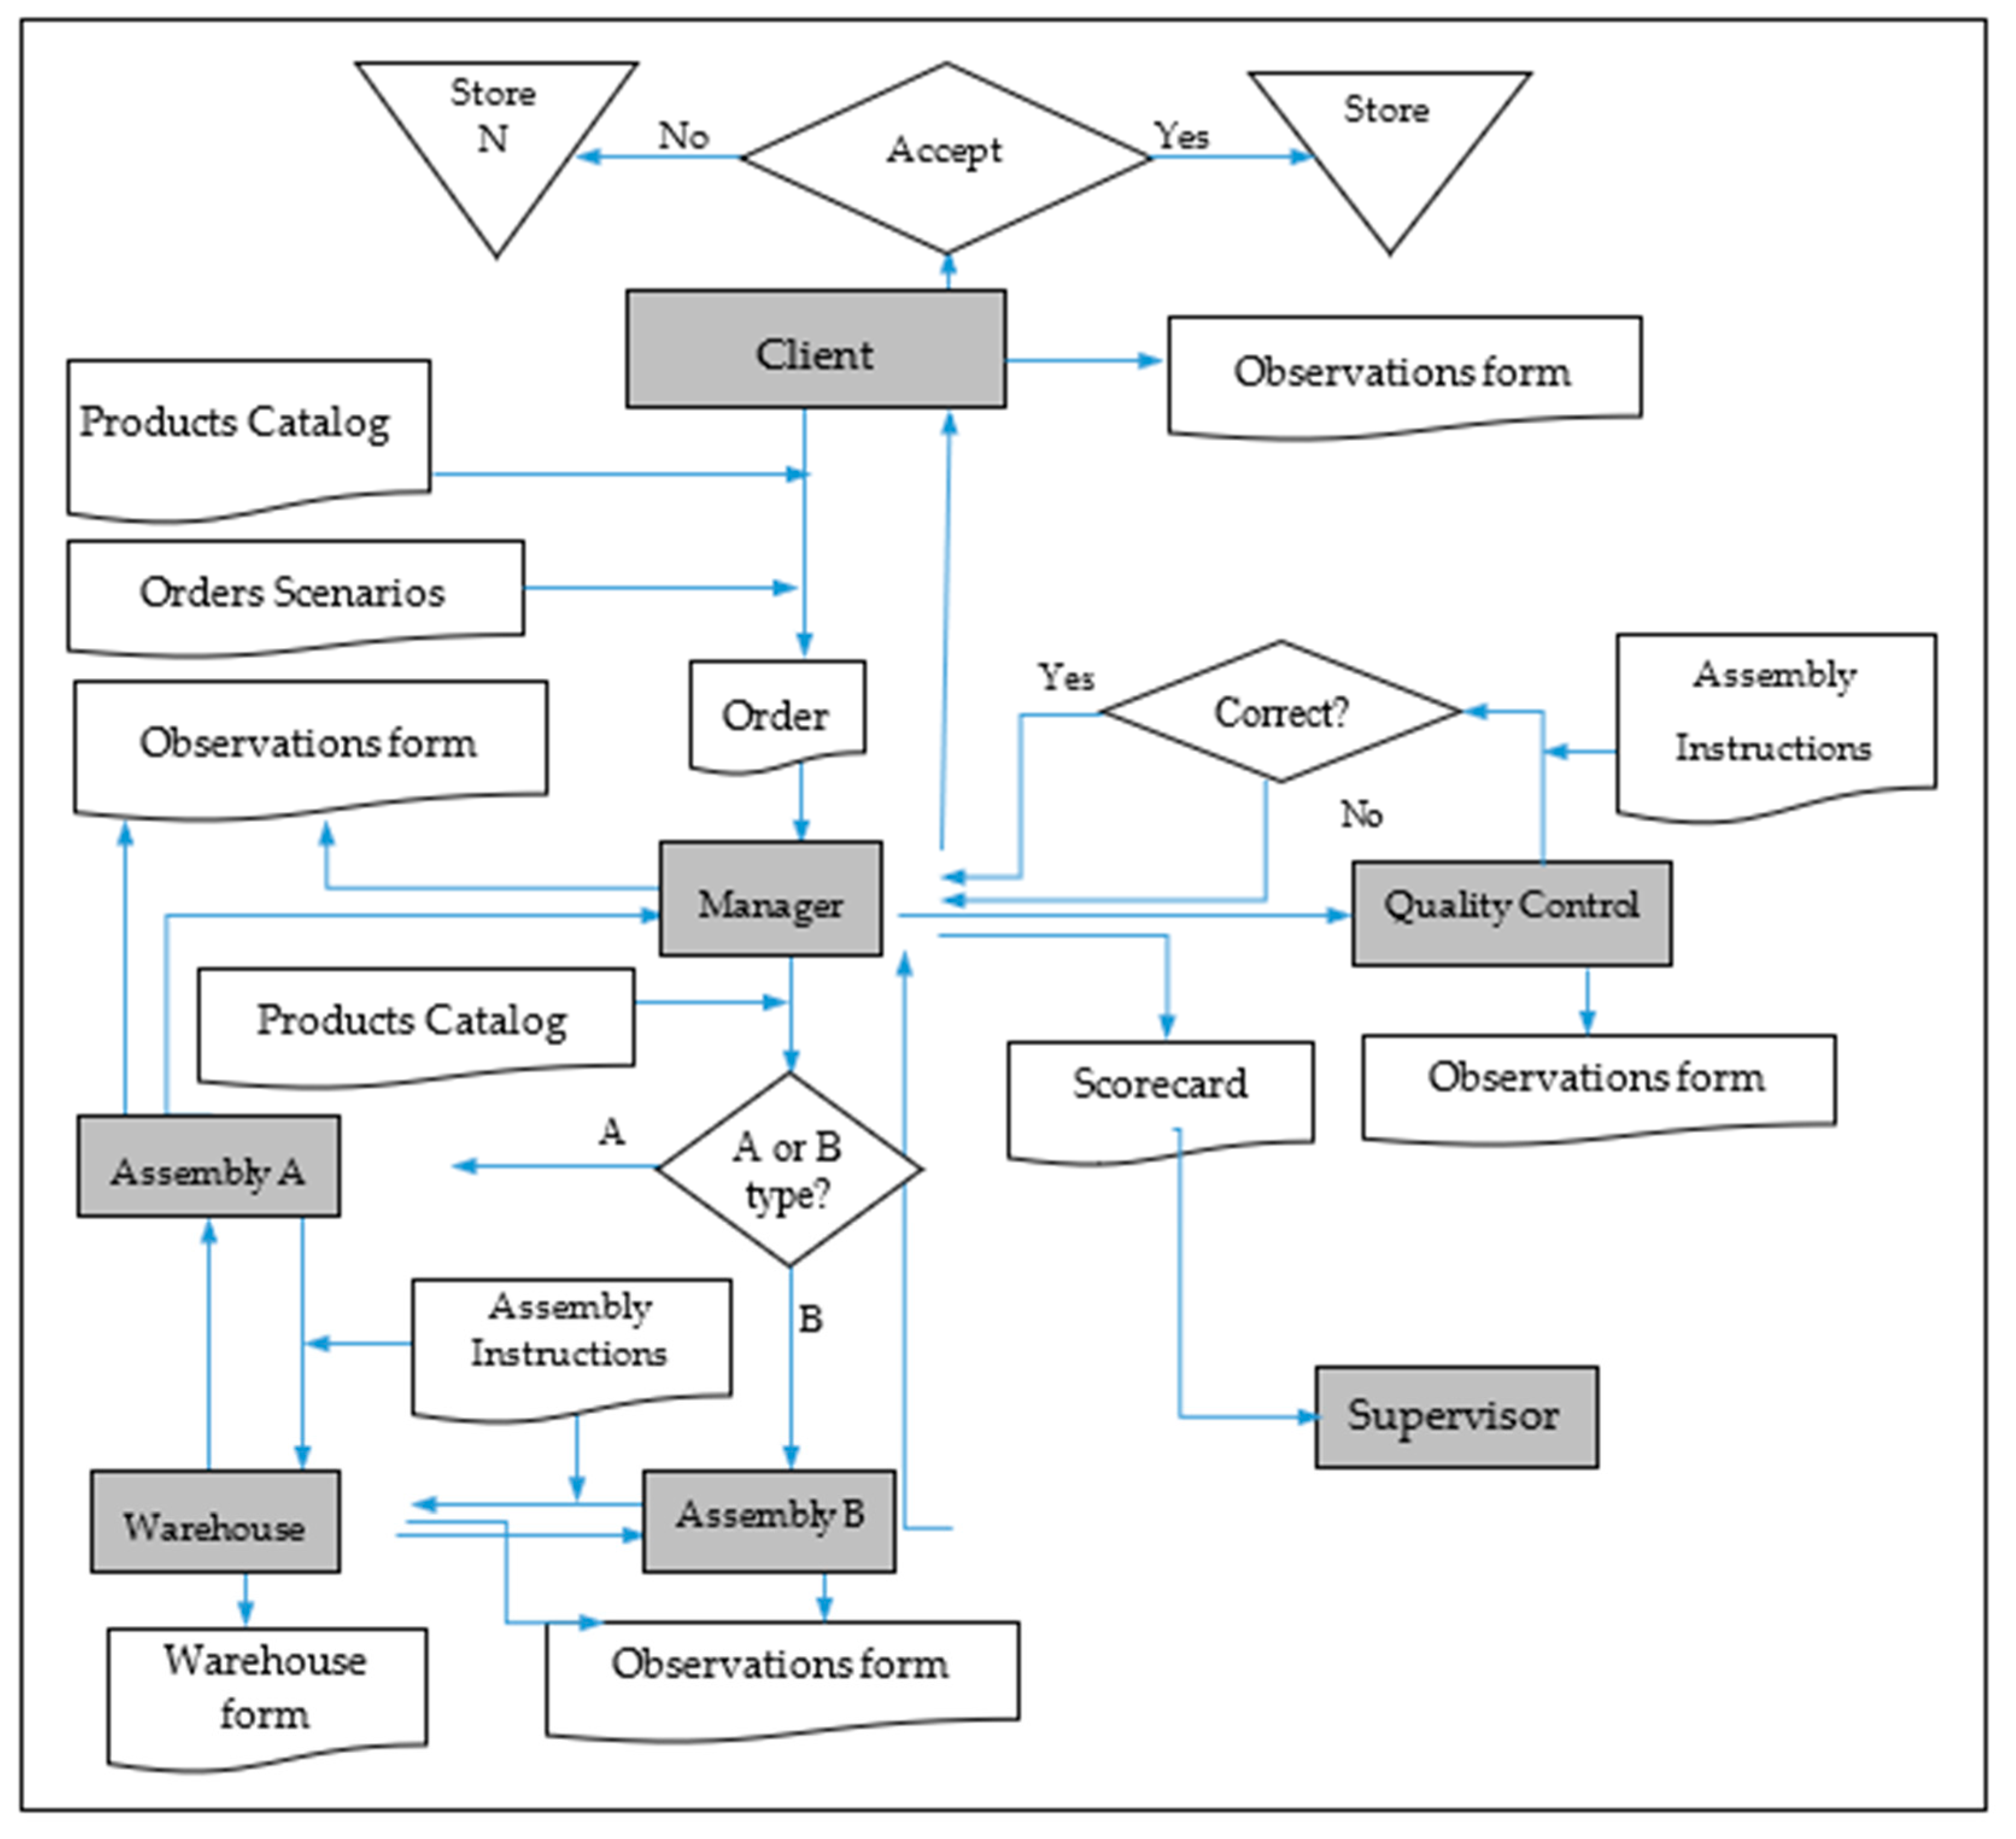
Playing this game will allow players: to participate to actual enterprise processes, to evaluate the process, to identify value added and non-value-added activities, to reduce/eliminate non-value-added activities and improve value-added activities, redesign the processes to eliminate wastes, apply lean and sustainability tools, and measure the efficiency of proposed solution through an aggregated indicator (SLIM indicator). The SLIM game flowchart is presented in
Figure 16. To explain in more details the algorithm of our game, we present the
Figure 17.
The game proposes a number of posts to cover the flow of production to meet client demands, and also the client. This includes: a warehouse for parts required for production/assembly (plastic building blocks), the production processes (assembling the parts), quality control, the manager and the client, but also the supervisor (who should be trained before the game started, or it should be one who has previously played the game). Each post will receive the job description sheet and all the forms required for the activity.
There should be at least two rounds (a round simulates a production shift/day). This is in order to compare the results of the rounds, based on proposed indicators, but also on the basis of the players’ suggestions filed in the observations form.
We propose a SLIM aggregate index (SLIMx) that includes loss reduction and improvements using lean and sustainability tools. The SLIMx index is measured in points and, like in a game, more points means the system/activity is more “slim”. The formula for SLIMx was finalized and validated after the game was tested (see the game test phase section), and it is presented in Equation (1):
where:
SLIMxi = SLIM index for round i (pts);
NPDi = Number of Products Delivered to Client in round i (pts), where 1 piece = 1 point; and
0RC
i = Indicator of “Zero Rejected Products by Client” (pts) (Equation (2)):
0QC
i = Indicator of “Zero Products Not Passing Quality Control” (pts) (Equation (3)):
I
PCT(∆i) = Indicator of Production Cycle Time (PCT) improvement (decrease) from the previous round, calculated from the second round on Equation (4):
I
WP(∆i) = Indicator of Workforce Productivity (WP) improvement (increase) from the previous round, calculated from the second round on Equation (6):
ISC = indicator for Standard Compliant Activity (pts), which measures the players’ activity with respect to the standards in place (procedure, rules, work instructions on job description, fill in necessary forms completely and correctly).
This last indicator is an objective one and is estimated by the supervisor, using a scale from 0–5 (from “not at all compliant” to “totally compliant”). All other indicators are objective and can be calculated from scorecard form (by who play the manager role or anybody else appointed by the manager). From the indicator formula, we can see that SLIM index can be as minimum as 0 (activity is not “slim”) and can go more than 10 point for round one, and 20+ for further rounds.
During each round, and between rounds, players are encouraged to write down all the problems/inconsistencies encountered in their activity, as well as possible solutions to resolve problems and for improvement. To analyze and improve the activity it is intended to propose players to use known lean and sustainability tools. The most useful tools would be here: Kaizen, 5S, Poka Yoke, Bottleneck Analysis, 7 Wastes, LCA (Life Cycle Assessment), Eco-design, Learning curve, Pull systems, and Problem solving (Trial and Error Method). From these tools students are successfully applying the following: improve each time you can (does not matter how little), sort, set in order, clean, standardize (make rules and follow them), make a habit of doing the right and only the right activity, the right way and at right time, analyzing all types of waste possible, make time to analyze the activity (player’s own activity and the entire game activity), and try new ways of doing it (even if will not leading to improvement, using the trial and error learning method).
The solutions proposed by the players are discussed, approved (by the manager or by vote) and implemented. All procedures/forms needed to be modified are modified. Being a game, rewards/prizes can be considered and offered for different results obtained by the players during the game and at the end for individual and/or team success.
In the end, discussions may be moderated to find possibilities of implementing improvement proposals in enterprises, at the workplace of the players.
The game is flexible in different ways: duration, type and number of post/players, activities, ordering scenarios, etc. The game can run for a minimum recommendation of 60 min, but it can take up to two, four, or more hours, depending on the duration of a round (recommended between 15 and 45 min), depending on the number of players (minimum six, without a maximum), depending on the number of spare parts available, or depending on the customer order scenario (more or less products can be ordered, or less or more often during a round). Other types of posts can be added: logistics (transport between posts may be one of the most probable/frequent problems), human resources (player/employee evaluation), accounting and financial (to assess the results and establish the efficiency of the activity), and marketing (to promote products, establish new products, etc.).
We recommend to start the game without prior training of the players, all that they need to know and do is written in the job description. Additionally, the work instructions must be sufficiently detailed and clear that the activity can be performed, but with obvious (or less obvious) possibilities for improvement, such as: better activities description, more detailed information, clearer/larger pictures and step-by-step or piece-by-piece assembly algorithms. The game space should be sufficient, but also with the possibility to extend it if players propose, when bottlenecks appear on the activity flows.
The game was tested by playing it in a new educational laboratory with 15 players over three rounds, with teachers playing the supervisor position. The new educational laboratory, called “LeanSusLab” was created especially for teaching students using games, in the framework of a research project “Research and didactic laboratory: “Lean and Sustainability”. The test results exceeded expectations. The players were happy, even delighted, by the game (general feedback score of 4.87 out of 5), as a role playing game (4.80) with the possibility to participate on actual processes of an enterprise, by individual and team work requirements, by the interactivity (4.93), and by the applicability of what they learn (4.60). Game shortcomings where more related to playing the game, as they do not understand exactly what and how they are supposed to do their job. A great deal of improvement possibilities and solutions were pointed out, and some of them were implemented with relative success (the trial and error method was emphasized). Following the game test in the laboratory, we validated the algorithm, activities, and forms of the game, and the SLIMx indicator was finalized as in Equation (1) previously presented (with subindicators in Equations (2)–(7)).
7. Conclusions, Discussion, and Limitations
Possible application of the instrument/game are: students use the game for training in the mentioned domain (engineering and management) with the possibility to expand to other connected domain, at all levels (license, master, doctorate); the use of anyone who wants to perfect lifelong (post and pre-university level) learning; employees’ use from the enterprises for professional perfection; and the use of potential employees and the unemployed for professional perfection/reconversion.
The use potential in the social and economic environments can be related to the possibility to exploit the intellectual property rights, especially for universities and other institutions and organizations/companies that offer training services.
The game has a limited number of job types, but with possibilities of extension already mentioned. Game applicability is limited to production processes, but with possibilities of extension to any workplace. It was designed as a paper-based system, which can be changed to a digitally-based system, using ITC technologies, mobile technologies—especially which can be used easily by players to check their role, responsibilities, work instructions, and forms to be filled in (digitally). These can help automated computation of results into KPIs, and the extension of KPIs used.
As future research the game should be used for education purposes in university and outside university, in companies interested in solutions for activity improvement. This supposes that the game should be tailored to meet specific needs anytime it is used. Before any use of the game, a needs study should be carried out, using the questionnaire already designed, but which can be modified according to research purposes.
The current research should be continued, and the questionnaire should be applied again in the future, at least yearly, with extension of the number of target companies/employees. The results can help improve the game to have a larger applicability in student education and in industry.


