Abstract
In this paper, we provide empirical evidence for understanding the growth behavior of China’s new generation of information technology (IT) industrial firms and the impact of innovation and market power on them. Based on the data of China’s new generation IT industrial firms covering the period 2000–2007, we use ordinary least square (OLS) and two-stage least squares (IV-2SLS) methods to study the effects of innovation and markup on the growth of China’s new generation IT industrial firms in the framework of Gibrat’s law. IV-2SLS estimations show that: (1) Innovation and markup have positive and significant effects on the firm’s total revenue growth rate, but have no significant or negative effects on the growth rate of the firm’s total assets and employment. (2) Innovation has a positive and significant effect on the firm’s mark-up. The results indicate that for China’s new generation IT industrial firms which are technology-intensive, improving the technological innovation and market power will reduce the firm’s input and increase the firm’s output. Innovation can significantly increase the firm’s mark-up. (3) From the perspective of the dynamic evolution of a firm’s growth, firm size has a negative and significant impact on the firm growth while firm age has a positive and significant impact on the firm’s growth. In addition, we also examine the different effects of capital intensity and export demand on the firm’s growth.
1. Introduction
The aim of the paper is to investigate the effects of innovation and market power on the growth of China’s new generation of information technology (IT) industrial firm. Here, we discuss the characteristics of the new generation IT industry and provide the research background, which can lay foundations for further study. Information has always been an important carrier for the evolution of human civilization. From words, pictures, voice to today’s high-definition video, the rapid change of information technology is changing human production, living and consumption. Compared with traditional industries, IT industry has stronger incremental effect, multiplier effect and technology spillover effect. Its development has surpassed the IT industry itself and is becoming the engine of technological innovation and industrial development in various fields. The development of the IT industry plays an important role in promoting national scientific and technological innovation strength, promoting economic and social development, and improving national overall competitiveness. In the Decision of China’s State Council on Accelerating the Cultivation and Development of Strategic Emerging Industries in 2010 and the Outline of China’s Twelfth Five-Year Plan for National Economic and Social Development in 2011, the strategic deployment of accelerating the development of the new generation IT industry has been clearly defined, and the six major industries including the next generation communication network, internet of things, three-network integration, new flat panel display, high-performance integrated circuits and high-end software industry represented by cloud computing have been regarded as the new generation IT industry. During China’s 13th Five-Year Plan period, the new generation IT industry will become a key promoted industry.
As one of the seven strategic emerging industries, the new generation IT industry has the following main characteristics: Firstly, it has the characteristics of high technology content, rapid industrial overlap and replacement, and rapid development. The new generation IT industry covers six major industries including the next generation communication networks, the internet of things, the convergence of three networks and so on, all of which belong to high-tech industries. At the same time, with the rapid development of information technology and network technology based on the internet, as well as the emergence of new business models and new information technology, the new generation IT industry also has the characteristics of short life-cycles and rapid industrial overlap. This also shows that the innovation of the new generation IT industry is uncertain and high-risk. Secondly, it has strong penetration ability and great driving effect. In fact, the new generation IT industry has infiltrated and merged with many other industries, resulting in many sub-industries such as e-commerce, online payments, network animation, basic components, software and information services, data transmission and services. The new generation IT industry can break through its own scope of development, not only open up and develop traditional industries, but also play a positive role in promoting energy conservation and emission reduction, science and technology and people’s livelihoods. Thirdly, it has great growth potential and good comprehensive benefits. The new generation IT industry belongs to the knowledge-intensive industry with less assets and more technology. Its growth potential is relatively large and its comprehensive benefits are relatively high. Obviously, there are differences between the new generation IT industry and traditional industries, and its development has its own characteristics. Under China’s new normal economy at present, promoting the development of the new generation IT industry is not only the realistic need of upgrading and optimization of the industrial and economic structure, but also an important way of relying on innovation to drive sustainable economic development. Implementing innovation-driven development is a key factor for the new generation of IT industrial firms to gain competitive advantage, cultivate core competitiveness and promotes the firm growth. How does innovation and market power influence the growth of the new generation of IT industrial firms? The research on this issue can provide empirical evidence for understanding the growth behavior of China’s new generation of IT industrial firms and the impact of innovation and mark-up on it. The study is very meaningful. In view of this, we will use the related data of China’s new generation of IT industrial firms to make an empirical study by measuring the innovation and mark-up variables.
Compared with previous studies, the main contributions of our study are as follows: firstly, based on the new empirical industrial organization (NEIO) method, we provide the measurements for innovation and mark-up variables. Secondly, we estimate the effects of innovation and mark-up on the growth of the new generation of IT industrial firms in China. We find that innovation and mark-up have positive and significant effects on a firm’s total revenue growth rate, but have no significant or negative effects on a firm’s total assets growth rate and employment growth rate. Thirdly, in the framework of Gibrat’s law, we test the effects of firm size and firm age on firm growth, and the results show that the firm size has a negative and significant impact on firm growth, and firm age has a positive and significant impact on firm growth. Fourthly, we also examine the impact of innovation on the firm’s mark-up. The results show that innovation can indeed improve a firm’s mark-up. In this paper, we find out the growth characteristics of the new generation IT industrial firms in China’s context and the impact of innovation and mark-up on them. The previous literature is not directly involved in this dimension; our study can enrich the related literature.
The remaining structure of this paper is organized as follows. Section 2 reviews the related literature. In Section 3, we present the econometric model, variables and data illustration. Section 4 provides the empirical results and their analysis. Section 5 concludes the paper and puts forward relevant policy recommendations.
2. Related Literature
In this paper, we will set up econometric models in the framework of Gibrat’s law, and analyze the effects of innovation and mark-up on the growth of China’s new generation of IT industrial firms. The related literature includes the following respects.
Firstly, our study is related to Gibrat’s law in particular. Gibrat’s law suggests that firm growth is a random process, and does not depend on firm size (it is also called Gibrat’s Law of Proportionate Effect or LPE). Since Gibrat’s law was put forward by Robert Gibrat in 1931, the study on the relationship between firm size and firm growth or the market structure on the basis of Gibrat’s law has become an important branch in the industrial organization field [1]. However, there are no definite conclusions about Gibrat’s law. As Sutton [2] says, Gibrat’s law is just a hypothesis rather than an established law [3]. Early empirical studies mostly support Gibrat’s law [4,5,6], but later empirical studies based on larger scope data find that Gibrat’s law is not valid, and many empirical studies find that firm size has a negative and significant impact on firm growth [7,8,9,10,11,12], which leads to the deviation of firm size distribution from the equilibrium distribution [4,5,13,14,15]. In view of the negative correlation between firm growth and firm size in the real economy, according to the hypothesis of market effectiveness, economists have put forward a variety of theoretical explanations. For example, Jovanovic [16] establishes the “noise” selection model (also known as the “learning” theory), Dixit [17], Hopenhayn [18] and Cabral [19] put forward the “sunk cost” theory, and Colley and Quadrini [20], Cabral and Mata [13] and Glementi and Hopenhayn [21] propose the “financial constraints” theory. However, some empirical studies find that although Gibrat’s law is not valid, there is a positive correlation between firm size and firm growth [22]. Gibrat’s law not only depicts the natural law of firm growth dynamics, but also provides a theoretical framework and empirical basis for studying the determinants of firm growth and the characteristics of firm size distribution. Around the question of whether Gibrat’s law is valid or not, economists have done lots of studies on the regularity and differences of firm size and growth with the data of firms in different countries or regions, different industries or departments [3,23,24,25,26,27,28]. Grounded in Gibrat’s law, for China’s new generation IT industry, we will examine the stylized facts on the growth dynamics of the new generation IT industrial firms, and then examine the effects of innovation and mark-up on it.
Secondly, the present analysis is closely related to literature on the effects of innovation and mark-up on firm growth. In this respect, the existing literature mainly studies the effect of innovation on firm growth. Since Schumpeter [29] proposed the concept of “innovation”, innovation, studying this has received increasing attention among economists. Szopik-Depczyńska et al. [30] think that innovation is a key determinant of sustainable development. Rogers [31] believes that firm innovation refers to the ability and willingness of the firm to introduce novel and practical products and services through the process of innovation (concept generation, experimentation and commercialization). Benner and Tushman [32] as well as He and Wong [33] argue that innovation enables firms to concentrate more on the development of new products and bring them into a new technological track or product-market field. In theory, there is no single theoretical model about the impact of innovation on firm growth. Usually, the analysis of the relationship between innovation and firm growth is included in the framework of Gibrat’s law. Hopenhayn [18] introduces innovation as an exogenous variable into a firm’s growth process. Later, some studies begin to use more complex models to study the impact of innovation on firm growth. Klette and Kortum [34] construct a general equilibrium model including technological innovation, which depict the dynamic evolution of a single heterogeneous firm (firm dynamics), and explain why R&D investment is independent of firm size and growth. The model constructed by Segerstrom [35] explains the innovation behavior of high-tech industry (Intel) firms. In high-tech industry (Intel), small and large firms are the main innovators. Therefore, the intensity of research and development (R&D) investment of firms has nothing to do with firm size. Theoretical analysis shows that R&D investment cannot produce long-term growth effect, but it can increase the employment share of R&D activities and improve the social welfare in the long run. Laincz [36] describes the dynamic evolution process of a firm’s size by constructing a Schumpeter general equilibrium model, and studies the effect of R&D funding on long-term growth and industrial concentration. Luttmer [26] also uses the general equilibrium model to describe the effects of stochastic factors of productivity and capital accumulation on the firm’s entrance and exit, growth and size distribution. Acemoglu and Cao [37] analyze the different innovative behaviors of new entrants and incumbent firms by building an extended Schumpeter growth model with innovation heterogeneity, depict the growth dynamics of firms under general equilibrium conditions, and analyze the impact of different innovative behaviors on the growth dynamics of firms. From the empirical perspective, the analysis regarding innovation and R&D effects on firm growth is also extensive [38]. Generally speaking, there are two main conclusions about whether innovation can promote firm growth. One is that innovation has a positive and significant impact on firm growth. For example, Falk [27] finds that R&D innovation investment has a significantly positive impact on firm growth based on a study using the data of Austrian firms from 1995 to 2006. Capasso et al. [39] use the data of Dutch firms during the period 1996–2011 with quantile regression method, and find that R&D investment in technological innovation has a positive and statistically significant impact on the firm’s growth rate in 90% quantiles. Others believe that there is an insignificant or even a negative impact relationship between firm innovation and firm growth. For example, Liu et al. [40] find that R&D investment has long-term benefits for firm growth by using the data of electronic firms in Taiwan from 1990 to 1994. However, short-term R&D investment is not important for firm growth. Boermans and Roelfsema [41] study the internationalization, innovation and growth of small firms based on data from 150 Dutch small firms participating in export promotion projects. They find that internationalization directly or indirectly promotes the growth of firms through innovation, but the direct impact of innovation on the growth of small firms is not obvious. It can be seen that the impact of innovation on firm growth is not conclusive. Therefore, it is necessary to undertake an empirical study on the impact of innovation on the growth of the new generation IT industrial firms in China.
Mark-up represents the ratio of product price to marginal cost, which is an important index to measure firm’s profitability. Its index can reflect not only the level of a firm’s productivity (reflected by marginal cost), but also firm’s product quality (reflected by product price), so it can comprehensively and accurately measure a firm’s market monopoly power [42]. It is one of the important symbols of a firm’s dynamic competitiveness. The reason why firms can dominate the development pattern of the industry is that they have formed the dynamic competitiveness of “high mark-up, high profit and continuous innovation” [43]. However, due to the difficulty in obtaining and measuring product price and marginal cost, the estimation of mark-up has always been a difficult problem in the study of industrial organization. At present, there are two main methods for calculating firm’s mark-up. The first is the accounting method, which uses data such as wage cost, raw material cost and revenue to calculate the mark-up. Early studies mainly use this method, such as Domowitz et al. [44] which use this method to calculate the mark-up of American manufacturing industry, and study the relationship between business cycle and industrial mark-up. The second is the method used by the NEIO [45], which has been developed in recent years. The basic idea is to calculate the mark-up by estimating the production function, demand function and elasticity under the framework of market equilibrium analysis. Although the accounting method makes it easy to calculate the mark-up, there are differences between accounting variables and economic variables because of some indicators. More importantly, there is the possibility of artificial changes in accounting data [46]. NEIO method is based on mathematical model deduction, which calculates the mark-up by using the information of demand and/or supply side. The method is more scientific and reliable. In recent years, many studies have been carried out on mark-up, which are relatively concentrated in the field of international economy and trade. For example, De Loecker and Warzynski [47], based on the pioneering research of Hall [48], use the semi-parametric method in Levinsohn and Petrin [49] to better deal with the deviation measurement of mark-up caused by unobservable factors. They calculate a firm’s mark-up and discuss the relationship between mark-up and export. Brandt et al. [50] study the impact of trade liberalization on the innovation and mark-up of China’s firms. However, the existing literature lacks empirical studies on the impact of the mark-up on firm growth. In view of this, we will use the NEIO method to measure firm’s mark-up, and empirically examine the impact of mark-up on the growth of China’s new generation IT industrial firms.
Thirdly, the related literature is involved in studying the relationship between innovation and mark-up. The main purpose of a firm’s innovation investment is to obtain monopoly rent [23,51], so it can increase the rate of a firm’s premium. From the perspective of influence channels, there are two main channels. One is the price channel. Through innovation, a firm can improve product quality and raise product price. Therefore, a firm’s mark-up is constantly improved [52]. The second is the cost channel. Innovation has size effect. The results of any knowledge and technology innovation will be disseminated and shared among different branches. Therefore, the larger the firm size, the lower the firm marginal cost of innovation. With the decrease of production cost, the improvement of operation efficiency and the increase of product market demand, the mark-up will be improved [53]. At present, the impact of innovation on a firm’s mark-up has also been studied. For example, Liu and Huang [54] use the data of China’s industrial firms from 2001 to 2007 to study empirically the impact of product innovation on a firm’s mark-up. The results show that product innovation can significantly improve a firm’s mark-up. We will undertake an empirical study on whether the new generation IT industrial firm innovation in China has indeed improved its mark-up.
Fourthly, there is some recent literature related to our topic which inspires our study. Barba et al. [55] study 871 firms in Spain and find that the intensity of a firm’s adoption of information and communications technologies (ICT) has a significant and positive effect on the firm performance in terms of reducing business costs, increasing income, and improving productivity and so on. The results in Barba et al. [55] surport the findings by Torrent-Sellens and Díaz-Chao [56] as well as Venturi [57]. While Ulmanis and Deniņš [58] find no significant changes are reported in ICT use by Latvian firms in the time period 2008–2011, they observe that the large number of ICT users in general do receive greater increased opportunities from ICTs for facing up to financial crisis challenges. Empirical evidence on the effect of ICT at firm level is mixed and inconclusive [59], therefore, future work should address this topic further.
The above literature provides abundant and useful material for our study. Referring to the above literature, we focus on studying the impact of innovation and mark-up on firm growth in China’s new generation IT industry.
3. Econometric Models, Variables and Data
3.1. Model Specification
Based on Gibrat’s law, we set up econometric models to analyze empirically the effects of innovation and mark-up on the growth of China’s new generation IT industrial firms. The basic econometric models are established as follows:
where the explained variable lnSizerateit is the growth rate of firm i at the time t both in model (1) and model (2). In model (1), the explanatory variable lnTfpit indicates the firm’s productivity and is used to examine the effect of firm innovation on firm growth. In model (2), the explanatory variable lnMarkupit indicates the firm’s mark-up and is used to examine the effect of a firm’s market power on firm growth. The main control variables include firm size lnSizeit-1, firm age lnAgeit-1 and their quadratic terms lnSize2it-1 and lnAge2it-1 as well as their interaction term lnSizeit-1 × lnAgeit-1. Other control variables are the firm’s capital-labor ratio lnKLit and export dummy variables D_Ex. ωf captures firm’s ownership fixed effects which control the nature of the firm’s ownership; ηg captures firm’s regional fixed effects which control firm’s regional characteristics; ξh captures firm’s industry fixed effects which control the firm’s industry characteristics; μi captures firm’s individual fixed effects which control the firm’s individual effects; νt captures firm’s year fixed effects which control the firm’s time effects (Where the firm’s ownership can be roughly divided into 10 types according to the type of registration of industrial firms, such as limited liability, limited shares and private firms and so on. According to the general standard, mainland China contains 31 provinces, municipalities and autonomous regions. According to the national economic industry classification code (2002 Edition), C40 can be divided into 21 small industries. As the industry classification before 2002 is different from that after 2002, we adjust the industry classification. In the paper, there are 16 industry classifications after the adjustment.). εit is the error term. Using models (1) and (2), we can test Gibrat’s law and analyze empirically the effects of innovation and mark-up on the growth of new generation IT industrial firms in China. In which the test of Gibrat’s law is mainly judged by the estimation coefficient of firm size on firm growth. If it is significantly not zero, Gibrat’s law is rejected; otherwise, Gibrat’s law is accepted.
lnSizerateit = β0 + β1lnTfpit + β2lnSizeit-1 + β3lnAgeit-1 + β4lnSize2it-1 + β5lnAge2it-1
+ β6lnSizeit-1 × lnAgeit-1 + β7lnKLit + β8D_Ex + ωf + ηg + ξh + μi + νt + εit
+ β6lnSizeit-1 × lnAgeit-1 + β7lnKLit + β8D_Ex + ωf + ηg + ξh + μi + νt + εit
lnSizerateit = β0 + β1lnMarkupit + β2lnSizeit-1 + β3lnAgeit-1 + β4lnSize2it-1 + β5lnAge2it-1
+ β6lnSizeit-1 × lnAgeit-1 + β7lnKLit + β8D_Ex + ωf + ηg + ξh + μi + νt + εit
+ β6lnSizeit-1 × lnAgeit-1 + β7lnKLit + β8D_Ex + ωf + ηg + ξh + μi + νt + εit
3.2. Variables
(1) Firm size (lnSizeit) and firm’s growth rate (lnSizerateit)
Firm size lnSizeit is measured by logarithm of the firm’s employment lnEmpit, logarithm of the firm’s total assets lnTtastit and logarithm of the firm’s total revenue lnRevenueit. A firm’s growth rate lnSizerateit is expressed by the change rate of firm size, i.e., lnSizerateit = lnSizeit − lnSizeit-1. Accordingly, a firm’s growth rate is measured by the growth rate of the firm’s employment lnEmprateit, the growth rate of the firm’s total assets lnTtastrateit and the growth rate of the firm’s total revenue lnRevenuerateit.
(2) Firm innovation (lnTfpit)
Measurement of the innovation is critical for both practitioners and academics, and different innovation measurements are used in different situations. For example, R&D investment is frequently used as innovation input; patent data and numbers of new products are widely accepted as proxy measures for innovation output. Indeed, the term “innovation” is notoriously ambiguous and lacks either a single definition or measure [60,61]. In our paper, based on the NEIO method, we use a logarithm of the firm’s total factor productivity lnTfpit to measure the level of firm innovation. For the estimation, existing studies show that semi-parametric methods such as the Olley-Pakes (OP) and Levinsohn-Petrin (LP) methods, can better solve endogeneity and sample selection problems than other traditional measurement methods [49,62]. Compared with the OP method which uses investment as an agent variable of unobservable productivity disturbance factors, LP method has relative advantages in estimation by using intermediate input. However, due to the correlation between labor input and intermediate input, the first stage estimation of the LP method may produce multiple collinearity problems. Ackerberg et al. [63] improve the LP method and propose the Ackerberg-Caves-Frazer (ACF) method. In the first stage of estimation, labor input is incorporated into the decision-making demand function of intermediate input to overcome the multiple collinearity problems. Compared with the OP and LP methods, the ACF method has significant advantages in dealing with endogeneity, selection bias and missing variables bias. In view of this, we mainly choose the ACF method to estimate the firm’s productivity, and establish an econometric model by using the translogarithmic production function.
where Yit indicates the total output measured by firm’s total revenue; Lit indicates the labor input measured by firm’s employment; Kit indicates the capital stock measured by the net value of fixed assets; and Mit indicates the intermediate input. Error terms include the unobservable random perturbation term ωit which can affect input decision-making and the random perturbation term νit which is not related to input. The key difference between them is that ωit is a state variable that can affect the input decision-making of producers. This will lead to endogeneity problems in production function estimation. If the simultaneity between ωit and input is neglected, the estimation will be inconsistent. Therefore, like the LP method, when using the ACF method to estimate the production function, we use logarithm of intermediate input lnMit as the proxy variable of unobservable productivity. Then, we can obtain the firm’s productivity lnTfpit based on the estimation results. It should be pointed out that in order to make the estimation more accurate, we also use the method in Lu and Yu [64] and control the influence of factors such as export demand, industry characteristics, regional differences and year effects. In addition, for firm innovation, we also use firm’s labor productivity lnYLit as a substitution variable to carry out the robustness tests. Where firm’s labor productivity is measured by logarithm of the ratio of firm’s total revenue to firm’s employment.
lnYit = ψLlnLit + ψKlnKit + ψMlnMit + ψLLlnL2it + ψKKlnK2it + ψMMlnM2it + ψLKlnLit × lnKit
+ ψLMlnLit × lnMit + ψKMlnKit × lnMit + ψLKM lnLit × lnKit × lnMi + ωit + νit
+ ψLMlnLit × lnMit + ψKMlnKit × lnMit + ψLKM lnLit × lnKit × lnMi + ωit + νit
(3) Firm’s mark-up ()
According to De Loecker and Warzynski [47], we use the production function estimation to calculate the firm’s mark-up based on intermediate inputs, assuming that the quadratic differentiable production function of the firms is:
Yit = Yit(Lit, Kit, Mit, ωit)
Then the Lagrangian function of cost minimization can be expressed as:
where rit indicates the price of capital, wit indicates the price of labor, i.e., firm wage, PM,it indicates the price of intermediate inputs. Then we can obtain the first derivative of intermediate inputs in Equation (5) as follows:
where λit = is the firm’s marginal cost for a given level of output, the firm’s mark-up can be defined as the ratio of the price to the marginal cost, i.e., Markupit = . In Equation (6), is the output elasticity of intermediate input , let θMit = ; indicates the share of intermediate input in total revenue, let αMit = . Therefore, the firm’s mark-up can be defined as:
L(Lit, Kit, Mit, ωit) = witLit + PM,itMit + ritKit + λit[Yit − Yit(∙)]
Markupit = θMit(αMt)−1
Equation (7) shows that for calculating the firm’s mark-up, the output elasticity of intermediate input θMit and the share of intermediate input in total revenue αMit need to be estimated. In this paper, the firm’s mark-up takes its logarithmic form lnMarkupit, so we can get:
lnMarkupit = lnθMit − lnαMit
The output elasticity of intermediate input θMit is derived from the estimated production function (3), that is:
The income share of intermediate inputs is calculated directly from the data in this paper, that is:
where PM,itMit is measured by the nominal value of firm’s intermediate input, PitYit is measured by the nominal value of firm’s total revenue. In addition, we also use the net profit rate of total assets ROAit as a substitution variable for the firm’s mark-up to check the estimation robustness. ROAit is measured by the ratio of the net profit to firm’s total assets.
(4) Firm age (lnAgeit)
Firm age lnAgeit is calculated according to its establishment period and observation period. It is expressed in logarithmic terms in the model. Firm age can be regarded as an agent variable of “learning by doing” effect in the growth dynamics of the firms [16]. Jovanovic’s “learning” theory emphasizes the importance of market selection mechanism on firm growth. According to the research, under the market competition mechanism, firms with higher efficiency grow faster. The growth rate of large-scale firms is lower because of their lower efficiency, and the growth rate of small-age firms that can survive is higher because of their higher efficiency. Firm growth is not only affected by firm size, but also related to firm age. In view of this, we add firm size lnSizeit-1, firm age lnAgeit-1 and their quadratic terms lnSize2it-1 and lnAge2it-1 as well as their interaction term lnSizeit-1 × lnAgeit-1 to examine the effects of firm size and firm age on the growth of the new generation IT industrial firms. At the same time, in order to investigate the effects of firm size and firm age in the last period on the current growth rate of the firm, we use the first-order lag value of the firm size and firm age to study the impact of the firm size and firm age in last period on the current growth rate of the firm.
(5) Capital-labor ratio (lnKLit) and export dummy variables (D_Ex)
Capital-labor ratio lnKLit is measured by logarithm of the ratio of the net value of fixed assets to the firm’s employment. According to the suggestions of Doms et al. [65], Yang and Huang [66], adding capital-labor ratio to the firm growth regression model can explain the heterogeneity of the firms. The export dummy variable D_Ex indicates whether a firm is an export firm. When the firm is an export firm, it is 1, otherwise it is 0.
3.3. Data
The data in this paper are mainly from the Annual Survey of Industrial Firms (ASIF) published by the National Bureau of Statistics of China during the period 2000–2007. The database covers all state-owned industrial firms and non-state-owned industrial firms above scale (that means the industrial firms with scale above a certain level.). It has the characteristics of large sample size, complete information and reliable sources, and is widely used by economists. The data processing is as follows: firstly, we merge the cross-section data from 2000 to 2007 into a panel dataset according to the information of firm code, firm name, legal representative and area code by using the method in Brandt [67]. Secondly, to obtain a clean sample and rule out outliers, we delete the following kinds of observations which do not obviously accord with the facts from the original data set: (1) observations whose values are zero or negative (such as the values of firm’s annual total assets, total revenue, employment, industrial output value, industrial value-added, original value of fixed assets and net value of fixed assets, as well as total wages, welfare and intermediate input and so on); (2) misclassified observations whose operation sizes are clearly smaller than the classification standard of “above scale” firms, such as the value of total revenue is less than 5 million Yuan, original value of fixed assets is less than 1 million Yuan, and employment is less than 30 people; (3) observations for which one of the following is true: total assets are less than current assets, total assets are less than the original value of fixed assets, total assets are less than the net value of fixed assets and accumulated depreciation is less than the depreciation in current year. Thirdly, we drop the firms’ data from other industries in the industrial firms’ database, and select the communication equipment, computer and other electronic equipment manufacturing firms with a two-digit industry code of C40 as the sample of the new generation IT industrial firms in China, including the data of 16 four-digit industries. (According to the national economy industry classification code (2002 edition) C40 can be divided into 21 sub-categories. Because the industry classification standards before 2002 and the industry classification standards after 2002 have changed, this paper adjusts the industry classification according to Brandt et al. [67].) Through the above selection process, we obtain 33,284 observations in total. It should be pointed out that when using various firms’ indicators to construct variables, the relevant price indices are selected to make some suitable adjustments. (Where output price index and input price index come from Brandt et al. [67], and fixed asset investment price index is from China Statistical Yearbook over the years.) Data descriptive statistics of the main variables are shown in Table 1.

Table 1.
Descriptive statistics of main variables.
4. Empirical Results and Their Analysis
4.1. Basic Model Estimation and Analysis
We run OLS regressions to estimate the basic models (1) and (2) by using the growth rate of the firm’s employment, total assets and total revenue as the explained variables respectively. Table 2 reports the regression results. Firstly, we analyze the effect of innovation on the growth of the new generation IT industrial firms. The results reported in column (1)–(3) of Table 2 show that the effect coefficient of innovation on the growth rate of the firm’s employment is negative and significant, the effect coefficient on the growth rate of the firm’s total assets is insignificant, and the effect coefficient on the growth rate of the firm’s total revenue is positive and statistically significant. This result shows the stylized facts that innovation has an impact on the growth of new generation IT industrial firms with typical technology-intensive characteristics: the increase of productivity or innovation will increase output and reduce labor input. Secondly, we analyze the effect of the firm’s mark-up on the growth of the new generation IT industrial firms. The results reported in columns (4)–(6) of Table 2 show that the effect coefficient of the firm’s mark-up on the growth rate of the firm’s employment is negative and significant, while the effect coefficients on the growth rate of the firm’s total assets and total revenue are positive and significant. This result shows the stylized facts of the effect of the mark-up on the firm’s growth of the new generation IT industry: increasing the firm’s market power will reduce the firm’s labor input, and increase the firm’s capital input and revenue output. In addition to the differences in the impact coefficient of capital investment, the impact of mark-up on the growth of new generation IT industrial firms is similar to that of innovation on the growth of new generation IT industrial firms. Thirdly, for the regression results of control variables, the influence coefficient of firm size on firm growth is negative and significant, which indicates that the relationship between firm size and firm growth in the new generation IT industry does not follow Gibrat’s law. The effect coefficient of the quadratic term of firm size on firm growth is positive and significant; the effect coefficient of firm age on firm growth is insignificant or negative. The quadratic term of firm age has a negative and significant impact or has no significant impact on firm growth; the interaction between firm size and firm age has a positive and significant impact on firm growth. After controlling for other variables, the marginal effects of firm size and firm age on firm growth can be respectively expressed as ESize = lnSizerateit/ lnSizeit-1 and EAge = lnSizerateit/ lnAget-1. At the mean of the sample, firm size has a negative and significant effect on firm growth, while firm age has a positive and significant effect on firm growth. This result is not entirely consistent with the prediction of Jovanovic’s “learning” theory. Relatively speaking, the efficiency of large-size firms is low, and their growth rate is also low under the market selection mechanism which does not comply with Gibrat’s law. The result indicates that there is “size dependence” in the new generation IT industrial firms. As a new strategic industrial firm, the new generation IT industrial firm has the characteristics of rapid industrial overlap and short product life cycle. The longer the survival time of the firm, the more adaptable, more managerial experience. and higher production efficiency it possesses. Therefore, firm age can promote the firm’s growth, there is no “age dependence”, which is inconsistent with Jovanovic’s “learning” theory prediction. The increase of the capital-labor ratio will reduce the firm’s employment and increase the firm’s total assets, but it has no significant impact on the total revenue of the firms. The increase of export demand will significantly and positively affect the growth rate of the new generation IT industrial firms, which shows that the growth of the new generation IT industrial firms has export-oriented characteristics.
Table 2.
Basic model estimation results.
4.2. Robustness Checks
For the robustness checks of the estimation results, we estimate the models in the following two respects: firstly, we use the substitution variables of the main variables to regress the models; secondly, we consider the endogeneity problem and use the instrumental variables to regress the models.
4.2.1. Estimation with Substitution Variables
Regarding the substitution variables, we use the firm’s labor productivity as the variable of firm innovation, and use the firm’s net profit rate of total assets to measure the firm’s mark-up. Table 3 reports the estimation results with the substitution variables. The results show that labor productivity has a negative and significant impact on the firm’s employment growth rate, while it has a positive and significant impact on the growth rates of the firm’s total assets and total revenue; the firm’s net profit rate has no significant impact on the firm’s employment growth rate, but has a negative and significant impact on the growth rate of the firm’s total assets, while it has a positive and significant impact on the growth rate of the firm’s total revenue. Compared with the regression results of the basic models, the results show that the impacts of innovation and mark-up on employment growth and total revenue growth of the new generation IT industrial firms are basically the same, while the impacts on the growth rate of firm’s total assets are different. An important reason for the inconsistency may be that the endogeneity of the model leads to the inconsistency of OLS regression. Regarding of this, the following instrument variables will be used to re-estimate the models. The results of the estimation of the related control variables are basically consistent with those of the basic model, and they will not be analyzed or listed in this paper.
Table 3.
Estimation results with substitution variables.
4.2.2. Treatment of Endogeneity Problems: IV-2SLS Estimation
In reality, for the new generation IT industrial firms, firm innovation will affect firm growth, in turn, firm innovation will also be affected by firm growth. Similarly, there is also an interactive relationship between the firm’s mark-up and growth. Because of the possible causal relationship between innovation, mark-up and firm growth, there will be an endogeneity problem in explanatory variables, which leads to the inconsistency of OLS regression. For the treatment of endogeneity problems, we use IV-2SLS to estimate the models. For the selection of instrumental variables, firstly, we choose the lag value of the firm’s productivity (lnTfpit) and mark-up (lnMarkupit) as instrumental variables. Because the lag values of productivity and mark-up are highly correlated with the current values, they do not directly affect the current growth rate of the firms. Therefore, they can be used as instrumental variables. In this paper, the first-order lag values of lnTfpit and lnMarkupit (lnMarkupit-1 and lnMarkupit-1) are selected as the instrumental variables. Secondly, we choose the average value of the firm’s productivity and mark-up in each region ( and ) as instrumental variables. Because the average value of the firm’s productivity in each region and the firm’s productivity lnTfpit are highly correlated while the relationship between the average value of the firm’s productivity in each region and the growth rate of individual firms is relatively weak. Therefore, can also be used as the instrumental variable of . Similarly, can also be used as the instrumental variable of lnMarkupit. Considering the lag effect of the variables, we choose first-order or second-order lag average values of the firm’s productivity and mark-up in each region as the instrumental variables. In this paper, when we make IV-2SLS estimations, we use the above two instrumental variables at the same time. Table 4 reports the IV-2SLS regression results. The Hausman test shows that there are significant differences between OLS estimation and IV-2SLS estimation, which can indicate that there exist the endogeneity problems in OLS estimation. The test results of Anderson Canon. Corr. LM statistics show that there are endogeneity problems in explanatory variables; Cragg–Donald Wald F statistics show that the selected instrumental variables are highly correlated with the explanatory variables, and there are no problems of weak instrumental variables; Sargan test results show that there are no over-identifying problems, indicating that the selected instrumental variables are effective. IV-2SLS regression results show that innovation has no significant impact on the employment growth rate and the total assets growth rate of the new generation IT industrial firms, but has a positive and significant impact on the growth rate of the firm’s total revenue. Compared with OLS estimation results, it has reduced the significant level of impact of innovation on the firm’s employment growth rate, while it has increased the effect of innovation on the growth rate of the firm’s total revenue. Compared with OLS regression, the effects of mark-up on the growth rate of the firm’s employment and total revenue are increased, while the effect of mark-up on the growth rate of the firm’s total assets is insignificant. The regression results of the related control variables are basically the same as that of OLS regressions, and will not be analyzed or listed in this paper.
Table 4.
Two-stage least squares (IV-2SLS) estimation results.
It can be seen that using instrumental variables to overcome the endogeneity problem, the estimation results show that innovation and mark-up have positive and significant effects on total revenue growth rate of the new generation IT industrial firms, but have no significant or significantly negative effects on the growth rate of firm’s employment and total assets (The result about the effect of innovation on the growth rate of the new generation IT industrial firms is somewhat different from Aldieri et al. [68], on the basis of European, Japanese and American firms between 2002 and 2010, they find that there is a positive and significant impact of environmental spillovers on firms’ employment levels.). Moreover, using IV-2SLS regression improves the effect coefficient of innovation and mark-up on the growth rate of the firm’s total revenue. The above results show that improving firm innovation and market power can improve the output of the new generation IT industrial firms, but the impact on the firm’s input is not significant or negative. On the one hand, with the increase of innovation or market power, the use of labor and capital will be saved because of the improvement of technological innovation or the enhancement of monopoly competitiveness. On the other hand, with the increase of innovation or market power, the market scale will be enlarged, the output will be raised and the input of firms will be increased. In these two aspects, innovation and mark-up have a significantly positive impact on firm’s output, but have no significant or negative impact on firm’s input. This is more prominent for the new generation IT industry.
4.3. Test of the Relationship between Innovation and Firm’s Mark-Up
The above research results present that the impacts of innovation and mark-up on the growth of new generation IT industrial firms are similar. A further research question is: what is the relationship between innovation and mark-up, or can innovation really improve the mark-up of the new generation IT industrial firms? In Figure 1, the scatter plots and fitting curves on innovation and mark-up in (a) and (b) show that there is a positive correlation between firm innovation and mark-up in the new generation IT industry, whether from firm level or from region level. According to the figure analysis, we can preliminarily believe that the new generation IT industrial firm innovation can promote the firm’s mark-up.
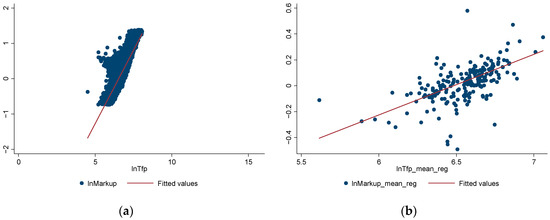
Figure 1.
(a) Scatter plot and fitting curve of lnTfp (lnTfpit) and lnMarkup (lnMarkupit); (b) scatter plot and fitting curve of lnTfp_mean_reg() and lnMarkup_mean_reg().
In order to empirically test the impact of innovation on mark-up of the new generation IT industrial firms, we establish the following econometric model to analyze:
where the explained variable is lnMarkupit, the explanatory variable is lnTfpit. The main control variables include firm size lnSizeit-1, firm age lnAgeit-1 and their quadratic terms lnSize2it-1 and lnAge2it-1 as well as their interaction term lnSizeit-1 × lnAgeit-1. Other control variables are the firm’s capital–labor ratio lnKLit and export dummy variables D_Ex. ωf captures the ownership fixed effects, ηg captures the regional fixed effects, ξh captures the industry fixed effects, μi captures the individual fixed effects, νt captures the year fixed effects, εit is the erro term.
lnMarkupit = ϒ0 + ϒ1lnTfpit + ϒ2lnSizeit-1 + ϒ3lnAgeit-1 + ϒ4lnSize2it-1 + ϒ5lnAge2it-1
+ ϒ6lnSizeit-1 × lnAgeit-1 + ϒ7lnKLit + ϒ8D_Ex + ωf + ηg + ξh + μi + νt + εit
+ ϒ6lnSizeit-1 × lnAgeit-1 + ϒ7lnKLit + ϒ8D_Ex + ωf + ηg + ξh + μi + νt + εit
For the estimation of model (11), considering the endogeneity problem caused by the causal relationship between firm innovation and firm’s mark-up, we mainly use IV-2SLS to estimate, and give the results of OLS estimation as a comparison. Similarly, in order to use reasonable instrument variables, we also choose the first-order lag value or the second-order lag value of firm innovation variables and the first-order lag value or the second-order lag value of the regional mean of firm innovation variables as instrument variables. The estimation results are shown in Table 5. The results show that innovation has a positive and significant impact on the firm’s mark-up in the new generation IT industry. The results of IV-2SLS estimation show that the selection of instrument variables is effective. Compared with OLS estimation results, IV-2SLS method overcomes endogeneity problem and improves the effect of innovation on the firm’s mark-up in the new generation IT industry. This result shows that technological innovation or productivity improvement of new generation IT industrial firms can improve their profitability or monopoly market power. The estimation results of relevant control variables, can be anylized as following. At the sample mean, the firm’s employment size has a significantly negative impact on the mark-up of the new generation IT industrial firms, while the firm’s total assets and total revenue size have a positive and significant impact on the mark-up of the new generation IT industrial firms. The results show that increasing the employment input of the new generation IT industrial firm will reduce the firm’s mark-up, while increasing the firm’s total assets and total revenue can improve the firm’s mark-up. Moreover, firm age consistently has a positive and significant impact on the firm’s mark-up. The result shows that the older the firm is, the greater its market power will be. Considering the influence of firm age on the firm’s growth rate, it can be seen that survive longer is more beneficial for the new generation IT industrial firms. The capital–labor ratio of the firm has no significant or positive effect on the firm’s mark-up of new generation IT industry. The result indicates that the mark-up of a new generation IT industrial firms is affected by the allocation of firm’s resources. Compared with the increase of labor input, the increase of capital input is more likely to increase the firm’s mark-up. The export demand of the firms is conducive to the growth of the new generation IT industrial firms, while it has a negative and significant impact on mark-up of the new generation IT industrial firms. The result indicates that the more developed export trade, the more open the economy, the stronger the market competition, the lower the profit margin or mark-up of the new generation IT industrial firms.
Table 5.
Estimation results of innovation and mark-up.
5. Conclusions and Policy Recommendations
In the 21st century, human society has entered the era of the knowledge economy and an information technology world. The rapid development of information technology is changing people’s production, living and consumption styles. China’s new generation IT industry has achieved rapid development. The firm’s innovation ability is the crucial to gain competitive advantage and growth. Porter [69], an economist, put forward the concept of “innovation” by using diamond theory and competitive advantage as the research tools. He believes that innovation is one of the main sources of competitive advantage. However, firm innovation has the characteristics of high risk, high transformation cost and positive externalities. It is precisely because of these characteristics that whether technological innovation and the competitive advantages brought by it can really effectively promote firm growth deserves in-depth study, especially for the new generation IT industrial firms which are technology-intensive. In view of this, based on Gibrat’s law, we make an empirical study on this issue using the data of the new generation IT industrial firms in China during the period 2000—2007. The empirical results show that innovation and mark-up can significantly improve the output of the new generation IT industrial firms and reduce the input of the firms. There is a significantly positive correlation between innovation and mark-up. In addition, our results also show that firm size has a negative and significant effect on firm growth, while firm age has a positive and significant effect on firm growth. The increase of capital-labor ratio will reduce the firm’s employment growth and promote the increase of the firm’s total assets, but have no significant impact on the firm’s total revenue growth. Although export demand will positively affect the firm’s growth rate, the increase of export competition will also reduce their profit rate or mark-up.
Based on the above results, we put forward the following policy recommendations. Firstly, it should promote the growth of the new generation IT industrial firms by innovation-driven processes. From the firm itself, it should improve the ability of independent innovation to promote the growth of the firms. From the government level, it should create and cultivate a good market environment for firms to innovate, enhance the strength of the firms to implement innovation support, and promote the firms to carry out independent innovation. Secondly, it should improve the profitability or market power of the new generation IT industrial firms to promote their growth. Promoting the growth of the new generation IT industrial firms requires a certain monopoly competitive advantage and needs to improve market power. Technological innovation is an important way to improve market competitiveness. Thirdly, from the evolution law of firm growth, the larger the firm size, the lower the firm’s growth rate, and the older the firm, the higher the firm’s growth rate. Therefore, on the one hand, it should reduce the dependence of firm growth on its size through market selection mechanism. It should not only focus on the growth of large enterprises, but also promote the entry of new firms and pay attention to the growth of small and medium-sized firms. On the other hand, it should improve the survival rate or life cycle of the new generation IT industrial firms through innovation mechanisms to promote the growth of the new generation IT industrial firms. Finally, to promote the growth of the new generation IT industrial firms, it should also pay attention to the different impacts of capital intensity and export demand on the growth of the new generation IT industrial firms.
Author Contributions
H.L. designed the research project, collected the data, analyzed the literature, conducted the empirical analysis, and wrote the paper. L.J. reviewed and edited the paper. Y.D. discussed the paper writing and gave some useful comments.
Funding
This research was funded by Social Science Project of Zhejiang Province of China (No.17NDJC109YB), the Youth Fund Project of Humanities and Social Sciences of the Ministry of Education in China (No.18YJC790077), National Natural Science Foundation of China (No.71803093), K.C. Wong Magna Fund in Ningbo University.
Acknowledgments
This paper is financially sponsored by Social Science Project of Zhejiang Province of China (No.17NDJC109YB), the Youth Fund Project of Humanities and Social Sciences of the Ministry of Education in China (No.18YJC790077), National Natural Science Foundation of China (No.71803093) and K.C. Wong Magna Fund in Ningbo University. In addition, we thank the editors and the anonymous reviewers for their constructive comments and advices.
Conflicts of Interest
The authors declare no conflict of interest.
References
- Gibrat, R. Les Inégalités Économiques; Librairie du Recueil Sirey: Paris, France, 1931. [Google Scholar]
- Sutton, J. Gibrat’s Legacy. J. Econ. Lit. 1997, 35, 40–59. [Google Scholar]
- Audretsch, D.; Klomp, L.; Santarelli, E.; Thurik, A. Gibrat’s Law: Are the Services Different? Rev. Ind. Organ. 2004, 24, 301–324. [Google Scholar] [CrossRef]
- Hart, P.; Prais, S. The Analysis of Business Concentration: A Statistical Approach. J. R. Stat. Soc. 1956, 119, 150–181. [Google Scholar] [CrossRef]
- Simon, H.; Bonini, C. The Size Distribution of Business Firms. Am. Econ. Rev. 1958, 48, 607–617. [Google Scholar]
- Hymer, S.; Pashigian, P. Firm Size and Rate of Growth. J. Political Econ. 1962, 70, 556–569. [Google Scholar] [CrossRef]
- Evans, D. The Relationship between Firm Growth, Size and Age: Estimates for 100 Manufacturing Industries. J. Ind. Econ. 1987, 35, 567–581. [Google Scholar] [CrossRef]
- Hall, B. The Relationship between Firm Size and Firm Growth in the U.S. Manufacturing Sector. J. Ind. Econ. 1987, 35, 583–606. [Google Scholar] [CrossRef]
- Dunne, T.; Roberts, J.; Samuelson, L. The Growth and Failure of U.S. Manufacturing Plants. Q. J. Econ. 1989, 104, 671–698. [Google Scholar] [CrossRef]
- Dunne, P.; Hughes, A. Age, Size, Growth and Survival: UK Companies in the 1980s. J. Ind. Econ. 1994, 42, 115–140. [Google Scholar] [CrossRef]
- Audretsch, D.B.; Santarelli, E.; Vivarelli, M. Start-up Size and Industrial Dynamics: Some Evidence from Italian Manufacturing. Int. J. Ind. Organ. 1999, 17, 965–983. [Google Scholar] [CrossRef]
- Almus, M.; Nerlinger, E.A. Testing Gibrat’s law for Young Firms—Empirical Results for West Germany. Small. Bus. Econ. 2000, 15, 1–12. [Google Scholar] [CrossRef]
- Cabral, L.; Mata, J. On the Evolution of the Firm Size Distribution: Facts and Theory. Am. Econ. Rev. 2003, 93, 1075–1090. [Google Scholar] [CrossRef]
- Rossi-Hansberg, E.; Wright, M.L.J. Establishment Size Dynamics in the Aggregate Economy. Am. Econ. Rev. 2007, 97, 1639–1666. [Google Scholar] [CrossRef]
- Angelini, P.; Generale, A. On the Evolution of Firm Size Distributions. Am. Econ. Rev. 2008, 98, 426–438. [Google Scholar] [CrossRef]
- Jovanovic, B. Selection and Evolution of Industry. Econometrica. 1982, 50, 649–670. [Google Scholar] [CrossRef]
- Dixit, A. Entry and Exit Decisions under Uncertainty. J. Political Econ. 1989, 97, 620–638. [Google Scholar] [CrossRef]
- Hopenhayn, H. Entry, Exit, and Firm Dynamics in Long Run Equilibrium. Econometrica 1992, 60, 1127–1150. [Google Scholar] [CrossRef]
- Cabral, L. Sunk Costs, Firm Size and Firm Growth. J. Ind. Econ. 1995, 43, 161–172. [Google Scholar] [CrossRef]
- Cooley, F.; Quadrini, V. Financial Markets and Firm Dynamics. Am. Econ. Rev. 2001, 91, 1286–1310. [Google Scholar] [CrossRef]
- Glementi, G.; Hopenhayn, H. A Theory of Financing Constraints and Firm Dynamics. Q. J. Econ. 2006, 121, 229–265. [Google Scholar]
- Samuels, J. Size and the Growth of Firms. Rev. Econ. Stud. 1965, 32, 105–112. [Google Scholar] [CrossRef]
- Klette, T.; Griliches, Z. Empirical Patterns of Firm Growth and R&D Investment: A Quality Ladder Model Interpretation. Econ. J. 2000, 110, 363–387. [Google Scholar]
- Nurmi, S. Plant Size, Age and Growth in Finish Manufacturing. Finn. Econ. Papers 2004, 17, 3–17. [Google Scholar]
- Hölzl, W. Is the R&D Behavior of Fast-growing SMEs Different? Evidence from CIS III Data for 16 Countries. Small. Bus. Econ. 2009, 33, 59–75. [Google Scholar]
- Luttmer, E.G.J. On the Mechanics of Firm Growth. Rev. Econ. Stud. 2011, 78, 1042–1068. [Google Scholar] [CrossRef]
- Falk, M. Quantile Estimates of the Impact of R&D Intensity on Firm Performance. Small Bus. Econ. 2012, 39, 19–37. [Google Scholar]
- Daunfeldt, S.O.; Elert, N. When is Gibrat’s Law a Law? Small Bus. Econ. 2013, 41, 133–147. [Google Scholar] [CrossRef]
- Schumpeter, J.A. Theory of Economic Development; Harvard University Press: Cambridge, UK, 1911. [Google Scholar]
- Szopik-Depczyńska, K.; Kędzierska-Szczepaniak, A.; Szczepaniak, K.; Cheba, K.; Gajda, W.; Ioppolo, G. Innovation in Sustainable Development: An Investigation of the EU Context Using 2030 Agenda Indicators. Land Use Policy 2018, 79, 251–262. [Google Scholar] [CrossRef]
- Rogers, E.M. Diffusion of Innovations; Free Press: New York, NY, USA, 2006; ISBN 978-0743222099. [Google Scholar]
- Benner, M.J.; Tushman, M.L. Process Management and Technological Innovation: A Longitudinal Study of the Photography and Paint Industries. Adm. Sci. Quart. 2002, 47, 676–706. [Google Scholar] [CrossRef]
- He, Z.; Wong, P. Exploration vs. Exploitation: An Empirical Test of the Ambidexterity Hypothesis. Organ. Sci. 2004, 15, 481–494. [Google Scholar] [CrossRef]
- Klette, T.; Kortum, S. Innovating Firms and Aggregate Innovation. J. Political Econ. 2004, 112, 986–1018. [Google Scholar] [CrossRef]
- Segerstrom, P. Intel Economics. Int. Econ. Rev. 2007, 48, 247–280. [Google Scholar] [CrossRef]
- Laincz, C.A. R&D Subsidies in a Model of Growth with Dynamic Market Structure. J. Evol. Econ. 2009, 19, 643–673. [Google Scholar]
- Acemoglu, D.; Cao, D. Innovation by Entrants and Incumbents. J. Econ. Theory 2015, 157, 255–294. [Google Scholar] [CrossRef]
- Audretsch, D.B.; Coad, A.; Segarra, A. Firm Growth and Innovation. Small Bus. Econ. 2014, 43, 743–749. [Google Scholar] [CrossRef]
- Capasso, M.; Treibich, T.; Verspagen, B. The Medium-term Effect of R&D on Firm Growth. Small Bus. Econ. 2015, 45, 39–62. [Google Scholar]
- Liu, J.; Tsou, M.; Hammitt, J. Do Small Plants Grow Faster? Evidence from Taiwan Electronics Industry. Econ. Lett. 1999, 65, 121–129. [Google Scholar] [CrossRef]
- Boermans, M.A.; Roelfsema, H. Small Firm Internationalization, Innovation, and Growth. Int. Econ. Econ. Policy 2016, 13, 283–296. [Google Scholar] [CrossRef]
- Huang, X.H.; Jin, Z.C.; Yu, L.H. Export, Innovation and Enterprise Ratio: Consideration based on Factor Intensity. World. Econ. 2018, 41, 125–146. (In Chinese) [Google Scholar]
- Ren, S.M.; Zhang, J. Subsidies, Rent-seeking Costs and Increment Rates: An Empirical Study based on China’s Equipment Manufacturing Enterprises. Manag. World 2013, 10, 118–129. (In Chinese) [Google Scholar]
- Domowitz, I.; Hubbard, R.G.; Petersen, B.C. Market Structure and Cyclical Fluctuations in U.S. Manufacturing. Rev. Econ. Stat. 1988, 70, 55–66. [Google Scholar] [CrossRef]
- Einav, L.; Levin, J. Empirical Industrial Organization: A Progress Report. J. Econ. Perspect. 2010, 24, 145–162. [Google Scholar] [CrossRef]
- Martin, S. Industrial Organization: A European Perspective; Oxford University Press: New York, NY, USA, 2001; ISBN 0198297289. [Google Scholar]
- De Loecker, J.; Warzynski, F. Markups and Firm-level Export Status. Am. Econ. Rev. 2012, 102, 2437–2471. [Google Scholar] [CrossRef]
- Hall, R.E.; Blanchard, O.J.; Hubbard, R.G. Market Structure and Macroeconomic Fluctuations. Brook. Pap. Econ. Activity 1986, 1986, 285–338. [Google Scholar] [CrossRef]
- Levinsohn, J.; Petrin, A. Estimating Production Functions Using Inputs to Control for Unobservables. Rev. Econ. Stud. 2003, 70, 317–342. [Google Scholar] [CrossRef]
- Brandt, L.; Biesebroeck, J.V.; Wang, L.H.; Zhang, Y.F. WTO Accession and Performance of Chinese Manufacturing Firms. Am. Econ. Rev. 2017, 107, 2784–2820. [Google Scholar] [CrossRef]
- Aghion, P.; Howitt, P. A Model of Growth through Creative Destruction. Econometrica 1992, 60, 323–351. [Google Scholar] [CrossRef]
- Aghion, P.; Bergeaud, A.; Lequien, M.; Melitz, M. The Impact of Exports on Innovation: Theory and Evidence; NBER Working Paper No. 24600; National Bureau of Economic Research: New York, NY, USA, 2018. [Google Scholar]
- Djankov, S.; Hoekman, B. Foreign Investment and Productivity Growth in Czech Enterprises. World Bank Econ. Rev. 2000, 14, 49–64. [Google Scholar] [CrossRef]
- Liu, Q.R.; Huang, J.Z. How does Product Innovation Affect the Firm’s Markup? World Econ. 2016, 39, 28–53. (In Chinese) [Google Scholar]
- Barba-Sánchez, V.; Calderón-Milán, M.J.; Atienza-Sahuquillo, C. A Study of the Value of ICT in Improving Corporate Performance:A Corporate Competitiveness View. Technol. Econ. Dev. Econ. 2018, 24, 1388–1407. [Google Scholar] [CrossRef]
- Torrent-Sellens, J.; Díaz-Chao, A. ICT Uses, Innovation and SMEs Productivity: Modelling Direct and Indirect Effects in Small Local Firms; Internet Interdisciplinary Institute Working Paper Series, 14-001; Open University of Catalonia: Barcelona, Spain, 2014. [Google Scholar]
- Venturi, F. The Modern Drivers of Productivity. Res. Policy 2015, 44, 357–369. [Google Scholar] [CrossRef]
- Ulmanis, J.; Deniņš, A. A Management Model of ICT Adoption in Latvia. Procedia Soc. Behav. Sci. 2012, 41, 251–264. [Google Scholar] [CrossRef]
- Pantea, S.; Sabadash, A.; Biagi, F. Are ICT Displacing Workers in the Short Run? Evidence from Seven European Countries. Inf. Econ. Policy 2017, 39, 36–44. [Google Scholar] [CrossRef]
- Adams, R.; Bessant, J.; Phelps, R. Innovation Management Measurement: A Review. Int. J. Manag. Rev. 2006, 8, 21–47. [Google Scholar] [CrossRef]
- Acur, N.; Kandemir, D.; Boer, H. Strategic Alignment and New Product Development: Drivers and Performance Effects. J. Prod. Innov. Manag. 2012, 29, 304–318. [Google Scholar] [CrossRef]
- Olley, S.; Pakes, A. The Dynamics of Productivity in the Telecommunications Equipment Industry. Econometrica 1996, 64, 1263–1297. [Google Scholar] [CrossRef]
- Ackerberg, D.A.; Caves, K.; Frazer, G. Identification Properties of Recent Production Function Estimators. Econometrica 2015, 83, 2411–2451. [Google Scholar] [CrossRef]
- Lu, Y.; Yu, L. Trade Liberalization and Markup Dispersion: Evidence from China’s WTO Accession. Am. Econ. J. Appl. Econ. 2015, 7, 221–253. [Google Scholar] [CrossRef]
- Doms, M.; Dunne, T.; Roberts, M.J. The Role of Technology Use in the Survival and Growth of Manufacturing Plants. Int. J. Ind. Organ. 1995, 13, 523–542. [Google Scholar] [CrossRef]
- Yang, C.; Huang, C. R&D, Size and Firm Growth in Taiwan’s Electronics Industry. Small Bus. Econ. 2015, 25, 477–487. [Google Scholar]
- Brandt, L.; Biesebroeck, J.V.; Zhang, Y.F. Creative Accounting or Creative Destruction? Firm-level Productivity Growth in Chinese Manufacturing. J. Dev. Econ. 2012, 97, 339–351. [Google Scholar] [CrossRef]
- Aldieri, L.; Carlucci, F.; Cirà, A.; Ioppolo, G.; Vinci, C.P. Is Green Innovation an Opportunity or a Threat to Employment? An Empirical Analysis of Three Main Industrialized Areas: The USA, Japan and Europe. J. Clean. Prod. 2019, 214, 758–766. [Google Scholar] [CrossRef]
- Porter, M.E. The Competitive Advantage of Nations; Free Press: New York, NY, USA, 1990; ISBN 9780684841472. [Google Scholar]

© 2019 by the authors. Licensee MDPI, Basel, Switzerland. This article is an open access article distributed under the terms and conditions of the Creative Commons Attribution (CC BY) license (http://creativecommons.org/licenses/by/4.0/).