Article

Chemical or Natural? Including LCA in Social CBA to Compare Remediation Alternatives for a Dry-Cleaning Facility

Centre for Economics and Corporate Sustainability (CEDON), KU Leuven, 1000 Brussels, Belgium
*
Author to whom correspondence should be addressed.
Sustainability 2019, 11(7), 1975; https://doi.org/10.3390/su11071975
Submission received: 1 March 2019 / Revised: 26 March 2019 / Accepted: 1 April 2019 / Published: 3 April 2019
(This article belongs to the Special Issue Green and Sustainable Remediation of Contaminated Site)

Abstract

:
The choice between remediation alternatives for contaminated sites is complicated by different elements, e.g., the occurrence of multiple contaminants, the extent of the contamination, or the urban location, complicate the choice between remediation alternatives. This paper addresses this challenging choice by analyzing a case study of an extensive soil and groundwater contamination by a dry-cleaning company. For remediating this site, two alternatives were proposed. The first remediation alternative combines several techniques with in-situ chemical oxidization being the most important one. Due to the potential negative impact of this alternative on local residents a second remediation alternative was drawn up, in which the focus lies on the use of stimulated biological degradation. A Life Cycle Assessment (LCA) was performed on both alternatives and showed that the second alternative had a lower environmental impact. The inclusion of monetized LCA results in the calculation of a social Cost-Benefit Analysis (CBA) provided a more extensive view of the secondary environmental costs and benefits of the remediation alternatives. The results of the social CBA allow to conclude that both alternatives are not socially desirable, the chemical alternative however is socially less disadvantageous than the more natural remediation alternative.

1. Introduction

Site contamination is a global problem that does not only affect our environment and ecosystems but also has an effect on human health. Due to industrial activities in the past, contaminants have found their way into the soil and groundwater. One of these harmful activities is dry cleaning of fabrics or materials. Dry-cleaning companies use liquid solvents, often perchloroethylene (PCE), to remove stains from all sorts of fabric. Improper use of equipment or poor disposal of this PCE and other volatile chlorinated hydrocarbons (VCHC) used for dry cleaning, has led to the contamination of more than thousands of sites throughout the world [1,2,3].
Sites contaminated with VCHCs often pose a burden to society. Due to the volatile nature of the solvents, they can easily spread and be inhaled and pose a significant risk to human health and ecosystems. The solvents are proven to be toxic and can cause liver and kidney problems, affect the central nervous system and even impact vision [4,5]. VCHCs are dense fluids and easily penetrate the soil, often resulting in the accumulation of these solvents deep within the soil above the none-permeable zone. When the solvents come into contact with groundwater, due to their very soluble nature, they can cause groundwater contamination with a high risk of spreading and forming contamination plumes [1,6,7]. Sites contaminated with VCHCs are a cost for society. Often, contaminated sites have limited usage due to the risks they pose, and sometimes the sites even remain unused, impeding economic and urban development.
There are several soil remediation techniques available to address sites contaminated with VCHCs, e.g., soil vapor extraction, excavation, biological remediation, chemical oxidization and multiphase extraction [8]. When the groundwater is also contaminated some additional techniques can be used, namely pump and treat, air sparging and monitored natural attenuation [8]. Even with all these remediation techniques, remediating sites contaminated with VCHCs often proves to be a complex process. For each remediation project a choice needs to be made on which technique or combination of techniques to use, and other determining factors, such as the cost of the project, need to be determined. In Flanders (Belgium), for example, the cost of remediating a site contaminated with VCHCs ranges from 60,000 euro to more than 2 million euro (based on 23 remediation projects in the period 1999–2009, [9]). In the United States of America, the median cost to remediate a dry-cleaning contamination is 235,000 dollars with exceptional cases exceeding a cost of 1 million dollars (based on 128 remediation projects in the period 1997–2006, [8]).
The selection of remediation technique(s) for a contaminated site can be performed with, for example, a BATNEEC analysis (Best Available Technique Not Entailing Excessive Costs) [10,11], a Multi-Criteria Analysis or a Deep Impact Analysis [12]. These types of analyses, however, do not always include the potential impacts of the remediation activities on the environment and society. Additional assessments, such as a Life Cycle Assessment (LCA) and/or a Cost-Benefit Analysis (CBA), can be performed to determine these possible impacts [13,14]. In the present paper, a case study of the remediation of a site contaminated with PCE caused by past dry-cleaning activities was analyzed, to assess the impact of the remediation project on society. In contrast to previous studies that assessed the environmental impact of remediation of PCE contamination (e.g., [14]), this study compares the environmental costs and benefits, as well as the social gains of a chemically based alternative with a less invasive biological remediation alternative, using a social CBA.
The paper starts with the description of the case on which the analysis was performed, introducing the case history, as well as the two remediation alternatives. The second part of the paper describes the methodology used for the social assessment of both alternatives. A third part discusses the secondary environmental impact of both alternatives. Finally, the outcome of the social Cost-Benefit Analysis is represented, aggregating private costs, the monetized environmental impact, the benefits of the remediation project and other external costs.

2. Materials and Methods

2.1. Dry Cleaning Case Study

2.1.1. Case History and Description

The case concerns the remediation of a former dry-cleaning site (with an area of 505 m2) in a densely populated city center in Flanders. At first, the site housed a workshop for the repair of motor vehicles, which explains the current presence of some underground gasoline tanks. These activities however, have not contributed to the contamination of the site. Later on, the laundry service company was founded on site in 1933. The dry cleaners started off small, providing the equipment needed for local families to do their own washing. With the introduction of the in-home washing machine, the business refocused, introducing the use of dry-cleaning solvents and industrial cleaning. By mid-1960s the small laundry service company had been turned into a large industrial dry cleaner. Due to the introduction of cheaper fabrics and soil contamination problems, the dry-cleaning facility was forced to close its doors and file for bankruptcy in 2011. Since 2013, the site is used as an art exhibition hall managed by the city. After the planned remediation, the site will continue to be used as an art exhibition hall [15].
The contamination of the soil and groundwater on site is thus caused by the historical dry-cleaning activities, and consists of volatile chlorinated hydrocarbons (VCHCs), which are typical chemicals used in the dry-cleaning process. The contamination is found to be very complex, consisting of several core and plume zones together with a pocket layer of DNAPL (dense non-aqueous phase liquid) at 28 m below soil surface. This is also the reason why the remediation of all these zones has been divided into several subprojects. In the present paper, the remediation of the three core zones (including the DNAPL pocket layer) and the effect of the contaminations on the local groundwater is addressed.
The main contaminant found on site is perchloroethylene, which poses a potential health risk. After remediation, the contamination load (which is estimated to mainly consist of 3300 kg PCE) should be reduced by 95%. The soil structure on site is made out of four distinct layers. A first layer up to 3 m below surface is made out of clayey deposits, the second layer (3–15 m below soil surface) contains mainly fine sand. The third, very water permeable, layer (between 15 and 28 m below soil surface) mainly consists of clay and fine sand and is underlain with an impervious clay layer (below 28 m depth). The groundwater level measured on site fluctuated through the years (2000–2012) between 4 and 10 m below surface due to works on the local sewer system. The groundwater level in 2015, after completion of these works, was 5 m below surface [16].

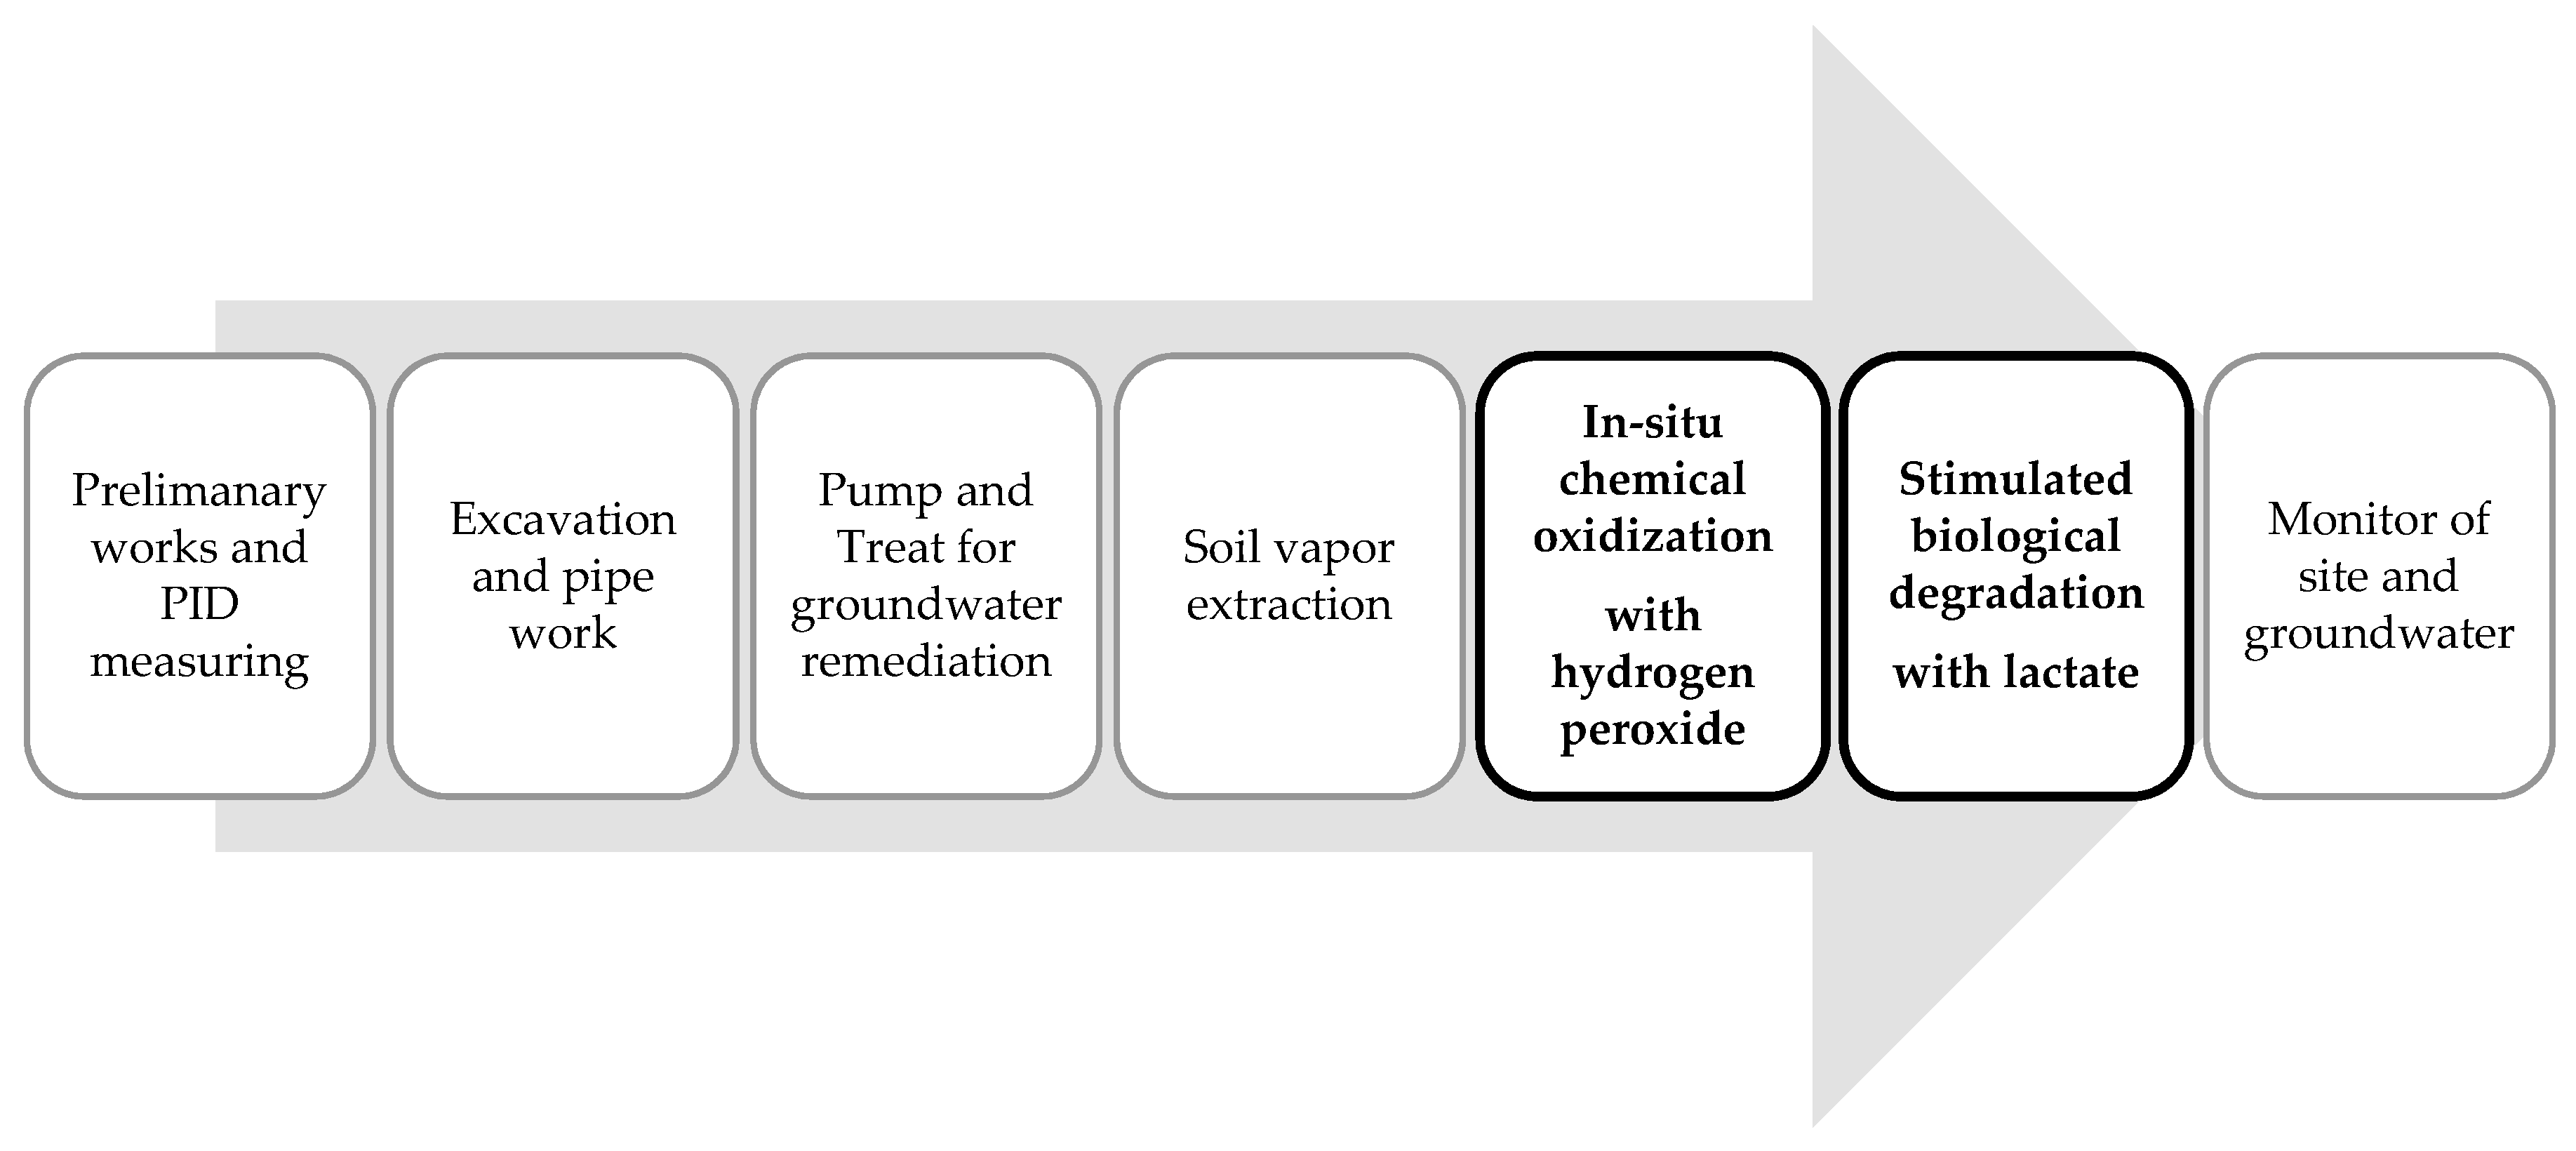
2.1.2. Remediation Alternatives

First of all, a thorough assessment of several remediation techniques taking into account the BATNEEC (Best Available Techniques Not Entailing Excessive Costs) principles was carried out by soil remediation experts in charge of the remediation project to eliminate any remediation technique that would prove inefficient to remove volatile hydrocarbons [15]. The BATNEEC analysis evaluated 10 potential techniques (excavation, soil vapor extraction, multiphase extraction, air sparging, pump and treat, in-situ chemical oxidization, reactive walls, stimulated biological degradation, natural attenuation and isolation) suitable for the remediation of VCHC contamination and indicated that a single remediation technique would not result in a thorough remediation. The soil remediation experts concluded that a combination of four remediation techniques (excavation, in-situ chemical oxidization combined with soil vapor extraction and stimulated biological degradation) had to be used to address the contamination in this case.
To achieve the 95% reduction of the contamination load, two different remediation alternatives were proposed. A first remediation alternative combining several remediation techniques (Figure 1) was elaborated. In this first alternative, in-situ chemical oxidization (ISCO) is paired with soil vapor extraction (SVE) as the main techniques to reduce the contamination load. This first alternative will be referred to as the “chemical alternative” in this paper. Due to the urban layout of the sewer system and the cellars beneath the adjacent houses to the site, the use of the ozone generator for ISCO would potentially lead to the evaporation of ozone in the homes of the nearby residents. This vapor, if too concentrated, could have an impact on the health of the local residents [16]. When starting the remediation works, PID (photoionization detector) measurements will be performed to test whether the concentrations of evaporated ozone in the houses of the nearby residents is not harmful [16].
In the case of a potential impact of ozone on the nearby residents, another remediation alternative will be implemented. This second alternative applies the same sequence of remediation techniques, and in the same order as the first option (Figure 1), but differs from the first alternative because it uses less oxidants and more lactate as an organic carbon source for the stimulated biological degradation. This second alternative thus focuses more on stimulation of the biological degradation of the contamination to reduce the pollution load. This alternative is referred to as the “natural alternative.” There are two main differences between the chemical and the natural alternative. The first is the amount of resources (hydrogen peroxide, activated carbon, electricity, water, lactate; see Table 1 and Table 2) used and the second one the estimated cost of the remediation (Table 3). The duration of the remediation, which is estimated to be six years (11 years including monitoring), is equal for both alternatives [16].

2.2. Monetized LCA and Social CBA

To assess the costs and benefits of a more natural alternative compared to the costs and benefits of a chemical alternative, a holistic assessment of the case has to be performed. The risk assessment and investment analysis, described in the exploratory and descriptive soil investigation reports did not include a full analysis of the different alternatives from a societal point of view but did provide the majority of data necessary to perform a more detailed assessment of the costs and benefits of the case study.
The method used in this paper is based on the research method developed in Huysegoms et al. [13], combining monetized LCA with CBA to allow for a more holistic analysis of the remediation alternatives. A Life Cycle Assessment (LCA) allows to quantify and analyze the environmental impact of the remediation works in both alternatives. An LCA consists of four key steps. The first step is the definition of the goal and scope of the study to clearly mark the boundaries of the life cycle and to set a functional unit. Secondly, based on the goal of the study, a Life Cycle Inventory (LCI) can be made through the collection of all data needed, relying on databases (for example, Ecoinvent), literature and project information. In the third step, the different impacts of the life cycle can be calculated based on a chosen impact assessment method. In the last part, the calculated environmental impact is interpreted and communicated and can be used in, for example, decision making processes [13].
By defining all the different steps within the life cycle of the remediation project, and by determining the inputs and outputs linked to each of the steps in the life cycle, it is possible to set the scope of the LCA and define the functional unit. Based on the information found in the exploratory and descriptive soil investigation reports [15,16] and in the literature on soil remediation techniques [17] a Life Cycle Inventory (LCI) was made. This LCI contains the inputs and outputs of each step of the remediation (Table 1). Based on the data, the environmental impact can be calculated and displayed either as an aggregated result (endpoint indicators) or as a series of midpoint indicators (for example global warming, particular matter, water use, etc.). The combination of both types of indicators allows for an in-depth comparison of the environmental impact of two remediation alternatives. For this case study the mid- and endpoint indicators were calculated with the use of the ReCiPe method, an impact assessment method developed by the Dutch National Institute for Public Health and the Environment. With this method, the life cycle inventory results are transformed into a limited number of indicator scores, expressing the relative severity of an environmental impact category [18].
Additional to the LCA, a Cost-Benefit Analysis (CBA) was drawn up to analyze the social profitability of the chemical and natural remediation alternative. In the present paper we performed a full social CBA of a site remediation, which includes all impacts to society, the direct and indirect financial costs and benefits as well as the health and environmental benefits and other relevant impacts. In the literature there is ambiguity about the terminology and definitions with respect to a CBA, which can be a private CBA or a social CBA [13]. A CBA can either be a private CBA based on the viewpoint of one particular stakeholder (e.g., a firm, a homeowner or a local community) or a social CBA based on the viewpoint of society as a whole (i.e., all affected stakeholders) [13]. A private CBA thus takes into account all the costs and benefits of a particular stakeholder—also known as a private agent—associated with the project [13]. In our assessment we aim to take into account all impacts for society as a whole and thus perform a social CBA [13]. This social CBA includes the estimated private costs, the health benefits of the remediation, as well as any externalities caused by the remediation activities, including the environmental impact of the remediation [13]. The inclusion of the environmental impact in the CBA is based on the LCA results, using a monetization technique to translate the environmental impact into a monetary value.
For this case study two different monetization techniques, Stepwise 2006 [19,20] and Ecovalue 2008 [21], were applied to the results of the LCA. These two techniques use assumptions and conversion ratios, for the translation of the environmental impact calculated in an LCA of the remediation alternative into a monetary value so that it can be introduced in the social CBA. These two techniques were initially chosen because they use European data for the monetization of the environmental impacts [13,20,21]. After performing the calculations, only the results monetized with Stepwise 2006 were included in the social CBA, because Stepwise 2006, in comparison to Ecovalue 2008, does allow for the monetization of several important impact categories, for example aquatic and terrestrial ecotoxicity, that are not included in Ecovalue 2008 [13,20,21]. Stepwise 2006 allows for the inclusion of 17 different environmental impact categories divided over three overall safeguard subjects (biodiversity, human well-being and resource productivity). The Life Cycle Inventory Analysis (LCIA) uses a combination of the IMPACT 2002+ and EDIP2003 method for the initial calculations [19,20]. Afterwards these impacts are converged and aggregated into the final impacts, which can either be expressed in QALY’s (Quality Adjusted Life Years), in BAHY’s (Biodiversity Adjusted Hectare Years) or in euros [19,20].
Based on the previously described data used in the social CBA, it was possible to assess the societal added value of each of the remediation alternatives by the calculation of its Net Present Value (see [13] for a more detailed explanation). The calculation of a Net Present Value (NPV) allows to aggregate present and future costs and benefits with the use of a chosen discount rate. In this paper, an initial social discount rate of 3% and a timeline of 30 years was chosen based on the recommendations made by different governmental institutions, including, for example, the European Commission and the World Health Organization, for CBA calculations for environmental projects [22,23]. This social discount rate is also used in the calculation of the environmental impact when using the ReCiPe method [23]. If the NPV of a certain project is positive, this project increases welfare. To assess the robustness of the results of the social CBA, a sensitivity analysis was performed by varying the values of several key elements (the discount rate, the private costs, the timeline for the health benefits, the non-use benefits of groundwater and biogenic carbon) while keeping all else constant. In addition, the effect of the use of substitutes for important substances (hydrogen peroxide and molasses) within some of the used remediation techniques on the NPV was analyzed.

3. Results

3.1. Environmental Impact

In this part of the paper the secondary environmental impact of the two proposed alternatives is quantified with the use of LCA. First of all, boundaries for the assessment need to be set by defining a functional unit. The SimaPro 8.4.0.0 software (PRé Consultants, Amersfoort, The Netherlands) was used to calculate the environmental impact of the remediation alternatives, based on the ReCiPe method (H) V1.13 [18]. Finally, the results for both alternatives are interpreted and compared.

3.1.1. Functional Unit

The functional unit needs to be set to allow for comparable results, but also to introduce system boundaries into an LCA. These boundaries help the assessor to make coherent decisions on which activities to include in the analysis without getting lost in the details of the life cycle. The functional unit was defined for this study as all the relevant products and processes needed for the remediation of a site contaminated with volatile hydrocarbons with a pollution load of 3300 kg PCE, to eliminate the potential human risk.

3.1.2. Life Cycle Inventory

All the information needed to build the Life Cycle Inventory (LCI) (Table 1) of the different remediation alternatives was retrieved from the soil investigation reports of the case study. Missing data on general production processes and resources were found in the Ecoinvent database and specific data on soil remediation techniques were available in a report on best available soil remediation techniques of Goovaerts et al. [17].
A gap in the Ecoinvent database related to the modelling of remediation case studies is the lack of data on activated carbon [13] and lactate. To cover the lack of information on activated carbon, the production of activated carbon was introduced into SimaPro so that it could be used as input to calculate the environmental impact of the Pump and Treat and Soil Vapor Extraction techniques. The inputs used for the production of one kilogram of activated carbon are listed in Table 2 and are based on the data found in the papers of Bayer et al. [24] and Jeswani et al. [25].
The lack of information on the production and impacts of lactate was addressed by replacing the organic carbon source needed for the stimulated biological degradation by molasses in the LCI. Molasses is also an organic carbon source often used in the remediation of VCHC contaminations with a similar efficiency compared to lactate [26] and an environmental impact of the same order of magnitude. The use of 1 kg of molasses generates an impact of 0.132 kg CO2 equivalents (calculated in SimaPro) and the use of 1 kg of lactate generates an impact between –0.2 and 0.6 kg CO2 equivalents [27].

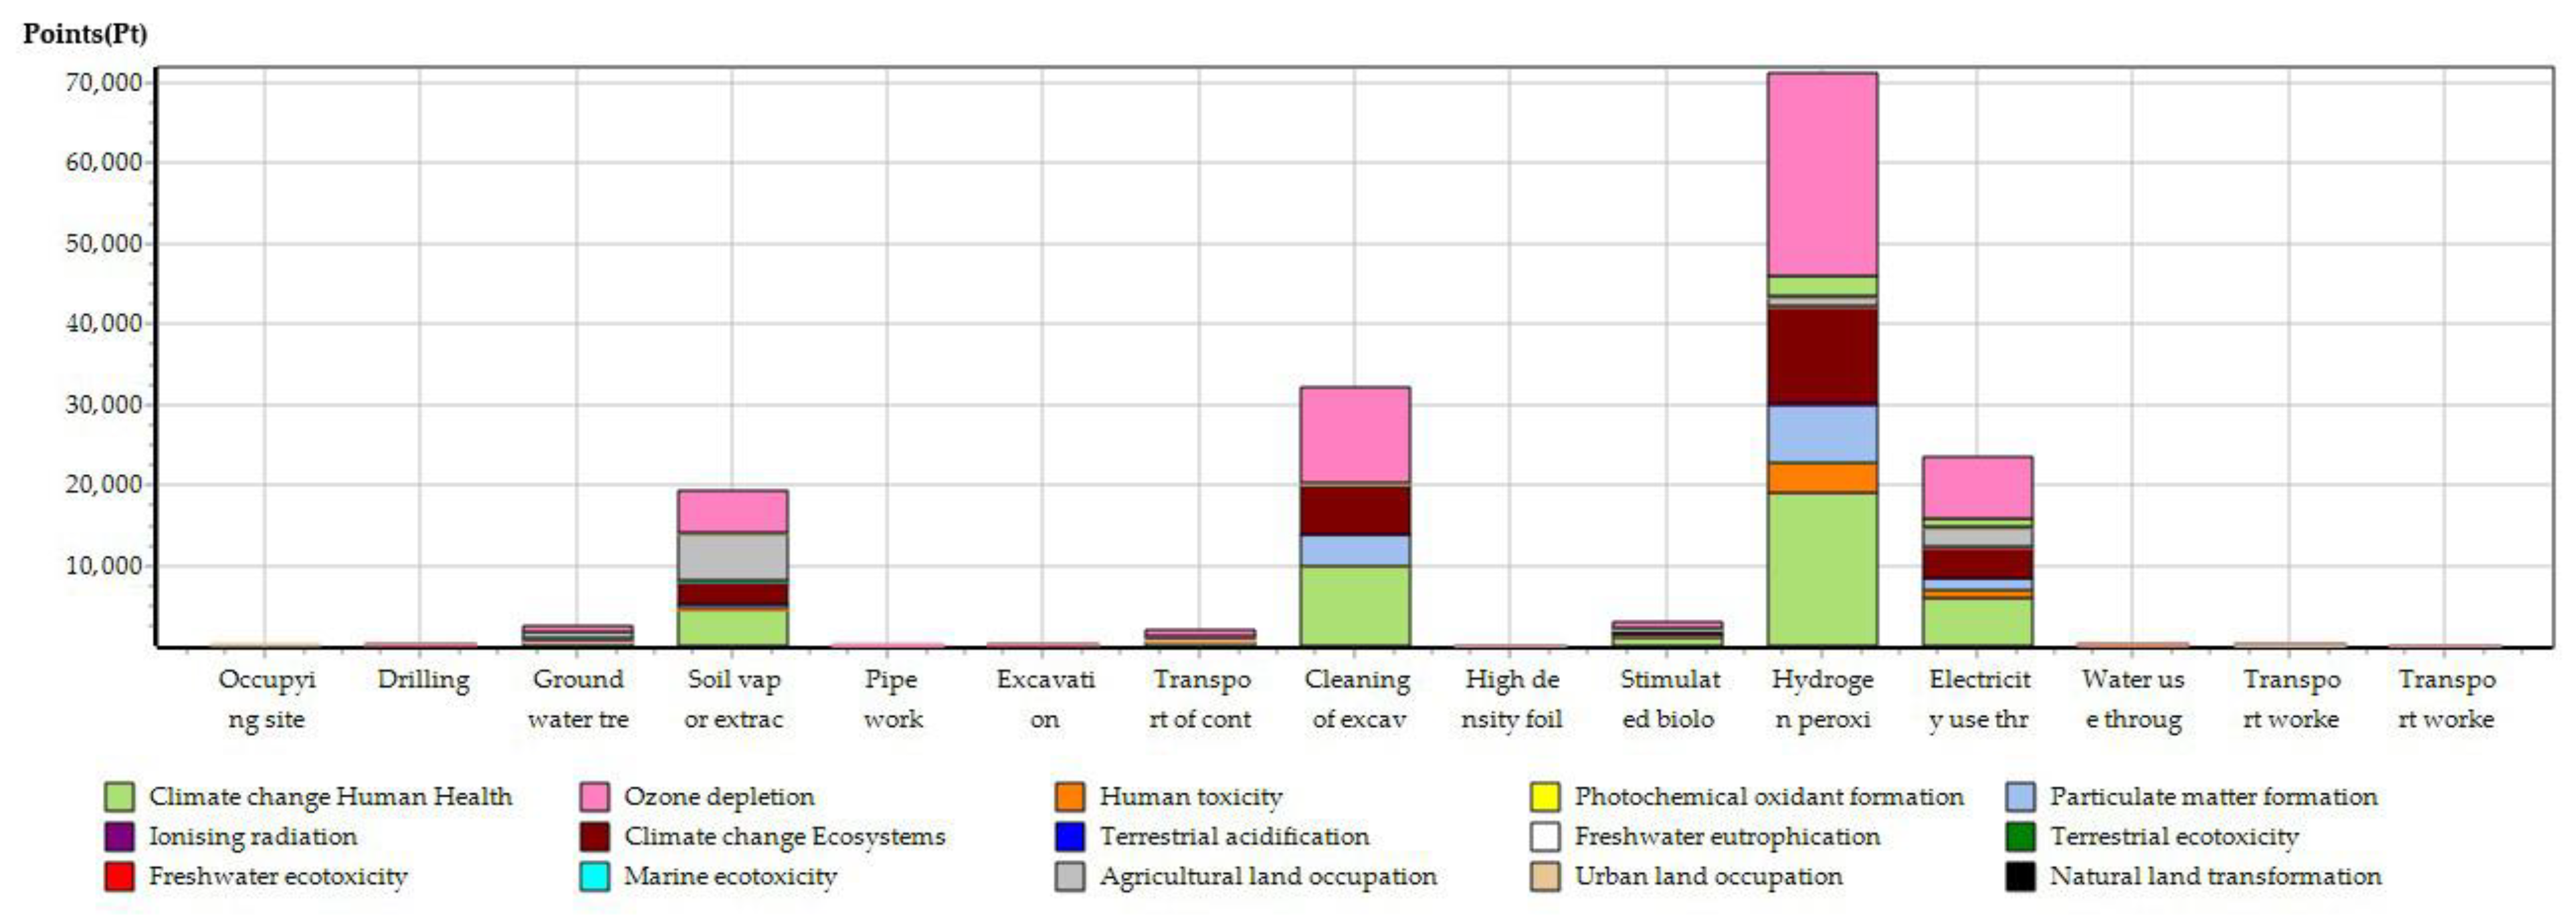
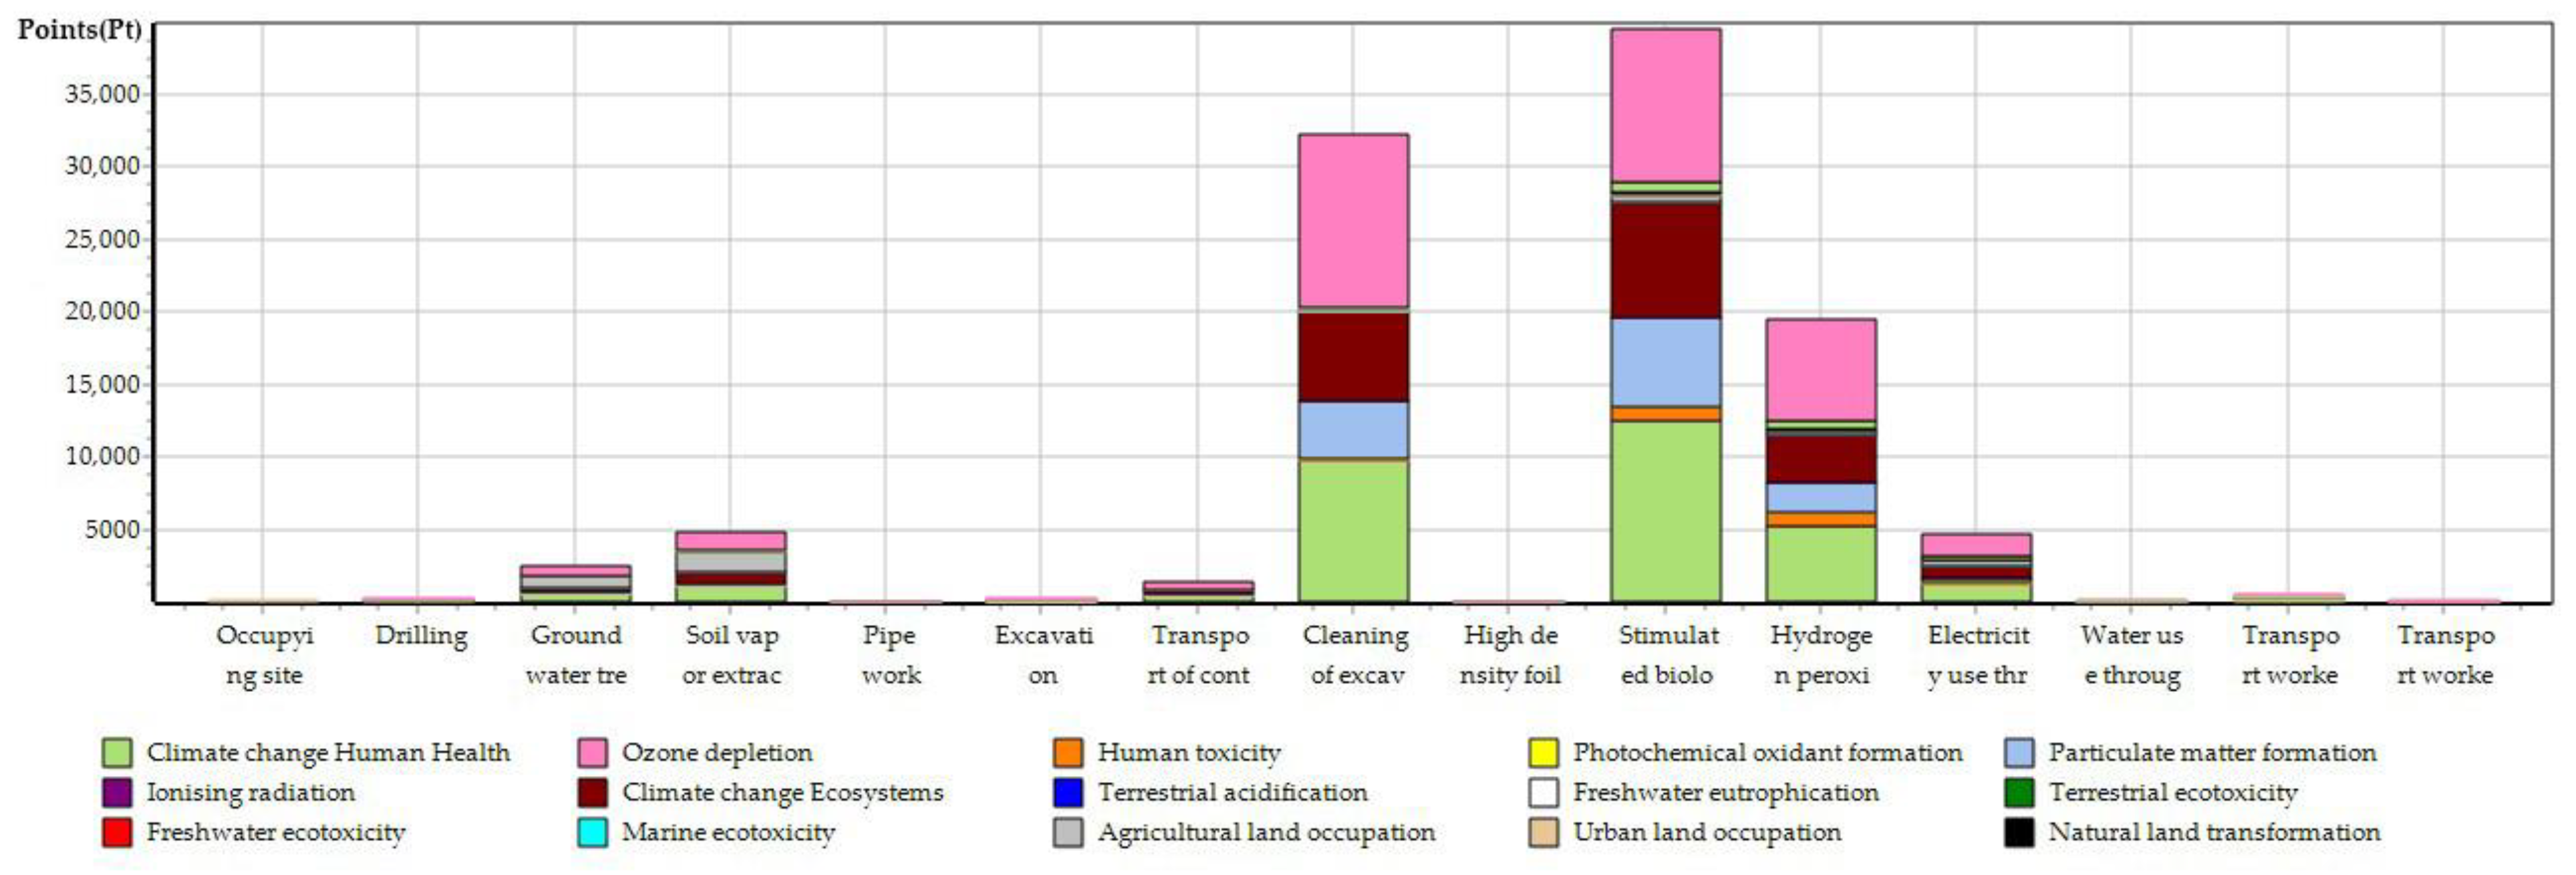
3.1.3. Environmental Impact Assessment

The results of the LCA indicate that overall environmental impact of the chemical alternative (Figure 2) is larger than the impact of the natural alternative (Figure 3), 155 versus 106 kPt respectively (with kPt = the environmental impact expressed in kilopoints). The higher the calculated value, the more the remediation alternative will harm the environment.
The hydrogen peroxide used for the in-situ chemical oxidization in the “chemical alternative” has by far the largest environmental impact of all the remediation steps (Figure 2). The midpoint impact categories indicate that the main environmental effects of the use of hydrogen peroxide for in-situ chemical oxidization in this soil remediation alternative are fossil resources depletion, the formation of particular matter and an increase of global warming emissions due to the use of fossil fuels (Figure 2). Three other remediation steps that contribute to the environmental impact of the chemical remediation alternative are the cleaning of the excavated soil, the electricity use throughout the project and the soil vapor extraction on site. Overall the chemical remediation alternative especially has an impact on climate change, fossil depletion and particular matter formation.
The results of the LCA for the natural remediation alternative indicate that the use of hydrogen peroxide still accounts for an important share of the environmental impact (Figure 3). An additional process contributing significantly to the environmental impact of the natural remediation alternative is the cleaning of the excavated soil. The use of stimulated biological degradation has the largest environmental impact within this alternative due to the injection of a considerable amount of the organic carbon source (Table 1). When we look at the midpoint categories, we see that both remediation alternatives mainly contribute to three environmental effects, namely climate change, fossil depletion and particular matter formation (Figure 2 and Figure 3).

3.2. Social Cost-Benefit Analysis

The social Cost-Benefit Analysis takes into account all the private costs as well as the environmental impact, the health impacts and other external impacts. This will provide an extensive overview of the secondary impacts of the remediation alternatives on society.

3.2.1. Private Costs

The estimation of the private costs of the two different remediation alternatives was available in the legally mandatory documentation [16]. Based on the estimated timeline of the two remediation alternatives and a chosen discount rate of 3%, the discounted private costs were calculated. A discount factor of 3% was chosen based on the social discount rates suggested by several governmental institutions when analyzing environmental projects (3%–5%) [22,23]. In the sensitivity analysis later in this paper, other discount rates were applied to test for the robustness of the results.
When comparing the discounted private costs of both remediation alternatives, there is a large difference of approximately 1 million euro in favor of the chemical remediation alternative (Table 3). This is mainly due to the large difference in costs for the stimulated biological degradation, specifically the purchase of the lactate needed in this process step. The cost of the stimulated biological degradation step is almost 100 times higher for the natural remediation alternative compared to the chemical one (Table 3).

3.2.2. Monetized Environmental Costs

Within Stepwise 2006 there are two different options available for the calculation of the environmental impact, including or excluding biogenic carbon (Table 4). Biogenic carbon is CO2 emitted during the production of energy with bio-mass. This carbon was initially absorbed by plants and trees and is introduced back into the atmosphere through the combustion of the biomass. This CO2 is considered as part of the present carbon cycle. Carbon released into the atmosphere by burning fossil fuel is carbon that has been stocked within the ground for over millions of years and thus adds to the current carbon cycle. By allowing for the inclusion of biogenic carbon in the calculations, the amount of fossil emissions from biomass energy production is compared to greenhouse gas emissions associated with the displaced energy system. This means that some of the processes can have an environmental benefit because biomass energy production has lower emissions than the displaced energy system [28,29].
In this paper we calculated the monetized environmental impact with and without the inclusion of biogenic carbon. The inclusion of the biogenic carbon leads to a small difference in the monetized impact for the “chemical alternative” (Table 4). It does however considerably reduce the environmental cost of the “natural alternative.” This is mainly due to the difference for the stimulated biological degradation (Table 4). After comparing both options, the decision was made to include the results excluding the biogenic carbon into the social CBA because these numbers are more in line with the assumptions of the LCA (i.e., in the calculations of the environmental impact of both alternatives, in the initial LCA based on the ReCiPe method, biogenic carbon was not included). The results of the Stepwise calculations including biogenic carbon were assessed in the sensitivity analysis.

3.2.3. Other External Costs

In addition to the environmental costs calculated in Table 4, other external costs are included in the social Cost-Benefit Analysis. The costs of transport displayed in Table 5 contain the cost of congestion, the cost of noise, the cost of possible traffic causalities and the cost of infrastructural damage due to additional traffic (the cost of NOx, particular matter or other air pollutants are already taken into account in the LCA). These costs are calculated based on the estimated amount of kilometer driven times the cost per kilometer [30]. The values per kilometer for congestion, noise, casualties and damage differ based on the type of vehicle used, for example a heavy truck will cause considerably more damage to the road than a passenger car [30].
The largest difference between both remediation alternatives lies in the difference in cost for the transportation of the workers needed on site. The natural remediation alternative has a higher need for monitoring throughout the remediation project [16]. Workers will thus have to travel to the site more often, resulting in more kilometers driven and a higher external cost (Table 5).

3.2.4. External Benefits

The benefits of the remediation are calculated with the use of the environmental prices developed by a Dutch research agency, CE Delft, specialized in environmental impact studies [31]. The environmental prices monetize the welfare loss of the addition of 1 kg of a contaminated substance to the environment. They include the potential impact of a specific substance on human health, ecosystems, buildings and machines, resources and well-being. Due to uncertainties in the calculations of these environmental prices, the authors provide a range for each of the substances [31]. To calculate this range of environmental prices, CE Delft had to rely on a range for a Value Of a Life Year (VOLY) and for a Quality-Adjusted Life Year. This range for a VOLY has a minimum value of 50,000 euro, a middle value of 70,000 euro and a maximum value of 110,000, while the range of a QALY is equal to that one of a VOLY, except has a lower maximum value (100,000 euro) [31]. In the initial calculations of the benefits, the upper bound of the environmental price is used to calculate the benefits of the remediation. Later on, in the sensitivity analysis, the lower bound is also used to see whether the results of the social Cost-Benefit Analysis are robust (Table 6).
In the case study, 95% of the PCE load (3300 kg) will be removed during the remediation, eliminating the adverse effects it has on society, and thus creating a benefit. The environmental price of PCE is estimated to be between 7.45 and 15.8 euro per kg [31]. The total value of this benefit can thus be calculated by multiplying the upper bound environmental price for PCE (15.8 euro) with the amount of PCE removed (3135 kg), which equals 49,530 euro (Table 5).
For the calculation of the external benefits, we mainly focused on the health impact because the current activities on site will not be changed after the remediation project is completed and no land use changes are anticipated in the future. Moreover, potential non-use values, for example for groundwater, were not included in the initial calculations because of the limited availability of data in the literature. In the literature, non-use values are estimated through stated preference methods such as the contingent valuation method. Groundwater is, for example, valued for its legacy value for future generations or for its existence value and contribution to biodiversity [13,32,33,34,35]. In the sensitivity analysis, the non-use value of the remediation of the groundwater for this case was added as a benefit based on the estimated Willingness to Pay (94.6 euro per household per year) by Stenger and Willinger [36] for France and the number of households (i.e., 35) living near the contaminated site.

3.2.5. Sensitivity Analysis

The Net Present Value (NPV) of all the above described costs and benefits, using a 3% discount rate and a timeline of 30 years (baseline scenario), shows that the social impact of the chemical remediation alternative is lower than the natural alternative (Table 6). However, both remediation alternatives are not socially desirable (highly negative NPV).
To assess the robustness of these results, a sensitivity analysis was performed in which several key parameters were varied to verify whether they would lead to large variations in the NPV (Table 6). The first parameter tested was the timeline of the benefits. Assuming a longer time period of 50 years, and even 100 years instead of 30 years, makes it possible to include the long-term benefits from removing the contamination. A second key parameter addressed in the sensitivity analysis is the actual value of the benefits. The calculation technique used for these benefits allows for the inclusion of an upper and lower bound value [31]. In the baseline scenario the benefits were calculated using the upper bound value, in the sensitivity analysis the lower bound value was introduced into the calculations. The third parameter is the discount rate, which was lowered to increase the importance of costs and benefits occurring in the future within the social Cost-Benefit Analysis. A second to last key parameter analyzed in the sensitivity analysis is the reduction of the estimated private costs. It is often the case that in a design phase the private costs of a remediation project are overestimated due to uncertainty of several elements, e.g., extent of the contamination, number of contamination sources, depth of the contamination, required exposure time. Finally, the impact of including biogenic carbon in the monetization of the environmental impact and the inclusion of a non-use value for groundwater was also evaluated in the sensitivity analysis.
The results of the sensitivity analysis are displayed in Table 6 and show that the results of the social Cost-Benefit Analysis are robust. None of the variations in key parameters result in a positive NPV for either of the remediation alternatives indicating that both alternatives are not socially profitable. The difference between the NPV of both alternatives is smallest when the private costs are reduced, indicating that this is the most determining factor in the NPV gap between both alternatives.

4. Discussion

Based on the LCA results, the natural alternative has a lower environmental impact and could be considered as the better option of both remediation alternatives. This is often also what people assume when something is labelled as more natural [37,38]. On the other hand, when the environmental impact is included in the social CBA together with the other costs and benefits related to the remediation project, we see that the chemical alternative has a less negative NPV (Table 6). Both alternatives are not socially desirable (NPV < 0) and the results are proven to be robust by the sensitivity analysis.

4.1. The Effects of Waiting and Risk Averse Behavior

Based on the NPV calculations, one might wonder whether it would be more opportune to wait for more efficient or less expensive remediation techniques to be developed. This however is not advisable for this case. As stated before, in the introduction of this paper, the chlorinated solvents found on site are very volatile, toxic and soluble in water meaning that they pose a potential risk to human health and have the tendency to spread easily [1,6,7]. In addition to this, the cost of waiting might not always outweigh the potential benefits. There are potentially adverse effects on ecosystems, human health and well-being linked to delaying the remediation. These should always be taken into account when evaluating the possibility of postponing a remediation project [39]. In the present case study, based on the properties of the contaminants, the risk analysis performed by the soil remediation experts and the sensitivity analysis in the social CBA, waiting will most certainly not increase economic benefits sufficiently to counteract the current and potential additional costs.
The NPV has a large negative value for both remediation options (Table 6) because there are low annual external benefits to counteract the societal costs. The main element of the external benefits are the health benefits obtained by removing the contaminants and with that the risk to human health. In this case study, the environmental prices developed by a Dutch research agency were used to value the external benefits [31]. This technique sets a VOLY between 50,000 and 110,000 euro and a QALY between 50,000 and 100,000, based on the extensive literature and research of the past decade [31]. The fact that these benefits do not outweigh the societal costs would let us conclude that it is not socially beneficial to carry out the remediation. This is often the conclusion when assessing remediation projects [13,40,41,42]. In spite of the remediation projects often being not socially beneficial, as a society we still continue to remediate contaminated sites. While the value of a statistical life (VSL) measures the rate at which people are prepared to trade off income for risk reduction [43], some biases are likely to occur in people’s perception and understanding of such risks. One of the most well-known cognitive biases is the tendency for individuals to overestimate small risks as well as risks associated with a significant degree of fear and uncertainty [44]. Moreover, in a social CBA individuals and policy makers are assumed to be risk neutral, while in practice they are frequently exhibiting risk averse as well as loss averse behavior. Risk aversion reflects the tendency to prefer a certain but possibly less desirable outcome over an uncertain but potentially greater outcome [45]. Loss aversion refers to the observation that for many individuals a loss is more tangible than an equally sized gain [46]. In the setting of soil remediation most of these biases are likely to be relevant, leading to a higher probability of implementing soil remediation projects, even if they are found to be undesirable in a social CBA based on the assumption of risk neutrality.

4.2. The Effect of Potential Substitutes

Based on the sensitivity analysis, the main driver behind the difference between both remediation alternatives is the difference in private costs. When the private costs are reduced, the NPV of both alternatives seem to converge. The high amount of lactate needed in the natural remediation alternative accounts for a large part of the private costs of this remediation alternative. A possibility to reduce this cost is by the introduction of an alternative organic carbon source for the stimulated biological degradation. Large price differences exist between organic carbon sources that can be used for bioremediation [47]. In our case study, we looked into the use of molasses as an alternative organic carbon source because this was also chosen to input as the alternative carbon source in the LCA. The change in carbon source did not compromise the results of the environmental impact calculated in the LCA because both carbon sources have a similar environmental effect [27]. However, the use of molasses (current market price between 0.5 and 1 euro per kg [47]) would increase the private costs of the natural remediation alternative significantly leading to an even larger cost discrepancy between the two remediation alternatives.
When evaluating the use of different organic carbon sources, the cost and the environmental impact of each of these carbon sources is driven by several factors. It needs to be taken into account that not every carbon source can be administered in the same way or at the same frequency, or has the same amount of active substances [17,47]. The same factors should be taken into account when evaluating the use of potential alternative oxidants for ISCO, to reduce the environmental impact of the chemical remediation alternative. Due to the important contribution of hydrogen peroxide to the overall environmental impact of the chemical remediation alternative, we looked into potential substitute oxidants. Persulfate is another commonly used oxidant for ISCO of chlorinated solvents [48,49,50]. To assess whether persulfate would decrease the environmental impact of the chemical alternative both oxidants were compared based on the environmental impact of 1 kg of the oxidant. One kilogram of hydrogen peroxide has an environmental impact of 115 mPt, while persulfate has an environmental impact of 160 mPt per kilogram (calculated in SimaPro). It was assumed, based on the need for several injections of the oxidant to remediate the PCE in this case study and the similar efficiency of both oxidants in eliminating the contaminants, that the same amount of persulfate and hydrogen peroxide would be needed in this case [48,49]. Based on this assumption, the substitution of hydrogen peroxide with persulfate would not decrease the environmental impact of the chemical remediation alternative.

4.3. The Impact of Biogenic Carbon

In this paper, Stepwise 2006 was chosen to monetize the environmental effect of the remediation alternatives and within this method we opted to use the calculations including biogenic carbon. Later on in the sensitivity analysis, the calculations were also performed excluding biogenic carbon. In the present case study, it made no difference in the relative ranking of the two remediation alternatives. It did however change the absolute difference in NPV between both remediation alternatives in favor of the natural remediation alternative. When biogenic carbon was included in the calculation of the monetized environmental impact, the NPV of the natural remediation alternative was 26% lower than the NPV of the chemical alternative. Without the inclusion of biogenic carbon, the NPV of the natural remediation alternative was 32% lower. This large difference in favor of the natural alternative did not impact the overall outcome of this case study but might do so in other cases. When choosing between both options (including or excluding biogenic carbon), one should be familiar with how biogenic carbon affects the calculations of the environmental impact. Stepwise 2006 bases itself on the assumptions on biogenic carbon described in IMPACT 2002+ [28,29]. In IMPACT 2002+ CO2 emissions of the incineration of biomass has an impact set to zero only when the same amount of CO2 can be recaptured through the replanting of flora [28,29]. When, for example in the case of deforestation, there is no replanting the CO2 emissions are not categorized as biogenic carbon and do have an environmental impact [28,29]. The assumptions made in the IMPACT 2002+ method do not allow for double counting. To avoid double counting when using biogenic carbon, the emitted CO2 should always be balanced out by the capturing of CO2.

5. Conclusions

The NPV calculations indicate that, for the present case study, both remediation options are not beneficial for society from a scientific point of view. The chemical remediation alternative has an NPV of approximately—2 million euro and the natural alternative an NPV of approximately—3 million euro. Possible alternatives for some of the remediation steps were considered but these potential modifications did not improve the overall NPV results of either of the remediation alternatives.
Based on the results of the sensitivity analysis it can be concluded that even if the private costs were significantly reduced or the non-use value of groundwater was added in the analysis, the annual external benefits are so low compared to the social costs of the remediation project, that these changes would not tip the scale. The remediation of complex site contaminations often still requires a combination of multiple remediation techniques and can thus become very expensive. The remediation of complex contaminations will always remain at the tipping point of social desirability.
This does not mean that society is reluctant to invest resources in the remediation of complex contaminations. The fact that our society still invests in these remediation projects might mean that risk aversion and cognitive biases in risk perception play an important role in the assessment of the expected benefits linked to soil remediation for society. In addition to this, our society also values the prosperity of future generations. If contaminations are not or not fully remediated, they are passed on to future generations. This is avoided by governments and organizations worldwide as much as possible and can indicate why more resources are invested than initially expected when only looking at social assessments.

Author Contributions

Conceptualization, L.H., S.R., and V.C.; methodology, L.H., S.R., and V.C.; software, L.H.; validation, L.H., S.R., and V.C.; formal analysis, L.H.; investigation, L.H.; resources, L.H.; data curation, L.H.; writing—original draft preparation, L.H.; writing—review and editing, L.H., S.R. and V.C.; visualization, L.H.; supervision, S.R. and V.C.; project administration, V.C.; funding acquisition, L.H. and V.C.

Funding

This research was funded with a SB PhD fellowship from FWO SB/151424.

Conflicts of Interest

The authors declare no conflict of interest.

References

  1. Mars, J.F. Chlorinated solvents in Cities. In Proceedings of the CityChlor, Ghent, Belgium, 16–17 May 2013. [Google Scholar]
  2. In Situ Remediation of Chlorinated Solvent Plumes; SERDP/ESTCP Environmental Remediation Technology; Stroo, H.F.; Ward, C.H. (Eds.) Springer: New York, NY, USA, 2010; ISBN 978-1-4419-1400-2. [Google Scholar]
  3. Van Liedekerke, M.; Prokop, G.; Rabl-Berger, S.; Kibblewhite, M.; Louwagie, G. Progress in Management of Contaminated Sites in Europe; European Union: Luxembourg, 2014. [Google Scholar]
  4. Aggazzotti, G.; Fantuzzi, G.; Predieri, G.; Righi, E.; Moscardelli, S. Indoor exposure to perchloroethylene (PCE) in individuals living with dry-cleaning workers. Sci. Total Environ. 2003, 156, 133–137. [Google Scholar] [CrossRef]
  5. Storm, J.E.; Mazor, K.A.; Shost, S.J.; Serle, J.; Aldous, K.M.; Blount, B.C. Socioeconomic disparities in indoor air, breath, and blood perchloroethylene level among adult and child residents of buildings with or without a dry cleaner. Environ. Res. 2013, 122, 88–97. [Google Scholar] [CrossRef]
  6. Matteucci, F.; Ercole, C.; Del Gallo, M. A study of chlorinated solvent contamination of the aquifers of an industrial area in central Italy: A possibility of bioremediation. Front. Microbiol. 2015, 6, 1–10. [Google Scholar] [CrossRef]
  7. Fonteyne, S. Soil remediation of (former) dry cleaners in Flanders: VLABOTEX npo. In Proceedings of the CityChlor, Ghent, Belgium, 16–17 May 2013. [Google Scholar]
  8. Luis, S.J.; King, S.L.; Zandipour, N.; Koenigsberg, S.S. Quantitative analysis of remedial approaches, costs, and time required to remediate dry cleaner sites. Remediat. J. 2011, 21, 73–83. [Google Scholar] [CrossRef]
  9. Peeters, B.; Fonteyne, S. Analyse van de Kostprijs van een VOCl-Sanering; Openbare Vlaamse Afvalstoffenmaatschappij: Mechelen, Belgium, 2011. [Google Scholar]
  10. Van Gestel, G. Code van Goede Praktijk BATNEEC-Afweging van Bodemsaneringsprojecten met CO2-Calculator; Openbare Vlaamse Afvalstoffenmaatschappij: Mechelen, Belgium, 2013. [Google Scholar]
  11. Bruneel, N.; De Naeyer, F. Standaardprocedure Bodemsaneringsproject; Openbare Vlaamse Afvalstoffenmaatschappij: Mechelen, Belgium, 2013. [Google Scholar]
  12. Harbottle, M.J.; Al-Tabbaa, A. Uncovering the True Impacts of Remediation; CL:AIRE: London, UK, 2007; Volume 2. [Google Scholar]
  13. Huysegoms, L.; Rousseau, S.; Cappuyns, V. Friends or foes? Monetized Life Cycle Assessment and Cost-Benefit Analysis of the site remediation of a former gas plant. Sci. Total Environ. 2018, 619–620, 258–271. [Google Scholar] [CrossRef]
  14. Lemming, G.; Hauschild, M.Z.; Chambon, J.; Binning, P.J.; Bulle, C.; Margni, M.; Bjerg, P.L. Environmental impacts of remediation of a trichlor oethene-contaminated site: Life cycle assessment of remediation alternatives. Environ. Sci. Technol. 2010, 44, 9163–9169. [Google Scholar] [CrossRef] [PubMed]
  15. Gefaseerd Beschrijvend Bodemonderzoek Kernzone VOCl [Phased descriptive soil investigation of VCHC core zone]; Antea: Antwerp, Belgium, 2015.
  16. Draft 1e Gefaseerd Bodemsaneringsproject [Draft 1st phased soil remediation project]; MAVA: Steenokkerzeel, Belgium, 2017.
  17. Goovaerts, L.; Lookman, R.; Vanbroekhoven, K. Best Beschikbare Technieken (BBT) bij Bodemsaneringen [Best Available Techniques for soil remediation]; Academia Press: Gent, Belgium, 2006. [Google Scholar]
  18. Goedkoop, M.; Heijungs, R.; Huijbregts, M.; De Schryver, A.; Struijs, J.; van Zelm, R. ReCiPe 2008; Ministerie van VROM: Hague, The Netherlands, 2013. [Google Scholar]
  19. Pizzol, M.; Weidema, B.; Brandão, M.; Osset, P. Monetary valuation in Life Cycle Assessment: A review. J. Clean. Prod. 2015, 86, 170–179. [Google Scholar] [CrossRef]
  20. Weidema, B.P.; Wesnae, M.; Hermansen, J.; Kristensen, I.; Halberg, N. Environmental Improvement Potentials of Meat and Dairy Products; Eder, P., Delgado, L., Eds.; JRC European Commission: Sevilla, Spain, 2008; ISBN 9789279097164. [Google Scholar]
  21. Ahlroth, S.; Finnveden, G. Ecovalue08-A new valuation set for environmental systems analysis tools. J. Clean. Prod. 2011, 19, 1994–2003. [Google Scholar] [CrossRef]
  22. European Commission. Guide to Cost-Benefit Analysis of Investment Projects: Economic Appraisal Tool for Cohesion Policy 2014–2020; European Union: Roma, Italy, 2014; ISBN 9789279347962. [Google Scholar]
  23. De Nocker, L.; Debacker, W. Annex: Monetisation of the MMG Method; Openbare Vlaamse Afvalstoffenmaatschappij: Mechelen, Belgium, 2018. [Google Scholar]
  24. Bayer, P.; Heuer, E.; Karl, U.; Finkel, M. Economical and ecological comparison of granular activated carbon (GAC) adsorber refill strategies. Water Res. 2005, 39, 1719–1728. [Google Scholar] [CrossRef]
  25. Jeswani, H.K.; Gujba, H.; Brown, N.W.; Roberts, E.P.L.; Azapagic, A. Removal of organic compounds from water: Life cycle environmental impacts and economic costs of the Arvia process compared to granulated activated carbon. J. Clean. Prod. 2015, 89, 203–213. [Google Scholar] [CrossRef]
  26. Schneidewind, U.; Haest, P.J.; Atashgahi, S.; Maphosa, F.; Hamonts, K.; Maesen, M.; Calderer, M.; Seuntjens, P.; Smidt, H.; Springael, D.; et al. Kinetics of dechlorination by Dehalococcoides mccartyi using different carbon sources. J. Contam. Hydrol. 2014, 157, 25–36. [Google Scholar] [CrossRef] [PubMed]
  27. Patel, M.; Crank, M.; Dornburg, V.; Hermann, B.; Roes, L.; Hüsing, B.; Overbeek, L.; Terragni, F.; Recchia, E. Medium and Long-Term Opportunities and Risks of the Biotechnological Production of Bulk Chemicals from Renewable Resources; Utrecht University: Utrecht, The Netherlands, 2006. [Google Scholar]
  28. Humbert, S.; De Schruyver, A.; Bengoa, X.; Margni, M.; Jolliet, O. IMPACT 2002+: User Guide; Quantis: Lausanne, Switzerland, 2012. [Google Scholar]
  29. Jolliet, O.; Margni, M.; Charles, R.; Humbert, S.; Payet, J.; Rebitzer, G.; Rosenbaum, R. IMPACT 2002+: A new life cycle impact assessment methodology. Int. J. Life Cycle Assess. 2003, 8, 324–330. [Google Scholar] [CrossRef]
  30. Delhaye, E.; De Ceuster, G.; Vanhove, F.; Maerivoet, S. Internalisering van Externe Kosten van Transport in Vlaanderen: Actualisering 2016; Transport & Mobility Leuven: Leuven, Belgium, 2017. [Google Scholar]
  31. De Bruyn, S.; Ahdour, S.; Bijleveld, M.; de Graff, L.; Schep, E.; Schroten, A.; Vergeer, R. Handboek Milieuprijzen 2017; CE Delft: Delft, The Netherlands, 2017. [Google Scholar]
  32. Vo, D.T.; Huynh, K.V. Estimating residents’ willingness to pay for groundwater protection in the Vietnamese Mekong Delta. Appl. Water Sci. 2017, 7, 421–431. [Google Scholar] [CrossRef]
  33. Rinaudo, J.-D.; Loubier, S.; Görlach, B.; Interwies, E. Economic Assessment of Groundwater Protection; Ecologic: Berlin, Germany, 2003. [Google Scholar]
  34. Johns, H.; Ozdemiroglu, E. Assessing the Value of Groundwater; Environment Agency: Bristol, UK, 2007. [Google Scholar]
  35. Committee on Valuing Ground Water; Commission on Geosciences, Environment and Resources; National Research Council; Division on Earth and Life Studies. Valuing Ground Water: Economic Concepts and Appraoches; National Academy Press: Washington, DC, USA, 1997; ISBN 0309523621. [Google Scholar]
  36. Stenger, A.; Willinger, M. Preservation value for groundwater quality in a large aquifer: A contingent-valuation study of the Alsatian aquifer. J. Environ. Manag. 1998, 53, 177–193. [Google Scholar] [CrossRef]
  37. Asioli, D.; Aschemann-Witzel, J.; Caputo, V.; Vecchio, R.; Annunziata, A.; Næs, T.; Varela, P. Making sense of the “clean label” trends: A review of consumer food choice behavior and discussion of industry implications. Food Res. Int. 2017, 99, 58–71. [Google Scholar] [CrossRef] [PubMed] [Green Version]
  38. Coppola, A.; Verneau, F. Naturalness and Consumer Choices: The Case of Microfiltered Milk. In Proceedings of the 4th International European Forum on System Dynamics and Innovation in Food Networks, Innsbruck-Igls, Austria, 8–12 February 2010; pp. 187–201. [Google Scholar]
  39. Burger, J.; Gochfeld, M.; Kosson, D.S.; Brown, K.G.; Bliss, L.S.; Bunn, A.; Clarke, J.H.; Mayer, H.J.; Salisbury, J.A. The costs of delaying remediation on human, ecological, and eco-cultural resources: Considerations for the Department of Energy: A methodological framework. Sci. Total Environ. 2019, 649, 1054–1064. [Google Scholar] [CrossRef] [PubMed]
  40. Bostedt, G.; Löfgren, S.; Innala, S.; Bishop, K. Acidification Remediation Alternatives: Exploring the Temporal Dimension with Cost Benefit Analysis. Ambio 2010, 39, 40–48. [Google Scholar] [CrossRef] [PubMed] [Green Version]
  41. Volchko, Y.; Norrman, J.; Rosén, L.; Karlfeldt Fedje, K. Cost-benefit analysis of copper recovery in remediation projects: A case study from Sweden. Sci. Total Environ. 2017, 605–606, 300–314. [Google Scholar] [CrossRef] [PubMed]
  42. Van Wezel, A.P.; Franken, R.O.G.; Drissen, E.; Versluijs, K.C.W.; Van den Berg, R. Societal Cost–Benefit Analysis for Soil Remediation in The Netherlands. Integr. Environ. Assess. Manag. 2008, 4, 61. [Google Scholar] [CrossRef]
  43. OECD. Mortality Risk Valuation in Environment, Health and Transport Policies; OECD Publishing: Paris, France, 2012; ISBN 9789264130807. [Google Scholar]
  44. Bosworth, R.; Hunter, A.; Kibria, A. The Value of a Statistical Life: Economics and Politics; STRATA: Logan, UT, USA, 2017. [Google Scholar]
  45. Pratt, J.W. Risk aversion in the small and in the large. Econometrica 1964, 32, 122–136. [Google Scholar] [CrossRef]
  46. Tversky, A.; Kahneman, D. Advances in prospect theory: Cumulative representation of uncertainty. J. Risk Uncertain. 1992, 5, 297–323. [Google Scholar] [CrossRef] [Green Version]
  47. Goovaerts, L.; Lookman, R.; Vanbroekhoven, K.; Gemoets, J.; Vrancken, K. Beste Beschikbare Technieken (BBT) bij het Uitvoeren van Bodemsaneringsprojecten en bij Grondreinigingscentra; Academia Press: Gent, Belgium, 2007; ISBN 9789038210872. [Google Scholar]
  48. Besha, A.T.; Bekele, D.N.; Naidu, R.; Chadalavada, S. Recent advances in surfactant-enhanced In-Situ Chemical Oxidation for the remediation of non-aqueous phase liquid contaminated soils and aquifers. Environ. Technol. Innov. 2018, 9, 303–322. [Google Scholar] [CrossRef]
  49. Devi, P.; Das, U.; Dalai, A.K. In-situ chemical oxidation: Principle and applications of peroxide and persulfate treatments in wastewater systems. Sci. Total Environ. 2016, 571, 643–657. [Google Scholar] [CrossRef] [PubMed]
  50. In Situ Chemical Oxidation for Groundwater Remediation; SERDP/ESTCP Environmental Remediation Technology; Siegrist, R.L.; Crimi, M.; Simpkin, T.J. (Eds.) Springer: New York, NY, USA, 2011; ISBN 978-1-4419-7825-7. [Google Scholar]
Figure 1. Sequence of remediation techniques used in the chemical and natural remediation alternative. The techniques that differ in both remediation alternatives are indicated in bold.
Sustainability 11 01975 g001
Figure 2. Environmental impact of the ‘chemical alternative’ for each of the remediation steps in impact points.
Sustainability 11 01975 g002
Figure 3. Environmental impact of the ‘natural alternative’ for each of the remediation steps in impact points.
Sustainability 11 01975 g003
Table 1. Life Cycle Inventory of the chemical and natural remediation alternatives.
Products and ProcessesInput“Chemical Alternative”“Natural Alternative”
AmountUnitAmountUnit
Site useOccupation (urban)2987m2a2987m2a
Electricity use throughout projectElectricity (low voltage)806,400kWh160,000kWh
Water use throughout projectWater 9216m32400m3
Hydrogen peroxide use throughout projectHydrogen peroxide (50%)616m3168m3
Water1144m3312m3
ExcavationHydraulic digger1533m31533m3
Transport excavated soilTransport freight lorry119,300tkm79,736tkm
Cleaning excavated soilDiesel105,000l105,000l
Electricity11,400kWh11,400kWh
Foil to cover after excavationPolyethylene granulate663kg663kg
Extrusion to plastic film663kg663kg
Pipe workHydraulic digger2765m3875m3
Pump and TreatActivated carbon2000kg2000kg
Soil vapor extractionActivated carbon16,000kg4000kg
Coil drilling throughout the projectDiesel7235kWh7996kWh
Stimulated biological degradationWater228m33000m3
Organic carbon source (molasses)456m36000m3
Transport of workers during projectTransport passenger car10,890km17,010km
Transport bus5130perskm6660perskm
Table 2. Inputs used to model the production process of activated carbon in SimaPro [24,25].
InputsAmountUnit
Charcoal2kg
Hydrochloric acid0.04kg
Steam3kg
Electricity0.021kWh
Heat196MJ
Table 3. Estimated discounted (3% discount rate) private costs in EUR (2017) of the “chemical” and “natural” remediation alternatives [16].
Activity“Chemical Alternative”“Natural Alternative”
Preparatory works248,050217,800
Electricity use throughout project217,78043,210
Water use throughout project51,85013,500
Hydrogen peroxide use throughout project104,93028,620
Excavation244,030244,030
Pipe work98,54063,240
Pump and Treat45,98045,980
Soil vapor extraction165,480113,210
In-situ chemical oxidization558,200155,900
Stimulated biological degradation16,7701,652,300
Environmental guidance199,150301,700
Unforeseen expenses185,870281,590
Total2,136,6303,161,080
Table 4. Monetized environmental costs in EUR (2003) of the chemical and natural remediation alternatives.
ActivityStepwise Including Biogenic CarbonStepwise Excluding Biogenic Carbon
“Chemical Alternative”“Natural Alternative”“Chemical Alternative”“Natural Alternative”
Site use371371371371
Electricity use throughout project32,385642632,5526459
Water use throughout project670175672175
Hydrogen peroxide use throughout project203,87555,602203,00755,366
Excavation484484488488
Transport excavated soil4090273440932736
Cleaning excavated soil66,83366,83366,86266,862
Foil to cover after excavation0.380.380.390.38
Pipe work4252442524
Pump and Treat2520252030943094
Soil vapor extraction20,156503924,7546188
Coil drilling throughout the project695768695768
Stimulated biological degradation−3764−49,530642184,489
Transport of workers during project73311117341113
Total329,47492,556344,168228,133
Table 5. Costs and benefits of external impacts in EUR (2015) of the chemical and natural remediation alternatives.
External Costs“Chemical Alternative”“Natural Alternative”
Transport excavated soil22101500
Transport of workers57408250
Noise of excavation and coil drilling154,090155,020
External Benefits“Chemical Alternative”“Natural Alternative”
Upper bound benefits per year49,53049,530
Lower bound benefits per year23,36023,360
Table 6. Net Present Value in EUR (2017) of the chemical and natural remediation alternatives.
Chemical RemediationNatural Remediation
NPV of Baseline scenario−1,889,390−2,765,110
NPV including timeline benefits to 50 years−1,627,490−2,503,210
NPV including timeline benefits to 100 years−1,376,720−2,252,440
NPV including lower bound benefit valuation−2,331,980−3,207,700
NPV including discount rate of 2%−1,744,320−2,656,370
NPV including discount rate of 4%−2,001,500−2,842,180
NPV including reduction of private costs with 20%−1,517,650−2,201,930
NPV including reduction of private costs with 30%−1,331,780−1,920,350
NPV including reduction of private costs with 40%−1,145,910−1,638,760
NPV including environmental impact including biogenic carbon−1,872,140−2,610,941
NPV including non-use benefit of groundwater−1,833,410−2,709,120

