1. Introduction
“Promote sustained, inclusive, and sustainable economic growth, full and productive employment, and decent work for all” is one of the main goals of the 2030 Agenda for Sustainable Development (Goal 8) adopted by the member states of the United Nations [
1]. According to the Europe 2020 Strategy [
2], the European Union (EU) aims “to become a smart, sustainable, and inclusive economy delivering high levels of employment, productivity, and social cohesion”. Thus, the central role of productive employment in inclusive and sustainable development is recognized both worldwide and at the EU level.
Sustainable development is a complex and multidimensional concept [
1,
3,
4], which implies at least three dimensions of development: economic, social, and ecological [
5,
6]. Empirical research [
4,
5] shows that there are trade-offs in favor of the economy at the cost of social wellbeing and ecological viability, which can affect the achievement of sustainable development. Inclusive development can be defined as development that “includes marginalized people, sectors, and countries in social, political, and economic processes for increased human wellbeing, social and environmental sustainability, and empowerment” [
7] (p. 546). Thus, we consider that national and international strategies should pay attention to both sustainable development and inclusive development in order to ensure a high living standard and quality of life for all people.
Sustained and sustainable gross domestic product (GDP) per capita growth, growth in productive employment, sustained reduction in income poverty and inequality, sustainable improvement in human development indicators, and basic social protection for all are the essential elements of inclusive growth and development [
8,
9,
10,
11,
12]. Productive employment is seen as a critical nexus between growth and poverty reduction [
13]. In the World Bank report [
14], it is underlined that jobs are the cornerstone of economic and social development. Although productive employment and inclusive growth are actually widespread in development policies, productive employment “is still more widespread as an aspiration than as a reality in large parts of the global South” [
15] (p. 2).
Europe’s past experience demonstrates that the quality of available jobs is a matter for concern [
16], not only in terms of pay and job security [
17]. Because of a relative expansion of low-quality jobs, employment growth was not accompanied by a significant reduction in poverty [
18]. A critical barrier impeding poverty reducing through sustainable employment [
19] is working poverty (or in-work poverty), as a form of deficit in productive employment [
20]. According to statistical data [
21], in the recent economic crisis and recovery period (2007–2016), working poverty increased in most of the EU member states, and the incidence of in-work poverty varies significantly across these countries. Behind these differences, there are specific determinants that require specific measures [
22]. The existence of working poverty (the latest Eurostat figures point out that 9.6% of EU workers are affected by risk of poverty [
21]) proves that getting people into work is not always enough to avoid poverty risk. Therefore, actions to translate unproductive employment into productive employment are needed. Also, EU statistics [
21] show large differences between countries in meeting the targets of the Europe 2020 Strategy [
2] in terms of employment, research and development, climate change and energy, education, poverty, and social exclusion; while some EU member states moved toward the targets, others moved away from them. Taking into account that the new member states of the European Union, especially central and eastern European (CEE) countries, was lagging behind the old member states (EU-15) in their inclusive and sustainable development and competitiveness [
21,
23,
24,
25], we consider that more attention needs to be paid to improve productive employment as a key precondition for achieving economic, social, and territorial cohesion at the EU level in order to reduce disparities between individual member states and to ensure a high level of inclusive and sustainable development in all countries of the EU.
In the light of these considerations, the aim of this article was to highlight the main characteristics and mechanisms of productive employment in relation to inclusive and sustainable development, in the EU countries for the 2007–2016 period, in order to identify some possible measures that need to be taken to improve productive employment and its effect on inclusive and sustainable development. The research objectives focused on (i) analyzing the link between labor productivity and the national level of inclusive and sustainable development; (ii) exploring the sectoral structure of employment and its implications on labor productivity; (iii) investigating working poverty (deficit in productive employment) and the inclusive development nexus; (iv) identifying the common features and differences between EU member states relative to interrelationships between productive employment, and inclusive and sustainable development.
The novelty of this research consists in the multivariate analysis of the interrelationship among productive employment, and inclusive and sustainable development in the EU countries, in the recent economic crisis and recovery period (2007–2016), based on correlation and regression analysis, principal component analysis (PCA), and cluster analysis (CA). Since productive employment is a major challenge for the EU economies (and others), understanding its main characteristics and mechanisms can be a contribution to the development of the literature and an important step in designing more effective policies so that productive employment becomes a driving force for the achievement of inclusive and sustainable development.
2. Theoretical Background and Research Hypotheses
In the literature on employment, productive employment is presented as a driving force for inclusive and sustainable development [
8,
11,
20,
26,
27]. According to the International Labor Office (ILO) definition [
20] (p. 3)
, productive employment is that employment which yields “sufficient returns to labor to permit workers and their dependents a level of consumption above the poverty line”, and includes three dimensions: remuneration, stability of employment, and working conditions [
9]. Moreover, it is the crucial element that links economic growth to development and poverty reduction, and which, combined with social protection, provides the main means of reducing poverty [
20].
Empirical evidence shows that a real challenge for national economies is their reduced capacity in terms of generating employment growth while in a process of economic growth [
8,
28,
29], emphasizing the lack of inclusive economic growth and development [
30]. This fact can generate a high level of inequality and poverty, and insufficient productive opportunities for employment [
31]. Taking into account that economic growth by itself may not be inclusive and sustainable [
32], the nature and pattern of economic growth matters for employment creation and poverty reduction.
The World Bank report [
14] highlights that the jobs that contribute the most to development are those that enhance the functioning of cities, create a link between the economy and the global markets, promote cooperation and civic engagement, and are environmentally friendly and help diminish poverty. In the same report [
14], it is stated that “good jobs for development” are those jobs that significantly contribute to the development of a society. Access to productive employment provides the poor with better income, as well as stimulating learning and skills acquisition, which is essential for the inclusion of the poor in society [
9].
In order to measure productive employment, as a key driver of development, three main indicators are used [
20,
33]: labor productivity, the proportion of vulnerable workers (the proportion of own-account and contributing family workers in total employment), and the share of working poor (working poverty rate).
Economic growth and development, competitiveness, and living standards within an economy depend on labor productivity [
8,
11,
15,
34], and workers are more productive if they work with better equipment and are more efficient if they benefit from education and training [
35].
The level of an economy’s productivity is considered the heart of competitiveness [
36] and “the prime determinant of a nation’s long run standard of living” [
34] (p.76). Moreover, The Europe 2020 Competitiveness Report [
36] highlights a high level of interaction between competitiveness and sustainable and inclusive development, taking into account that competitive economies “are those that are able to provide high and rising living standards, allowing all members of a society to contribute to and benefit from these levels of prosperity” [
36] (p. 5), as well as those economies that meet “the needs of the present generation while not compromising the ability of future generations to meet their needs” [
36] (p. 5).
An improvement in labor productivity and quality of jobs is often interlinked with structural transformation [
16,
37,
38]. As Porter [
34] showed, differences in national economic structures alongside the differences in national values, culture, and institutions have an important contribution to competitive success of nations. Moreover, Porter identified the differences in the patterns of competitiveness in every country [
34]. A major element of structural transformation is the gradual reallocation of workers and other resources from traditional activities, with low productivity (agriculture and low value-added manufacturing), to modern activities, characterized by higher productivity (high value-added manufacturing and services) [
39]. According to the World Economic Forum, which adapts Porter’s theory of development stages [
34], as a country becomes more competitive and moves along the development path, from the factor-driven stage into the efficiency-driven stage and then into the innovation-driven stage, productivity will increase and wages will increase as well [
40]. Moreover, Erkut [
41] states that the transformation of a national economy from one stage of competitiveness and development to the other “can be interpreted within the context of a self-organized economic evolution” [
41] (p. 86).
The fact that structural transformation is not a mechanical process is acknowledged and it is often significantly different from the approach adopted by the developed countries over the last century [
16]. In most developing countries, there was a premature deindustrialization process, expressed by reducing shares of both employment and output in the manufacturing sector, but at a low level of economic development, which had important consequences for the pace of development and the type of employment generated [
16,
37]. Lehmann-Waffenschmidt [
42], based on the contingency approach and the structural similarity approach, emphasized that laying the foundations of successful industrialization and growth processes takes a long time and this cannot be replaced by a short-term political intervention, but he also adds another important factor, i.e., a sufficiently high rate of technical progress and innovation.
The impact of improvements in labor productivity on inclusive development is strongly linked to the sector that generates economic growth [
43]. The countries that manage to increase productivity and pull out of poverty are those that were able to diversify away from agriculture and other traditional sectors [
16,
28,
38]. A strong negative correlation between economic development (GDP per capita) and shares of agriculture in GDP [
9] and in employment [
44] were found, which can be explained by the significant contribution of agriculture to employment, in countries with low economic development. A real challenge facing employment in agriculture is its low quality due to the low productivity in traditional activities [
9,
44]. There is a strong association between productive structural transformation and job quality, expressed by a high share of wage and salaried workers or, equivalently, a low share of vulnerable employment in total employment [
33]. Thus, as labor moves from the agricultural sector (characterized by a high degree of vulnerable employment and low productivity) to the manufacturing and/or services sector, the share of wage workers (better-quality jobs) tends to increase and the share of vulnerable workers (own-account workers and contributing family workers) tends to decrease [
33]. Also, evidence points to a strong negative relationship between the incidence of vulnerable employment and the level of development [
16]. Vulnerable workers were more affected by relative poverty than wage and salaried workers, who benefit from greater employment security [
8,
33,
45]. The vast majority of the working poor work in agriculture and rural areas [
8,
44]. Moreover, structural transformation drives profound changes in the labor market, especially shifting from the standard employment relationship (permanent jobs, full-time, employee status, etc.) to the non-standard employment relationship (temporary work, part-time, self-employment, etc.), which may increase vulnerability of work [
22,
46,
47], leading to an increase in working poor.
As regards the main causes and mechanisms of working poverty, as a form of deficit in productive employment, the literature is very broad [
8,
18,
22,
45,
48,
49], encompassing low pay (which is usually associated with low levels of productivity), temporary and part-time work, personal characteristics and professional status of employed persons, household structure of the person working, and different dysfunctions of the labor market and welfare states regimes.
Empirical results [
8,
22,
30,
33] showed a positive two-way relationship between job quality and per capita income. Moreover, it is underlined that sustainable development cannot be achieved unless it goes hand in hand with decent and productive work [
33]. Moreover, the potential of structural transformation to create more and better jobs is essential in generating sustained economic development and improving living standards [
16]. Therefore, the movement of workers from agriculture to services reflects the growth of productive jobs, especially when workers relocate into high-productivity services sectors, such as knowledge-intensive services (KIS) [
16,
50]. Some authors [
8,
50] found, at the EU-27 level, a strong positive relation, in both directions, between the employment in KIS, on the one hand, and economic development (GDP per capita) and labor productivity, on the other hand. According to McMillan et al. [
51], sustained economic development requires employment to be directed toward modern sectors and to be backed by actions that would foster the productivity of each economic activity, such as making investments in technology upgrading, skill development, and last but not least institutional capabilities. Lavopa and Szirmai [
52], analyzing the link between trajectories of structural modernization and the ability of countries to escape poverty, pointed out that expanding the size of the modern sector is not sufficient to ensure a steady growth, as a process of technology absorption is needed in order to reduce the technology gap. Economic development and labor productivity are highly related to the knowledge capital and innovation of the countries [
53,
54,
55,
56], since education, especially tertiary education, is seen as a driver of productivity and economic development in both developing and developed countries [
57].
In light of these considerations, the fundamental research question of this study is as follows: which are the characteristics of productive employment in the EU member states and to what extent can productive employment be a driving force for the achievement of inclusive and sustainable development?
Based on the theoretical background and evidence from the literature, we formulated the following research hypotheses (H):
H1: Labor productivity is higher in EU countries with high inclusive and sustainable development.
H2: There is a strong association between high labor productivity and an efficient sectoral structure of employment in the EU countries, during the 2007–2016 period.
H3: Working poverty (deficit in productive employment) influences the level of inclusive development negatively.
H4: A higher level vulnerable and precarious employment determines a high risk of working poverty in the EU countries, during the 2007–2016 period.
H5: There are common features and differences between EU member states based on their interrelationships between productive employment, and inclusive and sustainable development.
3. Materials and Methods
In order to analyze the inclusive and sustainable development of the EU countries, we used gross domestic product (GDP) per capita (in purchasing power standards (PPS) as a percentage of EU-28 average GDP =100%), Human Development Index (HDI), Europe 2020 Competitiveness Index, and Inclusive Development Index (IDI). In our paper, we focus on the economic and human dimension of sustainable development. According to the Human Development Report [
58], HDI integrates three basic dimensions of human development: the ability to lead a long and healthy life, the ability to acquire knowledge, and the ability to achieve a decent standard of living. As the World Economic Forum report [
59] highlights, IDI is a composite index which comprises three pillars: growth and development, inclusion, and equity and sustainability. Four main indicators were chosen within each of the three pillars. Thus, the growth and development pillar consisted of GDP per capita, labor productivity, employment, and healthy life expectancy. The inclusion pillar included median household income, poverty rate, income Gini, and wealth Gini. The intergenerational equity and sustainability pillar incorporated adjusted net saving, public indebtedness as a share of GDP, dependency ratio, and carbon intensity of GDP [
59]. The Europe 2020 Competitiveness Index “is grouped into three sub-indexes that monitor Europe’s progress toward becoming an increasingly smart, inclusive, and sustainable economy” [
59] (p.8), including seven pillars that reflect the spirit of the seven flagship initiatives: enterprise environment, digital agenda, innovative Europe, education and training, labourlabor market and employment, social inclusion, and environmental sustainability. IDI scores and Europe 2020 Competitiveness Index scores are based on a 1–7 scale, where 1 = worst and 7 = best.
Productive employment was analyzed based on five indicators related to employment issues: employment rate, labor productivity (GDP per employed person, as a percentage of EU-28 average = 100%), employment in services, employment in knowledge-intensive activities (KIA), and compensation of employees (percentage of GDP). A high level of these interrelated indicators reflects a high level of productive employment [
16,
33]. According to the Eurostat definition, “an activity is classified as knowledge-intensive if tertiary-educated persons employed (according to ISCED97, levels 5–6) represent more than 33% of the total employment in that activity” [
21].
Employment in agriculture, vulnerable employment (own-account workers and unpaid family workers as a percentage of total employment), precarious employment (involuntary part-time employment), in-work at-risk-of-poverty rate, and at-risk-of-poverty rate were used for analyzing the deficit in productive employment and poverty (
Table 1).
Our sample consisted of 25 countries from the EU, without Malta, Cyprus (the countries for which more statistical data are unavailable), and Luxembourg (an outlier in many variables). Statistical data on the analyzed variables were collected from the Eurostat Database [
21], United Nations Development Program (UNDP) Report [
58], and World Economic Forum (WEF) reports [
36,
60] for the 2007–2016 period.
In order to test the research hypotheses, we used descriptive statistics, correlation and regression analysis, principal component analysis (PCA), and cluster analysis (CA).
We applied the Pearson correlation coefficient (
r) to study the intensity of the relationship between variables. The value of the correlation coefficient was situated in the interval (−1, +1). A value of +1 indicates a perfect positive linear relationship between variables. Conversely, a value of −1 indicates a perfect negative linear relationship between variables. Independence between the variables implies that the value of
r is equal to zero [
61].
We employed a simple linear regression analysis (Y = α + β × X + ε, where Y is the dependent variable, X is the explanatory variable, α and β are regression coefficients, and ε is the residual or error) and multiple linear regression analysis (Y = α + β
1 × X
1 + β
2 × X
2 + ε) to identify a functional relationship between the analyzed variables. The regression coefficients were estimated using the least-squares method [
62]. To assess the validity of the regression model, the Fisher Snedecor (
F) statistic was used. Based on the
R2 (the coefficient of determination) value, the quality of prediction was assessed. The value of
R2 indicates the proportion of the variance in the dependent variable that the independent variables explain. The variance inflation factors (VIF) and the tolerance of the independent variables were tested in order to check if the results were affected by multicollinearity. As Hair et al. [
63] stated, a high multicollinearity could be met when the VIF has a value which is higher than 10 and the tolerance records a value which is less than 0.1.
In order to classify the EU countries and obtain a comparative view of their interrelation between productive employment, and inclusive and sustainable development, principal component analysis (PCA) and cluster analysis (CA) were used.
In the first step, PCA with Varimax rotation and Kaiser normalization was used to reduce the dimensionality of a dataset consisting of a large number of interrelated variables (14 variables) to a few factors or principal components [
64]. The advantage of this multivariate technique consists of the reduction of the complexity of the data, producing a small number of derived variables that can be used instead of the larger number of original variables in order to simplify the subsequent analysis of the data [
62]. In order to choose the number of principal components, we used multiple criteria such as the Kaiser criterion or eigenvalue-greater-than-one rule, as well as Catell’s scree plot criterion and percentage of cumulative variance, based on which only the components which capture a large percentage of the total variation of the original variables (between 70 and 90%) are retained [
62,
64]. The choice of using PCA in this research took into consideration the fact that, in recent years, PCA was widely applied to the study of the social and economic differences and similarities between various nations [
22,
65,
66,
67]. Furthermore, PCA is recognized as a multivariate statistical method which contributes to solving the inconveniences generated by different measuring of original variables, data seasonality, and high variations of the covariance coefficients [
65,
68].
In the second step, the principal components that resulted from the PCA were used for the cluster analysis and this helped us identify the homogenous groups of countries. Therefore, at first, we used a hierarchical cluster analysis, using Ward’s method and the Euclidian distance in order to determine the number of clusters. This method was followed by a k-means cluster analysis. Then, to identify the relatively homogeneous groups of cases based on the selected characteristics, k-means cluster analysis was used [
22,
69]. We used the SPSS statistical package for all statistical analyses.
4. Results and Discussion
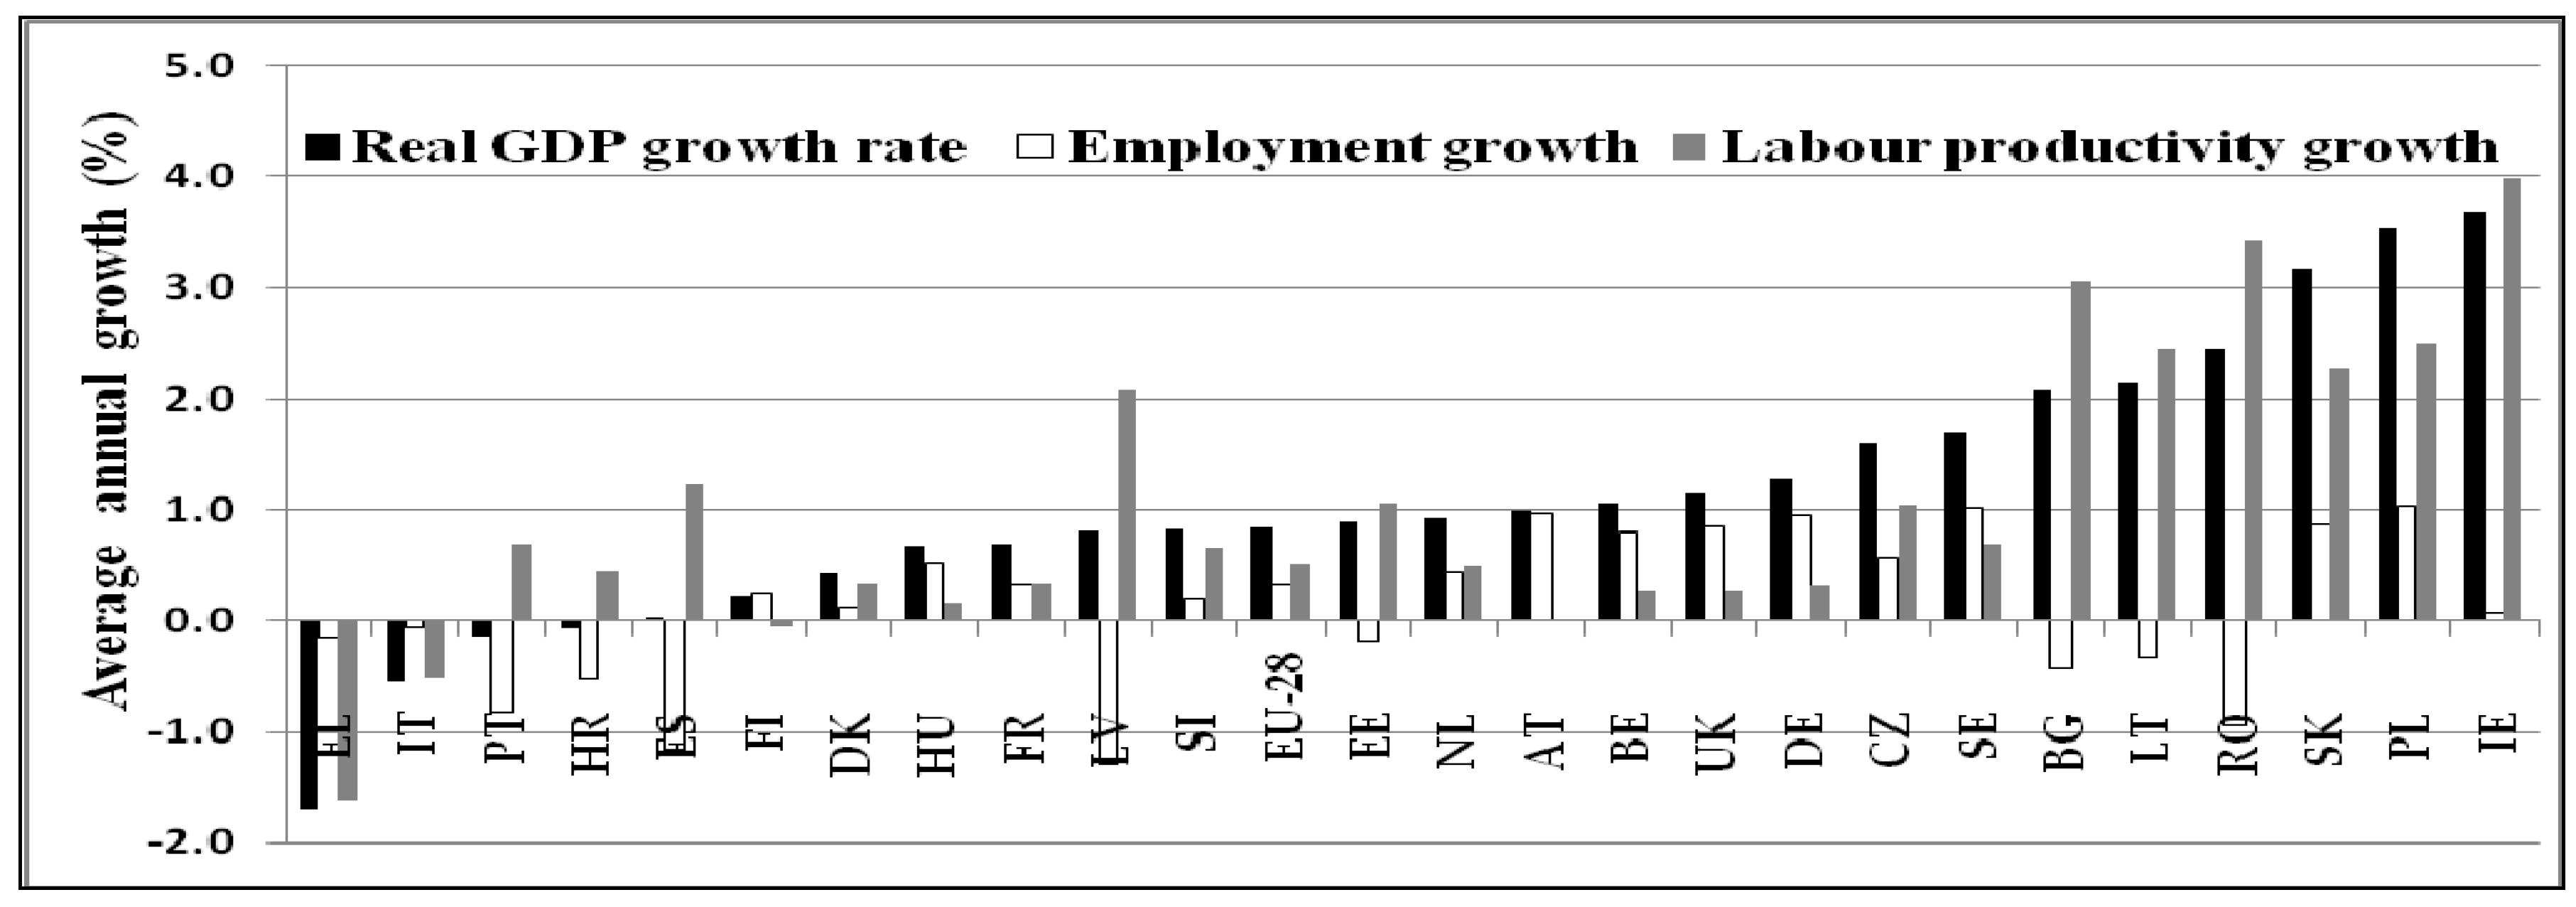
In order to achieve an inclusive and sustainable development, it is necessary for economic growth to be accompanied by employment growth, on the one hand, and for the benefits of economic growth to be more equitably distributed, on the other hand. Based on the data provided by
Figure 1 in the EU, during the 2007-2016 period, the process of economic growth (expressed by real GDP growth rate) varied substantially across countries, and this process was not accompanied by employment growth (in all 25 EU countries analyzed). Thus, in six of the 25 countries, despite an economic growth process, employment decreased, but labor productivity increased (Romania, Bulgaria, Spain, Estonia, Lithuania, and Latvia). It is confirmed that economic growth is a necessary but not sufficient condition for achieving substantial progress in living standards [
10,
59].
Also, the “jobless growth” process is noticeable in 15 of the 25 countries, emphasizing the small capacity of economic growth to generate employment growth (annual average economic growth is higher than annual average employment growth). Four of the 25 countries recorded a decrease in both average employment growth and average economic growth (Portugal, Italy, Greece, and Croatia). It is worthwhile mentioning that the relationship between employment growth and economic growth is more complex, as large numbers of jobs are being created and destroyed simultaneously in the context of structural change and spatial labor reallocation [
8,
14].
In the same period, all countries (except Greece and Italy) recorded labor productivity growth which varied significantly across these countries (
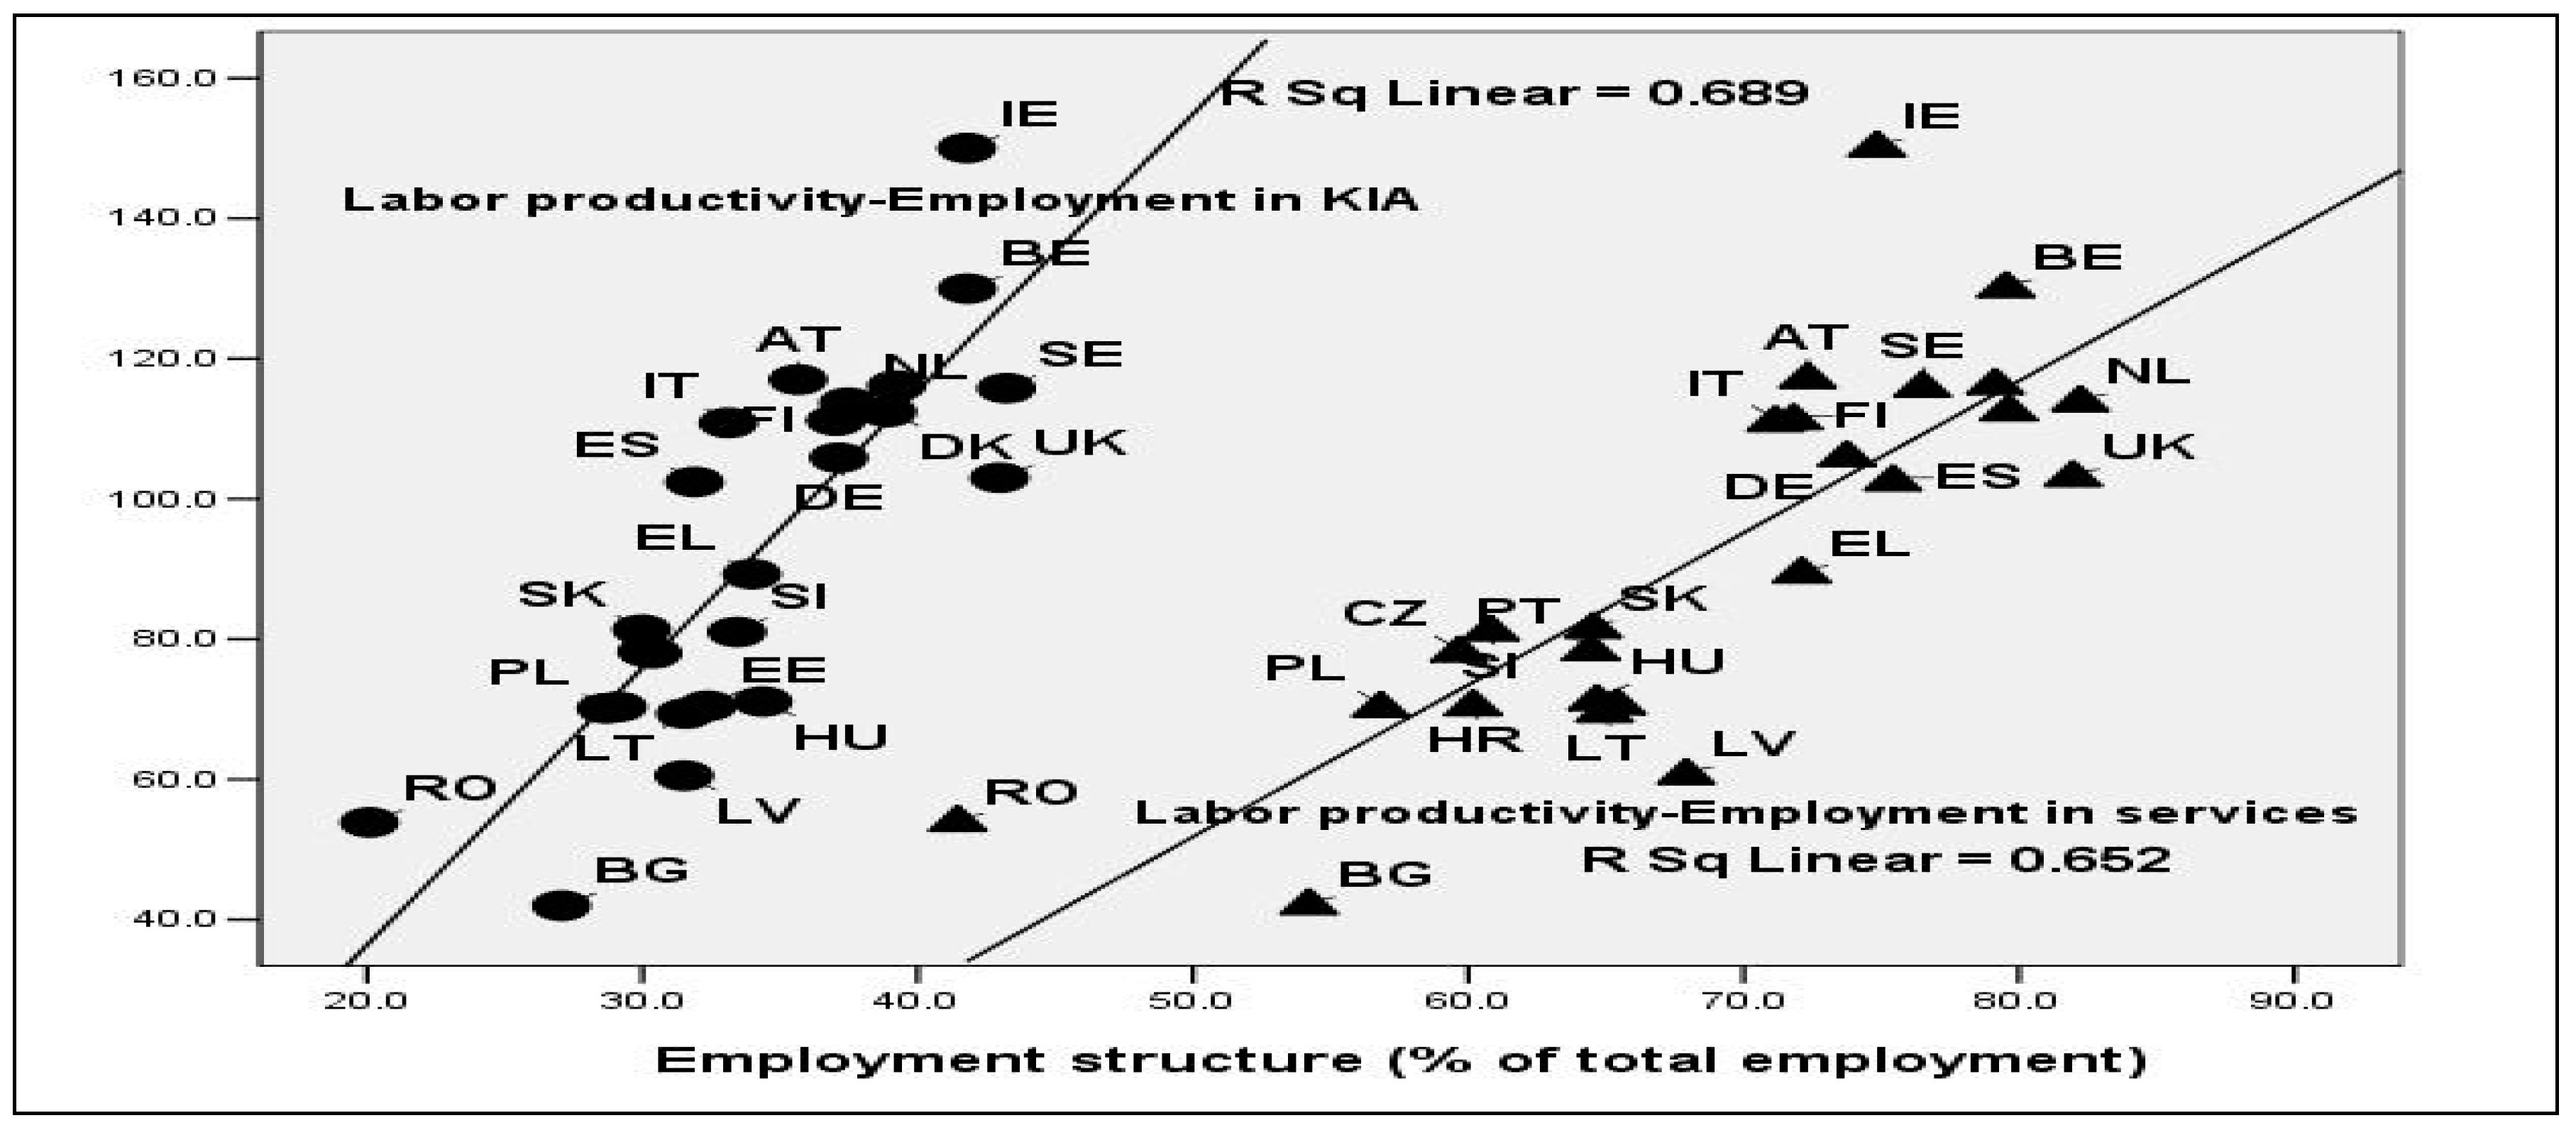
Figure 1). Moreover, statistical data point out the significant differences in terms of the level of labor productivity (
Figure 2), which ranged from 42% to 150% (EU-28 = 100%). However, significant gaps can still be noted between the new member states and the old member states.
The results of the correlation analysis (
Table 2) show that, in the EU member states, during the 2007–2016 period, labor productivity was positively correlated with Europe 2020 Competitiveness Index (
r = 0.693), GDP/capita (
r = 0.952), HDI (
r = 0.872), and IDI (
r = 0.577). Thus, in the EU countries where labor productivity is higher (especially the developed economies of EU), the level of competitiveness, level of economic and human development, and level of inclusive development are also higher and vice versa, which confirms Hypothesis H1.
As
Table 2 and
Figure 2 show, it appears that, in the EU, higher levels of labor productivity are linked to an efficient sectoral structure of employment, expressed by a higher share of employment in services (
r = 0.807) and KIA (
r = 0.832) in total employment, and by a lower employment in agriculture (
r = −0.679).
The results of the simple linear regression analysis (
Figure 2 and
Table 3) show that, in the EU countries, the level of labor productivity is positively influenced by the level of employment in services. The simple linear regression model (labor productivity = −56.492 + 0.808 × employment in services) was statistically significant (
F (1, 23) = 43.174;
p = 0.000) and accounted for 65.2% of the variance of labor productivity (
R2 = 0.652).
Moreover, we analyzed the impact of the level of employment in KIA on labor productivity (
Figure 2 and
Table 4). The estimated simple linear regression model for the impact of the level of employment in KIA on labor productivity in the EU countries, during the 2007–2016 period (labor productivity = 42.640 + 0.830 × employment in KIA), highlights that employment in KIA positively influenced labor productivity (β = 0.830). This model was statistically significant (
F (1, 23) = 50.93;
p = 0.000
p = 0.000) and accounted for 67.5% of the variance of labor productivity (
R2 = 0.675).
These results show that, in the EU countries where employment in services and employment in KIA are higher, the level of labor productivity is high too, which confirms Hypothesis H2. This fact reflects the need to make the sectorial structure of employment more efficient in some EU countries, especially in new EU member states, so that they become developed economies in the context of sustainable development.
As it can be noted in
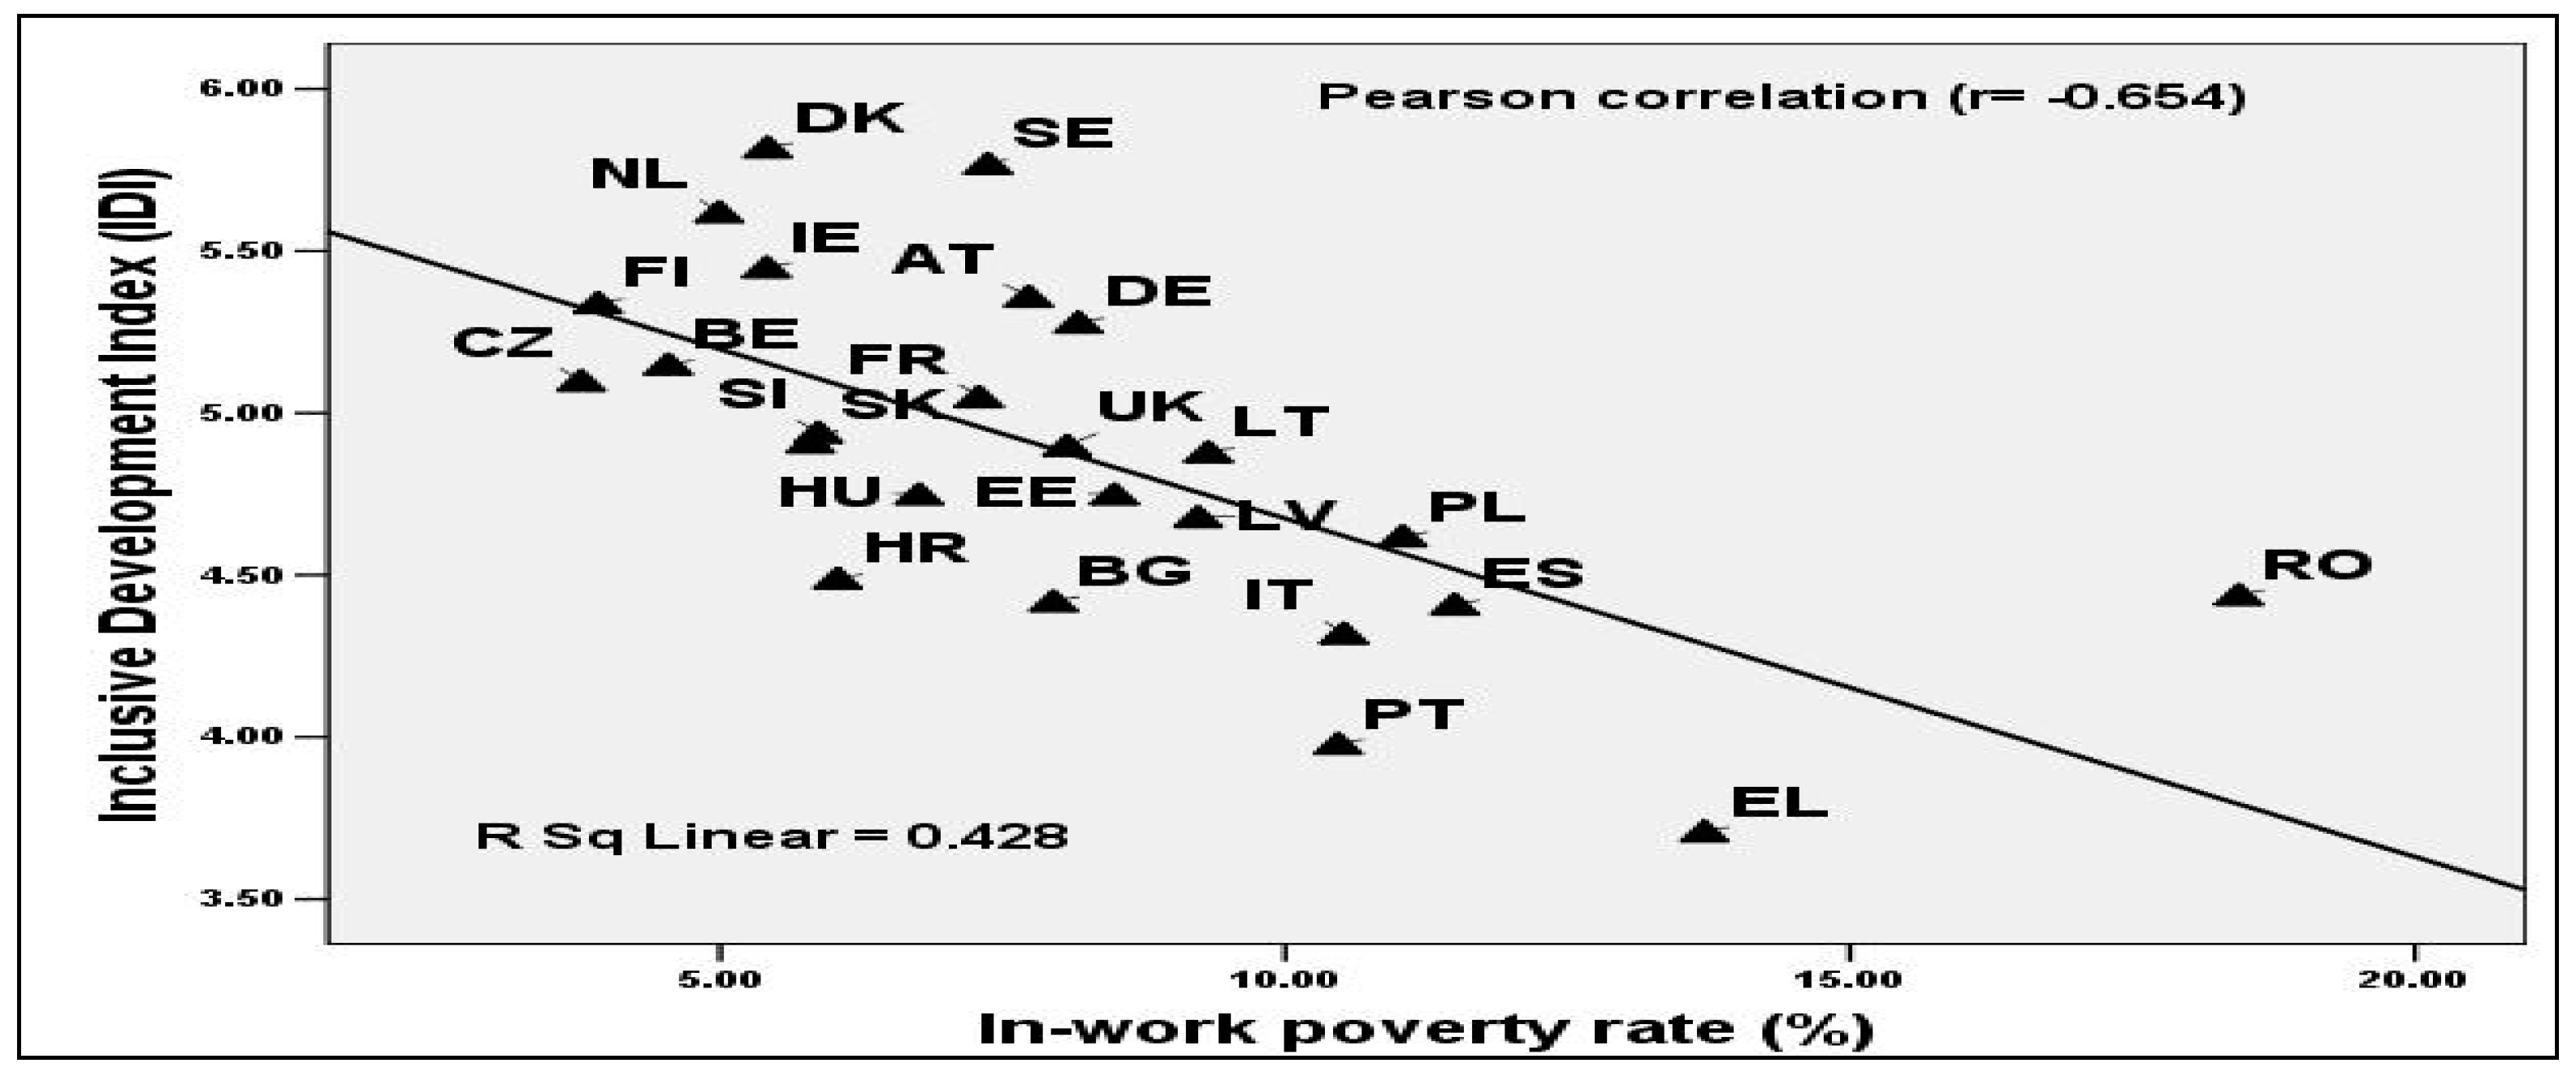
Table 5, all four variables which reflect deficit in productive employment are negatively correlated with variables specific to economic, and inclusive and human development and competitiveness. A negative and significant correlation was identified between inclusive development (expressed by IDI), on the one hand, and working poverty, as a form of deficit in productive employment (
r = −0.654,
p < 0.01,
Table 5) and overall poverty (
r = −0.705,
p < 0.01,
Table 5), on the other hand.
Using a simple regression of IDI on in-work poverty rate (
Figure 3 and
Table 6) points out that working poverty influenced IDI negatively and significantly (
β = −0.654,
p = 0.000). The IDI regression model was statistically significant (
F (1, 23) = 17.195,
p = 0.000;
R2 = 0.428). Thus, the low level of inclusive development in the EU countries can be explained by the existence of high working poverty rate. Taking account of these results, Hypothesis H3 is confirmed.
Furthermore,
Figure 3 shows how the level of working poverty varies across countries. The highest in-work at-risk-of-poverty rate from EU-28 was recorded in Romania (18.44%), followed by the southern countries (Greece, 13.71%; Spain, 11.5%; Italy, 10.52%; Portugal, 10.47%) and Poland (10.04%). In-work at-risk-of-poverty rate in Romania was 2.07 times higher than the European average (8.89%) and almost five times higher than in the Czech Republic (3.77%), the most efficient European country from this perspective. Thus, working poverty is a real socio-economic challenge at the European level, confirmed by other studies [
16,
22,
45,
49].
In order to test Hypothesis H4, we estimated the influence of vulnerable employment (own-account workers and unpaid family workers) and precarious employment (involuntary part-time employment), as independent variables, on working poverty, using multiple regression analysis (
Table 7). The regression model was statistically significant (
F (2, 22) = 19.531,
p < 0.001) and accounted for over 60% of the variance of working poverty (
R2 = 0.640, adjusted
R2 = 0.607). As can be seen by examining the beta weights (β), vulnerable employment received the strongest weight in the model (β = 0.489), followed by involuntary part-time employment (β = 0.434), implying that vulnerable employment has a greater impact on working poverty. In the EU countries, during the 2007–2016 period, higher vulnerable and precarious employment determined a high risk of working poverty. Thus, hypothesis H4 is confirmed and supported by other empirical results [
22,
45,
49]. Corroborating these results with the positive link between vulnerable employment and employment in agriculture (
r = 0.644,
p < 0.01), it is shown that, in EU countries, during the 2007–2016 period, vulnerable workers, mainly those who work in agriculture, suffered the consequences of working poverty risk. Moreover, this implies that both agricultural productivity and the income for agricultural workers need to increase to reduce working poverty [
44].
In order to test Hypothesis H5, we took into consideration the cumulative influence of 14 socio-economic variables selected, the inclusive and sustainable development indicators, productive employment indicators, and indicators which reflect the deficit in productive employment and poverty (see
Table 1), employing complex statistical methods of data analysis, principal component analysis (PCA), and cluster analysis, respectively. Based on PCA (rotation method: Varimax with Kaiser normalization; rotation converged in three iterations), the 14 variables were grouped into two components (factors), which explain 76.63% of the total variance of the 14 initial variables (
Table 8 and
Table 9).
The first principal component (PC1), which explains 64.23% of total variance, includes seven variables (
Table 9). Six of these variables can be specific to an efficient employment, having a positive influence on national competitiveness and development: employment in services, KIA employment, labor productivity, GDP/capita, HDI, and Europe 2020 Competitiveness Index. This component (PC1) is negatively correlated with the employment in agriculture. Thus, a high level of employment in agriculture cannot be associated with economic and human development. The second principal component (PC2) explains 12.4% of total variance of the 14 original variables and includes seven variables: involuntary part-time employment, in-work poverty rate, vulnerable employment, IDI, employment rate, total poverty rate, and compensation of employees (
Table 9). Three of these variables reflect a deficit in productive employment directly (in-work at-risk-of-poverty rate) or indirectly (vulnerable employment and involuntary part-time employment) and have a negative contribution to the creation of this component. Other variables (employment rate, IDI, and compensation of employees) have a positive contribution to the creation of PC2 (
Table 9).
The two principal components were used in the cluster analysis to classify the EU countries. We used hierarchical cluster analysis, Ward’s method, and Euclidean distance to define the number of clusters in which the 25 countries were classified. Then, we used the k-means analysis to actually form the clusters. According to the results of the ANOVA analysis (
F (2, 22) = 31.084,
p < 0.001;
F (2, 22) = 28.419,
p < 0.001;
Table 10), the formed clusters were statistically significant. As can be seen in
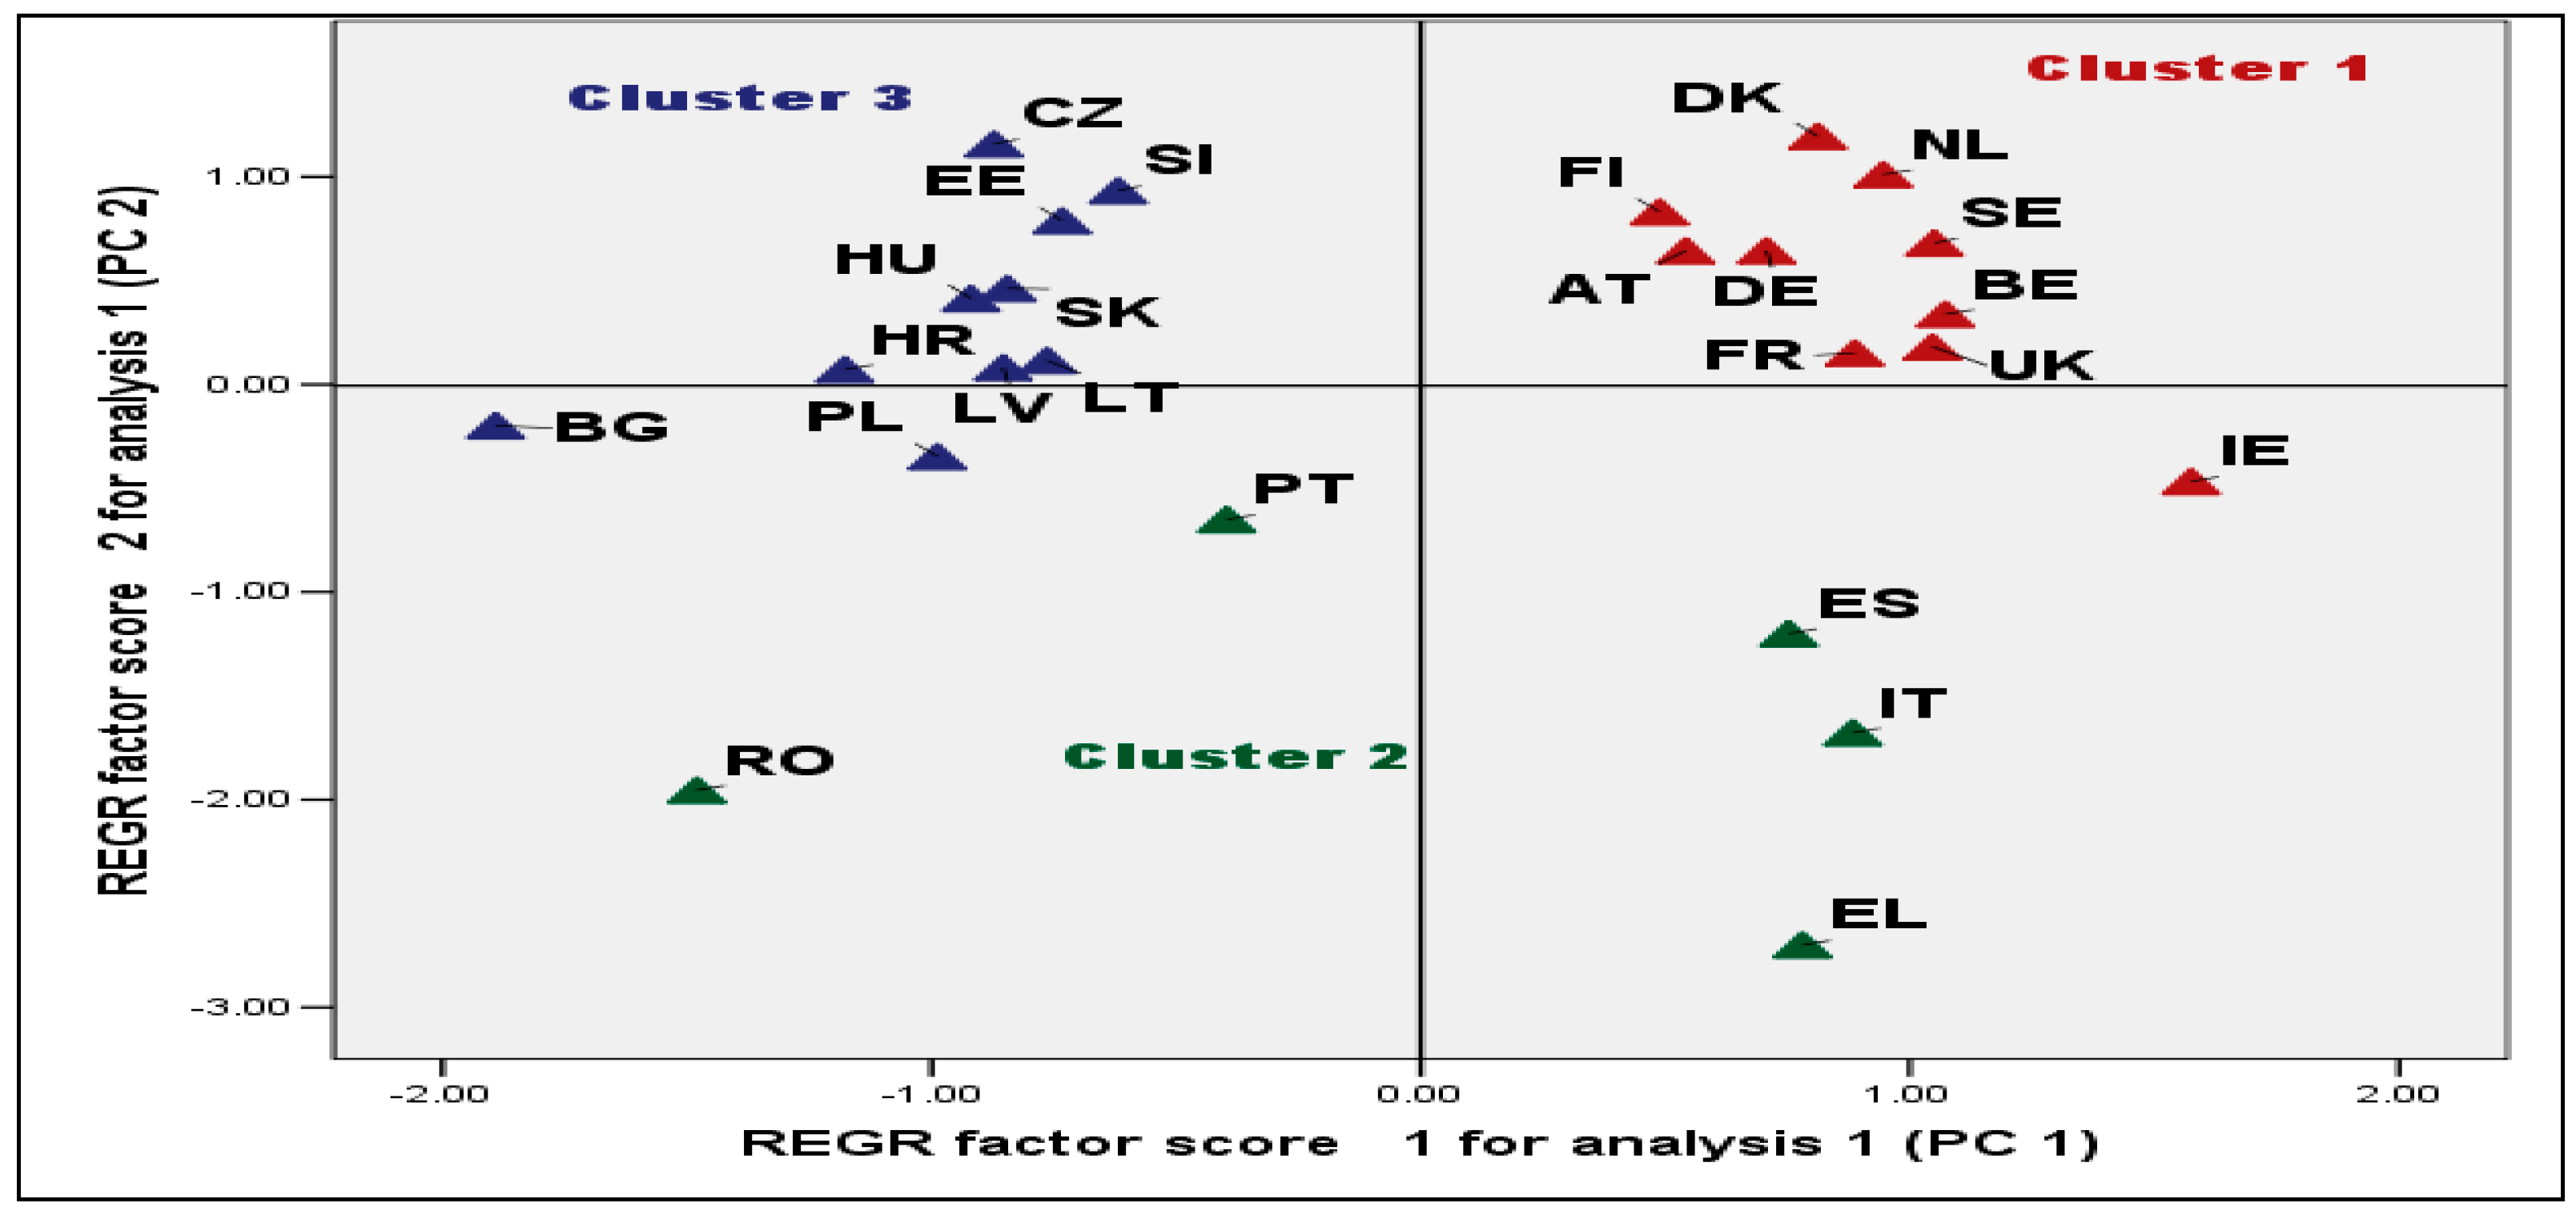
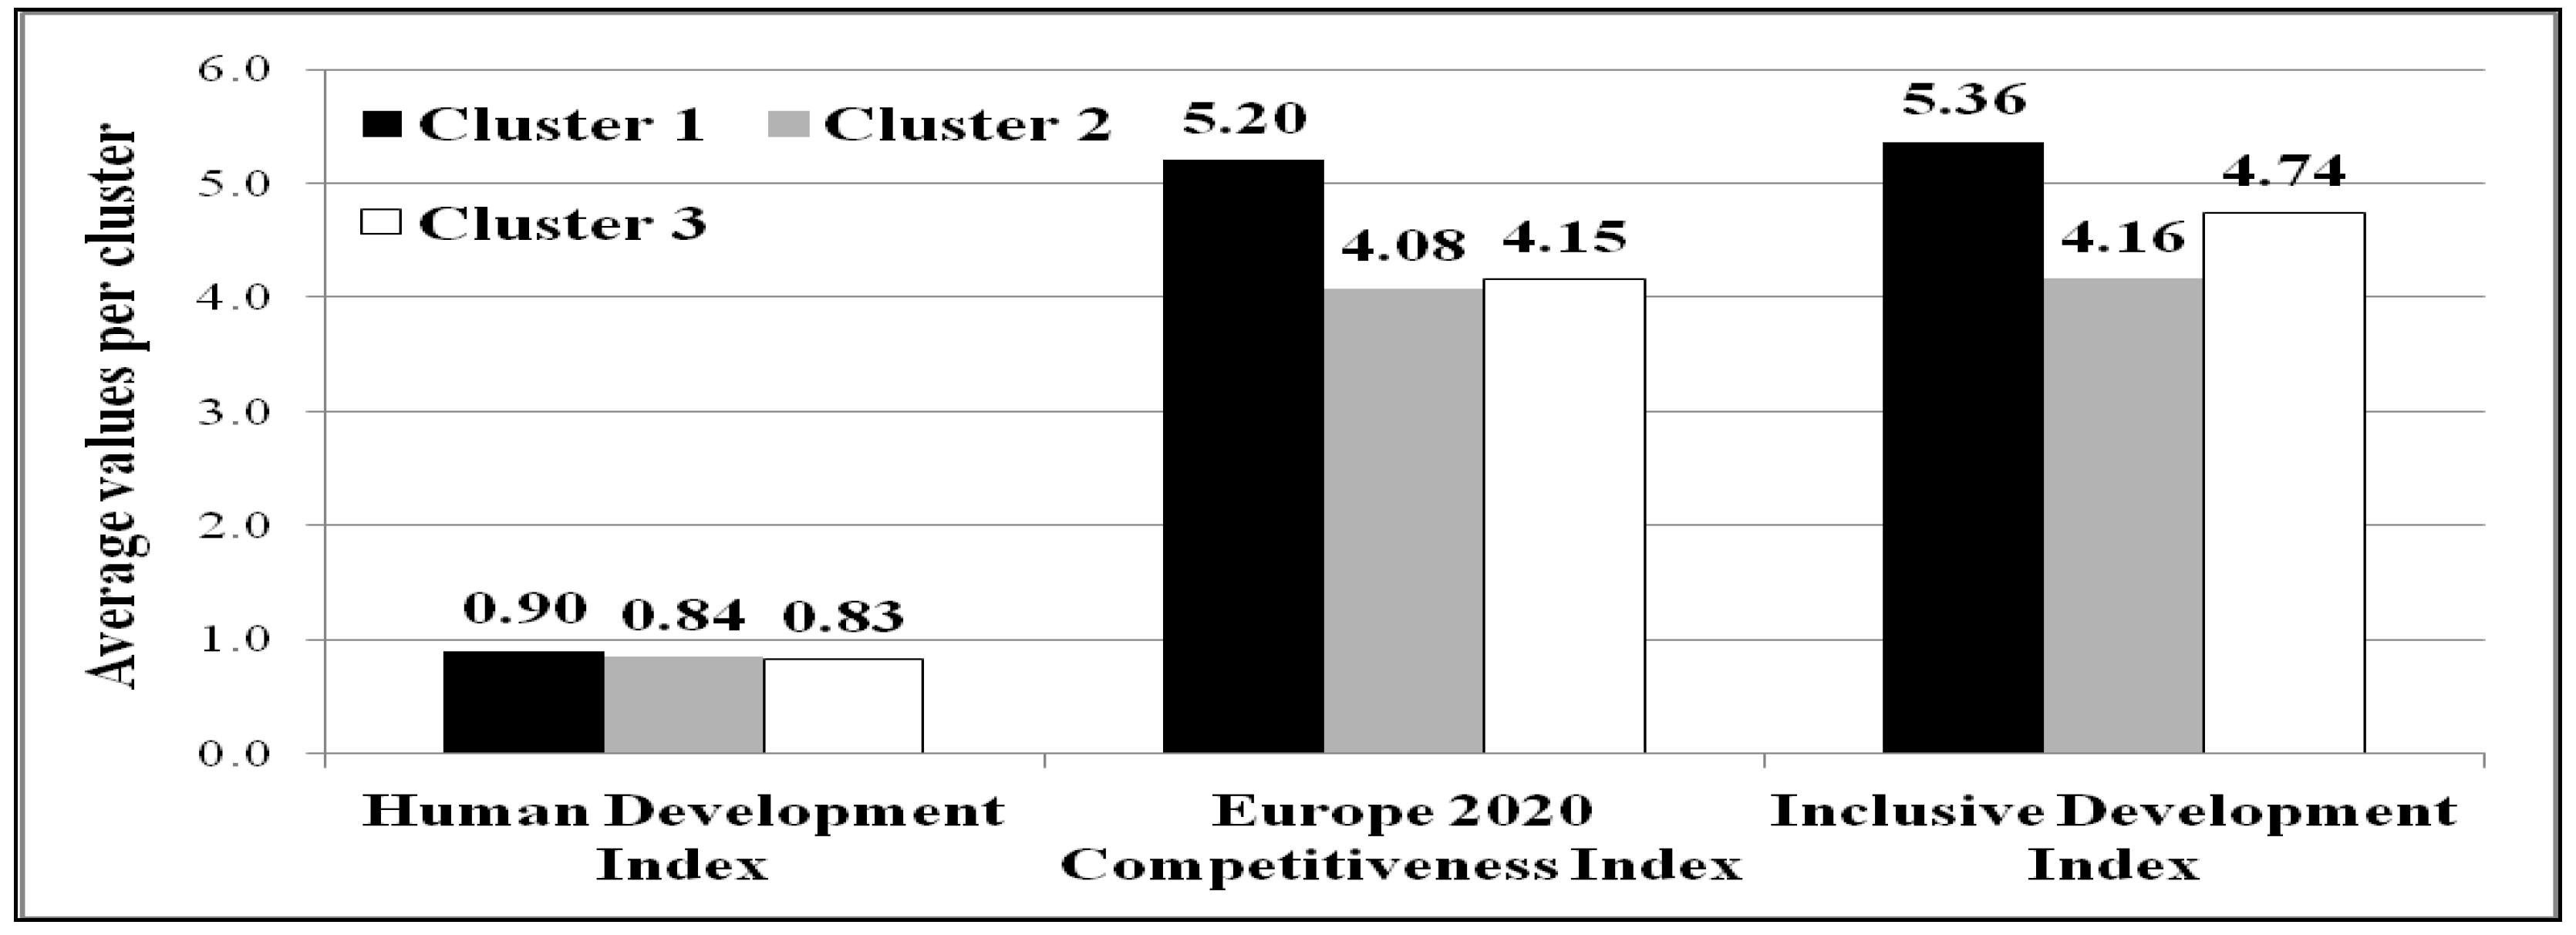
Figure 4, the analyzed countries were classified into three clusters.
Cluster 1 was positively correlated with factor 1 (PC1), but also with factor 2 (PC2) (0.913 and 0.501, respectively,
Table 10). All ten countries included in this group (Austria, Belgium, Germany, Denmark, Finland, France, Ireland, Netherlands, Sweden, and United Kingdom) are old EU member states with the highest level of economic, human, and inclusive development. In the case of these countries, Europe 2020 Competitiveness Index level and labor productivity are also very high (
Figure 5 and
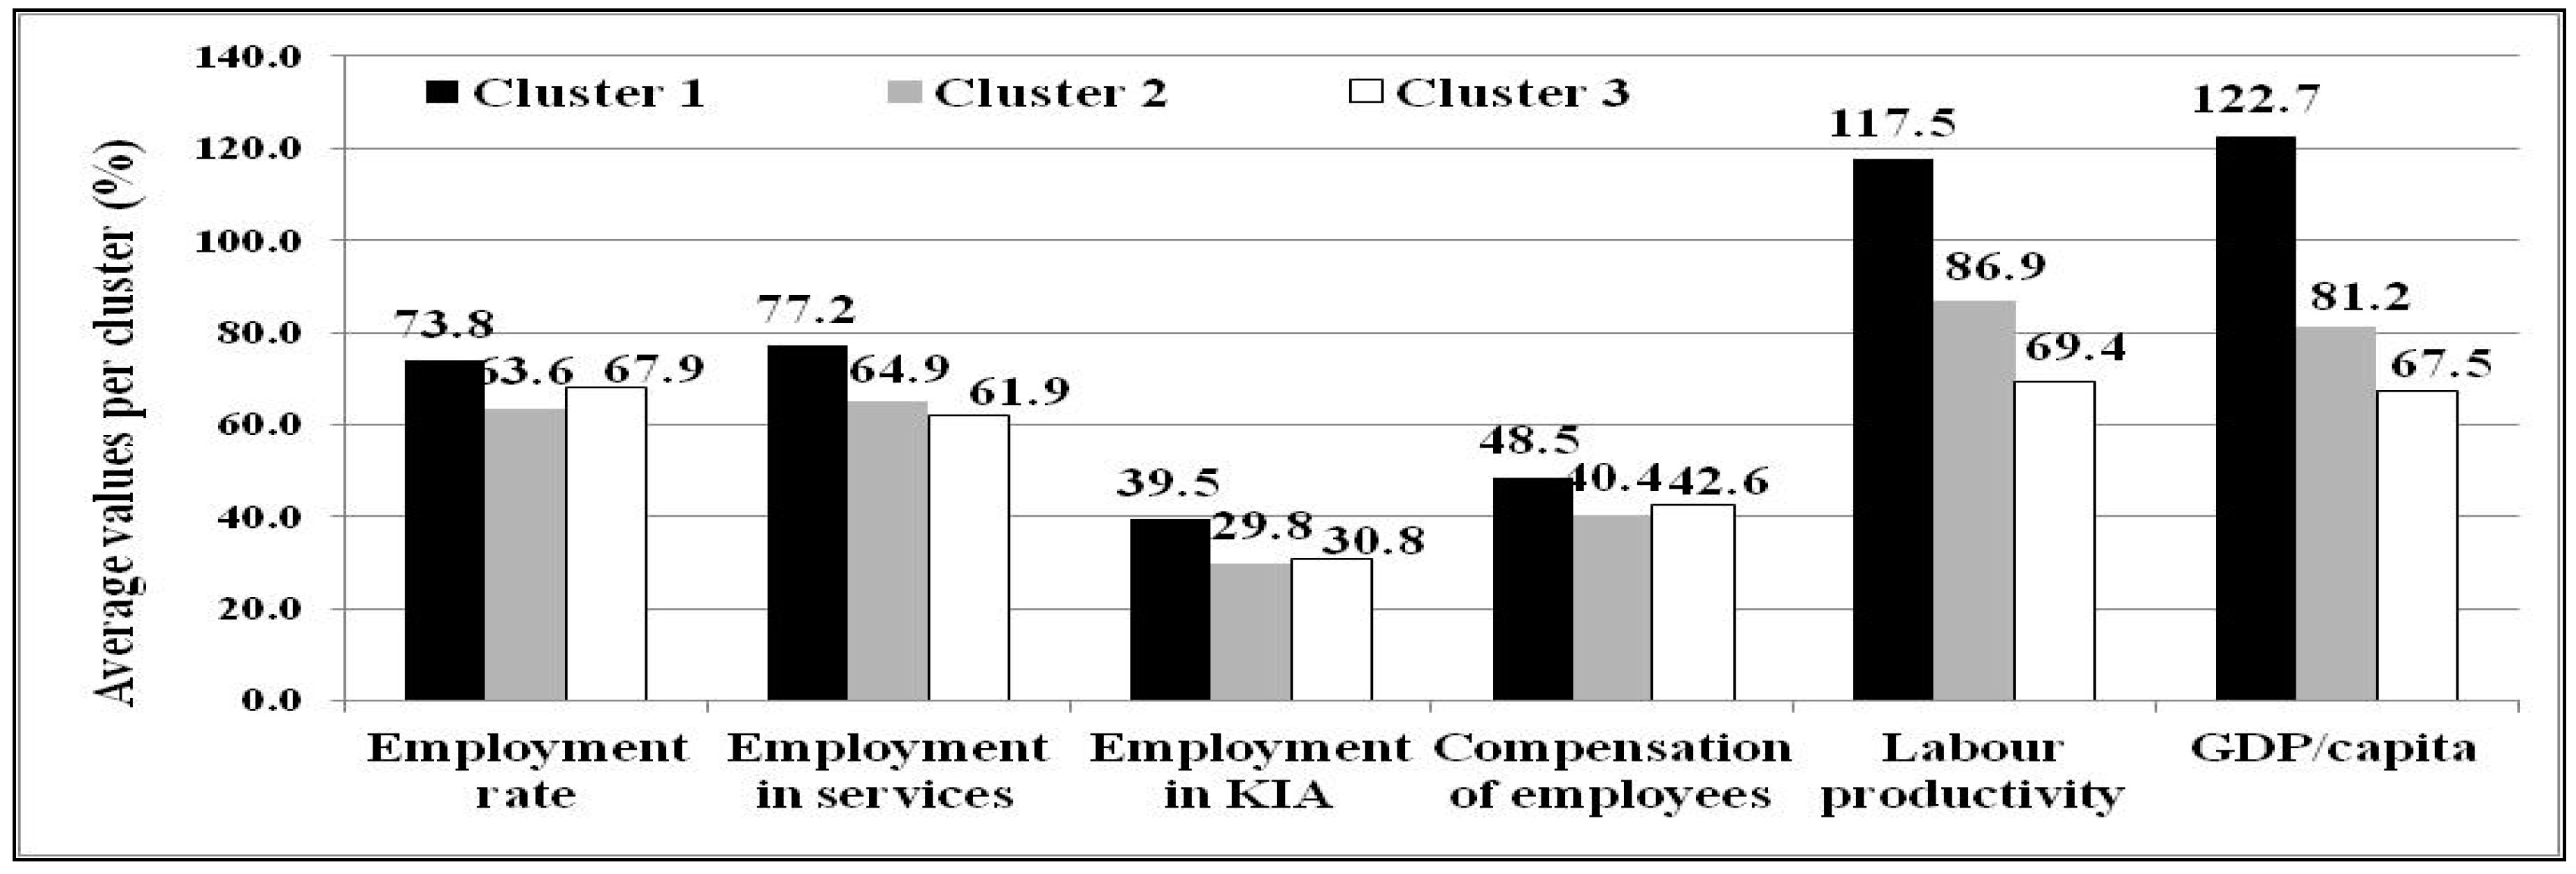
Figure 6). As regards the employment indicators, it is noted that this cluster has the highest level of employment rate (73.83%).
Over 77% of jobs are created in services, and 39.5% in knowledge-intensive activities (KIA), demonstrating a high role of knowledge in these economies (
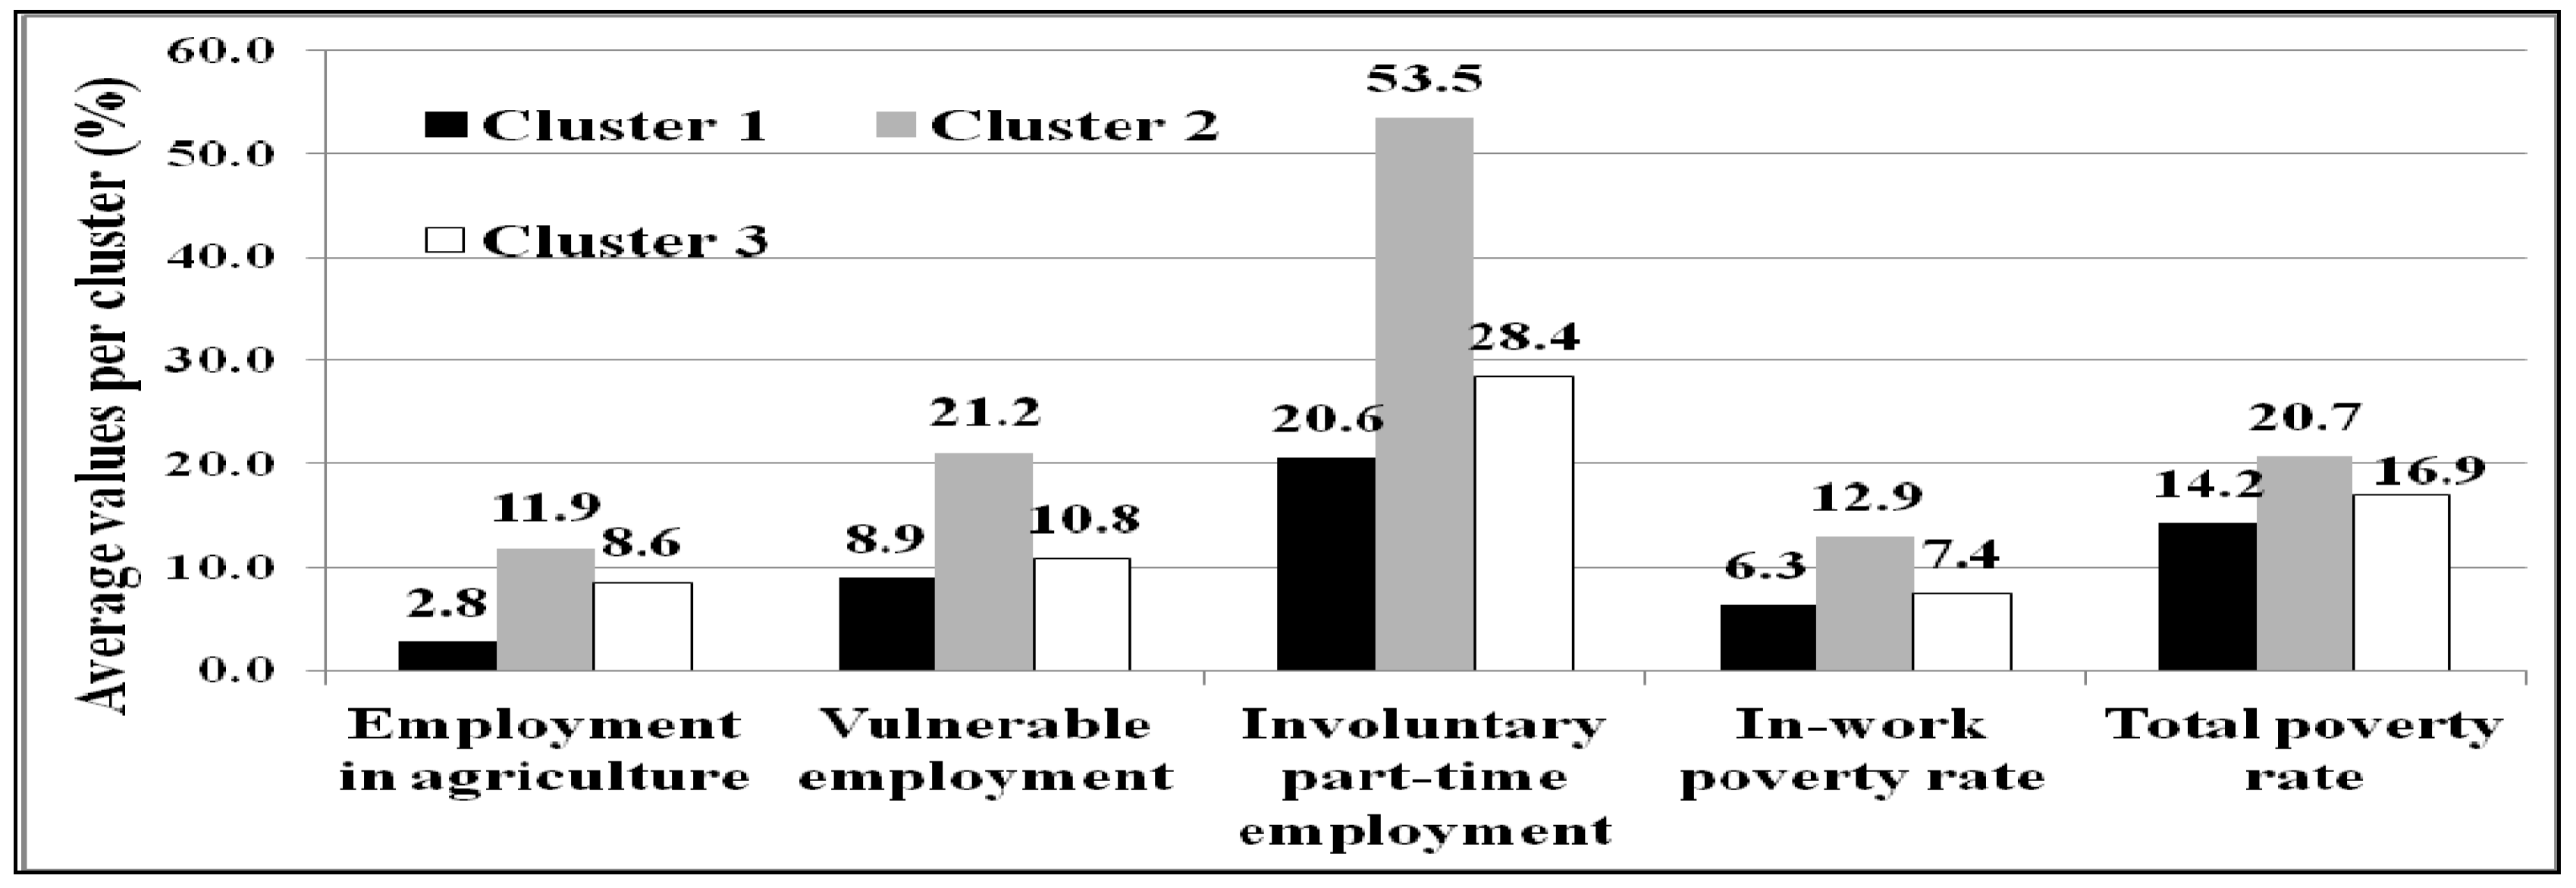
Figure 6). Employment in agriculture, vulnerable employment, involuntary part-employment, and poverty rate (working poverty and overall poverty) recorded the lowest level compared to the other clusters (
Figure 7). Countries from this cluster (except Ireland) were placed in the first quadrant (
Figure 4). Ireland was placed in the fourth quadrant, but close to PC1, because employment in agriculture, vulnerable employment, and involuntary part-time employment are higher compared to the average of this cluster, but lower than in other clusters.
Cluster 2 included five countries (Greece, Italy, Spain, Portugal, and Romania) with the highest working poverty rate, vulnerable employment, employment in agriculture, and involuntary part-time employment (
Figure 6). This cluster was strongly negatively correlated with factor 2 (−1.657,
Table 10). From the perspective of IDI and Europe 2020 Competitiveness Index, this cluster was the lowest. Within this cluster, the countries showed high heterogeneity. The southern countries (Italy, Spain, and Greece) are situated in the fourth quadrant (
Figure 4) close to the negative sense of PC2, achieving both a higher level of economic performance (GDP/capita, labor productivity) and a higher level of deficit in productive employment compared with the average of this cluster. Greece is in first place in EU-28 in terms of involuntary part-time employment (60.29%), in second place in terms of vulnerable employment (28.16%) and working poverty (13.71%), and in third place as regards poverty rate (21.25%; Bulgaria is in second place). Also, this country achieved the worst performance in IDI. Portugal is situated very close to PC1 in a negative sense and tends to be closer to cluster 3. This means that economic development, labor productivity, and employment in services are more reduced than in Italy, Spain, and Greece. Romania’s position in the third quadrant and outside the “correlation circle” (
Figure 4) is due, on the one hand, to the highest values of indicators which reflect deficits in productive employment and poverty, and, on the other hand, to the lowest values of indicators which reflect productive employment and inclusive and sustainable development, compared with the peer countries in the cluster. Thus, during the 2007–2016 period, Romania was EU-28’s leader in terms of poverty rate (23.59%), in-work poverty rate (18.4%), vulnerable employment (30.88%), and employment in agriculture (29.24%). This country was ranked last in EU-28 in terms of employment in services (41.54%), employment in KIA (20.8%), compensation of employees (as a percentage of GDP), and Europe 2020 Competitiveness Index (3.64). Our results show that Romania is confronted with critical challenges in terms of productive employment and its impact on inclusive and sustainable development, taking into consideration that it is ranked last in both cluster 2 and in the EU countries.
Cluster 3, which consisted of the Baltic states and some CEE States (Estonia, Lithuania, Latvia, Poland, Czech Republic, Hungary, Slovenia, Slovakia, Croatia, and Bulgaria), was very far from PC1 (−0.966). Thus, some of the indicators such as labor productivity, economic and human development, and employment in services had the lowest values. A low level of economic performance can be observed. The GDP/capita average was only 54.9% of the GDP/capita realized by the countries from cluster 1 and labor productivity was 59.1%. Within this cluster, the countries showed some heterogeneity. Bulgaria and Poland were situated in the third quadrant (
Figure 4) because, in these countries, employment in agriculture, compensation of employees, and poverty rate were higher compared with the average of this cluster. Bulgaria was in last place in EU-28 in terms of human and economic development, and labor productivity, and the next to last as regards Europe 2020 Competitiveness Index (3.75). The Czech Republic recorded, during the 2007–2016 period, the lowest in-work poverty rate in EU-28, which can be explained by the highly distributive effects of its welfare system [
17,
22]. Our results (
Figure 5 and
Figure 6) show that countries enrolled in this cluster had a lower level of deficit in productive employment, and a lower level of inclusive development and competitiveness than cluster 2, but higher than cluster 1. Thus, cluster 2 was ranked second in terms of productive employment for inclusive and sustainable development.
In the light of these results, it was proven that there are common features and differences between EU member states based on their interrelationship among productive employment, and inclusive and sustainable development; thus, Hypothesis H5 is confirmed. Therefore, different and specific measures are needed to support the improvement of this interrelationship.
5. Conclusions and Main Implications
One of the real challenges of economies in the current economic and social global environment is to generate high productive employment in order to achieve inclusive and sustainable development. In this context, this paper highlighted the main characteristics and mechanisms of productive employment, focusing on the interrelationships among productive employment, and inclusive and sustainable development in the EU countries, during the recent economic crisis and recovery period (2007–2016). Moreover, it is essential to assess productive employment and to identify key opportunities and barriers in order to create productive employment, taking into account that productive employment can be a driving force for reducing gaps between the EU countries in order for these to really integrate into the European Union [
8].
The hypotheses in the study were successfully supported by empirical data. The research results showed that economic growth in some EU countries (countries in clusters 2 and 3) should be more sustained and inclusive, and sufficiently employment intensive, such that more job opportunities for a larger workforce are created, and workers, especially those who are poor, benefit from improvements in standards of living [
16]. Thus, an important challenge for policy-makers is to mix pro-growth and pro-poor policies [
32]. As WEF report [
60] (p. 6) states, “a new growth model that places people and living standards at the center of national economic policy and international economic integration is required to transform inclusive growth from aspiration into action in the Fourth Industrial Revolution”.
The results of the correlation and regression analysis reflected, on the one hand, the positive influence of labor productivity on inclusive and sustainable development (expressed by GDP/capita, HDI, IDI and Europe 2020 Competitiveness Index), and, on the other hand, the positive influence of the level of employment in services and of employment in knowledge-intensive activities on labor productivity. Also, the results showed that, in the EU countries during the period analyzed, inclusive development was negatively influenced by working poverty (as a deficit in productive employment), and that vulnerable employment and precarious employment were important drivers for a high level of working poverty. Thus, the results showed that gaps in the level of development can be explained by the levels and characteristics of productive employment and that there are large cross-country differences in terms of the interlink between productive employment and inclusive and sustainable development, which emphasizes the need to take specific actions to translate unproductive employment into productive employment.
Results of the PCA and cluster analysis, for the 2007–2016 period, emphasized that the highly developed European countries proved to be more homogeneous in terms of the interrelationship between productive employment, and inclusive and sustainable development, as they were enrolled in the same cluster (cluster 1). On the contrary, European countries with medium and low levels of development, mostly new member states, recorded different results, divided into two clusters. Southern countries (Greece, Italy, and Spain), together with Portugal and Romania, were grouped in the most unproductive cluster (cluster 2) characterized by the highest working poverty, vulnerable employment, employment in agriculture, and involuntary part-time employment, with negative consequences on inclusive and sustainable development.
These findings reflect, on the one hand, the need to accelerate labor productivity growth based on productive structural transformation, characterized by a shift from low-productivity sectors to high-productivity sectors (especially in the countries in cluster 2 and 3). If the European countries, where the agricultural sector still generates significant jobs (Romania, 29.2% of total employment; Bulgaria, 19.2%; Poland, 12.6%; Croatia, 11.7%; Greece, 11.5%), are aware of the potential of the agriculture sector and they act through strategic investments in this sector, agricultural jobs could be more productive; consequently, gains in productivity can raise incomes to a level that enables agricultural workers to escape the poverty trap. On the other hand, it is essential that poor workers significantly benefit from the gains in labor productivity.
Moreover, policies for prematurely deindustrialized countries and for those with a high share of employment in the agricultural sector should target a substantial subsidy for traditional agriculture, focusing on the ecological component of sustainable development. Agricultural jobs should become more productive, but also better paid. Furthermore, these sectoral changes should be accompanied by similar changes from vulnerable employment to wage and salaried employment, having positive consequences on the share of compensation for employees in total income, and an implicit effect on working poverty reduction.
The findings of this research can be useful for policy-makers in order to formulate policies that support the improvement in productive employment within a framework of inclusive and sustainable development.


