Abstract
Modern agricultural innovations with nanomaterials are now being applied in every sphere of agriculture. However, their interaction with soil microbial processes is not being explored in detail. This initiative was undertaken to understand the effect of metal-oxide nanoparticles with heat stress in soil. Metal-oxide nanoparticles, zinc oxide (ZnO), and iron oxide (Fe2O3) (each at 10 and 40 mg kg−1 w/w) were mixed into uncontaminated soil and subjected to heat stress of 48 °C for 24 hours to assess their effect on soil biological indicators. The resistance indices for the acid (ACP), alkaline phosphatase (AKP) activity, and fluorescein diacetate hydrolyzing (FDA) activity (0.58 to 0.73, 0.58 to 0.66, and 0.42 to 0.48, respectively) were higher in the presence of ZnO nanoparticles as compared to Fe2O3 nanomaterials, following an unpredictable pattern at either 10 or 40 mg kg−1 in soils, except dehydrogenase activity (DHA), for which the activity did not change with ZnO nanomaterial. An explicit role of ZnO nanomaterial in the revival pattern of the enzymes was observed (0.20 for DHA, 0.39 for ACP, and 0.43 for AKP), except FDA, which showed comparable values with Fe2O3 nanomaterials for the following 90 day (d) after stress. Microbial count exhibiting higher resistance values were associated with Fe2O3 nanoparticles as compared to ZnO nanomaterials, except Pseudomonas. The recovery indices for the microbial counts were higher with the application of Fe2O3 nanomaterials (0.34 for Actinobacteria, 0.38 for fungi, 0.33 for Pseudomonas and 0.28 for Azotobacter). Our study emphasizes the fact that sensitive microbial indicators in soil might be hampered by external stress initially but do have the competency to recover with time, thereby reinstating the resistance and resilience of soil systems.
1. Introduction
Nanomaterials are being increasingly used owing to their exclusive properties (high aspect ratio; surface area to volume ratio) making them valuable for copious agricultural applications. Based on the mode of application, there is every possibility of its entry into the soil system and directly or indirectly interacting with a range of soil components. Soil is a major environmental compartment considered as a sink for these materials, which is of serious concern because of their typical dissolution properties and charges, in addition to their small sizes and large surface-to-mass ratios [1]. Numerous studies have shown that exposure to external nanomaterials can be toxic for microbes [2]. Toxic effects of these particles have been observed in several in vitro studies; in particular, many nanoparticles, such as zinc-oxide nanoparticles, are known to have antimicrobial properties [3]. Jiang et al. [4] found that engineered ZnO nanoparticles were toxic, causing 100% mortality of B. subtilis, E. coli, and P. fluorescens. Conversely, Dimkpa et al. [5] reported that CuO nanoparticles were more noxious to the beneficial rhizosphere isolate P. Chlororaphis than ZnO nanoparticles. The toxicity mechanism involves oxidative stress generated by the fabrication of reactive oxygen species (ROS) from nanoparticles in contact with microbial membranes, causing disruption of membranes, oxidation of proteins, or interruption of energy transduction [6]. Pawlett et al. [7] studied the impact of nanosized zero-valent iron, an effective land remediation tool, on soil microbial biomass in an incubation experiment with three soil textural class types and reported that the zero-valent iron significantly reduced microbial biomass by 29%. Effects of nanoscale and microscale zero-valent iron particles on ammonia oxidation potential usually mediated by microorganisms showed an inhibition in its potential, suggesting possible changes in the microbial community. Nanoscale and microscale zero-valent iron particles stimulated dehydrogenase activity (DHA), but had minimal influence on hydrolase activity [8]. These results indicate that metal and metal oxides can induce modification of microbial activities in soil and of biogeochemical cycles. However, reports on the relative toxicities of these metal and metal-oxide nanoparticles on soil microorganisms are contradictory and vary according to the type of nanoparticles, their concentrations, contact time, and activity. Although several previous works related to the influence of nanomaterials on microorganisms exist in the literature, we could not locate studies focusing on the impact of nanomaterials on the resistance and recovery of these soil organisms (in terms of their number, biomass, and associated enzymes) under abiotic stresses such as heat.
Aberrations in atmospheric temperatures were observed in the last two decades, which can influence soil organisms and microbial processes [9]. Behavior of synthetic nanomaterials needs to be evaluated as to whether nanoparticles can be potentially utilized in the agricultural sector to combat the ill effects of changing climate on soils and microorganisms therein, ultimately benefitting crop productivity. It is quite obvious that stresses (high temperature or addition of nanomaterials) of this nature may have large impact on soil microorganisms, which are considered to be the key players in soil functions. In order to significantly maintain these soil functions, the response of soils to stress has therefore become a focal point of ecological research. Resistance (the capacity of a soil to function) and resilience (ability to counteract adverse changes) are the key terms that can be considered as indicators of ecological stability and are related to soil health [10]. Resistance and resilience are highly correlated to the diversity of microbial communities and properties of the inherent soil organisms [11]. Considering heat as an abiotic stress, in this study, we hypothesized that addition of nanomaterials could have considerable implications on these soil microflora and enzymes and also influence the resistance and resilience of soil organisms against high temperature. To test this hypothesis, an incubation experiment was conducted to evaluate the abundance of microbial groups, microbial biomass, and enzyme activities in soils amended with nanomaterials and elucidate the resistance and resilience of soil microbes and associated enzymes against heat stress. A review of the global literature revealed that the impact of nanomaterials on the soil microbial community is context-dependent (nature, type of nanomaterials, dose, soil types, types of microbes, etc.). Thorough scientific study on the impact assessment of nanomaterials on the soil microbial community and its trend prediction are necessary to understand the behavior of organisms and associated soil enzymes.
2. Material and Methods
2.1. Site Description and Soil Sampling
The experiment was conducted with soil obtained from a permanent plot experiment, which was established in 1984 at the Bihar Agricultural College Research Farm (25°23′N, 87°07′E, 37.19 mean sea level), under the network project research program of the Indian Institute of Farming System Research, Modipuram, India. The soil texture is clayey with the following physico-chemical properties: pH: 7.40, organic carbon: 0.46%, available nitrogen: (N) 194 kg ha−1, available phosphorus (P): 10.12 kg ha−1, and available potassium (K): 128.65 kg ha−1. The experiment was laid out in randomized block design with 4 replicates with the following treatments: control (T1) (no fertilizer, no organic manure); 50% recommended dose of fertilizers (RDF) to both rice and wheat (T2); 50% RDF to rice and 100% RDF to wheat (T3); 75% RDF to both rice and wheat (T4); 100% RDF to both rice and wheat (T5); 50% RDF + 50% N through farm yard manure (FYM) to rice and 100% RDF to wheat (T6); 75% RDF + 25% N through FYM to rice and 75% RDF to wheat (T7); 50% RDF + 50% N through wheat straw to rice and 100% RDF to wheat (T8); 75% RDF + 25% N through wheat straw to rice and 75% RDF to wheat (T9); 50% RDF + 50% N through green leaf manure (GLM) (Sesbaniaaculeata) to rice and 100% RDF to wheat (T10); 75% RDF + 25% N through GLM to rice and 75% RDF to wheat (T11); farmers’ fertilizers practice to rice and wheat (70 kg N + 13.2 kg P + 8.3 kg ha−1)(T12). Soils (0–15-cm depth) were sampled from the control plots after harvest of rice crop (October) in 2015in order to ensure that samples were not contaminated either with fertilizers or any supplementary materials. Using a soil core (inner diameter: 4.8 cm and height: 15 cm), a total of 32 random samples were collected from 4 field replicates to form a composite sample.
2.2. Synthesis of Zinc-Oxide (ZnO) Nanoparticles
The ZnO nanoparticles were synthesized following the procedure outlined by Aneesh et al. [12]. In order to synthesize the ZnO nanoparticles, stock solutions of Zn (CH3COO)2 2H2O (0.1 M) was prepared in 50 mL methanol under stirring. Then, 25mL of NaOH (varying from 0.2 M to 0.5 M, solution prepared in methanol) was added to the stock solution with constant stirring in order to raise the pH value of reactants to 10. These solutions were transferred into Teflon-lined sealed stainless steel autoclaves and maintained at various temperature in the range of 100–200 °C for 6 and 12 h under autogenous pressure. Solutions were then allowed to cool naturally to room temperature. The synthesized samples were characterized for their structure by X-ray diffraction (XRD) and transmission electron microscopy (TEM).
2.3. Synthesis of Iron-Oxide (Fe2O3) Nanoparticles
The Fe2O3 nanoparticles were synthesized following standard procedure as outlined by Shah and Shah [13]. A solution of 0.6 M NaOH was prepared in double-distilled water and 0.01 M solution of FeCl3 was added into it. Stirring was continued up to 30 min, maintaining constant temperature at 100 °C, and a precipitate of Fe(OH)3 was obtained. It was washed with double-distilled water several times until the pH became 8.8. Then, 1 mL of 1 M HCl and 10 mL of 0.1 M solution of NaH2PO4 was added to the precipitate, stirred, and heated up to 100 °C. Iron-oxide particles formed were filtered, washed within distilled water, and dried in air. The particles were also characterized by TEM and XRD.
2.4. Characterization of ZnO and Fe2O3Nanoparticles by TEM and XRD
TEM images of ZnO and Fe2O3 nanoparticles were taken through a TEM manufactured by JEOL, Japan (JEN 1011, 100 KV). Specific instrumental setup was 80 kV HV with magnification 80,000×.Powder diffractions of ZnO and Fe2O3were taken and scanned separately in a Philips PW 1710 X-ray diffractometer using automated powder diffraction (APD) software (PAN analytical, Spectris Technologies), with the setting of the instruments as follows: radiation type: Cu Kα; tube current: 20 mA; generator voltage: 40 kV; start angle (º2θ): 3.00; end angle (º2θ): 40.00; scan step size: 0.1; scan type: continuous; scan speed (2θ Sec−1): 0.025. Mineralogy of Fe2O3 and ZnO nanoparticles were confirmed through powder diffraction data from the Joint Committee on Powder Diffraction Standards (JCPDS) [14].
2.5. Average Crystalline Size Calculation
Average crystalline size of ZnO and Fe2O3 nanoparticles were estimated using the Debye–Scherrer formula [15] as presented below:
where λ represents the wave length of X-rays (0.1541 nm), β is FWHM (full width at half maximum), θ is the diffraction angle, and D is the particle diameter size.
2.6. Incubation Experiment Details
To test the effect of nanomaterials on the resistance and resilience of the microbial parameters, the control soil was treated with two novel materials—zinc and iron nanomaterials—each at 10 and 40 mg kg−1 and kept uniformly for 30 d before incubation to establish equilibrium. Biological indicators were assessed thereafter and considered as the values for day 0. After 30 d, samples were subjected to stress by incubating them at 48 °C for 24 h. Thereafter, soils were brought back to the moisture content at60% of maximum water holding capacity to measure their resilience. Moisture content at this level resembles the field capacity of soil considered indispensable for the recovery of microbes and hence associated enzymes. Once the moisture content of 18–20% (v/v) was achieved, the samples were incubated at 28 ± 2 °C for measuring the soil parameters at 1, 14, 28, 56, 70, and 90 d after stress [16]. Once the data on various parameters were measured, the resistance and resilience indices of the measured parameters were calculated (see Section 2.8).
2.7. Biological Indicators of Soil Health
The DHA in soil was determined by the spectrophotometric method as described by Klein et al. [17] using 3% triphenyl tetrazolium chloride (TTC). Of the various methods available for assay of phosphomonoesterase activity, i.e., acid phosphatase (ACP) and alkaline phosphatase (AKP) in soils, the method of Tabatabai and Bremner [18] is the most rapid, accurate, and precise. Fluorescein diacetate activity (FDA) activity in soils was determined by the methodology as described by Green et al. [19]. For this purpose,1 g of air-dried soil was taken in a 125 mL Erlenmeyer flask and 50 mL of 60 mM sodium phosphate buffer (pH 7.6) and 0.50 mL of 4.9 mM FDA lipase substrate solution (20 mg FDA lipase substrate in 10 mL acetone) were added to the flasks. The absorbance was measured on a spectrophotometer at a wavelength of 490 nm. Soil microbial biomass carbon (MBC) was analyzed by the procedure given by Vance et al. [20] using 0.5M K2SO4 as an extractant. The MBC was calculated using the formula given below and reported on an oven-dried soil basis.
where CF:carbon in fumigated soil, CUF:carbon in unfumigated soil, and KEC:efficiency of extraction (0.45).
Serial dilutions were prepared within the laminar flow assembly for counting and isolation of soil Actinobacteria, fungi, Pseudomonas, and Azotobacter [21].
2.8. Measurement of Resistance and Resilience Indices
The resistance index calculates the absolute amount of change relative to the control at the end of the disturbance [22] and ranges from −1 to +1, with +1 indicating maximum resistance (that is, no effect of stress). The resilience index calculates the absolute difference that exists between stress and control treatments relative to the initial absolute effect of the disturbance and ranges from −1 to +1, with +1 indicating maximum resilience (that is, complete recovery after rewetting) [11]. The formulas used for calculating resistance and resilience are given below:
where, D0 is the difference between the control (C0) and the disturbed soil at the end of disturbance (t0) and Dx is the difference between the control and the disturbed soil at the time point (tx).
2.9. Statistical Analysis
Data obtained from the experiment with a completely randomized design was statistically analyzed by analysis of variance (ANOVA) using Microsoft Excel (Microsoft Corporation, USA) and SPSS window version 16.0 (SPSS Inc., Chicago, IL, USA) packages to ascertain the treatment effect [23]. Duncan’s multiple range test (DMRT) was carried out for mean comparison, where ANOVA was significant at p < 0.05. The Pearson’s correlation among various parameters was done as the sample was large (n = 105) through SPSS 16.0 software.
3. Results
3.1. Characterization of Synthesized Nanomaterials
The synthesized nanomaterials (Fe2O3 and ZnO) were characterized through TEM and XRD. The diameter of synthesized Zn and Fe oxides were 44.14–67.61 nm and 39.73–45.50 nm, respectively (Figure 1 and Figure 2), which confirms that synthesized materials are in the nanoscale range. XRD study (Figure 3 and Figure 4) confirms the wurtzite crystal structure, which signifies the stability of the materials. Crystal structure of Zn- and Fe-oxide nanoparticles were confirmed through respective typical XRD peaks in comparison with the JCPDS profile.
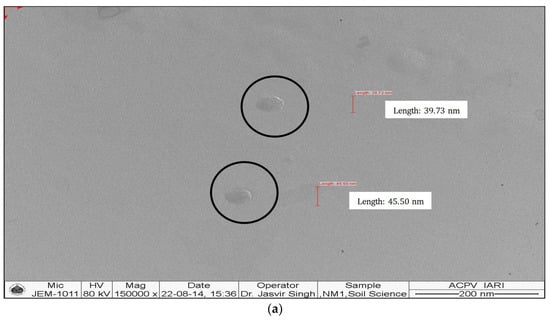
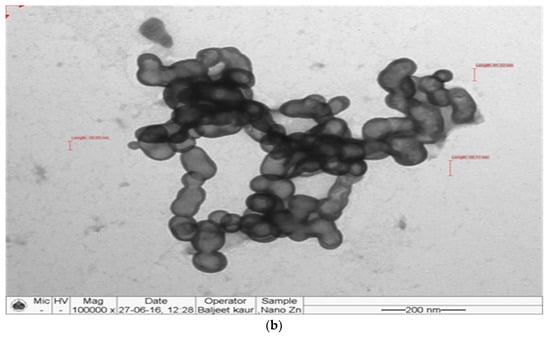
Figure 1.
Transmission electron microscopy (TEM) images of ZnO nanoparticles, (a) size and (b) shape.
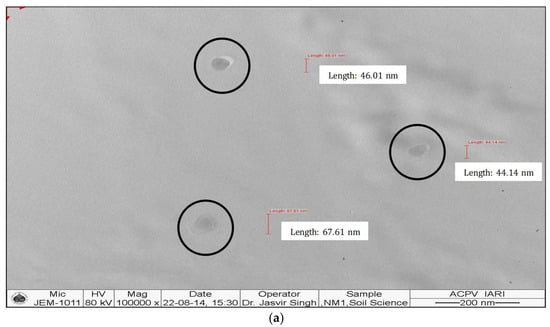
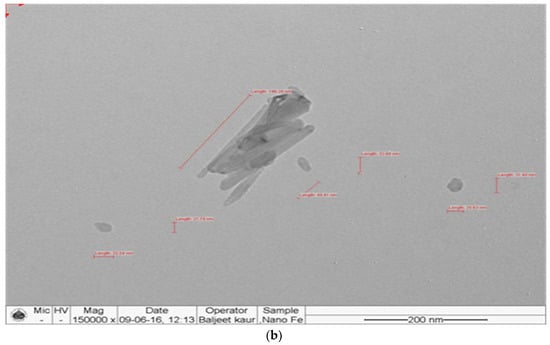
Figure 2.
Transmission electron microscopy (TEM) images of Fe2O3 nanoparticles, (a) size and (b) shape.
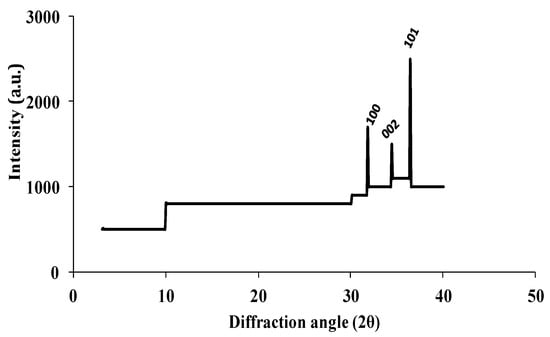
Figure 3.
X-ray diffraction (XRD) results for ZnO nanoparticles where 100, 002 and 101 are Miller Indices for ZnO nanoparticles.
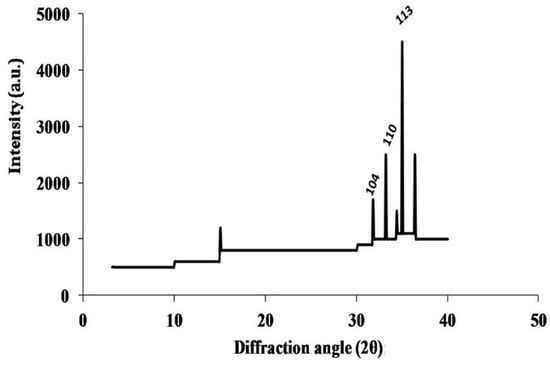
Figure 4.
X-ray diffraction (XRD) results for Fe2O3 nanoparticles, where 104, 110 and 113 are Miller Indices for Fe2O3 nanoparticles.
3.2. Biological Indicators of Soil Health
Across all the treatments, DHA in soil on day 0 (0 d) ranged from 17.61 to 24.34 µg triphenyl formazan (TPF) released g−1 dry soil h−1. DHA was significantly (p < 0.05) higher in the control (24.34 µg TPF released g−1 dry soil h−1) than the treatments with nanomaterials added (T2 to T5) (18.78–20.26 µg TPF released g−1 dry soil h−1), showing the toxic effect of these materials on the metabolic activity of the microorganisms in soil. In comparison to the control, data revealed a decrease of the DHA by 20 to 38% with the addition of these nanomaterials (Figure 5). The ACP activity was significantly lower in treatment T3 (81.61 µg p-nitrophenol released g−1 dry soil h−1) as compared to T2 (113.51 µg p-nitrophenol released g−1 dry soil h−1). The trend was similar for nano-Fe, where the level of doses significantly affected the ACP activity as observed in T4 (87.16 µg p-nitrophenol released g−1 dry soil h−1 and T5 (77.64 µg p-nitrophenol released g−1 dry soil h−1).
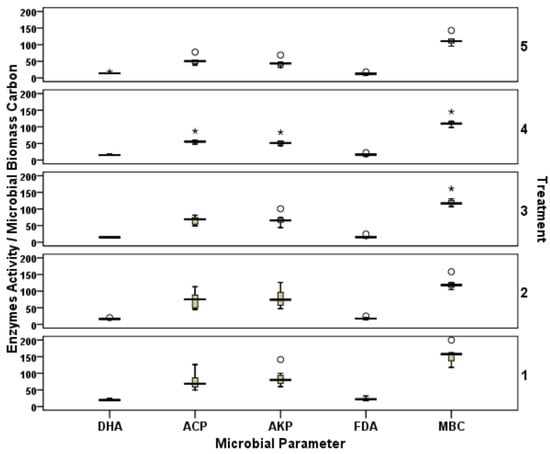
Figure 5.
Effect of heat stress on dehydrogenase activity (DHA) (µg TPF released g−1 dry soil h−1), acid phosphatase (ACP) activity, alkaline phosphatase (AKP) activity (µg p-nitrophenol released g−1 dry soil h−1), fluorescein diacetate activity (FDA) (µg fluorescein released g−1 dry soil h−1), and microbial biomass carbon (MBC) (µg g−1 dry soil) (secondary Y-axis indicates the treatments 1–5; i.e., T1 to T5). The circle represents the values one and half times less than inter-quartile range and asterisks represents the values one and half times more than inter-quartile range. Bars represents the maximum and minimum value.
The pattern of AKP activity in soil amended with nanomaterials was significantly affected by the treatments. In this study, application of nano-Zn at various levels (10 and 40 mg kg−1) significantly affected the AKP; there was a sharp decline (~25%) in the AKP activity when a higher dose of nano-Zn (T3) was used (Figure 5). FDA activity in soil samples on 0 d ranged from 18.08 in T5to 31.63 µg fluorescein released g−1 dry soil h−1 in the control. FDA activity was significantly decreased when the concentration of nano-Fe was increased from 10 mg kg−1 (22.37 µg fluorescein released g−1 dry soil h−1) to 40 mg kg−1 (18.08 µg fluorescein released g−1 dry soil h−1) (at p < 0.05). The impact of heat stress sharply reduced FDA activity, which was evident 1 d after incubation (DAI). Across the treatments, data revealed a reduction of the FDA activity by 53 to 84% 1 DAI. The least reduction was in T2, with 53%, whereas the control treatment showed the greatest reduction of 84% in FDA activity after heat stress.
Application of nanomaterials showed 24–40% lower MBC than the control on 0 d, while there was no significant difference between the various levels of each nanomaterial used in the experiment. Comparable values were obtained with both the levels of ZnT2 (158.42 µg g−1 dry soil) and T3 (161.36 µg g−1 dry soil). A similar trend was also found with different Fe levels in T4 (145.47 µg g−1 dry soil) and T5 (142.81 µg g−1 dry soil).
Resistance indices of dehydrogenase activity against heat stress showed that T3gave the greatest stress resistance (Table 1), with an index rating of 0.70. The control had a greater resistance index with respect to ACP activity. Resistance indices varied from as low as 0.25 in the control treatment to as much as 0.73 in T3 (Table 1). Although all the treatments varied in terms of the response of AKP activity in the soil, the resistance indices showed a wide variation in terms of the materials used and their concentrations. Resistance index value for AKP ranged from 0.30 in the control to 0.66 in T2 (Table 1). Comparable resistance indices were obtained at the concentrations of nano-Fe in bothT4(0.49) and (T5) 0.52. Stress of high temperature, as in our experiment, drastically reduced the activity of AKP activity. With respect to resistance of FDA activity against heat stress, it was observed that the T2and T4 treatments showed the greatest stress resistance, with index ratings of 0.48 and 0.43, respectively (Table 1). With respect to resistance indices of MBC against heat stress, it was observed that the T5 treatment showed the greatest stress resistance, with an index rating of 0.69, which was statistically comparable to those of T3 (0.68) and T4 (0.67) (Table 1).

Table 1.
Resistance indices of dehydrogenase (DHA), acid phosphatase (ACP) activity, alkaline phosphatase (AKP) activity, fluorescein diacetate activity (FDA), and microbial biomass carbon (MBC) (mean ± standard error of mean) in soil after heat stress (48 °C for 24 hours) under various doses of nanomaterials.
The resilience index showed that the rate of recovery of the DHA was initially rapid (0.32 at 28 d) in the control and then decreased at 70 d (−0.36) after incubation (Table 2). Resilience index ratings at 90 d were 0.21 for T2, 0.19 for T3, 0.02 for T4, and 0.03 for T5. For ACP, application of nano-Zn showed a resilience index of 0.39 at 10 mg kg−1 and 0.40 at 40 mg kg−1 nano-Zn concentration. Although the recovery of ACP activity in the control was faster during the initial incubation (up to 56 d), the trend reversed after 70 d (−0.08) and 90 d (−0.05) of incubation (Table 2). Recovery of AKP was clearly observed after 90 d, with the higher resilience index being observed in T2 (0.51) and lowest being in T1 (0.03). It was interesting to observe that the extent of recovery in the treatmentsT2 to T5 were lower during the initial incubation period up to 56 d (−0.05 to −0.43), but started recovering well after 70 d (0.07 to 0.49) and 90 d (0.16 to 0.51) of incubation (Table 2). Recovery of FDA activity following heat stress was clearly observed as early as 14 DAI in all the treatments including the control. This trend was maintained throughout the incubation period except in the control, where there was a slight decline in the recovery at 90 DAI. It was observed that all the treatments supplied with nanomaterials showed a statistically similar resilience of FDA against the heat stress after 90 d (Table 2). Although the control treatment showed a higher resilience index up to 56 d, there was sharp decline in the resilience indices after 70 d (−0.20) and 90 d (−0.01). Recovery rate of MBC showed a similar pattern as the enzymatic activity. Although the resilience indices were lower during the first 56 d, the recovery indices were highest after 90 d of incubation. T3 and T5had the greatest stress resilience, with index ratings of 0.28 and 0.29, respectively, after 90 d of incubation (Table 2).
Table 2.
Resilience indices of dehydrogenase activity (DHA), acid phosphatase (ACP) activity, alkaline phosphatase (AKP) activity, fluorescein diacetate activity (FDA), and microbial biomass carbon (MBC) (mean ± standard error of mean) in soil after heat stress (48 °C for 24 h) under various doses of nanomaterials.
3.3. Microbial Counts
Exposure to higher temperature caused a sharp decline in the Actinobacteria count after 1 d of stress (T2: 12.33 × 10⁵ colony forming unit (cfu) g−1 soil; T3: 12.66 × 10⁵ cfu g−1 soil, T4: 20 × 105 cfu g−1 soil, and T5: 18 × 105 cfu g−1 soil). At 0 d, the density of the fungal population ranged from 17× 104 to 24 × 104 cfu g−1 soils. Data showed that the fungal count with the T4 (23.67 × 10⁴ cfu g−1) treatment was significantly (p < 0.05) higher than the other treatments (Figure 6). Exposure to higher temperature (48 °C in this study) revealed a steep decrease in the fungal population after 1 d of heat stress. The abundance of Pseudomonas was also significantly (p < 0.05) affected by the application of nanomaterials. Data showed that T2 (28 × 104 cfu g−1) and T3 (24.33 × 10⁴ cfu g−1) treatments were similar (p < 0.05) in terms of the Pseudomonas population, while the data obtained from T4 (18.33 × 10⁴ cfu g−1) and T5 (14.33 × 10⁴ cfu g−1) were statistically significantly different. Analysis of the data revealed a Pseudomonas reduction of 42% in T2 (nano-Zn @ 10 mg kg−1)-treated soil to 45% with nano-Fe @ 10 mg kg−1 (T4). Higher concentration of metal-oxide nanoparticles (T3 and T5) caused a sharp reduction of 30 and 87%, respectively, in the population of Pseudomonas (Figure 6). Azotobacter population was found to be around 31% lower in treatments supplemented with Zn nanomaterials. The abundance of Azotobacter was highest in T5 (12.67 × 10⁴ cfu g−1 soil), followed by T4 (12 × 104 cfu g−1 soil), T1 (control: 11.33 × 10⁴ cfu g−1 soil), T2 (nano-Zn@ 10 mg kg−1: 8.67 × 10⁴ cfu g−1 soil), and T3 (nano-Zn@ 40 mg kg−1: 8.67 × 10⁴ cfu g−1 soil); however, statistical comparison revealed that the doses of nanomaterial were not affecting the Azotobacter count in soils (Figure 6).
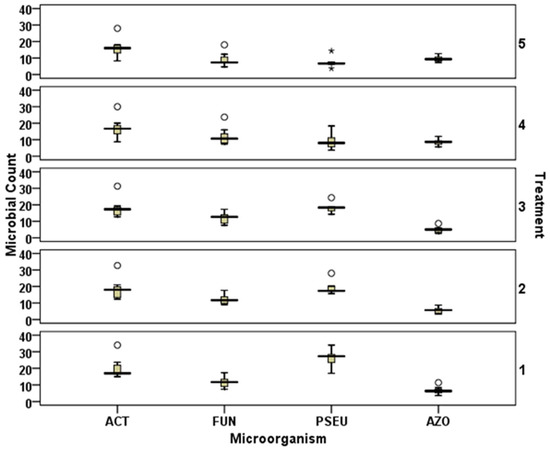
Figure 6.
Effect of heat stress on Actinobacteria (ACT) (×105 colony forming unit (cfu) g−1 dry soil), fungal (FUN) (×104 cfu g−1 dry soil), Pseudomonas (PSEU) (×104 cfu g−1 dry soil), and Azotobacter (AZO) (×104 cfu g−1 dry soil) counts (secondary Y-axis indicates the treatments 1–5; i.e., T1 to T5). The circle represents the values one and half times less than inter-quartile range and asterisks represents the values one and half times more than inter-quartile range. Bars represents the maximum and minimum value.
Data on the resistance index of Actinobacteria revealed that T4 had the higher index rating of 0.50, followed by T5 (0.47), T3 (0.25), and T2 (0.23). Fungi bear a greater capacity to withstand temperature stress under the application of nano-Fe (both at 10 and 40 mg kg−1). Resistance indices varied from as low as in the control (T1:0.27) to as much as in T5 (0.52). Resistance index of T2 and T3were found to be 0.39 and 0.28, respectively (Table 3). For Pseudomonas, the resistance index was 0.44 in the control (T1) treatment, 0.54 in T2, 0.62 in T3, 0.53 in T4, and 0.37 in T5. Studies on resistance of Azotobacter against heat stress revealed that heat stress produced a reduction in the population of Azotobacter in all the treatments. The magnitude of decline in the population of Azotobacter was higher in the control, as reflected by its lower resistance index rating of 0.26 as compared to other treatments. Application of nano-Fe@ 40 mg kg−1 (T5) showed a resistance index rating of 0.65, which was statistically significant in comparison to other treatments (Table 3).
Table 3.
Resistance indices of Actinobacteria, fungi, Pseudomonas, and Azotobacter (mean ± standard error of mean)in soil after heat stress (48 °C for 24 hours) under various doses of nanomaterials.
Recovery from heat stress by Actinobacteria was clearly observed with nano-Fe (at both doses: 10 and 40 mg kg−1) 90 DAI. Recovery rate of Actinobacteria showed that the resilience index was positive with the application of nano-Fe after 90 DAI (0.36 in T4 and 0.33 in T5). Recovery with the addition of Zn nanoparticles followed the same pattern as that of the control after 90 d (Table 4). The recovery rate showed a positive value in all the three treatments (T1, T2, and T3) up to 56 d (0.02–0.27), but there was a decline in those indices (−0.03 for T1, −0.04 for T2, and −0.03 for T3) on 90 DAI. Resilience pattern of fungal population in fertilized treatment showed a positive value in T2, T4, and T5after 90 d, reflecting the possibility of recovery after the stress (Table 4). Although it is not as close to +1, there are chances that the fungal population will withstand the higher temperature in the future. Resilience index was higher in the T5 (nano-Fe @ 40 mg kg−1) treatment, with an index rating of 0.40. Recovery after heat stress by Pseudomonas was clearly observed 90 DAI. The rate of such a recovery of Pseudomonas was in the order T4 > T3 > T5 > T2> T1 at p< 0.05. T4showed the higher resilience index rating of 0.43, followed by T3 (0.24) and T5 (0.23) (Table 4).
Table 4.
Resilience indices of Actinobacteria, fungi, Pseudomonas, and Azotobacter (mean ± standard error of mean) in soil after heat stress (48 °C for 24 hours) under various doses of nanomaterials.
Regarding the resilience of Azotobacter, it was observed that the T5 (nano-Fe@ 40 mg kg−1) treatment had the highest resilience (0.33) of all the treatments at 90 d of incubation.
3.4. Microbial Correlations
Correlation studies signify the role of interaction between Actinobacteria, Azotobacter, and fungi for fabricating the resistance against heat stress (Table 5). It is clear that Actinobacteria had a positive and highly significant correlation with Azotobacter (r = 0.904, p < 0.01), and even the fungi are well correlated with Azotobacter (r = 0.937, p < 0.01). Recovery of the microorganism and soil enzymes can be attributed to the predominant role of Actinobacteria interacting with fungi (r = 0.869, p < 0.01), Pseudomonas (r = 0.422, p < 0.05), and Azotobacter (r = 0.516, p < 0.01) (Table 5).
Table 5.
Pearson correlation matrix among enzyme activity, microbial biomass carbon, and microbial population, considering the data of the resistance indices calculated following the first day of stress and the resilience indices calculated over the whole period of the study.
4. Discussion
The response of microbial populations and associated enzymes to exogenous stimuli (nano-Fe and -Zn application) is a promising field of study globally, and this experiment was designed to evaluate the impact of synthetic nanomaterials on the buffering of biological activity after heat stress, despite their current application as a smart delivery system for controlled-release formulations [24].
The overall soil DHA, an oxidoreductase enzyme, transfers protons and electrons from substrates to acceptors, is a fundamental part of the enzyme system of all living soil microorganisms and reflects the oxidative capacities of microbes. Results revealed that the metal-oxide nanomaterials confer higher microbial resistance in lower concentrations than with higher concentrations. Heavy metals interact with the enzyme–substrate complex or with the protein active groups and thereby reduce enzyme activity by denaturing the enzyme protein [25]. There was 30% and 12.5% reduction in the DHA at a Zn concentration of 50 mg kg−1 [26] and nano-ZnO applied at the rate of 1000 mg kg−1, respectively [27]. Additionally, higher Fe2O3 concentration acts as an alternate electron acceptor to hydrogen, due to which the dehydrogenase activity might have fallen down, hence exhibiting lower resistance. From the enzymatic data on resilience, it is clear that the treatments of nano-Zn@10 mg kg−1 slowly recovered after disturbance, but that rate of recovery was much higher after 90 d. The interaction of enzymes with soil colloids governs the resistance of enzymes and resilience being controlled by those organisms that survived in the later stages after heat stress and were capable of producing new enzymes [16]. Phosphatases are a broad group of enzymes that hydrolyze esters and anhydrides of phosphoric acid and provide P for plant uptake by releasing PO43- from immobile organic P. The ACP was much lower than AKP irrespective of the treatments, which may be due to the alkaline reaction of the soil as reported by soil pH. There are studies that reported elevated phosphatase enzyme activities as a result of metals present in the soil that serve as the cofactors or activators. However, addition of nanomaterials resulted in lower rather than higher enzyme activities after the stress, probably by denaturing the protein, forming a complex with the substrate, or by reacting with the enzyme substrate complex [28]. However, after having conducted the analysis in the subsequent interval, it is clear that the nanomaterials or the soil themselves are not activating the enzymes studied and something else might be responsible for the partial recovery of phosphatase activities as observed in the soil samples [29]. However, experimental data obtained in the laboratory may not fully reflect what happens in soil, being a heterogeneous unit. Resistance index for most of the cases indicated that introduction of nanomaterials (Fe and Zn) provided higher resistance with respect to control soil. Adsorption of free enzymes onto nano-ZnO and -Fe2O3 materials (nano-Fe and -Zn) provided higher thermal stability and hydrolytic stability [30], and therefore providing better resistance when subjected to heat stress. Enhanced thermal stability of enzymes after adsorption might be attributed to the loss of its conformational flexibility [31], as the immobilized enzyme becomes stiff and maintains its stability at higher temperature [32]. The stability of immobilized enzyme is proportional to the ratio of physical adsorption between the enzyme and the support, which lock the enzyme into the active conformation [33]. The FDA hydrolysis in soils represents the activity of a group of enzymes including proteases, lipases, and esterases [19]. In this study, addition of nanomaterials either at 10 or 40 mg kg−1 did not have much effect on the resistance index (0.48 and 0.43 for nano-Zn@ 10 mg kg−1 and nano-Fe@ 10 mg kg−1, respectively). However, inhibition of the hydrolyzing capacity of FDA may be ascribed to the changes in the molecular structure. Previous reports confirm the probable reaction with sulfhydryl group of enzymes and formation of metal sulfides thereby inactivating the enzyme activity [34]. Lack of resilience of FDA up to 56 d in soil suggests that the addition of nanomaterials caused a temporal reduction in microbial diversity. However, it attains a resilience value ranging from 0.12 to 0.16 after 90 d of incubation. In general, exogenous application of nanomaterials (Zn and Fe) causes a decline in soil enzymatic activities with respect to control soil due to higher adsorption of extracellular free enzymes onto surface of nanomaterials (Fe and Zn). Higher application dose (40 mg kg−1) resulted in greater decline in enzymatic activity with respect to the lower application dose (10 mg kg−1), which may be attributed to higher specific surface area resulting in higher adsorption. The Fe nanoparticles caused greater decline in enzymatic activity as compared to Zn at the same application dose, owing to the smaller particle size of the former (40–50 nm) (Figure 1 and Figure 2) with respect to the latter (50–60 nm) (Figure 1 and Figure 2), causing more desorption of free enzymes.
Soil MBC implies the soil microbial population and can be used as an indicator to evaluate the impact of stress on microorganisms and associated enzymes in soils [35]. Exposure to higher temperature causes shock, cytoplasm leakage, and lysis of the microorganisms. Zn has also been validated to reduce the size of the soil microbial biomass [36]. The role of extracellular polymeric substances (EPS), a high-molecular-weight mixture of polymers, in trapping the nanoparticles outside the cells exhibiting resistance to toxicity is well explained [37,38]. Previous data indicates that the reduction of microbial biomass with nano-Fe was primarily due to reduced Gram-negative bacteria, which include Pseudomonas [7]. When taken collectively, the results of the current study clearly indicate that the impact of nanoparticles on microbial population may be dependent on the heat stress applied rather than the properties of soil. Nevertheless, there is the possibility that these materials undergo chemical transformations such as oxidation, ionization, etc. [39], but their assessment on microbial populations strongly confirms an initial sharp decrease. Environmental parameters may largely influence the rate of chemical transformation of nanoparticles, and depending on whether the microbial toxicity of nanoparticles is through direct or indirect interaction with the cells, the fate determines the impact of nanoparticles on the soil microbial community [40]. Fe is an essential nutrient for almost all microorganisms as it is a cofactor for a large number of enzymes that play an important role in many biochemical reactions, including respiration and DNA synthesis. Microorganisms employ various Fe uptake mechanisms to ensure sufficient supplies from their surroundings [41]. Resilience in the count of microorganisms in nano-Fe-treated soil reflected that Fe possibly took part in the metabolic reactions and provided beneficial nutrients essential for the growth of some microbes in soil. Few studies have confirmed the role of ROS in imparting the toxicity effect of Fe-based nanoparticles. The Fe2O3 nanoparticles are highly stable in the environment, and thus have a lower capacity to generate oxidative stress. Therefore, the decline in cultivable population during the early stage can only be attributed to the exposure of soil to higher temperature. Studies with nano-zero-valent Fe induces modification of the soil microbial community [7], including bacterial and fungal populations in the short term (less than 4 months), but our study contradicts the related decrease with nano-Fe over the 90-d study period. This might be due to the fact that Fe-nanoparticles stimulated the population of several bacteria related to Actinobacteria, such as Duganella, Streptomycetaceae, or Nocardioides, and suggests the improved resistance and resilience of microorganisms reported in this study [42]. Pseudomonas has a specific mechanism to form resting spores to overcome abiotic stress such as heat [43]. Thus, they possess higher resistance value than Azotobacter and Actinobacteria. Griffiths et al. [44] suggested that functional resistance of P. fluorescens in different soils in response to heat stress ranged from 10–68% as compared to the unstressed control. Research has confirmed that nano-zero-valent Fe exerts a selective pressure on the microbial community [45], promoting the dominance of some microbial groups (Archaea, α-Proteobacteria, and low G+C Gram-positive bacteria) or the decrease of other ones (β- and γ-Proteobacteria and subclasses). Azotobacter is a typical mesophilic bacterium for which the optimum temperature for growth ranges between 25–30 °C; however, the minimum temperature for Azotobacter growth evidently lies a little above 0 °C. Vegetative Azotobacter cells cannot tolerate high temperatures, and if kept at 55–60 °C, they degenerate and die [46]. Azotobacter cysts are generally produced in the late stationary phase or upon induction of vegetative cells with specific reagents [47], which confirms the resilience of the population as observed after 90 d of incubation. Production of the late embryogenesis abundant (LEA) proteins might have played an important role in shielding the proteins and enzymes of Azotobacter cells under high-temperature stress [48] and hence recovery thereafter. Other proposed defense mechanisms include trehalose and heat shock proteins (HSPs) that act at high temperatures by preventing protein aggregation, unfolding aggregated proteins, or targeting denatured proteins for degradation [49]. Heat tolerance is known to be key to fungal survival in stressed soil, and a recent report confirmed the role of pyruvate in the scavenging of heat-induced ROS: the α-keto-carboxylate structure in pyruvate neutralizes peroxides by reducing them to their conjugate alcohols, along with the decomposition of pyruvate into acetate and CO2 [50].
Our correlation studies showed a number of interactions of Actinobacteria with other microorganisms which drive the resistance and resilience of the experimental soil. These interactions ecologically improved the fitness of soils to resist the stress through mechanisms such as producing some specific genes linked to cell–cell interaction, affecting changes in the metabolic mechanisms and thereby producing the resistance and resilience against the stress [51]. Interaction of Azotobacter and fungi leads to the increased growth of fungi through signaling secondary metabolites produced by Azotobacter, responsible for combating the stresses [52]. Although this kind of interaction is known to occur in the rhizosphere region, the exact nature of the molecular interaction is yet to be elucidated.
In summary, our results show that the presence of either nanomaterials or the exposure to heat stress decreased the soil enzymatic activities as well as the microbial counts. Soil enzymatic activities studied in the current experiment clearly reflected the explicit role of Zn nanomaterials in improving its resistance as well as resilience after 90 d of the experiment. The pattern of microbial counts varied over the study period, and Fe nanomaterial was found to aid the recovery of organisms 90 d after heat stress. The erratic pattern observed in the biological parameters indicated that nanomaterials might hamper these enzymes or microbial count in its initial segment of incubation, but that they do have the competency to recover within 90 d, as observed in the current study. Since the present scope of study was limited to investigations carried out under controlled laboratory conditions, we acknowledge that the actual scenario may be different under the field situation, where apart from varying climatic factors, several other factors may also interact in a complex way. Further, it is necessary to conduct additional investigation of the long-term effects of nanoparticles before drawing a comprehensive conclusion about the effects of nanoparticles on the soil microbial ecosystem.
Author Contributions
Conceptualization, R.R.; Methodology, A.K., N.M. and S.A.; Formal Analysis, A.D.; Writing-Original Draft Preparation, R.R.; Writing-Review & Editing, A.B. and A.D.
Funding
This research received no external funding.
Acknowledgments
Authors are thankful to the Vice Chancellor, Bihar Agricultural University (BAU), Bhagalpur, Bihar, India, for providing necessary facilities, and the Director of Research, BAU, for his support and critical suggestions. Special thanks are given to the scientists associated with All India Coordinated Research Project-Integrated Farming System, Sabour unit, and North Carolina A&T State University, USA. Authors are thankful for the contribution made by V.K. Barnwal, Principal Scientist, Plant Virology Unit, Division of Plant Pathology, IARI, New Delhi, in providing the TEM images for the synthesized nanomaterials. Sincere thanks are given to S.C. Datta, Principal Scientist, Division of Soil Science and Agricultural Chemistry, IARI, New Delhi, for providing the necessary facilities for obtaining the XRD images of the materials.
Conflicts of Interest
The authors declare no conflict of interest.
References
- Wang, Z.; Lee, Y.H.; Wu, B.; Horst, A.; Kang, Y.; Tang, Y.J.; Chen, D.R. Anti-microbial activities of aerosolized transition metal oxide nanoparticles. Chemosphere 2010, 80, 525–529. [Google Scholar] [CrossRef] [PubMed]
- Tourinho, P.S.; van Gestel, C.A.; Lofts, S.; Svendsen, C.; Soares, A.M.; Loureiro, S. Metal-based nanoparticles in soil: Fate, behavior, and effects on soil invertebrates. Environ. Toxicol. Chem. 2012, 31, 1679–1692. [Google Scholar] [CrossRef]
- Dinesh, R.; Anandaraj, M.; Srinivasan, V.; Hamza, S. Engineered nanoparticles in the soil and their potential implications to microbial activity. Geoderma 2012, 173, 19–27. [Google Scholar] [CrossRef]
- Jiang, W.; Mashayekhi, H.; Xing, B. Bacterial toxicity comparison between nano-and micro-scaled oxide particles. Environ. Pollut. 2009, 157, 1619–1625. [Google Scholar] [CrossRef] [PubMed]
- Dimkpa, C.O.; Calder, A.; Britt, D.W.; McLean, J.E.; Anderson, A.J. Responses of a soil bacterium, Pseudomonas chlororaphis O6 to commercial metal oxide nanoparticles compared with responses to metal ions. Environ. Pollut. 2011, 159, 1749–1756. [Google Scholar] [CrossRef] [PubMed]
- Xia, T.; Kovochich, M.; Liong, M.; Madler, L.; Gilbert, B.; Shi, H.; Yeh, J.I.; Zink, J.I.; Nel, A.E. Comparison of the mechanism of toxicity of zinc oxide and cerium oxide nanoparticles based on dissolution and oxidative stress properties. ACS Nano 2008, 2, 2121–2134. [Google Scholar] [CrossRef] [PubMed]
- Pawlett, M.; Ritz, K.; Dorey, R.A.; Rocks, S.; Ramsden, J.; Harris, J.A. The impact of zero-valent iron nanoparticles upon soil microbial communities is context dependent. Environ. Sci. Pollut. Res. 2013, 20, 1041–1049. [Google Scholar] [CrossRef]
- Cullen, L.G.; Tilston, E.L.; Mitchell, G.R.; Collins, C.D.; Shaw, L.J. Assessing the impact of nano- and micro-scale zerovalent iron particles on soil microbial activities: Particle reactivity interferes with assay conditions and interpretation of genuine microbial effects. Chemosphere 2011, 82, 1675–1682. [Google Scholar] [CrossRef]
- Rakshit, R.; Patra, A.K.; Pal, D.; Kumar, M.; Singh, R. Effect of elevated CO2 and temperature on nitrogen dynamics and microbial activity during wheat (Triticum aestivum L.) growth on a subtropical Inceptisol in India. J. Agron. Crop Sci. 2012, 198, 452–465. [Google Scholar] [CrossRef]
- Pimm, S.L. The complexity and the stability of ecosystems. Nature 1984, 307, 321–326. [Google Scholar] [CrossRef]
- Griffiths, B.S.; Bonkowski, M.; Roy, J.; Ritz, K. Functional stability, substrate utilisation and biological indicators of soils following environmental impacts. Appl. Soil Ecol. 2001, 16, 49–61. [Google Scholar] [CrossRef]
- Aneesh, P.M.; Vanaja, K.A.; Jayaraj, M.K. Synthesis of ZnO nanoparticles by hydrothermal method. Nanophotonic Materials IV, edited by Zeno Gaburro, Stefano Cabrini. Proc. SPIE 2007, 6639, 66390J. [Google Scholar] [CrossRef]
- Shah, M.A.; Shah, K.A. Nanotechnology: The Science of Small; The Wiley India Pvt. Ltd.: Noida, India, 2013; p. 167. [Google Scholar]
- Hubbard, C.R. National Bureau of Standards Monograph 25 Section 18-Data for 58 Substances Nat. Bur. Stand. (U.S.), Monogr. 25–Sec. 18; International Centre for Diffraction Data: Newtown Square, PA, USA, 1981. [Google Scholar]
- Hall, B.D.; Zanchet, D.; Ugarte, D. Estimating nanoparticle size from diffraction measurements. J. Appl.Crystallogr. 2000, 33, 121–132. [Google Scholar] [CrossRef]
- Kumar, S.; Patra, A.K.; Singh, D.; Purakayastha, T.J. Long-term chemical fertilization along with farmyard manure enhances resistance and resilience of soil microbial activity against heat stress. J. Agron. Crop Sci. 2014, 200, 156–162. [Google Scholar] [CrossRef]
- Klein, D.A.; Loh, T.C.; Goulding, R.L. A rapid procedure to evaluate dehydrogenase activity of soils low in organic matter. Soil Biol. Biochem. 1971, 3, 385–387. [Google Scholar] [CrossRef]
- Tabatabai, M.A.; Bremner, J.M. Use of p-nitrophenyl phosphate for assay of soil phosphatase activity. Soil Biol. Biochem. 1969, 1, 301–307. [Google Scholar] [CrossRef]
- Green, V.S.; Stott, D.E.; Diack, M. Assay for fluorescein diacetate hydrolytic activity: Optimization for soil samples. Soil Biol. Biochem. 2006, 38, 693–701. [Google Scholar] [CrossRef]
- Vance, E.D.; Brookes, P.C.; Jenkinson, D.S. An extraction method for measuring soil microbial biomass C. Soil Biol. Biochem. 1987, 19, 703–707. [Google Scholar] [CrossRef]
- Chhonkar, P.K.; Bhadraray, S.; Patra, A.K.; Purakayastha, T.J. Experiments in Soil Biology and Biochemistry; Westville: New Delhi, India, 2007. [Google Scholar]
- Orwin, K.H.; Wardle, D.A. New indices for quantifying the resistance and resilience of soil biota to exogenous disturbances. Soil Biol. Biochem. 2004, 36, 1907–1912. [Google Scholar] [CrossRef]
- Gomez, K.A.; Gomez, A.A. Statistical Procedures for Agricultural Research; John Wiley and Sons: New York, NY, USA, 1984. [Google Scholar]
- Mandal, N.; Datta, S.C.; Manjaiah, K.M.; Dwivedi, B.S.; Kumar, R.; Aggarwal, P. Zincated nanoclay polymer composites (ZNCPCs): Synthesis, characterization, biodegradation and controlled release behaviour in soil. Polym. Plast. Technol. Eng. 2018, 57, 1760–1770. [Google Scholar] [CrossRef]
- Pan, J.; Yu, L. Effects of Cd or/and Pb on Soil Enzyme Activities and Microbial Community Structure. Ecol. Eng. 2011, 37, 1889–1894. [Google Scholar] [CrossRef]
- Wyszkowska, J.; Kucharski, J.; Lajszner, W. The effect of copper on soil biochemical properties and its interaction with other heavy metals. Pol. J. Environ. Stud. 2006, 15, 927–934. [Google Scholar]
- Kim, S.; Sin, H.; Lee, S.; Lee, I. Influence of metal oxide particles on soil enzyme activity and bioaccumulation of two plants. J. Microbiol. Biotechnol. 2013, 23, 1279–1286. [Google Scholar] [CrossRef]
- Hemida, S.K.; Omar, S.A.; Abdel-Mallek, A.Y. Microbial populations and enzyme activities in soil treated with heavy metals. Water Air Soil Pollut. 1997, 95, 13–22. [Google Scholar] [CrossRef]
- Hagmann, D.F.; Goodey, N.M.; Mathieu, C.; Evans, J.; Aronson, M.F.J.; Gallagher, F.; Krumins, J.A. Effect of metal contamination on microbial enzymatic activity in soil. Soil Biol. Biochem. 2015, 91, 291–297. [Google Scholar] [CrossRef]
- Bayramoglu, G.; Yalc, E.; Arıca, M.Y. Immobilization of urease via adsorption into I-histidine- Ni (II) complexed poly (HEMA-MAH) microspheres: Preparation and characterization. Process Biochem. 2005, 40, 3505–3513. [Google Scholar] [CrossRef]
- Busto, M.D. An experiment illustrating the effect of immobilization on enzyme properties. Biochem. Educ. 1998, 26, 304–308. [Google Scholar] [CrossRef]
- Rahman, M.B.A.; Zaidan, U.H.; Basri, M.; Hussein, M.Z.; Rahman, R.N.Z.R.A.; Salleh, A.B. Enzymatic synthesis of methyl adipate ester using lipase from Canidarugosa immobilized on Mg, Zn and Ni of layered double hydroxides. J. Mol. Catal. B Enzym. 2008, 50, 33–39. [Google Scholar] [CrossRef]
- Lenders, J.P.; Germain, P.; Crichton, R.R. Immobilization of a soluble chemically thermostabilized enzyme. Biotechnol. Bioeng. 1985, 27, 572–578. [Google Scholar] [CrossRef]
- Du, W.; Sun, Y.; Ji, R.; Zhu, J.; Wu, J.; Guo, H. TiO2 and ZnO nanoparticles negatively affect wheat growth and soil enzyme activities in agricultural soil. J. Environ. Monit. 2011, 13, 822–828. [Google Scholar] [CrossRef]
- Brookes, P.C. The use of microbial parameters in monitoring soil pollution by heavy metals. Biol. Fertil. Soils 1995, 19, 269–279. [Google Scholar] [CrossRef]
- Renella, G.; Chaudri, A.M.; Brookes, P.C. Fresh additions of heavy metals do not model long-term effects on microbial biomass and activity. Soil Biol. Biochem. 2002, 34, 121–124. [Google Scholar] [CrossRef]
- Hong, Z.; Chen, W.; Rong, X.; Cai, P.; Dai, K.; Huang, Q. The effect of extracellular polymeric substances on the adhesion of bacteria to clay minerals and goethite. Chem. Geol. 2013, 60, 118–125. [Google Scholar] [CrossRef]
- Joshi, N.; Ngwenya, B.T.; French, C.E. Enhanced resistance to nanoparticles toxicity is conferred by overproduction of extracellular polymeric substances. J. Hazard. Mater. 2012, 241, 363–370. [Google Scholar] [CrossRef]
- Colman, B.P.; Arnaout, C.L.; Anciaux, S.; Gunsch, C.K.; Hochella, M.F., Jr.; Kim, B.; Lowry, G.V.; McGill, B.M.; Reinsch, B.C.; Richardson, C.J.; et al. Low concentrations of silver nanoparticles in biosolids cause adverse ecosystem responses under realistic field scenario. PLoS ONE 2013, 8, e57189. [Google Scholar] [CrossRef] [PubMed]
- Reidy, B.; Haase, A.; Luch, A.; Dawson, K.A.; Lynch, I. Mechanism of silver nanoparticle release, transformation and toxicity: A critical review of current knowledge and recommendations for future studies and applications. Materials 2013, 6, 2295–2350. [Google Scholar] [CrossRef] [PubMed]
- Hantke, K. Iron and metal regulation in bacteria. Curr. Opin. Microbiol. 2001, 4, 172–177. [Google Scholar] [CrossRef]
- He, S.; Feng, Y.; Ren, H.; Zhang, Y.; Gu, N.; Lin, X. The impact of iron oxide magnetic nanoparticles on the soil bacterial community. J. Soils Sediments 2011, 11, 1408–1417. [Google Scholar] [CrossRef]
- Griffiths, B.S.; Philippot, L. Insights into the resistance and resilience of the soil microbial community. FEMS Microbiol. Rev. 2013, 37, 112–129. [Google Scholar] [CrossRef]
- Griffiths, B.S.; Hallett, P.D.; Kuan, H.L.; Gregory, A.S.; Watts, C.W.; Whitmore, A.P. Functional resilience of soil microbial communities depends on both soil structure and microbial community composition. Biol. Fertil. Soils 2008, 44, 745–754. [Google Scholar] [CrossRef]
- Fajardo, C.; Ortı´z, L.T.; Rodríguez-Membibre, M.L.; Nande, M.; Lobo, M.C.; Martin, M. Assessing the impact of zero-valent iron (ZVI) nanotechnology on soil microbial structure and functionality: A molecular approach. Chemosphere 2012, 86, 802–808. [Google Scholar] [CrossRef]
- Hogg, S. Essential Microbiology; John Wiley and Sons Ltd.: Mangester, UK, 2005. [Google Scholar]
- Sutherland, I.W. Biosynthesis and composition of gram-negative bacterial extracellular and wall polysaccharides. Annu. Rev. Microbiol. 1985, 39, 243–270. [Google Scholar] [CrossRef]
- Rodriguez-Salazar, J.; Moreno, S.; Espin, G. LEA proteins are involved in cyst desiccation resistance and other abiotic stresses in Azotobactervinelandii. Cell Stress Chaperons 2017, 22, 397–408. [Google Scholar] [CrossRef] [PubMed]
- Verghese, J.; Abrams, J.; Wang, Y.; Morano, K.A. Biology of the heat shock response and protein chaperones: Budding yeast (Saccharomyces cerevisiae) as a model system. Microbiol. Mol. Biol. Rev. 2012, 76, 115–158. [Google Scholar] [CrossRef] [PubMed]
- Zhang, X.; St Leger, R.J.; Fang, W. Pyruvate accumulation is the first line of cell defense against heat stress in a fungus. mBio 2017, 8, e01284-17. [Google Scholar] [CrossRef] [PubMed]
- Deveau, A.; Barret, M.; Diedhiou, A.G.; Leveau, J.; de Boer, W.; Martin, F.; Sarniguet, A.; Frey-Klett, P. Pairwise transcriptomic analysis of the interactions between the ectomycorrhizal fungus Laccaria bicolor S238N and three beneficial, neutral and antagonistic soil bacteria. Microb. Ecol. 2015, 69, 146–159. [Google Scholar] [CrossRef] [PubMed]
- Bhuyan, S.K.; Bandyopadhyay, P.; Kumar, P.; Mishra, D.K.; Prasad, R.; Kumari, A.; Upadhyaya, K.C.; Varma, A.; Yadava, P.K. Interaction of Piriformospora indica with Azotobacter chroococcum. Sci. Rep. 2015, 5, 13911. [Google Scholar] [CrossRef]
© 2019 by the authors. Licensee MDPI, Basel, Switzerland. This article is an open access article distributed under the terms and conditions of the Creative Commons Attribution (CC BY) license (http://creativecommons.org/licenses/by/4.0/).