Article

Environmental and Economic Life Cycle Analysis of Primary Construction Materials Sourcing under Geopolitical Uncertainties: A Case Study of Qatar

by
Shaikha Al-Nuaimi
1,
Abdul-Aziz A. Banawi
2 and
Sami G. Al-Ghamdi
1,*
1
Division of Sustainable Development, College of Science and Engineering, Hamad Bin Khalifa University, Qatar Foundation, Doha, Qatar
2
Department of Construction Management & Engineering, College of Engineering, North Dakota State University, Fargo, ND 58102, USA
*
Author to whom correspondence should be addressed.
Sustainability 2019, 11(21), 6000; https://doi.org/10.3390/su11216000
Submission received: 3 September 2019 / Revised: 10 October 2019 / Accepted: 13 October 2019 / Published: 28 October 2019
(This article belongs to the Section Environmental Sustainability and Applications)

Abstract

:
Environmental and economic cycles under varying geopolitical uncertainties can lead to unsustainable patterns that significantly and negatively affect the welfare of nations. With the ever-increasing negative environmental and economic impacts, the ability to achieve sustainability is hindered if the implications are not properly assessed in challenging geopolitical crises. The infrequent and fluctuating nature of these challenging geopolitical settings causes disregard and neglect for exploration within this issue. In this study, a comparative life cycle assessment was conducted as a method to evaluate the environmental and economic impacts of construction material flow across country boundaries. Based on the results found from the life cycle assessment, an environmental forecast and sensitivity analysis were established. Considering the State of Qatar as a case study, asphalt and bitumen, cement, limestone, sand, and steel were analyzed from gate-to-gate depending on transportation mode and distances used within both the pre-crisis and post-crisis sub-periods, comparing carbon emissions and costs. The results showed that the mode of transport plays a significant role in terms of carbon dioxide emissions as opposed to distance traveled. However, the increase in distance coupled to the majority shift from land to sea-based transport resulted in an overall increase in carbon emissions and costs post-crisis. In addition, the analysis of the environmental and economic impact assessment using the average CO2 equivalent (CO2-e) per kilogram and the unit price of the five primary construction materials has shown a significant, 70.68% increase in global warming potentials (GWP) after the crisis, coupled with an increase in the overall cost. An assessment of environmental and economic impacts during geopolitical uncertainties allows for the significant ability to realize sustainable measures to greatly reduce economic and environmental degradation.

1. Introduction

In global economics, countries interact with one another in an assortment of ways. Developing countries tend to be active in the areas of exporting and importing to keep pace with developed nations and to provide a better standard of living for their citizens. However, many developmental interruptions may occur. The construction industry in Qatar is dependent on foreign imports [1], and the country is also surrounded by a gulf and maintains a single land neighbor. As such, on account of geopolitical uncertainty, it is at constant risk of sudden changes within importing supply routes. A disruption in the supply chain of a certain type of commodity may require an immediate change in plans and actions to maintain the country’s growth and stability. Changes in a supply chain can occur on account of geopolitical changes, which can have an impact on the country’s economic and environmental aspects [2]; therefore, these aspects should be considered, and a country should take appropriate action to maintain its development. Sustainable supply chain management (SCM) aims to mitigate environmental and economic risks as well as to enhance the overall ecological efficiency of certain practices within a shared production system [3].
This study aims to analyze the environmental and economic impacts related to changes in supply chains. This study focused on changes in supply chains caused by the geopolitical uncertainties by taking the State of Qatar as a case study. This provides an opportunity to obtain real-time data to identify and quantify environmental impacts and compare costs before and after exposure to the geopolitical challenges. The study emphasizes the importance of maintaining a resilient supply chain network in the market while considering the associated environmental and economic burdens. The study starts with a literature review on subjects regarding uncertainties and the associated environmental and economic impact, the construction sector worldwide and in the State of Qatar, the assessment methods used in previous studies with similar scope, and the sourcing of primary construction materials in the State of Qatar. Then, the materials and methodology applied in the study are explained, followed by results and discussion, and lastly a conclusion to summarize the main findings.

1.1. Uncertainties and the Associated Environmental and Economic Impact

Geopolitical uncertainties can cause numerous variations to existing supply chains within the construction industry. Such variations result in environmental and economic impacts. Based on a review work by Prajapati et al. (2019) and Govindan and Soleimani (2017), supply chain managers need to consider many issues of supply chain network design, such as facility allocation, product flow, and the trade-off between environmental protection and cost reduction [4,5].
Nowadays, it is difficult to assess the sustainability of a supply chain due to its complexity. A supply chain includes many stakeholders such as investors, customers, project managers, member organizations, and policy makers. Uncertainty in supply chains can negatively affect supply chain configuration which may reduce efficiency, and which have an impact on supply chain performance. Therefore, uncertainty is considered an important factor that should be taken into consideration when planning a supply chain [6]. However, most supply chain studies have not considered this factor as a part of their research. This obvious absence of research in the area of supply chain indicates that uncertainty factors are often ignored in supply chain and network-related issues. Several studies have agreed that the absence of uncertainty factors would lead to negative sequences on supply chains (e.g., [7,8]). Uncertainty can occur at different nodes within a supply chain network. Transportation is one of the nodes at which uncertainty may occur due to its complexity.
One of the biggest challenges in the region in relation to achieving sustainable cities and maintaining regional development is transportation in a supply chain network. Since the transportation sector is known to be a significant source of Green House Gases (GHG) emissions, which are considered the main cause of global warming [9]. Therefore, studies have been concerned about improving the transportation efficiency within a supply chain in order to minimize uncertainties and reduce GHG emissions. However, studies have shown lack of knowledge regarding the achievement of more efficient transportation methods that can result in the saving of the environment (e.g., [10]). Within a supply chain, carbon dioxide (CO2) emitted during transport represents 14% of all supply chain emissions at both the global and European Union levels [11].
According to the Environmental Protection Agency (2019), the transportation sector in the U.S is responsible for about 28.9% of GHG emissions. The location of material suppliers has a major contribution to the quantities of GHG emissions in the atmosphere. Additionally, the production of CO2 emissions and the generation of dust and noise associated with the shipping and moving of materials throughout the supply chain has an effect on the supply chain. According to the literature, the longer the shipping distance, the greater the GHG emissions. Therefore, to reduce the environmental impact of infrastructure development, it is preferred to use local construction materials or import from regional suppliers [12]. The transportation distance and location of material affects transportation cost. In fact, transportation costs represent approximately 10%–20% of the total cost of some construction projects [13]. Therefore, the location of imported construction materials is critical in selecting the type of materials to be used in a construction project [14]. Green building standards such as the Leadership in Energy and Environmental Design (LEED) standard of the U.S, highlights the importance of the location of construction materials used in an infrastructure. This was a credit placed under the “Material and Resources” category [12]. The purpose of this credit is to reduce the environment impact related to transportation. The credit emphasizes extracting and manufacturing construction products within 800 km or (500 miles) from their work site.

1.2. Construction Sector Worldwide and in the State of Qatar

The construction industry is one of the biggest industries in any country around the world. In 2018, the value of construction set up was $1292.7 billion in the United States [15]. The cost of construction materials represents 60%–65% of the total cost of any construction project [16]. Problems in quality management, scheduling, and cost may arise in a construction project due to poor material production planning and supply operations [16]. Thus, the selection of construction materials sources and their acquiring process are critical to the success of a project. Worldwide, the construction sector is responsible for the consumption of 40% of materials and energy production, 17% of fresh water, 25% of manufactured wood, 40%–50% of global greenhouse gas emissions, and 10% of global economic activity [17,18,19,20]. The appropriate management of the supply chain not only affects the economic aspect of construction project but also changes the environmental impact of the construction industry. The Qatar construction industry is likewise a large sector posing additional strain on energy availability, natural resources, and water networks [21]. Based on a report generated by the Planning and Statistics Authority, 45.1% of Qatar’s total investment expenditure is set aside to be used in construction projects in 2019 and 2020 [22].
Qatar is a peninsula state located in the Arab Gulf region of the Middle East. Like its neighboring countries, its economy is highly dependent on its fossil fuel reserves. Qatar has a single land border with its southern neighbor, Saudi Arabia, which is part of the Gulf Cooperation Council; it is bordered by the Persian Gulf coastline on all other sides [23]. Qatar has the world’s third largest reserve of natural gas after Russia and Iran [24]. In 2015, The construction sector represent 10% of Qatar’s GDP [25]. Given the rapid development of the construction industry in Qatar in recent years, the country maintained a compounded annual GDP growth rate of 3.3% during the 2012–2019 period [26,27]. However, in 2018, Qatar recorded the lowest GDP growth rate of 0.5%, represented in USD 192.009 billion [26,28]. In addition, in 2018, the country’s GDP value accounted for 0.31% of the world economy. Studies had predicted that the economic growth of the country is expected to continue, especially by virtue of its construction industry, to reach a compounded rate of up to 7% by 2019 [29]. However, in the first quarter of 2019 as a result of the geopolitical changes at the time, GDP growth rate has reduced 2.60% compared to the previous quarter in 2018 [28]. One of the largest infrastructure projects that contributed to GPD growth and a massive reconstruction of the country was in the acquiring of the 2022 World Cup bid. The external balance in Qatar, as estimated by the present account of balance payment, states that there is an excess of 9.2% of GDP in 2018 and 8.9% of GDP in 2019. However, the current account balance is expected to experience a fall in 2020, represented by a surplus of only 7.9%. This is due to a foreseen increment in imports, with an annual growth of 7%, which mirrors the great need to import construction materials to complete infrastructure projects such as the 2022 World Cup and the North Gas Field Expansion [22]. According to the Planning and Statistics Authority in Qatar, the construction sector is expected to be the driver of economic growth in Qatar for period of 2018–2022, with a growth rate of 12.8%–16.3%. In 2018, the manufacturing sector had the smallest contribution to the GDP growth with only 0.25% of the total expected GDP growth. In contrast, the construction sector presented approximately 1.8% of growth, and the services sector followed with a GDP growth of 0.9% [22].

1.3. Assessment Methods

Several variables within the framework of transportation maintain significant influences as well as allow for the calculated assessment. Examples of these variables include the quantity of materials transported and the distance of transportation. The number of trips within the scope of transportation has environmental and economic impacts. Fewer trips with higher quantities of shipments are considered more environmentally friendly [30]. However, a comparative study by Tasca, Nessi, and Rigamonti (2017) argued that although fewer trips with more shipment are supposed to have less harm on the environment, the result of their study proved that number of trips and amount of shipment have the same effect on both supply chains [31]. There has been a major consensus that suppliers choose their transportation mode based on economic and environmental impacts. The regulation of carbon emissions has affected the selection of transportation mode by suppliers. Results have proven that the selection of material suppliers affects the environment in several ways [32,33,34]. These variables are applied in different assessment methods in order to derive a performance measurement to assess their environmental impact, economic impact, or other impact of interest.
Neely et al. (1995) defined performance measurement as the process of measuring the effectiveness and efficiency of actions [35]. In marketing and supply chain management literature, supply chain performance is measured using different methods such as a life-cycle analysis (LCA), multi-criteria analysis, and the supply chain operations reference model [36,37]. Selecting the right building materials depends on many factors such as their functional, technical and financial performance [38]. A study compared the environmental and financial performance of different building materials used in the Netherlands [39]; this study proposed the idea of using bamboo as a building material instead of the commonly used materials like concrete, steel, and wood. Despite bamboo being an environmentally sustainable alternative, the environmental costs associated with the transportation of bamboo overseas to the Netherlands was very significant compared to other processes. Environmental burdens associated with the transportation of bamboo have led to a change in the consideration of using bamboo as an environmentally friendly material. Furthermore, a study illustrated the importance of transportation in a supply chain in the construction industry. GHG emissions associated with the process of the extraction of raw materials, transportation, and construction are estimated to represent 10%–97% of a building’s total GHG life cycle [40]. A minor change in the transportation of a certain building material can lead to a change in its emitted energy and carbon. Moreover, in regard to a construction material supply chain, there have been several studies which have studied the construction material supply chain. For instance, Xue, Li, Shen, and Wang (2005) proposed a supply chain management framework in construction that is agent-based [41]. In addition, Cheng et al. (2010) established a service-oriented framework for a construction materials supply chain network [42]. In addition, Shi, Ding, Zuo, and Zillante (2016) studied the ability to utilize mobile-internet in construction supply chain management [43].
A life cycle assessment (LCA) is an effective method that is used to model the environmental impact associated with products’ and services’ life spans. An LCA has been defined as a method for the evaluation of inputs, outputs variables and the potential environmental impacts of a product or a service throughout its entire life cycle from raw material acquisition to disposal (from cradle to grave) [44]. The movement of materials between different sites has an impact on the environment. In order for materials to travel through the production system, they need to consume energy and therefore emits pollutants. There have been several studies that assess the environmental impact of a facility location and supply chain using different models. An LCA study was carried out to compare the environmental impacts of two agricultural supply chains that emphasized package reduction and shorter supply chains. The study stated that a large portion of environmental impact was due to transportation. In particular, 37%–55% of environmental impact was due to the transportation of products to warehouse, and 14%–30% was due to the transportation of products from market to households [31].
Canada is one of the largest suppliers of natural gas in the global natural gas market; therefore, it is of importance to supply natural gas at a competitive price and with lower GHG emissions. A study by Sapkota, Oni, and Kumar (2018) applied a comparative life cycle assessment and techno-economic model of the delivered costs and GHG emissions of a natural gas supply chain considering the production sites in Canada to north and southwest Europe as the system boundary [45]. The main aim of the techno-economic analysis and life cycle assessment was to evaluate the delivery costs and well-to-port (WTP) and well-to-wheel (WTW) GHG emissions of the Canadian LNG supply chain network. The costs and GHG emissions of two routes were compared to identify their economic and environmental impacts. The results revealed that the transportation cost of Canadian LNG (including recovery, processing, transmission, liquefaction, and shipping cost) to Europe is 8.9–12.9 U.S dollars per gigajoule ($/GJ), depending on the resources and pathway. The total WTP GHG emissions (including emissions from recovery, processing, transportation, liquefaction, shipping and re-gasification at the destination port) from the Canadian production sites to Europe is 22.9–42.1 gram of carbon dioxide equivalent per megajoule (g-CO2-e /MJ), depending on the resources and routes taken. The study elaborates the effect of change in supplier and transportation routes on a country’s economy and its environmental performance.
Supplier selection is an important issue when building a supply chain network. In order to maintain a supply chain, manufacturing and distributing firms should consider paying more attention in the process of supplier selection. Supplier selection problems are mostly solved using methods that can be classified into three problem solving categories, such as the multi criteria decision making (MCDM) method, the linear programing model, and the mathematical model.
Ware et al. (2014) stated that supplier selection is a highly dynamic process, as it is exposed to variation in demand, supplier capacity, quality level, lead time, cost per unit part cost, and transportation cost [46]. Scott et al. (2015) stated that supplier selection and sequence of order are considered the most important decisions in designing and implementing a supply chain network, as a supply chain can be affected by upstream and downstream stakeholders [47]. In the study, a combination of an analytical hierarchy process and quality function development benefiting chance constraint were used to select the optimal supplier. Hsu et al. (2013) considered environmental factors when selecting a supplier [48]. The study focused on the shared responsibility of carbon management between suppliers. Green supply chain management was achieved through the consideration of the interrelationships of the influential criteria of carbon management and by applying the decision-making trial and evaluation laboratory (DEMATEL) approach to control GHG emissions and improve suppliers’ performances. Likewise, more studies have used multi-criteria decision making methods such as the Multicriteria Optimization and Compromise Solution (VIKOR) method, fuzzy set theory, the fuzzy Analytic Hierarchy Process (AHP) method, the fuzzy Technique for Order Performance by Similarity to Ideal Solution (TOPSIS), and the fuzzy analytic network process technique to evaluate and select suppliers to provide a maximum total value of purchase [49,50,51,52,53,54,55].
Linear programming is another method used to select suppliers by optimizing the objective function while working with certain constraints. Amorim et al. (2016) proposed an integrated framework to select suppliers in the food industry while considering uncertain conditions [56]. The study developed a mixed-integer two-stage random programming model for supplier selection to maximize profit and minimize the risk of customer loss. The study considered the corruptibility of raw materials and finished products, uncertainties and long-term demands. Bender’s method was used to solve the problem.
Other studies have used a mathematical modeling as a method to solve supplier selection problems. Kheljani et al. (2009) proposed a mixed-integer, non-linear mathematical model to minimize overall cost considering all participants in a supply chain [57]. Several studies have combined the methods of MCDM, linear programming, and mathematical modeling to solve supplier selection problems with the aim of finding an optimal supplier that reduces overall costs [58,59,60].

1.4. Sourcing of Primary Construction Materials in the State of Qatar

In 2010, the Fédération Internationale de Football Association (FIFA) announced that Qatar would host the FIFA World Cup in 2022. Given the need to build venues to host this sport event, the extensive use of construction materials is expected. Project developers such as Ashghal, Barwa, the Central Planning Office (CPO), Lusail, Msheirib, Hamad International Airport, New Port Project, the Qatar Foundation, Qatar Petroleum, and Qatar 2022 are responsible for the development of 543 projects by 2021 [61]. Overall, at least 80% of these projects involve primary building materials such as steel, cement, washed sand, fine sand, gabbro, limestone, bitumen, ready-mix concrete, asphalt, and precast concrete. According to Qatar’s Ministry of Development Planning and Statistics, the demand for construction services is expected to increase over 2012–2022 [61]. Based on this declared demand, there is an expected additional increase in construction materials—including 93%, 71%, 68%, and 54% for asphalt, bitumen, gabbro, and limestone, respectively—to meet construction projects such as highways, streets, and roads [61].
Therefore, many companies have made sustainability a part of their supply chain design. The integration of sustainability into the design of a supply chain links it with the ability to become resilient in the long term [62]. Three main areas in the supply chain directly affect environmental impact—production concept, facilities, and logistics and transportation [63]. Within the current research, the economic and environmental impacts of construction material transportation throughout supply chain activities (i.e., gate-to-gate) are considered facets of transportation and logistics, as they vary within the situation and contribute to changes in carbon emissions. Most studies concerning sustainability and life cycle assessments (LCA) within the construction industry have focused on the environmental assessments of construction materials during building phases [64,65]. Fewer studies have focused on the assessment of the environmental and economic impact of the transportation of primary construction materials to meet the demand of the construction sector while undergoing uncertainties and geopolitical challenges.
Since Qatar is hosting the 2022 FIFA World Cup, Qatar is expected to import construction materials in order to sustain the massive construction required to achieve this goal. Qatar’s GDP fell in Q1 of 2018 largely because of changes occurring in the region. The blockade is considered to possibly be the main cause of the decrease in GDP, as it affected the movement of exports and imports through the country. Therefore, the state of Qatar was taken as a case study in this paper, where an LCA was utilized as a framework to assess the economic and environmental impacts of the construction material flow within the supply chain in Qatar using Greenhouse Gases, Regulated Emissions, and Energy use in Transportation (GREET) as an LCA tool. By leveraging a holistic and systematic method to analyze the economic and environmental impact of sudden changes to the supply chain by virtue of geopolitical challenges, one can expect, determine, and overcome these geopolitical challenges while sustaining minimal effects on the economy and environment. This study highlights the environmental and economic costs associated with variations in the sourcing and transportation within a supply chain given the geopolitical challenges that can affect a country’s economic growth by proposing a mathematical model.

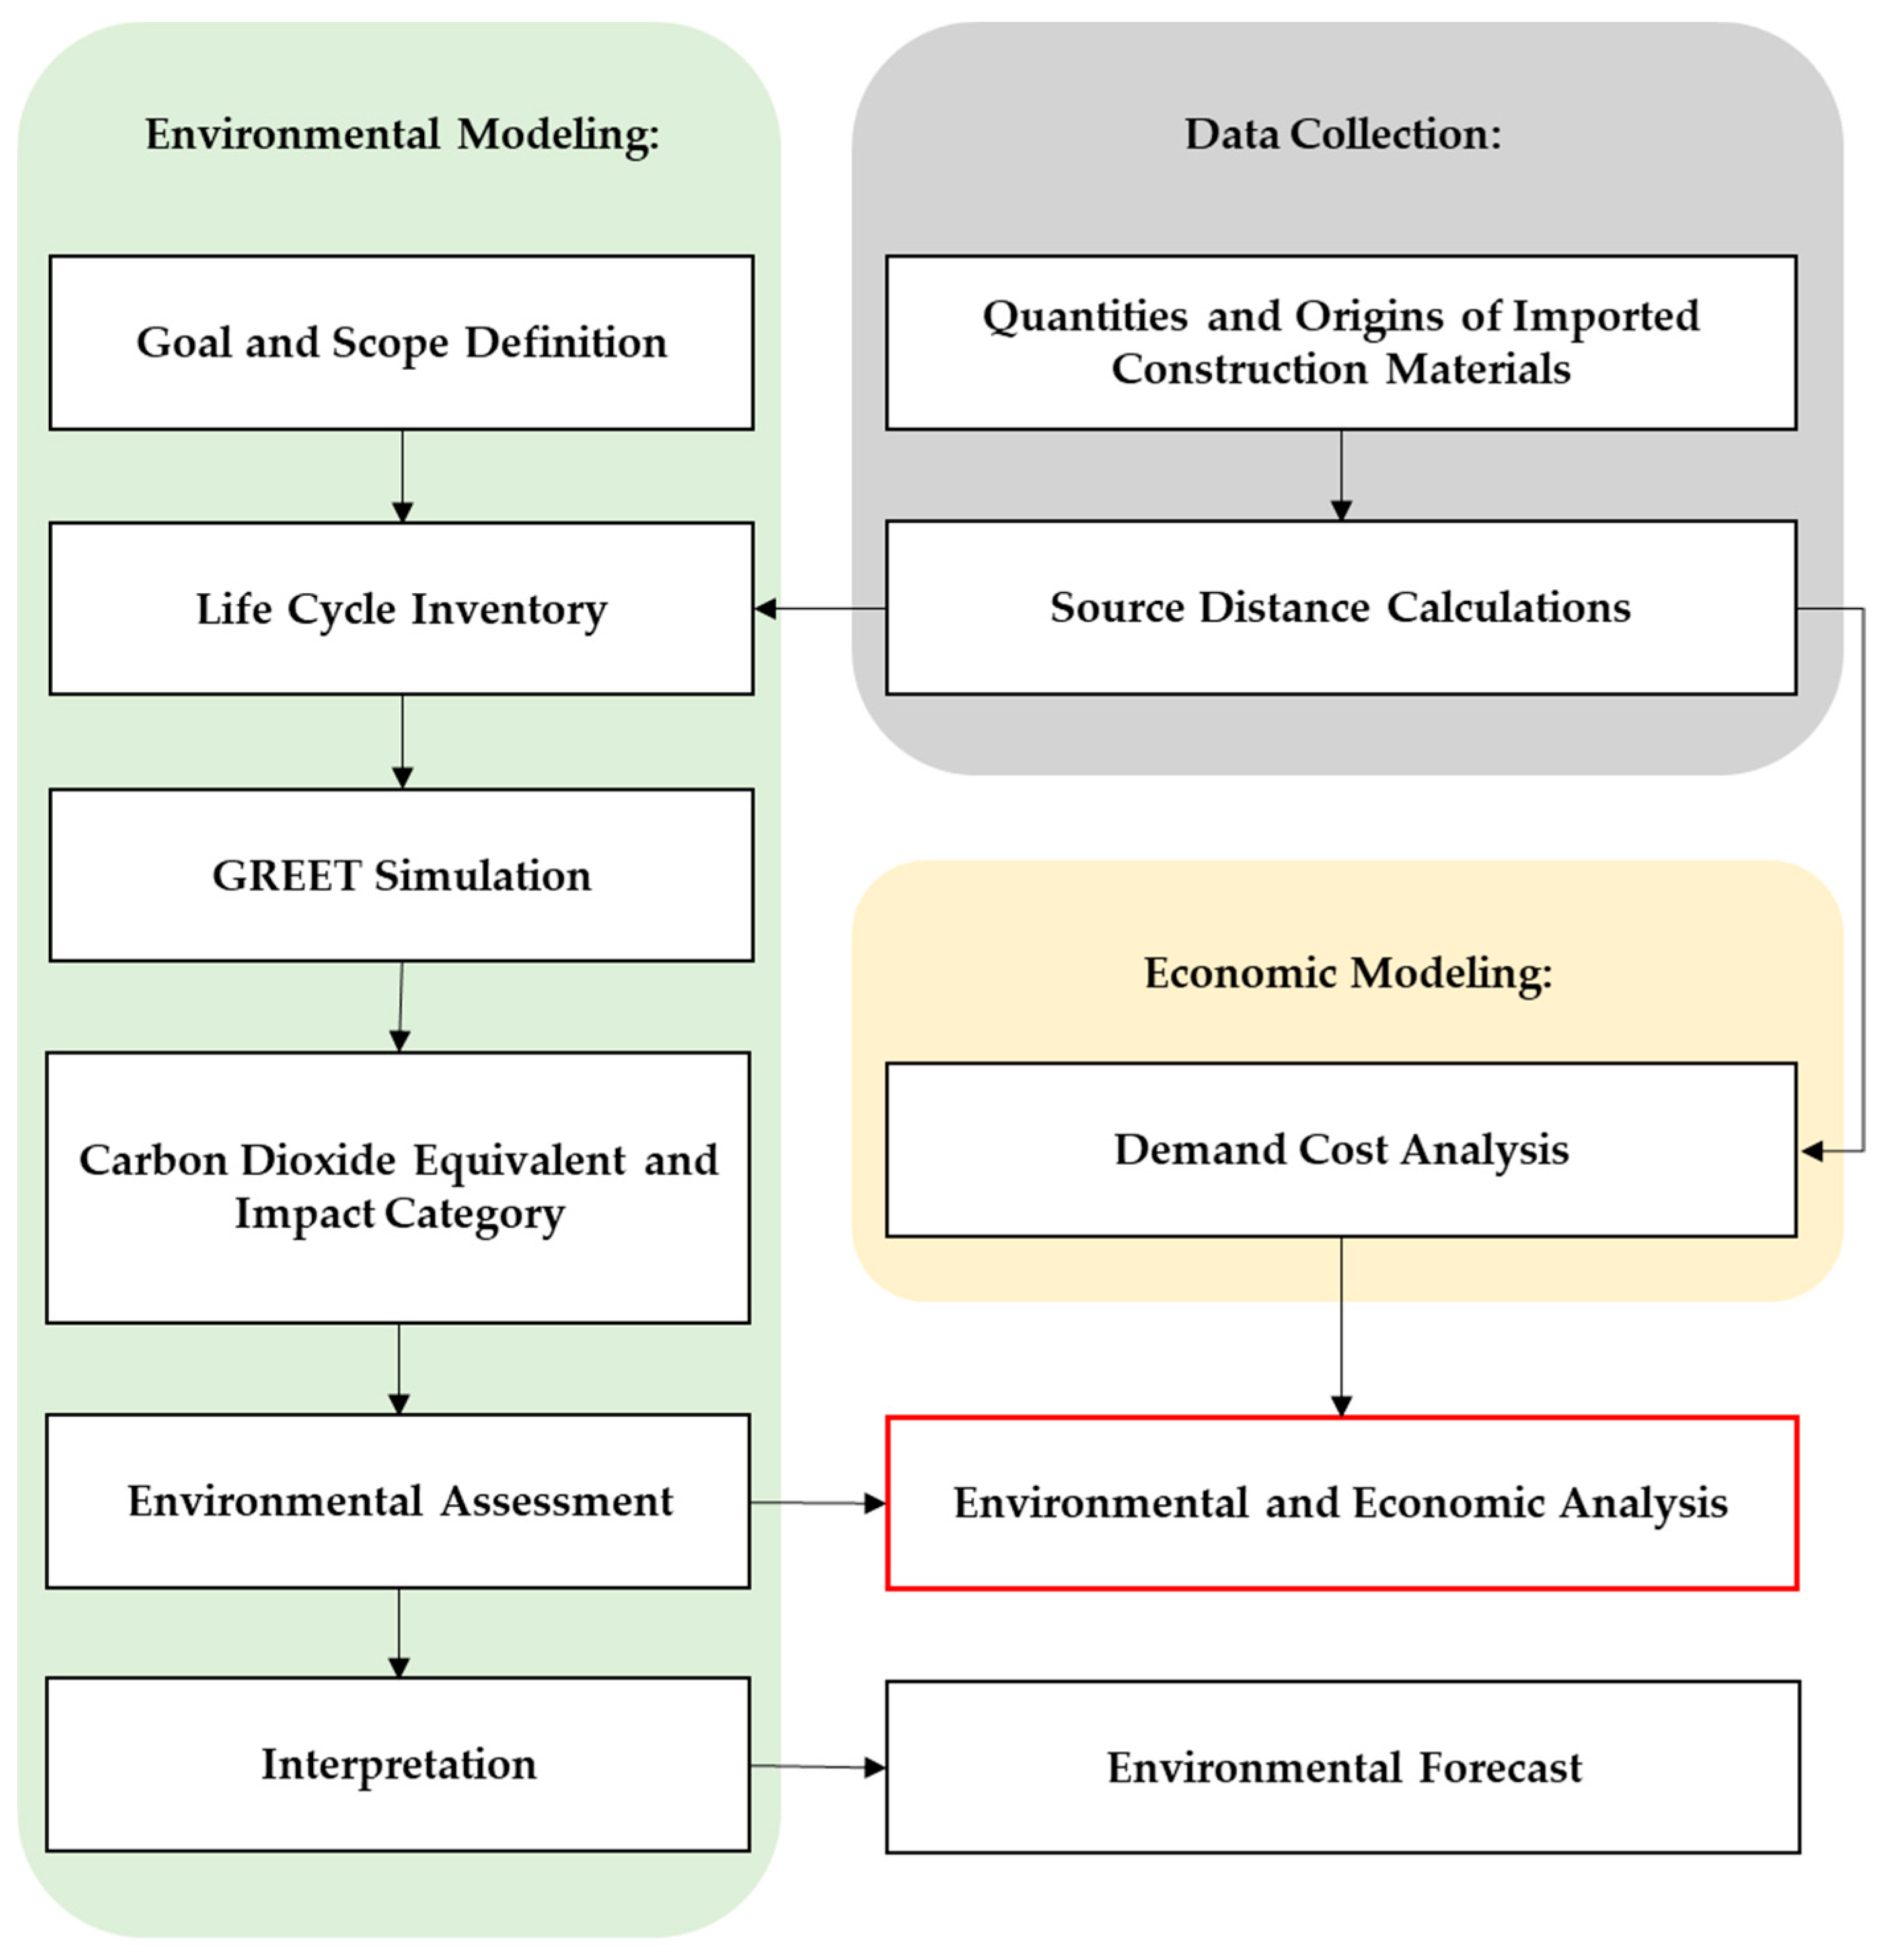
2. Materials and Methodology

In order to achieve the aim of the study, an environmental analysis was conducted, and this was followed by an economic analysis. Both analyses were combined in a mathematical model to derive the environmental and economic modeling (Figure 1).
First, an LCA was used to model and evaluate the environmental burden associated with the systems studied. An LCA is a framework that can be used to report potential environmental loads in each step of a product or service supply chain by considering the entire life cycle (i.e., cradle-to-grave) [66]. An LCA consist of four main stages: Goal and scope definition, life cycle inventory, life cycle impact assessment, and interpretation.

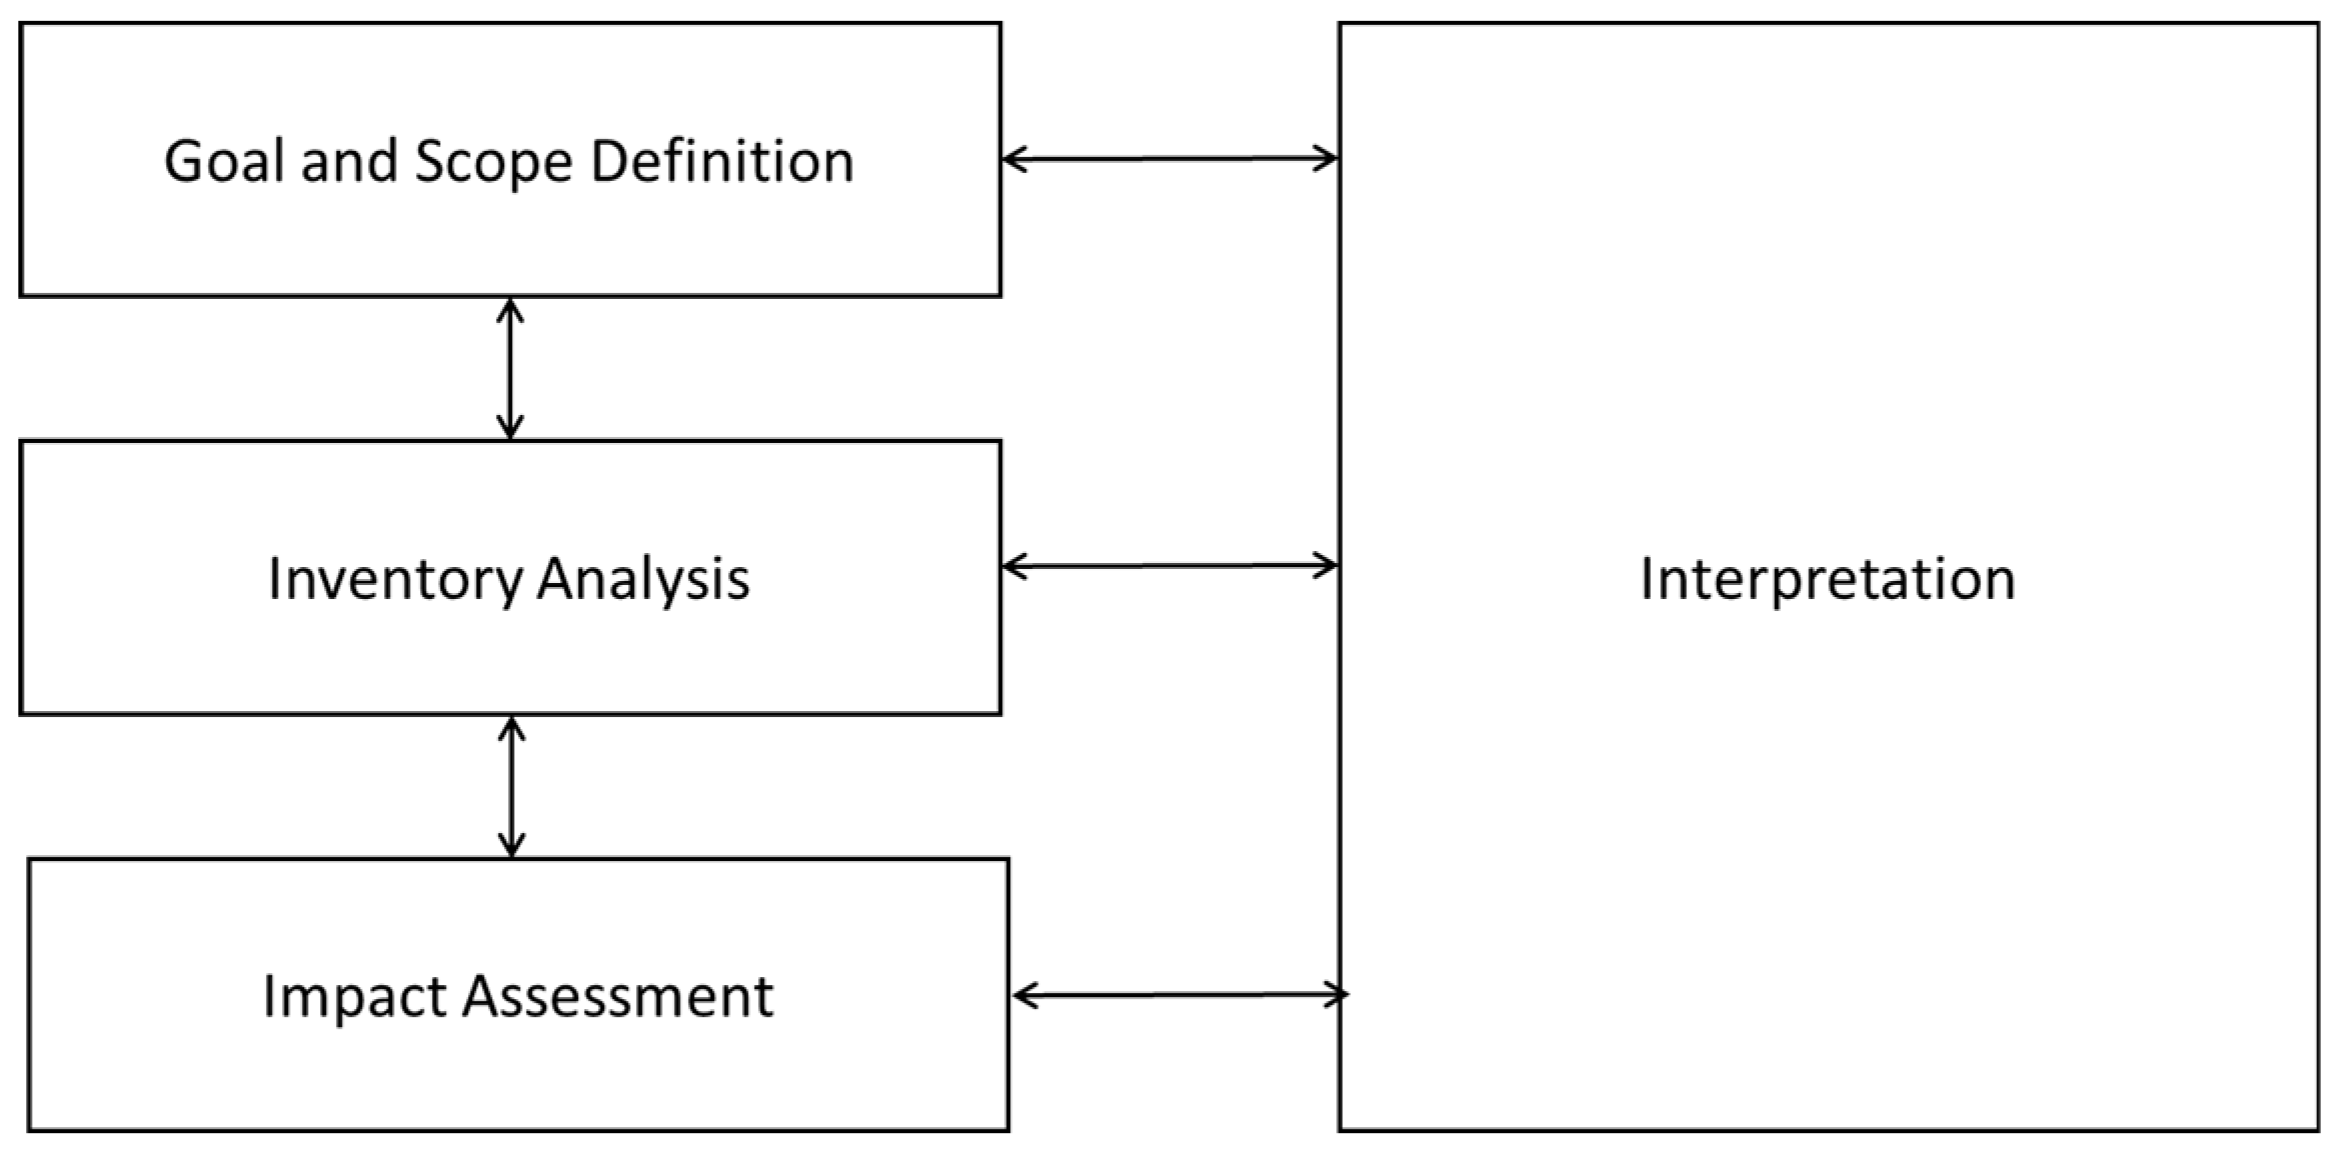
2.1. LCA Study Goal and Scope

Qatar is undergoing a large infrastructure and construction boom because it is hosting the 2022 FIFA World Cup. This increase in infrastructure and construction prompted the Ministry of Development Planning and Statistics to authorize an extensive collection of required construction materials from among Qatar’s main construction companies in 2013 [61]. The current study is extensive, in that it classifies five of the main elements that the construction industry requires between 2012 and 2022. Table 1 provides data with respect to these materials; these data are used within the main scope of the study with regard to construction material and sustainability analyses.
As mentioned earlier, an LCA study was conducted to measure and compare the environmental impacts of alternative construction material logistics. The current study highlights the environmental impacts of 1 kg of construction material flow as a functional unit.
The system boundary of the LCA study includes all life cycle activities included in the process of transporting construction materials. Raw material acquisition, construction material production, and the use phase and end treatment of building materials were excluded because they are identical to the base-as-usual scenario of material used for construction. An LCA can help decision-makers better evaluate the environmental impacts associated with alternative investments.

2.2. Life-Cycle Inventory

According to the International Organization of Standardization (ISO) ISO 14040 standard, an environmental life cycle inventory can be considered a grouping of data with respect to all inputs and outputs for each unit process included within a system’s boundaries [66]. To compile inventory data for the quantities and flow of construction materials, we used secondary sources such as the database of the General Authority of Customs and Ports, Qatar [67]. Moreover, data drawn from GREET datasets were used to complete LCA modeling.
A GREET model created by the Argonne National Laboratory (ANL) was used to quantify the environmental impacts associated with sourcing and transportation. The GREET model considers well-to-pump (WTP), well-to-wheel (WTW), and pump-to-wheel (PTW) analyses. WTP includes the fuel phases of feedstock, such as feedstock and fuel production, the transportation of feedstock and fuel, distribution, and storage. PTW considers fuel consumption while the vehicle is being utilized. WTW includes an analysis of both WTP and PTW [68]. In this study, the PTW analysis of different transportation methods was based on GREET 2018 calculations [69].
After identifying the scope of the construction materials to be considered in this study, a method to acquire the required data had to be determined. Attempts to acquire data with respect to imported materials (all within the identified scope) led us to the Qatar Authority of Customs and Ports [67], which has a foreign trade system that uses harmonized commodity description and coding system (HS) codes to classify materials imported into and exported from Qatar. Within this system, an open database presents data pertaining to materials imported by country and by year; it also includes data on a few other elements that are key to the current study and analysis. Research in this foreign trade system database was undertaken to establish key parameters and to establish the major classifications that would need to be considered vis-à-vis the construction material scope—all needed to conduct a viable study.
Imported construction materials were classified based on the scope of materials provided in a survey conducted in 2013 by Qatar’s Ministry of Development Planning and Statistics [61]. This survey was executed in collaboration with the Ministry of Business and Trade, the Qatar 2022 Supreme Committee, and the CPO. The survey results covered 543 construction projects overseen by 12 key developers. A statistical analysis was based on the data available from the foreign trade system provided by the Qatar Authority of Customs and Ports.
Table 1 denotes the main construction materials, which were later classified into five categories of construction materials. Asphalt and bitumen were all recorded under the same HS code because the database considers them a single category. The list of materials in Table 1 identifies fine sand and wash sand as separate categories; however, in the foreign trade system, they are often referred to as a single classification unit (i.e., “sand”). Cement, limestone, and steel are independent categories because information on these materials can be individually drawn from the foreign trade system. Using the five categories of imported construction materials, we then gathered data from the system database.
The foreign trade system database of the Qatar Authority of Customs and Ports is comprehensive; it allowed us to consider several parameters in our analysis and to study imported construction materials and their sustainability effects in the midst of a geopolitical crisis. Nonetheless, we needed to expand our data to allow for further calculations and establish sustainability effects. The foreign trade system provides data on the year of entry of construction material, the port of entry (which in turn identifies the transport mode), the country of origin (which identifies the source), the quantity (in tons) of material imported, and the price (in US Dollars) associated with it. With this information in hand, we could undertake calculations to establish relationships between the geopolitical crisis and the state of current imported construction materials. However, information on the distances that these materials travel was essential, as it allowed us to understand and expand upon sustainability effects. Based on foreign trade system data—which identify the countries of origin of imported materials—we further analyzed data to establish the distances that those materials traveled.

2.3. Life Cycle Impact Assessment

We established a list of countries involved based on the five categories of materials handled during 2012–2022 and the ports of entry. We then used this list to calculate the distance from each country to Qatar, using various modes of transport (as identified by the nature of the port of entry). To establish data in terms of distances traveled, we had to generalize calculations for three specific transport modes—land, sea, and air. Land distance calculations were made from country capital to country capital, using several mapping tool packages such as Google Maps that calculate the distance traveled using major roadways. Sea travel distances were established using a nautical web mapping tool that calculates nautical distance from port to port; the generalization used here was to take the shortest path to the port, not only to give the analysis the “benefit of the doubt” but also to remove any bias from the system. Moreover, in-land distance, which represents the land distance covered before the shipment arrives at the origin seaport, was calculated. To measure in-land distance, countries were assumed to have a circular shape, and their radius was calculated. Then, the shipment was assumed to travel from the middle of the country to the seaport. However, due to differences in country shapes, a sensitivity analysis was carried out to eliminate uncertainties. Air travel distances were derived from calculations based on a global sphere and a consideration of two points (i.e., the capitals of each country) to establish the distance traveled [70]. This generalization, we noted, sometimes deviates from actual cases because some imported materials are rerouted to multiple hubs. However, this generalization allowed us to create a uniform dataset that could be analyzed to establish the effect that a geopolitical crisis can have on sustainability vis-à-vis construction materials.
Environmental modeling considers traveling distance and transportation mode to calculate air emissions. In this study, three types of distances were calculated—the land distance for delivering goods via land ports, and sea and in-land distance for delivering shipments overseas. As a result of the lack of data regarding the manufacturing industry of each of the five construction materials and their locations in each supplying country, some assumptions were made. The land distance covered by the shipments before they reach the seaport to be shipped overseas is called the in-land distance. In-land distance was calculated by assuming the supplying country’s’ radius. This assumption to derive the radius of the country using its area considered that the manufacturing industry is located in the closer to the center of the country opposed to on the country’s border.
After viewing the data collected for the five classified materials over 2012–2022, we observed that, relative to the pre-crisis subperiod, there was a post-crisis increase in transportation distance. This observation led to our use of a simulation tool by which the environmental impact of certain transportation variables could be calculated. Transportation methods used in the U.S. are not that different from the methods used elsewhere in the world; therefore, this study utilized relevant data from GREET. We used the GREET model as an analytical tool to simulate transportation methods (pump-to-wheel) and calculate the associated emissions of various processes.
The strategy we adopted in modeling the transport of asphalt and bitumen, cement, limestone, sand, and steel from various countries to Qatar was based on a percentage of imports—that is, any percentage figure equal to or greater than 90% was considered the quantity imported for each material. Over 90% of the total shipments of asphalt and bitumen, cement, limestone, sand to Qatar in each year observed could be accounted by the top ten individual shipments of the corresponding material and year. For steel, 30 shipments accounted for 90% of all steel imported into Qatar.
The environmental impact of the delivering process within the supply chain of construction materials imported from different resources using various transportation modes was assessed. The environmental analysis was applied on the pre-crisis subperiod and the post-crisis period (2012–2018). Different air pollutants for the land and sea transportation modes for specific distances were found using GREET. For the gate-to-gate life cycle process assessment, we evaluated the end-use air emissions represented in GHG. GREET provides fuel cycle and vehicle cycle results on a pollutant mass per distance traveled basis. However, fuel cycle emissions were used to calculate the emissions generated from the operation cycle. We computed the total GHG emissions on a CO2 equivalent grams per kilometer basis for each vehicle by using 100-year global warming potentials (GWP). GWP is a measure of the energy absorbed over 100 year time period due to emissions of gases [71]. GHG emissions were converted to CO2-e to obtain the global warming potential effect. Thus, to assess the global warming potential environmental impact, GHGs were characterized as CO2-e with weightings of 34 and 298 for methane and nitrous oxide, respectively, corresponding to a 100-year radiative forcing potential. GWP and energy consumption are the most commonly assessed environmental impact categories in the construction sector [72].

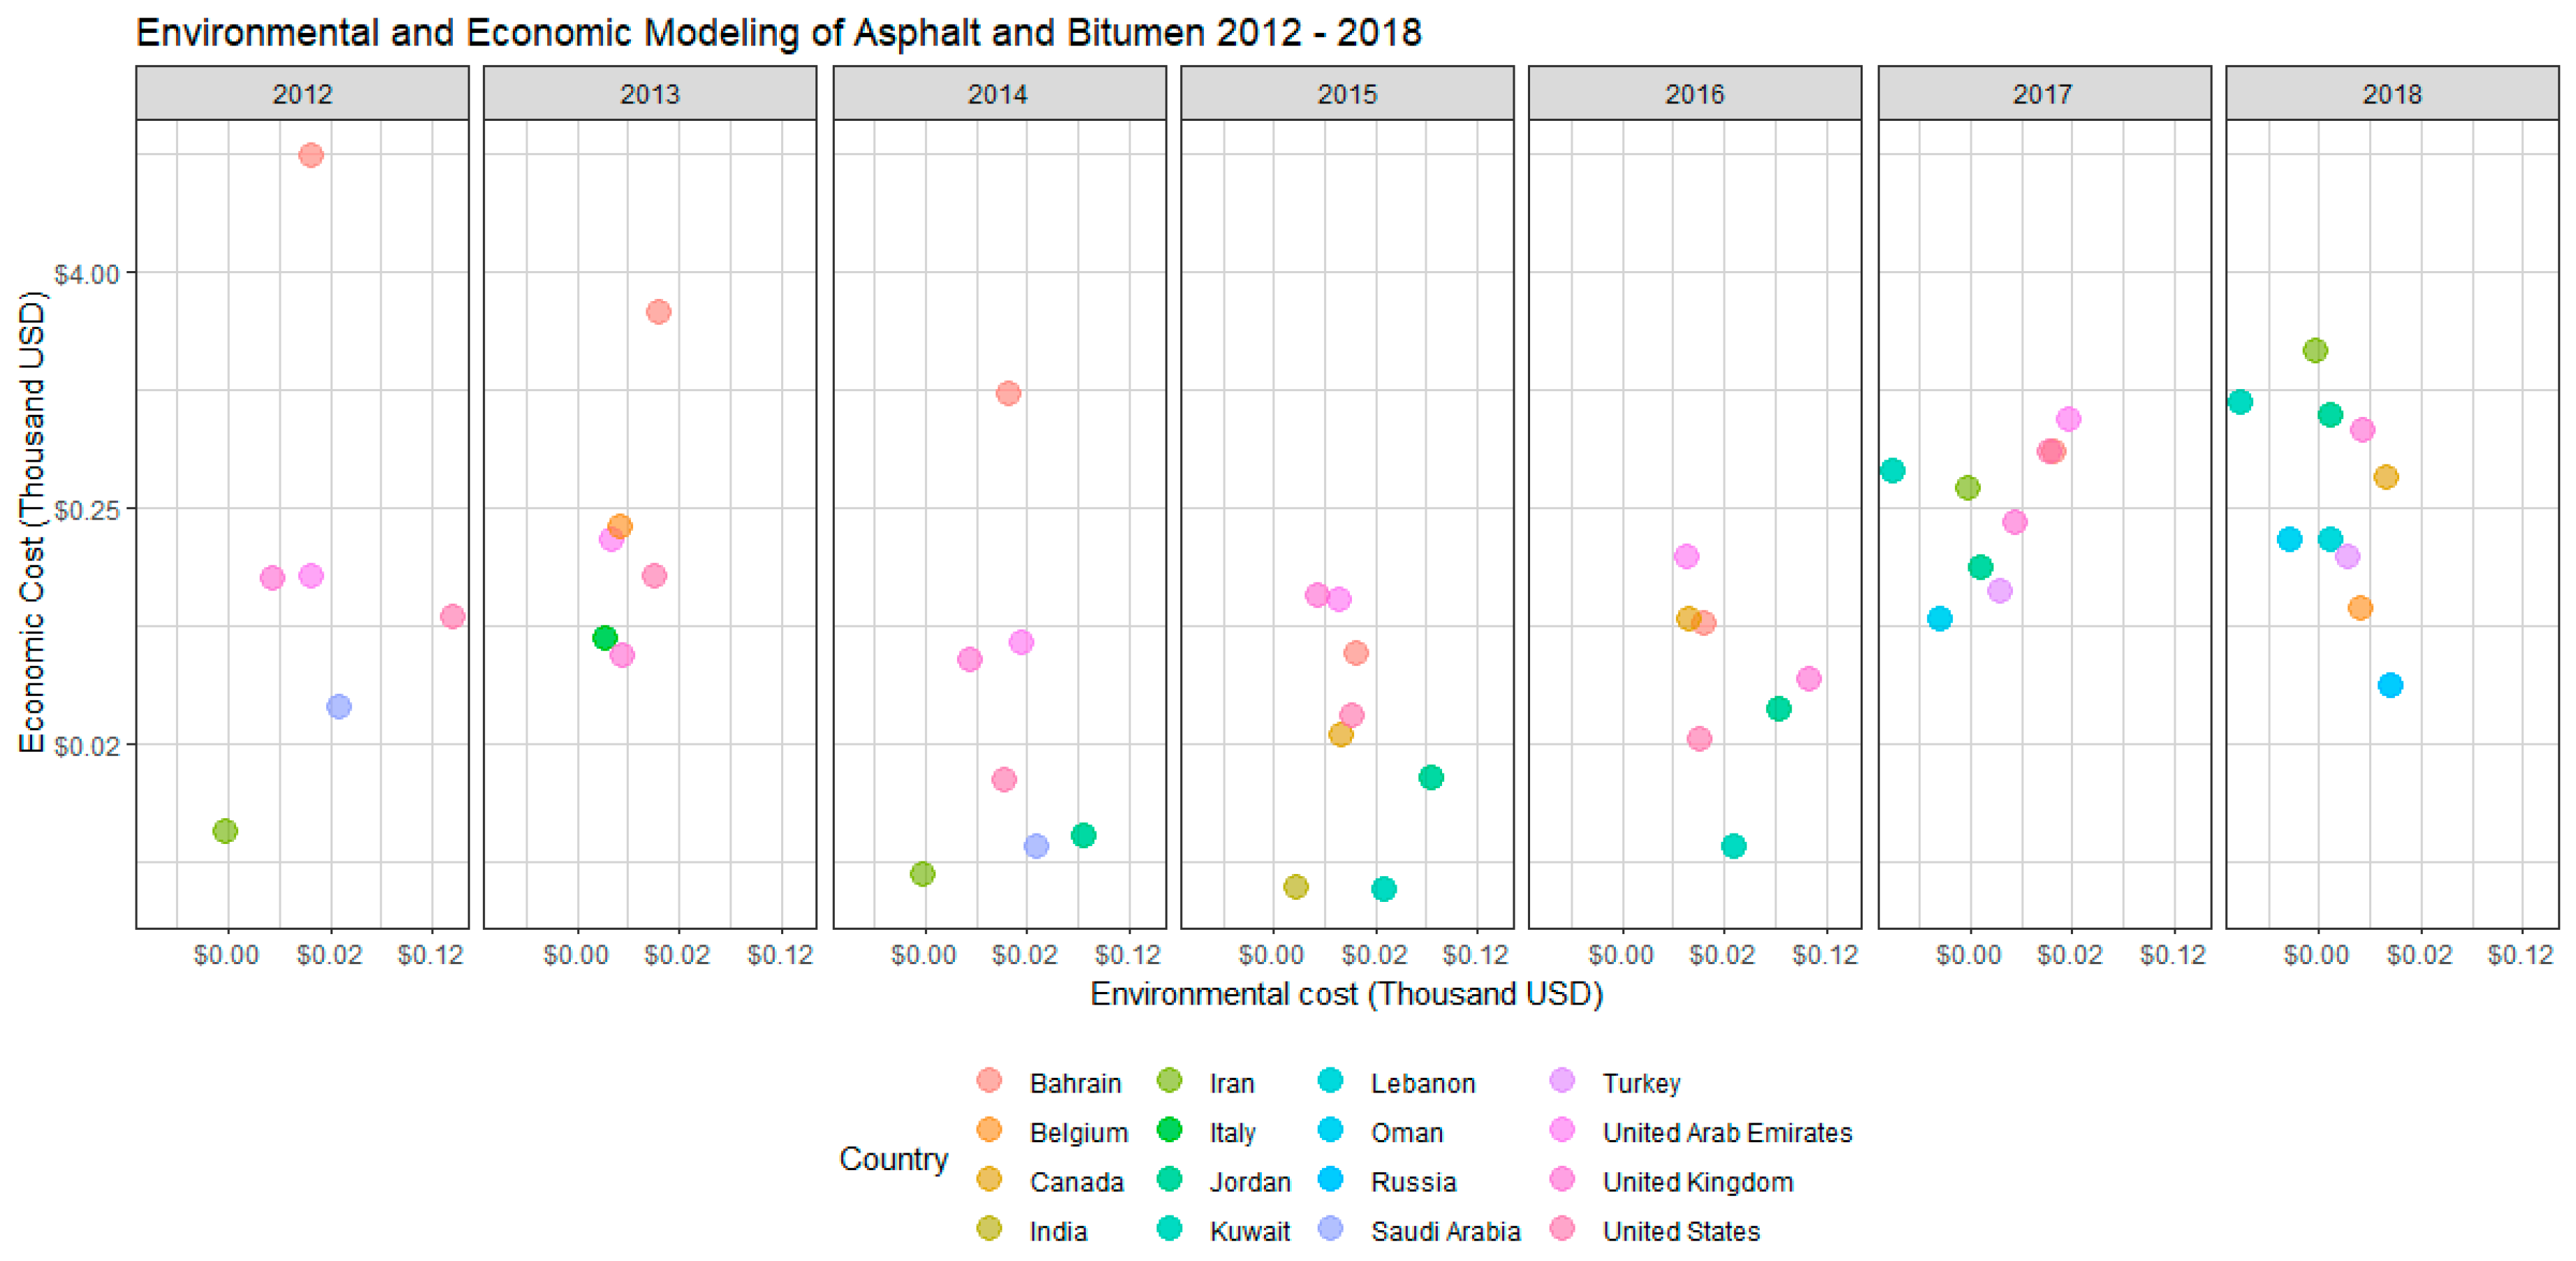
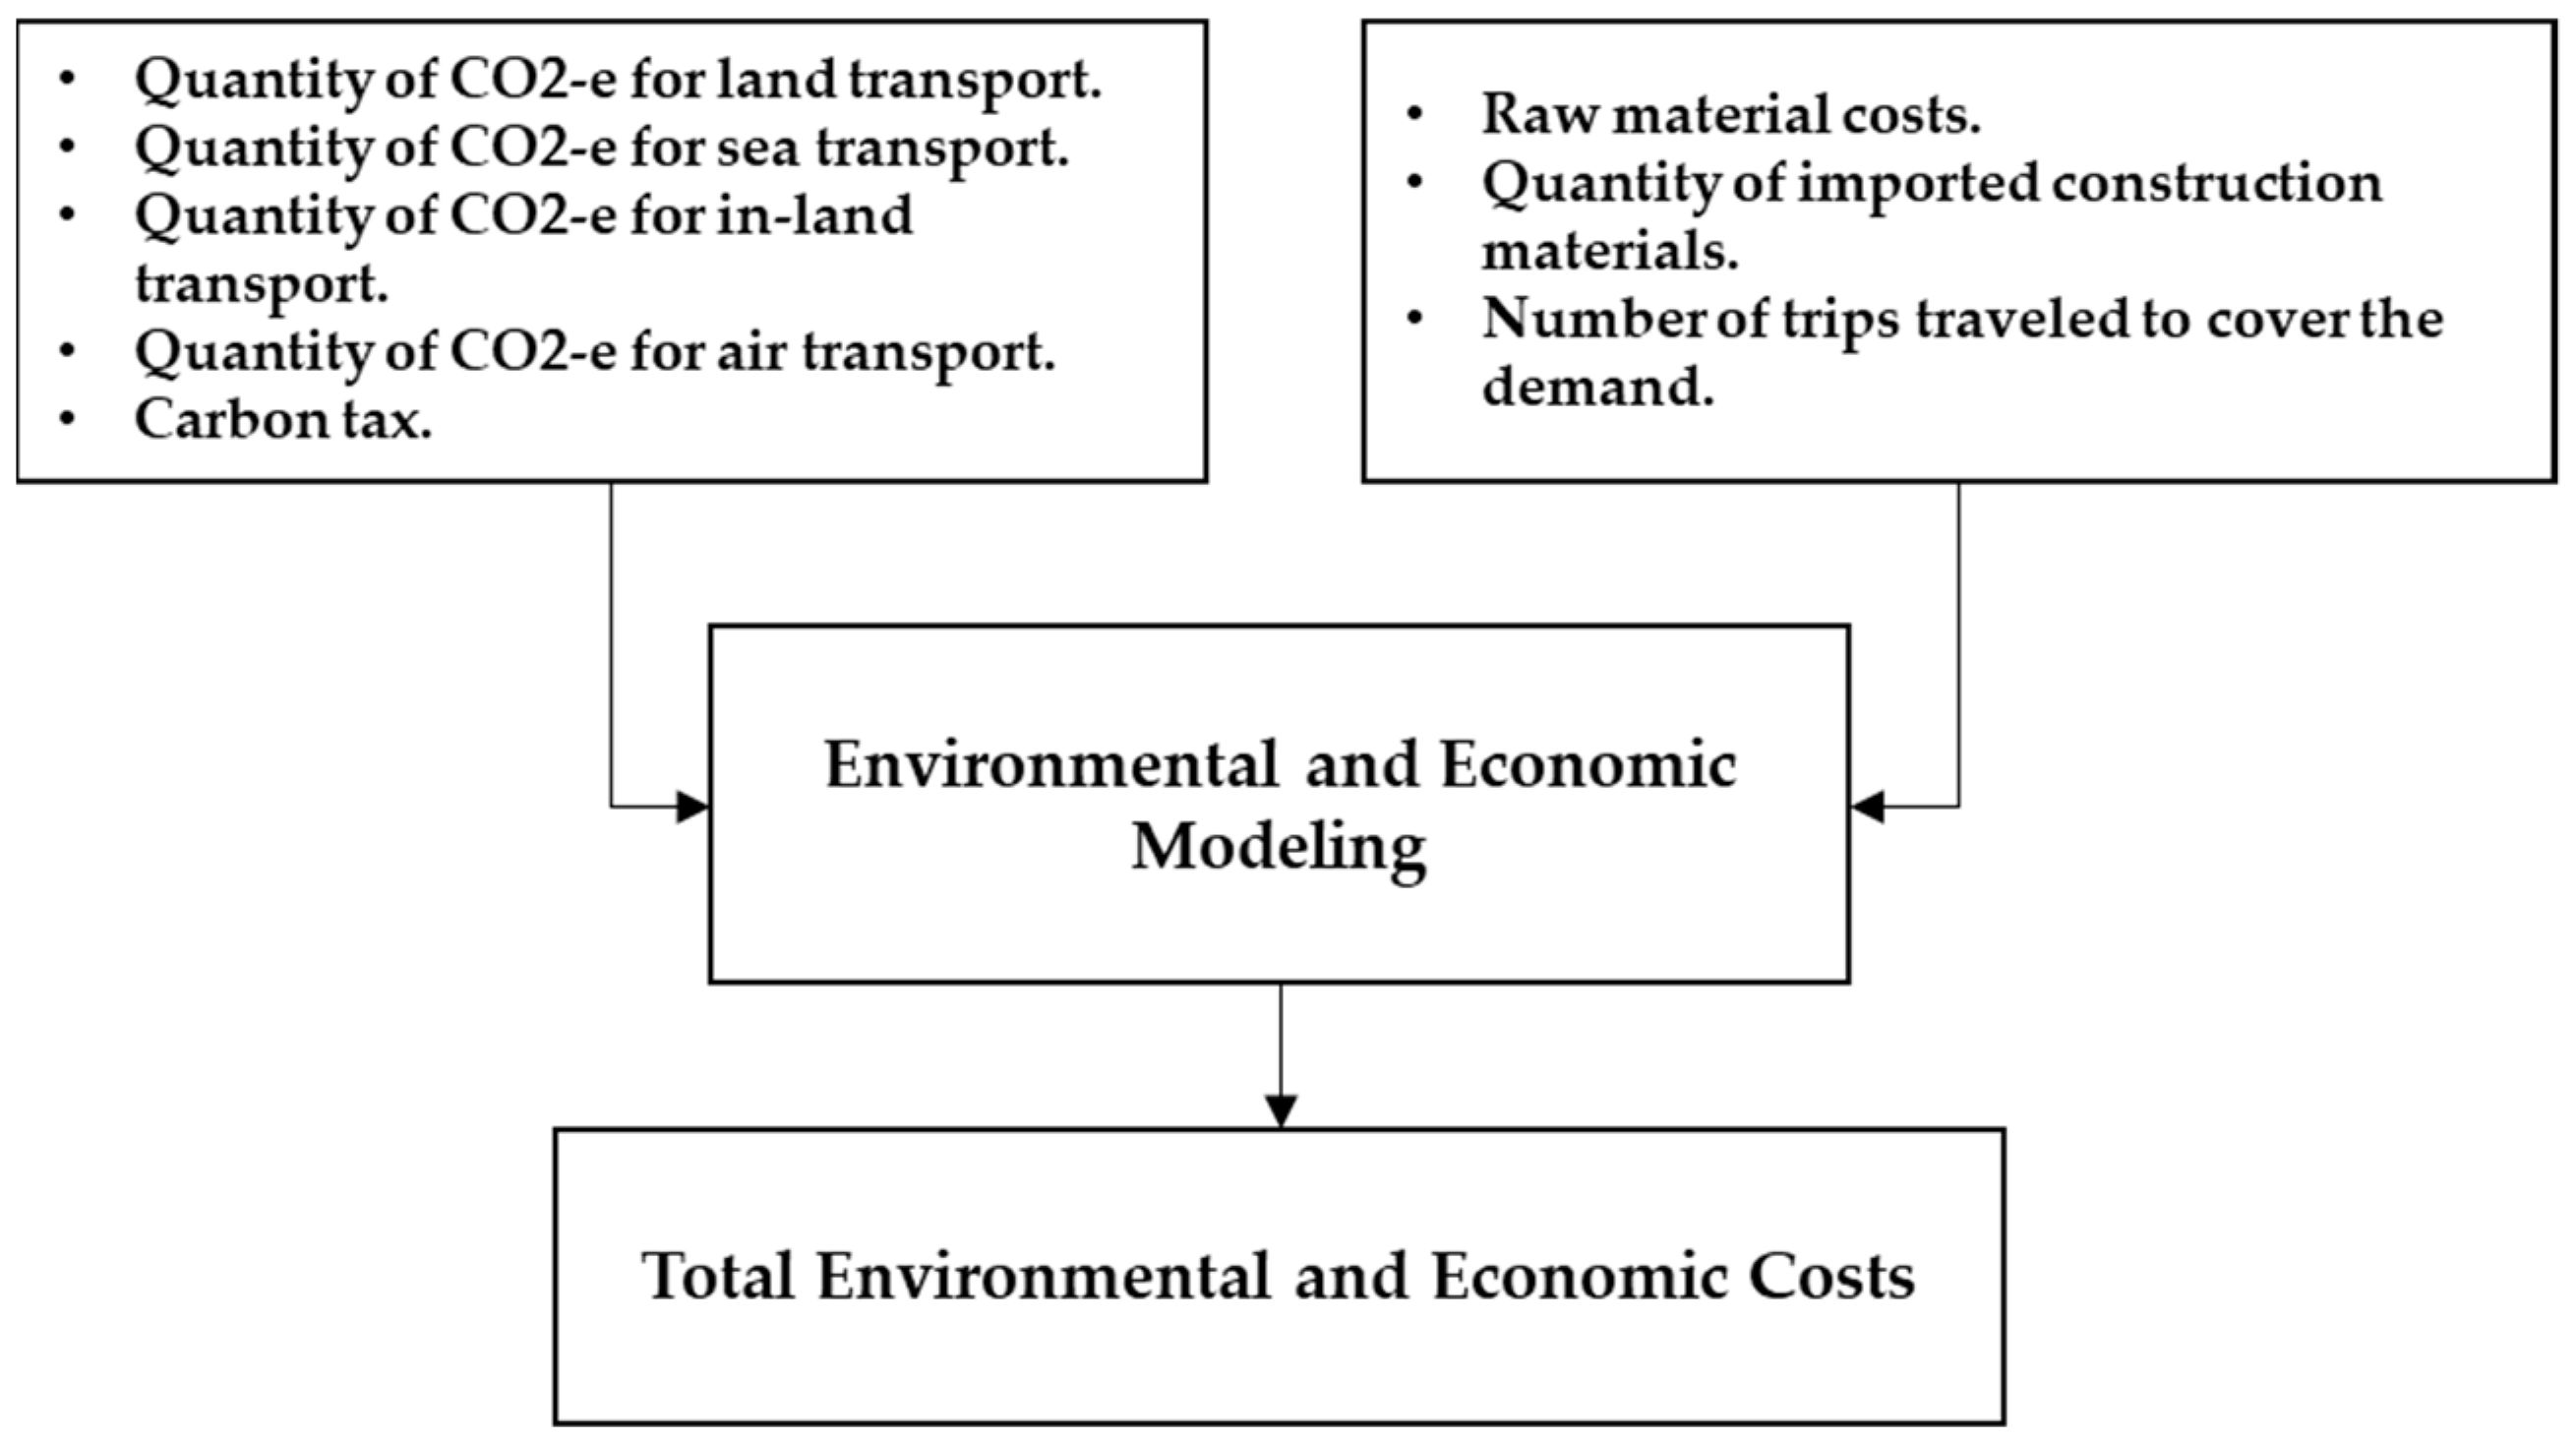
2.4. Economic Modeling

Economic modeling was conducted for the five construction materials for the sub-period before blockade (2012–2016) and the period after blockade (2018) to evaluate the effect the crisis had on the economy. To conduct economic modeling, prices of shipments were extracted from the database of Qatar’s Authority of Customs. Prices were used to obtain the overall price of delivering the construction material to meet demand. It was assumed that each country had to satisfy the demand of construction material at each specific year. Therefore, to import materials to meet the demand from one source, there had to be several trips. Using the given data, an economic analysis was conducted to measure the economic effect of the crisis.

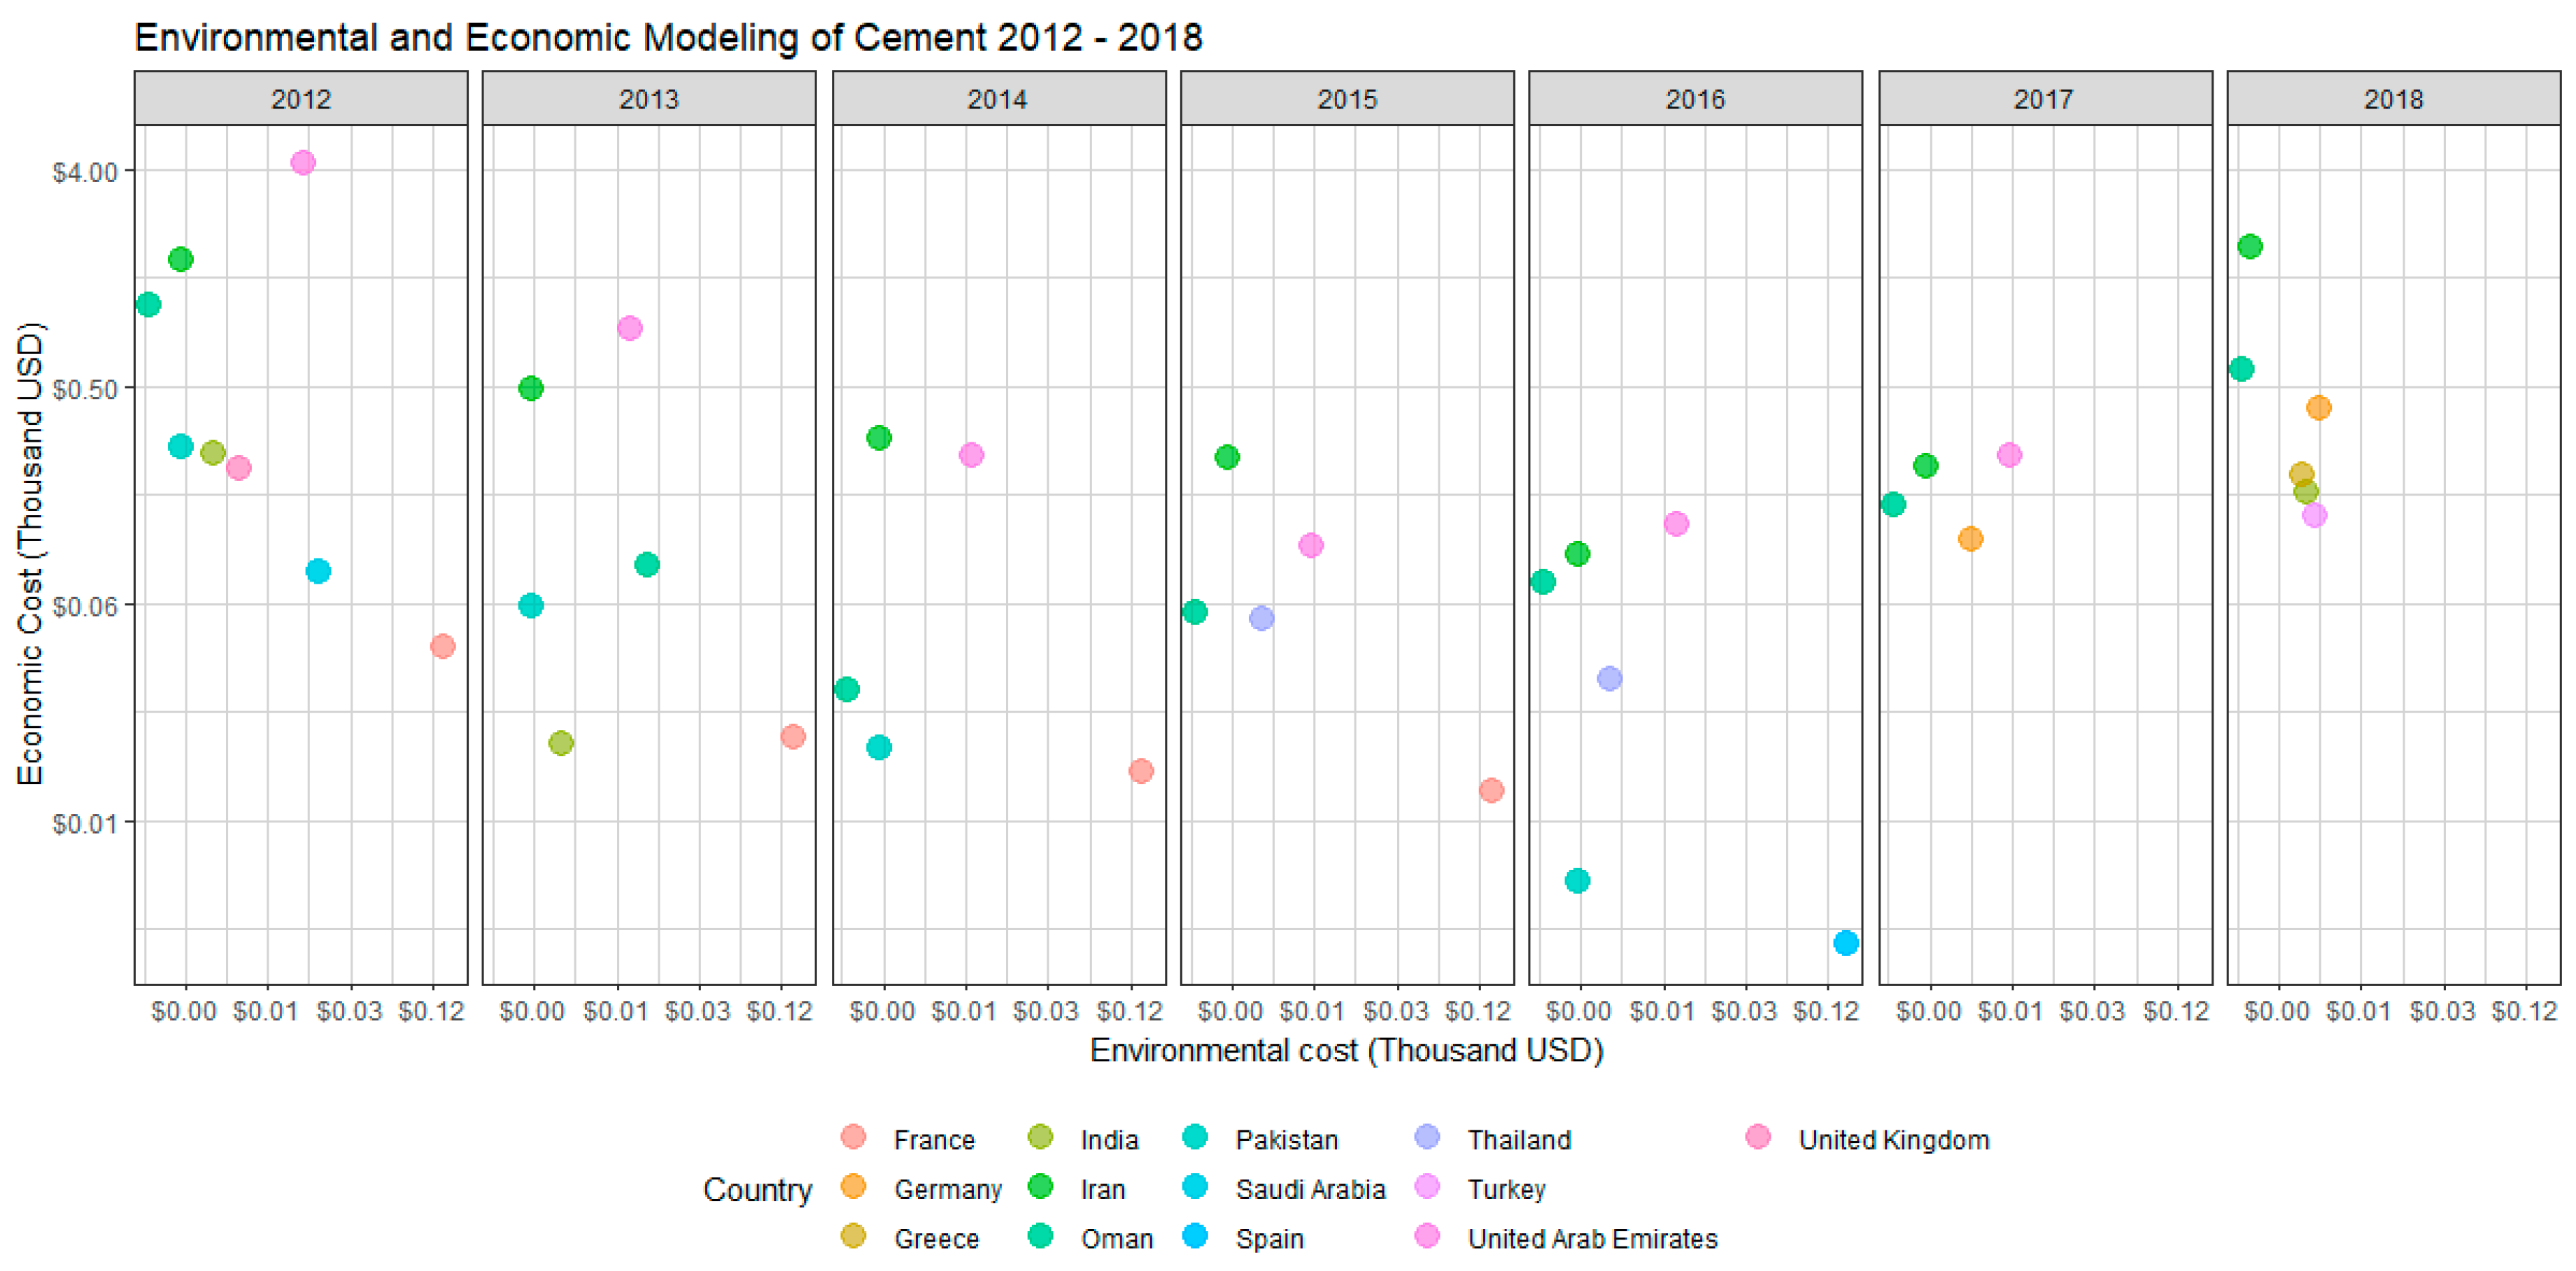
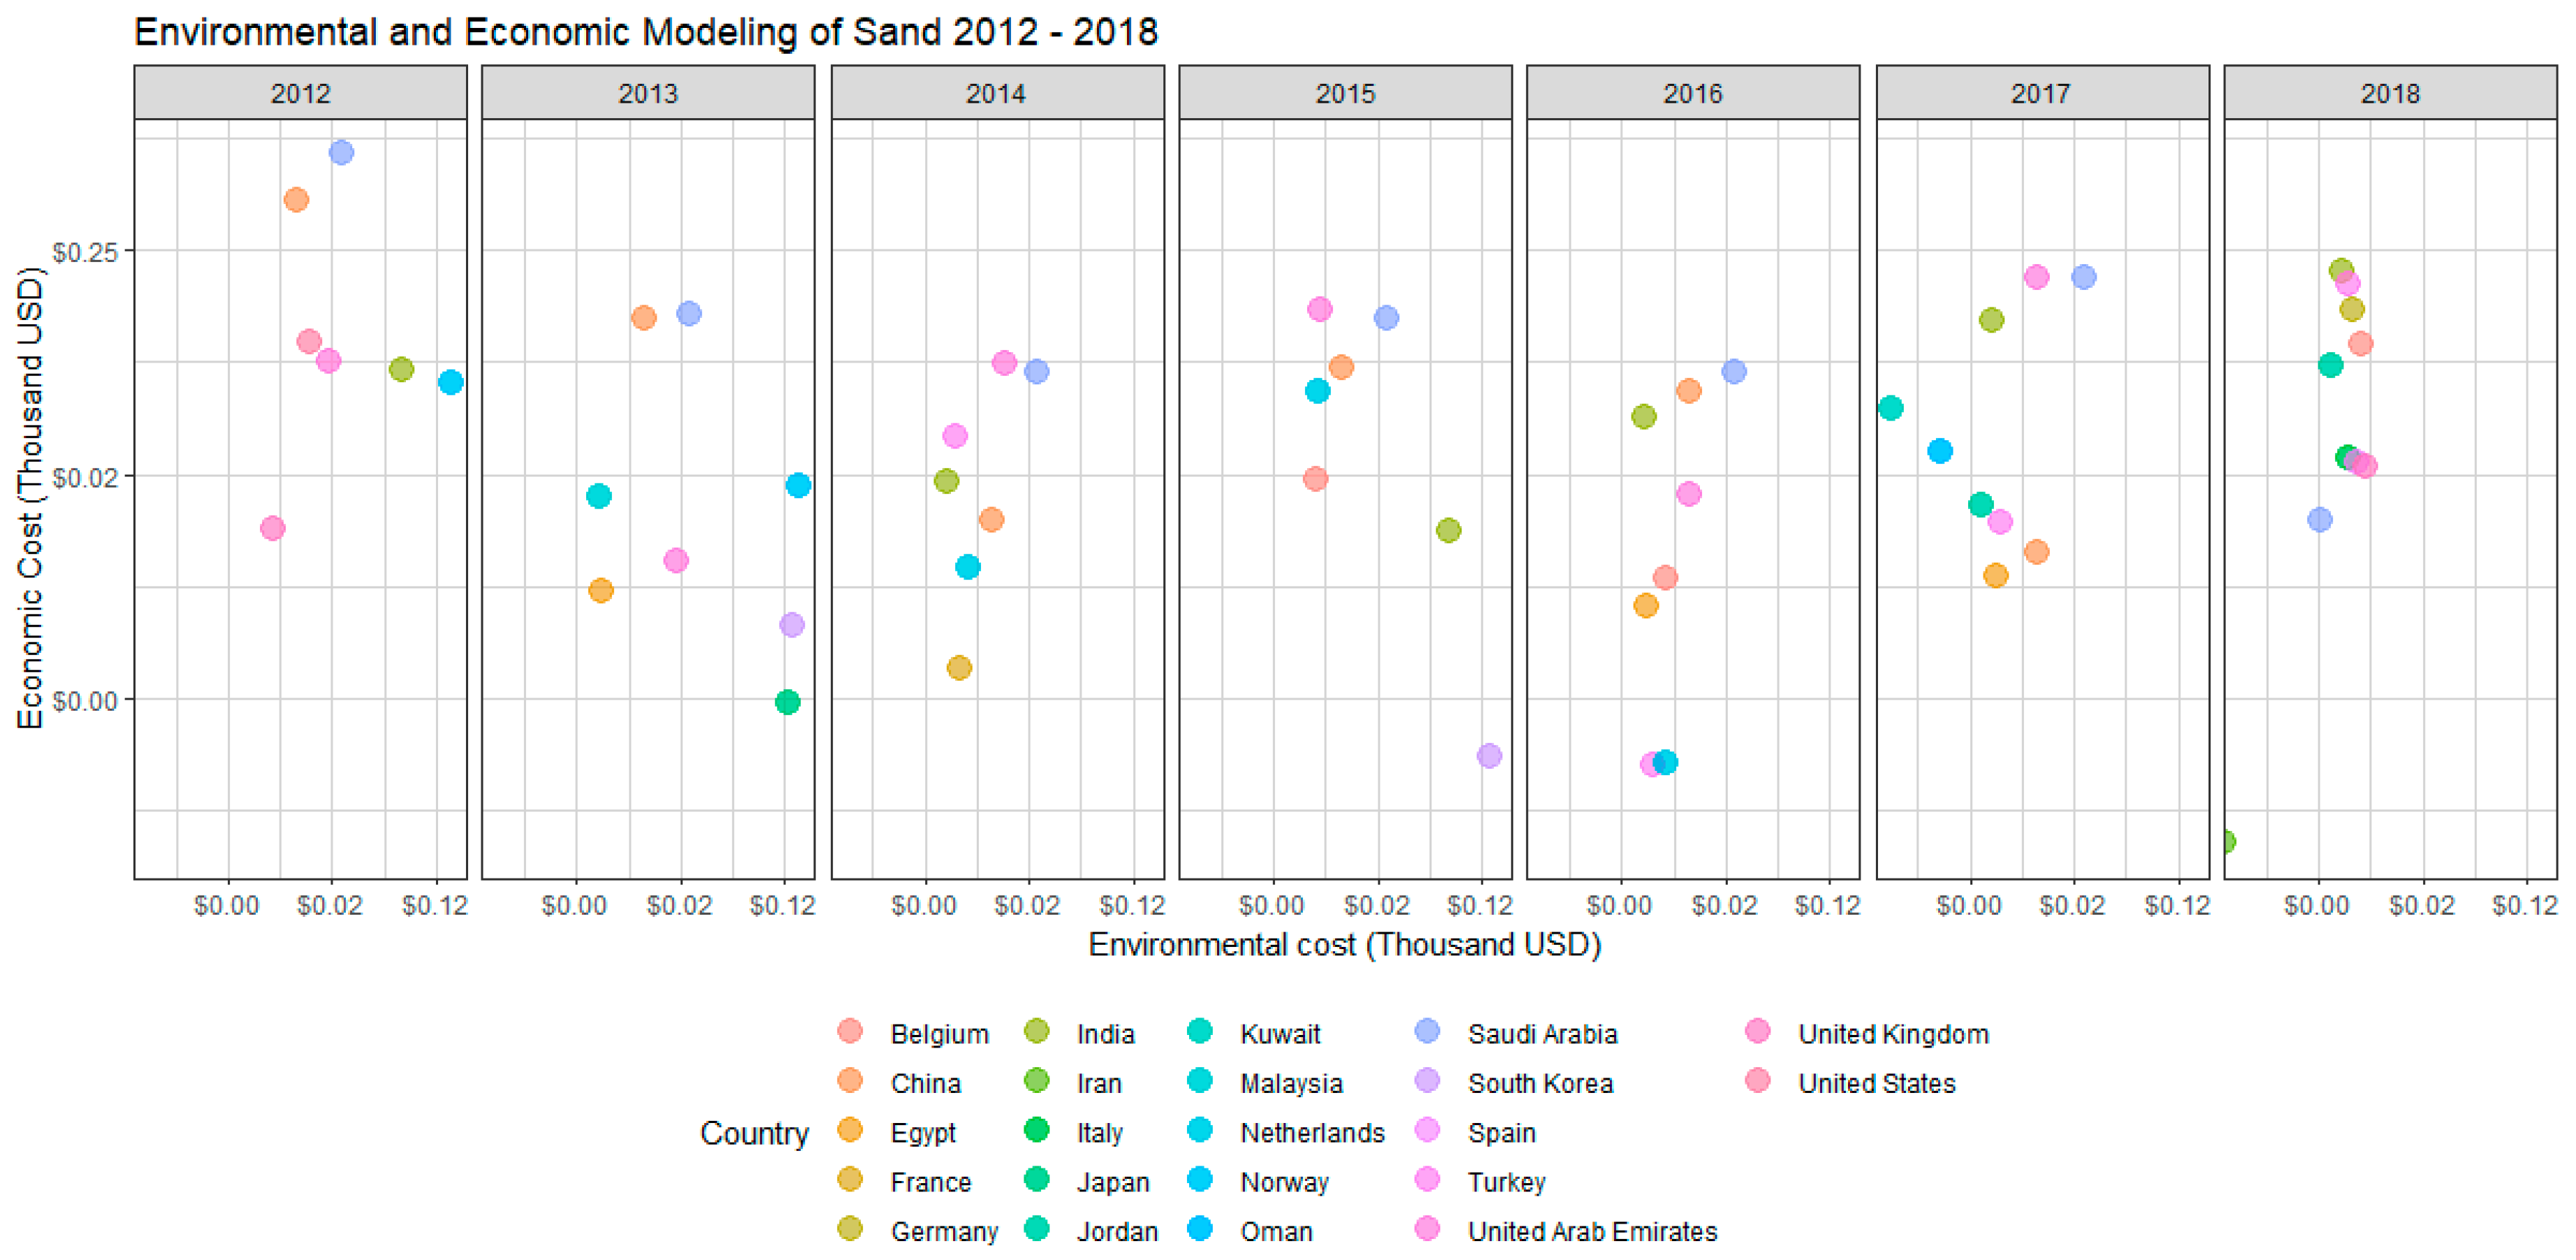
2.5. Environmental and Economic Modeling

Environmental and economic modeling is designed to serve as a decision-making tool that delivers a method to assess the environmental and economic effects of transport processes in a supply chain by considering several variables. The variables used in the calculation of the environmental and economic modeling analysis were transportation distance, mode of transportation, the quantity of imports, import demand, the number of trips, carbon tax, and the cost per ton of material (Figure 2)
The model provides an overview analysis of combined environmental and economic factors. Environmental and economic modeling mainly converts GHG emissions to U.S. dollars and adds them to the economic cost. GHG emissions are calculated and normalized to (ton/kg.km) using GREET. An environmental and economic modeling analysis helped to represent the environmental impact in terms of money by utilizing the carbon tax value in 2019. The carbon tax value used was 24.16 U.S. dollars [73]. This allowed the analysis to be expanded by combining the environmental analysis with the economic analysis, thereby allowing us to obtain an optimum objective function. The overall environmental and economic modeling analysis was accomplished through the following equations:
Total   cost   ( $ ) = Economic   cost   ( $ ) + Economic   cost   ( $ ) Total   cost ( $ ) = [ Raw   material   costs   ( $ ton ) × Quantity   of   material   imported   ( ton ) × Number   of   trips   traveled   to   cover   the   demand   from   one   supplier ] + [ ( Quantity   of   CO 2 eq ( land ) ( ton ) + Quantity   of   CO 2 eq ( sea ) ( ton ) + Quantity   of   CO 2 eq ( in land ) ( ton ) ) × Carbon   tax   ( $ / ton )
The optimum result would have the lowest value, considering the economy and environment. Thus, a decision-maker can select to import the construction material from a supplier based on the environmental and economic impacts.

2.6. Environmental Forecasting Method

The forecast analysis was based on the compiled data previously mentioned in this research. To establish a forecast of materials, the survey conducted by Qatar’s Ministry of Development Planning and Statistics was taken into consideration as the absolute figure of demand for the required materials. Using the CO2-e generated for each scenario (pre- and post-blockade), total carbon emissions were calculated based on the demand of each material.

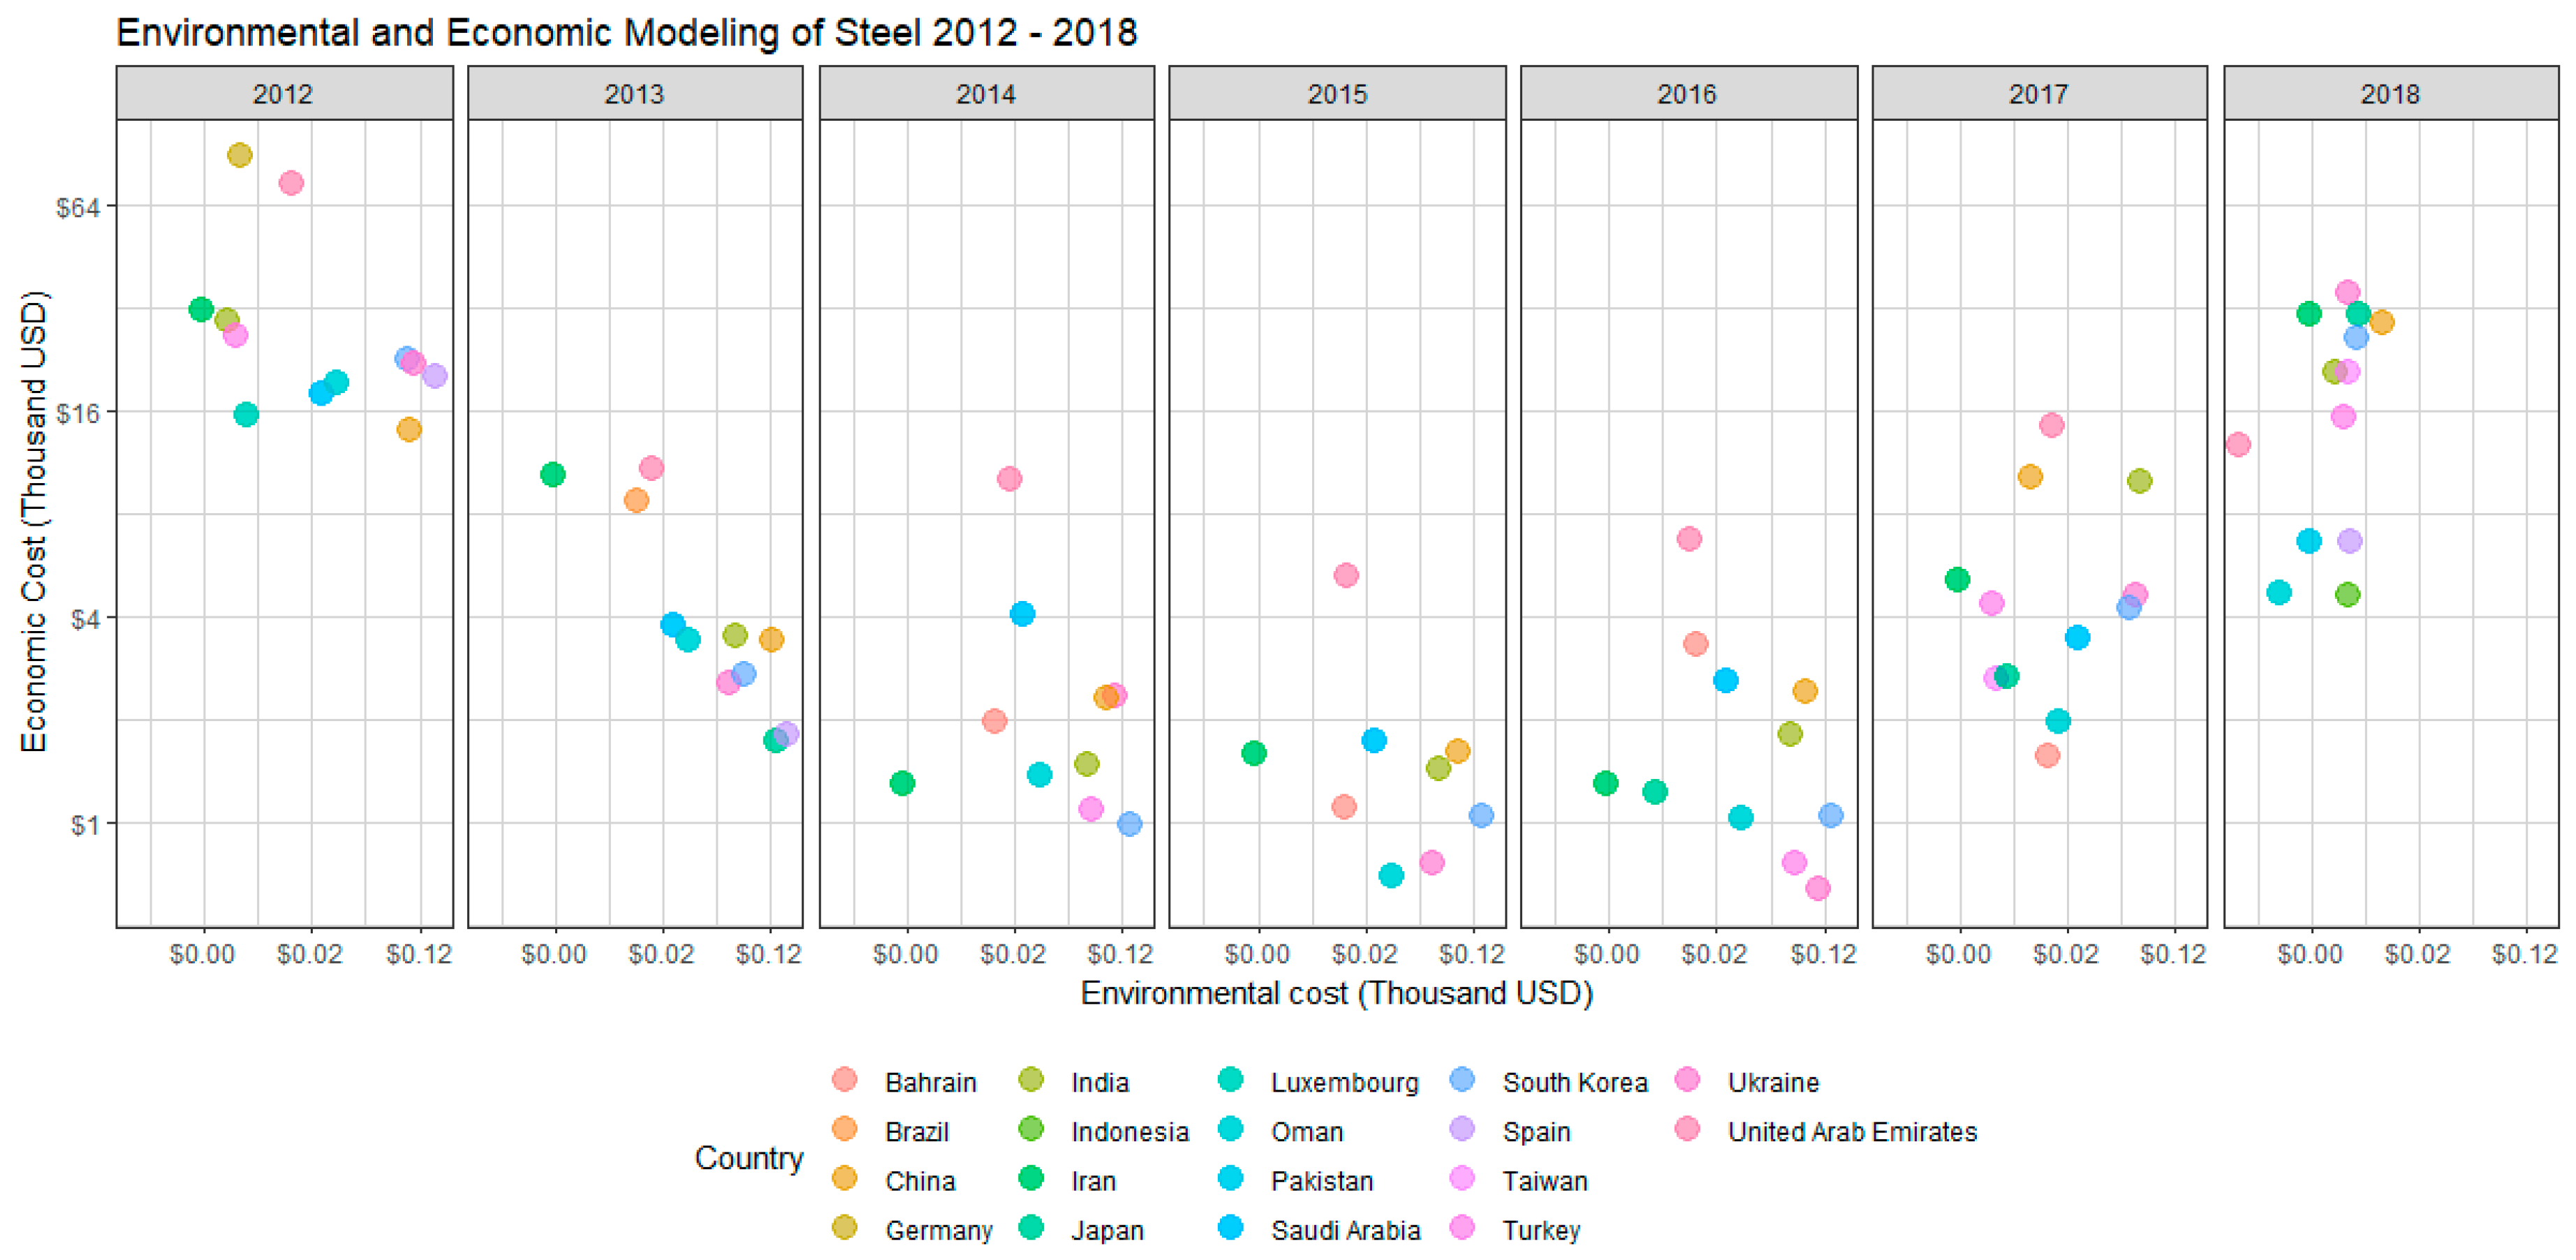
3. Results and Discussion

Fifty-two estimations were simulated using the GREET model to quantify the environmental impact of different transportation modes in two different subperiods—six years before the geopolitical crisis and one year after the event. The results are classified as follows.

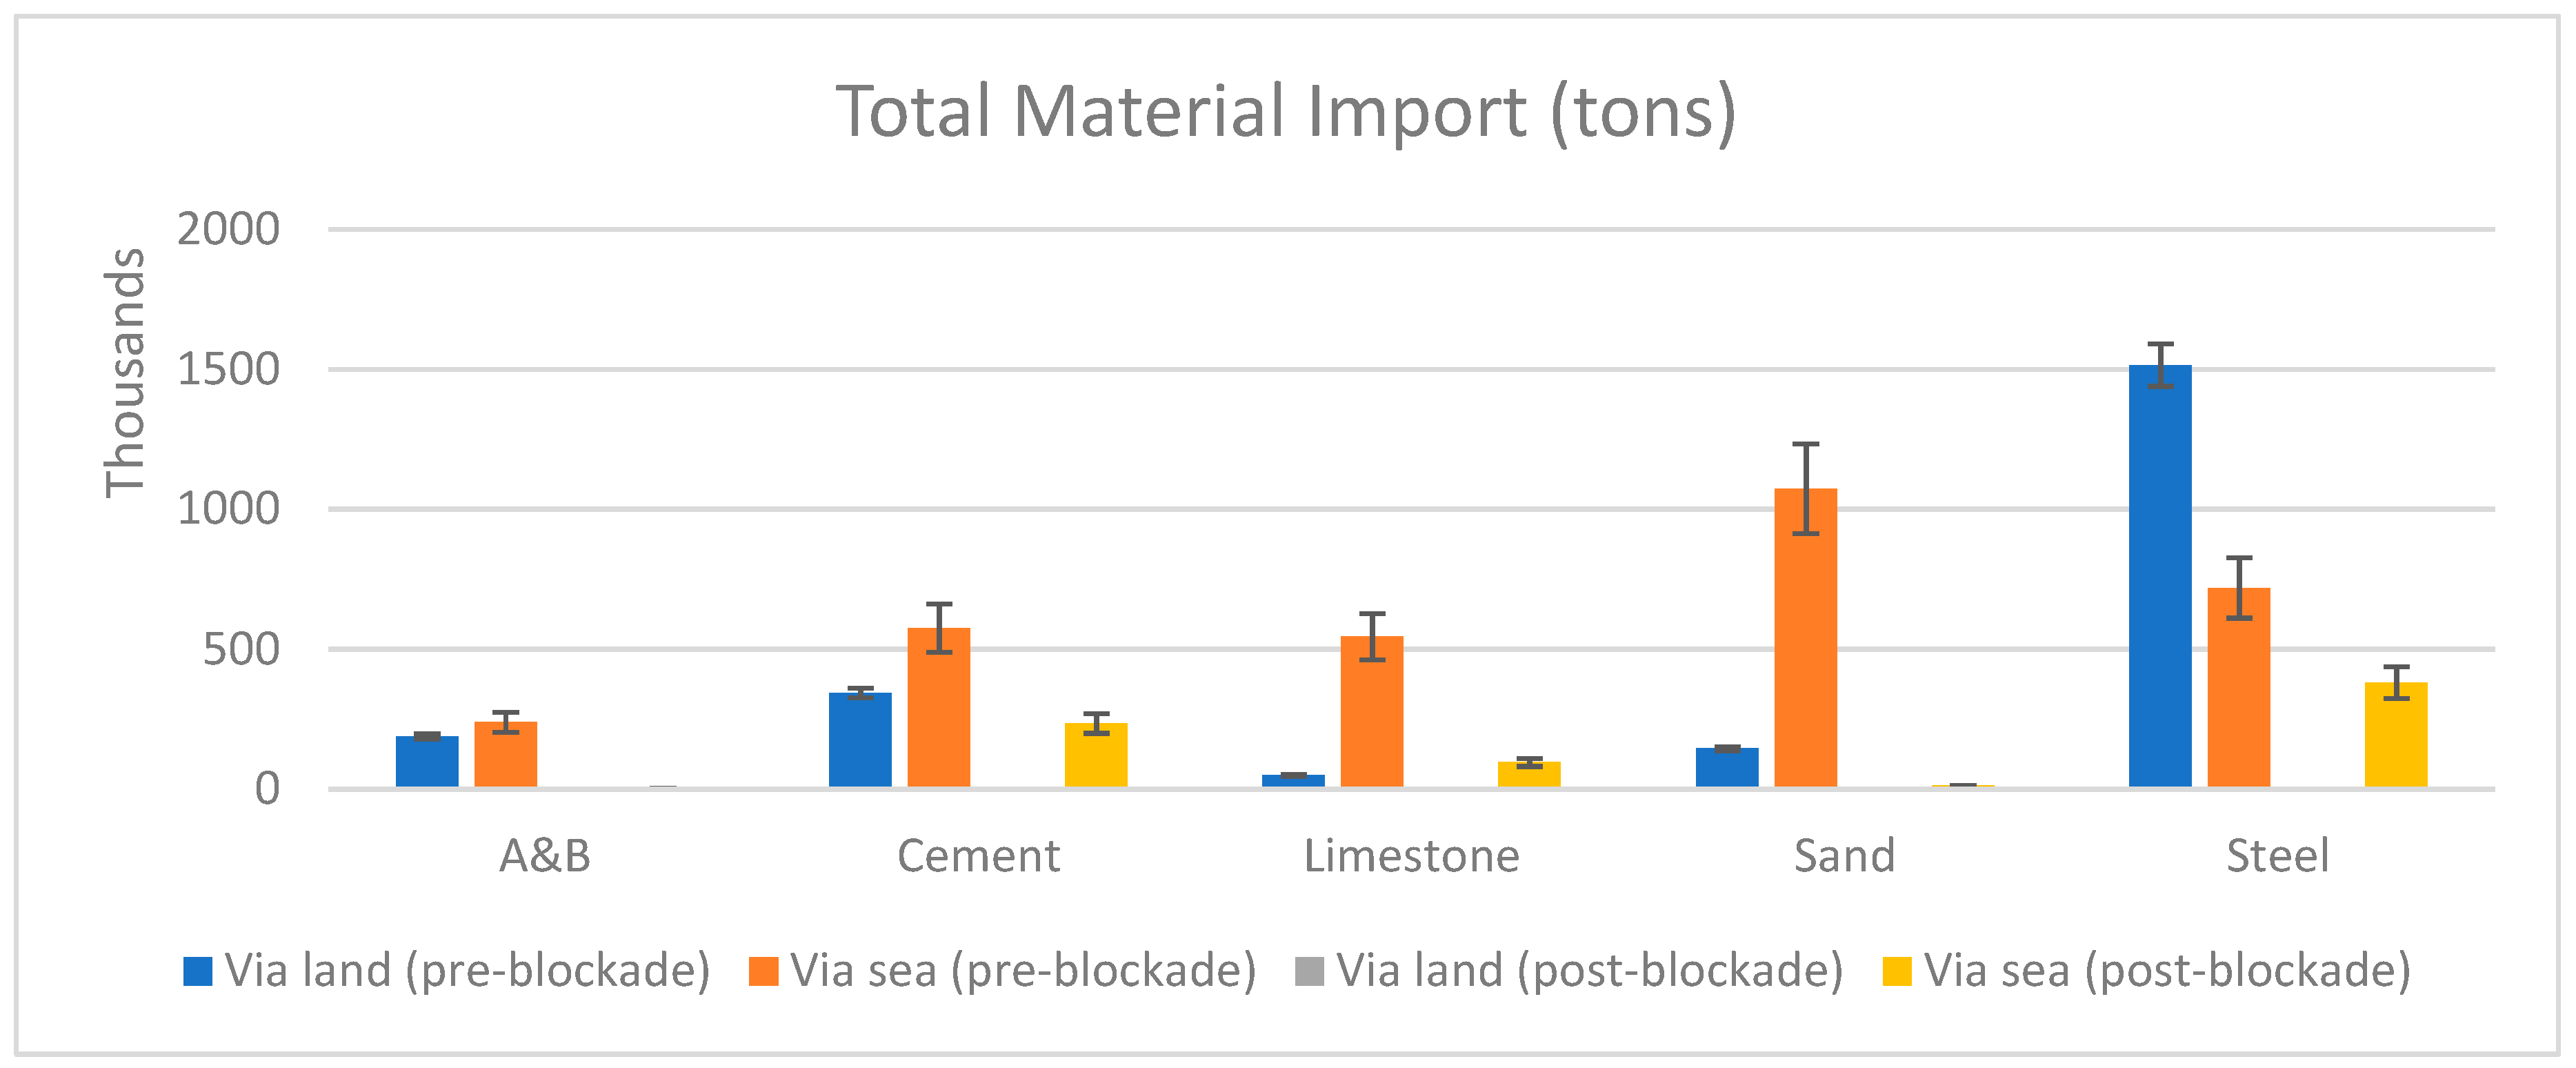
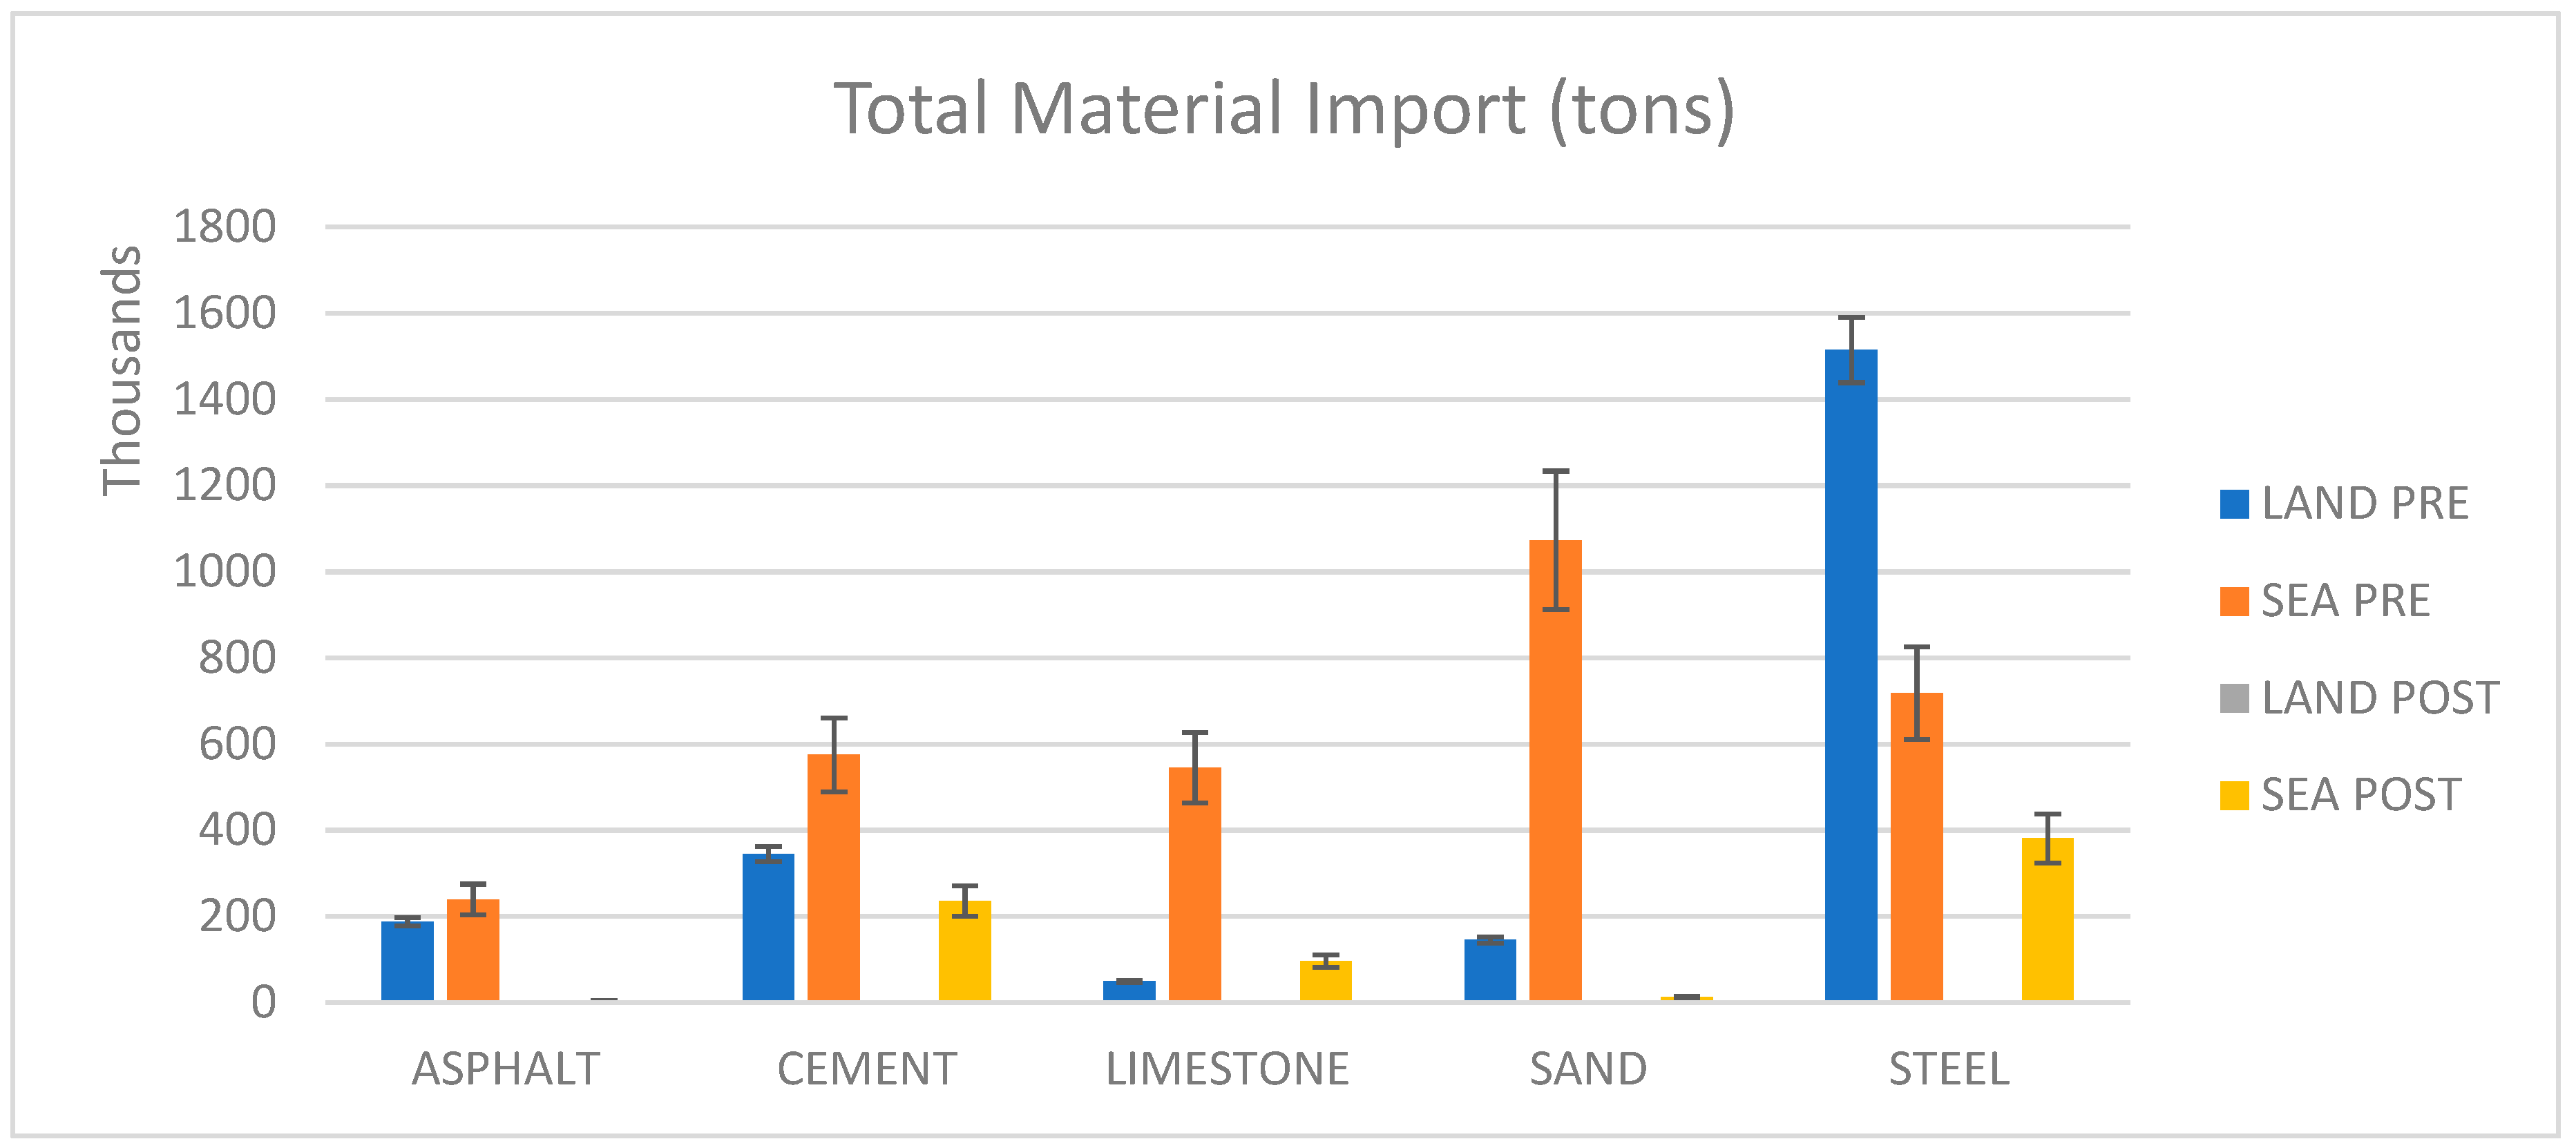
3.1. Results Based on Quantities of Imported Construction Materials

The results showed that the quantities of asphalt, cement, limestone, sand, and steel imported into Qatar in 2018 decreased compared with the quantities imported before the crisis (Figure 3). In addition, after the crisis in 2018, there was a major reliance on sea transport, given Qatar’s importation of materials from more distant countries.

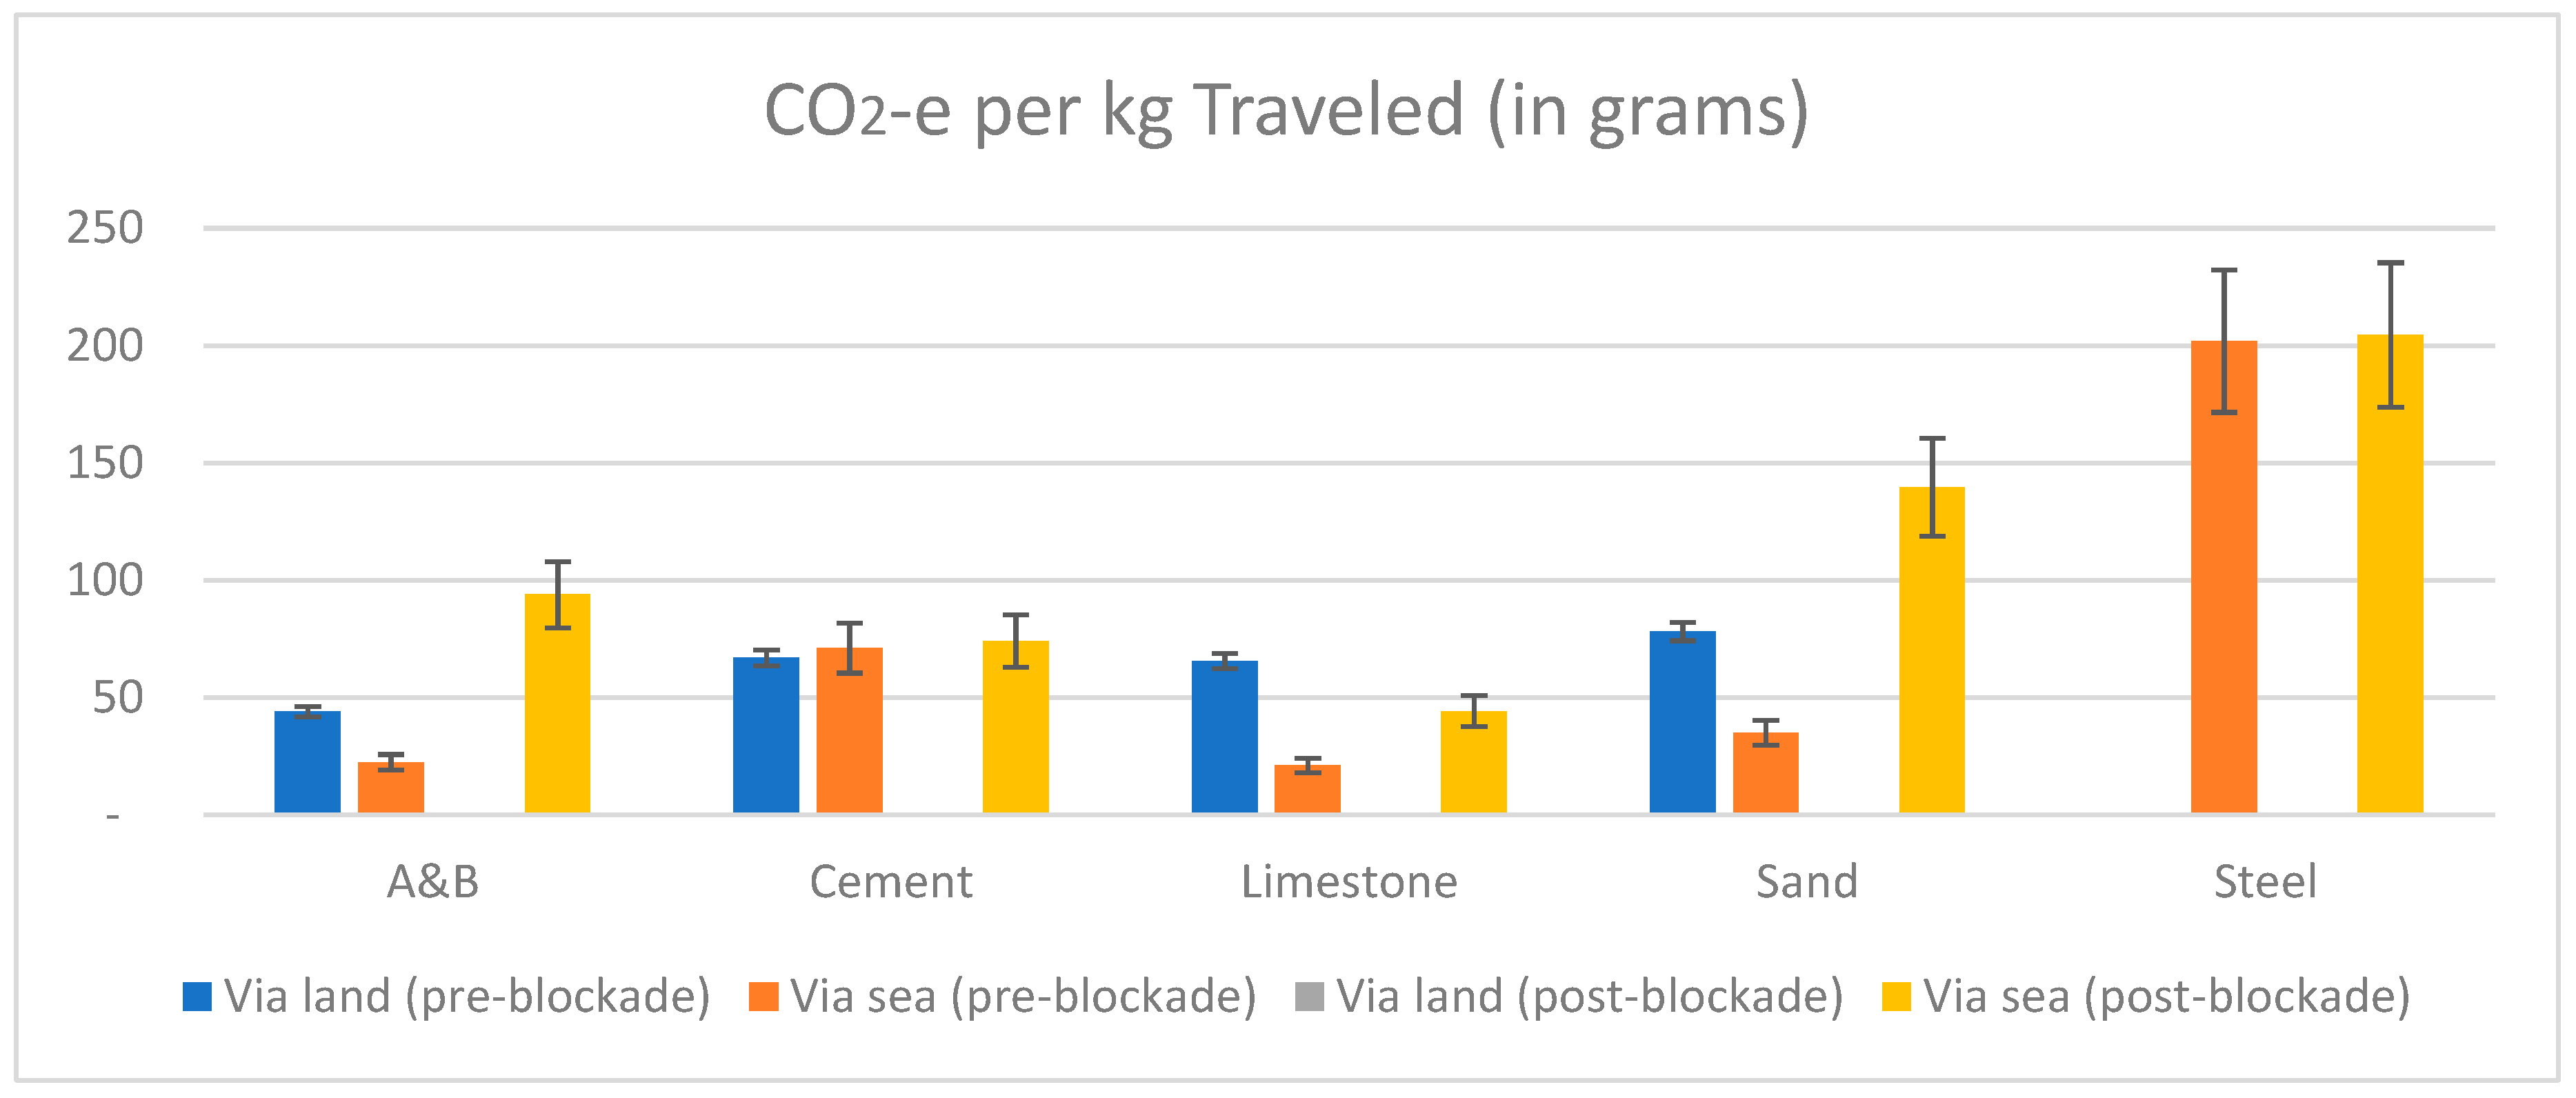
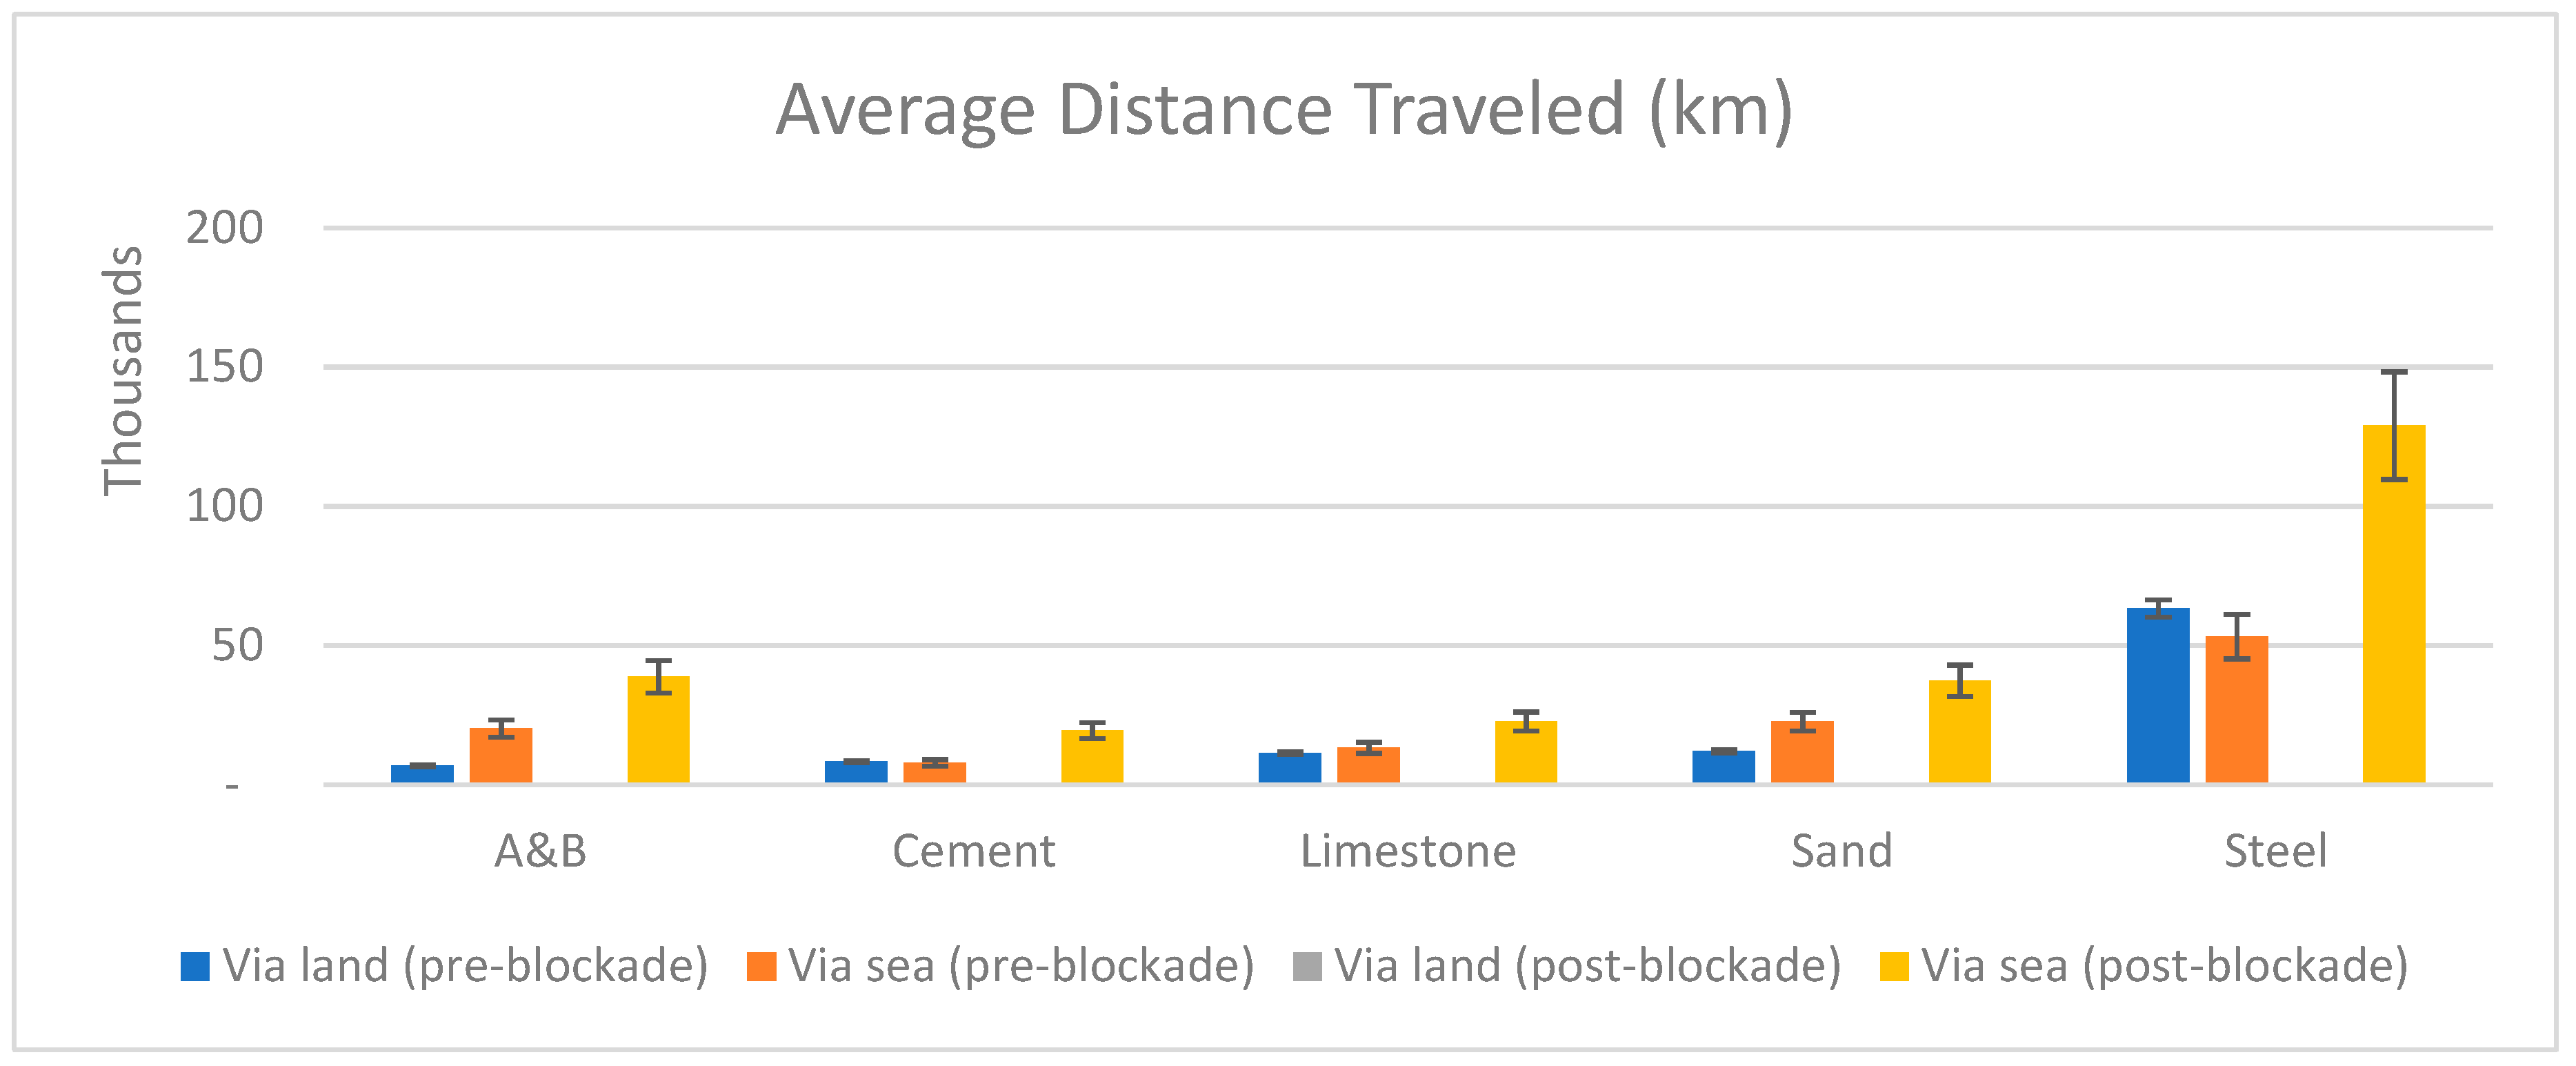
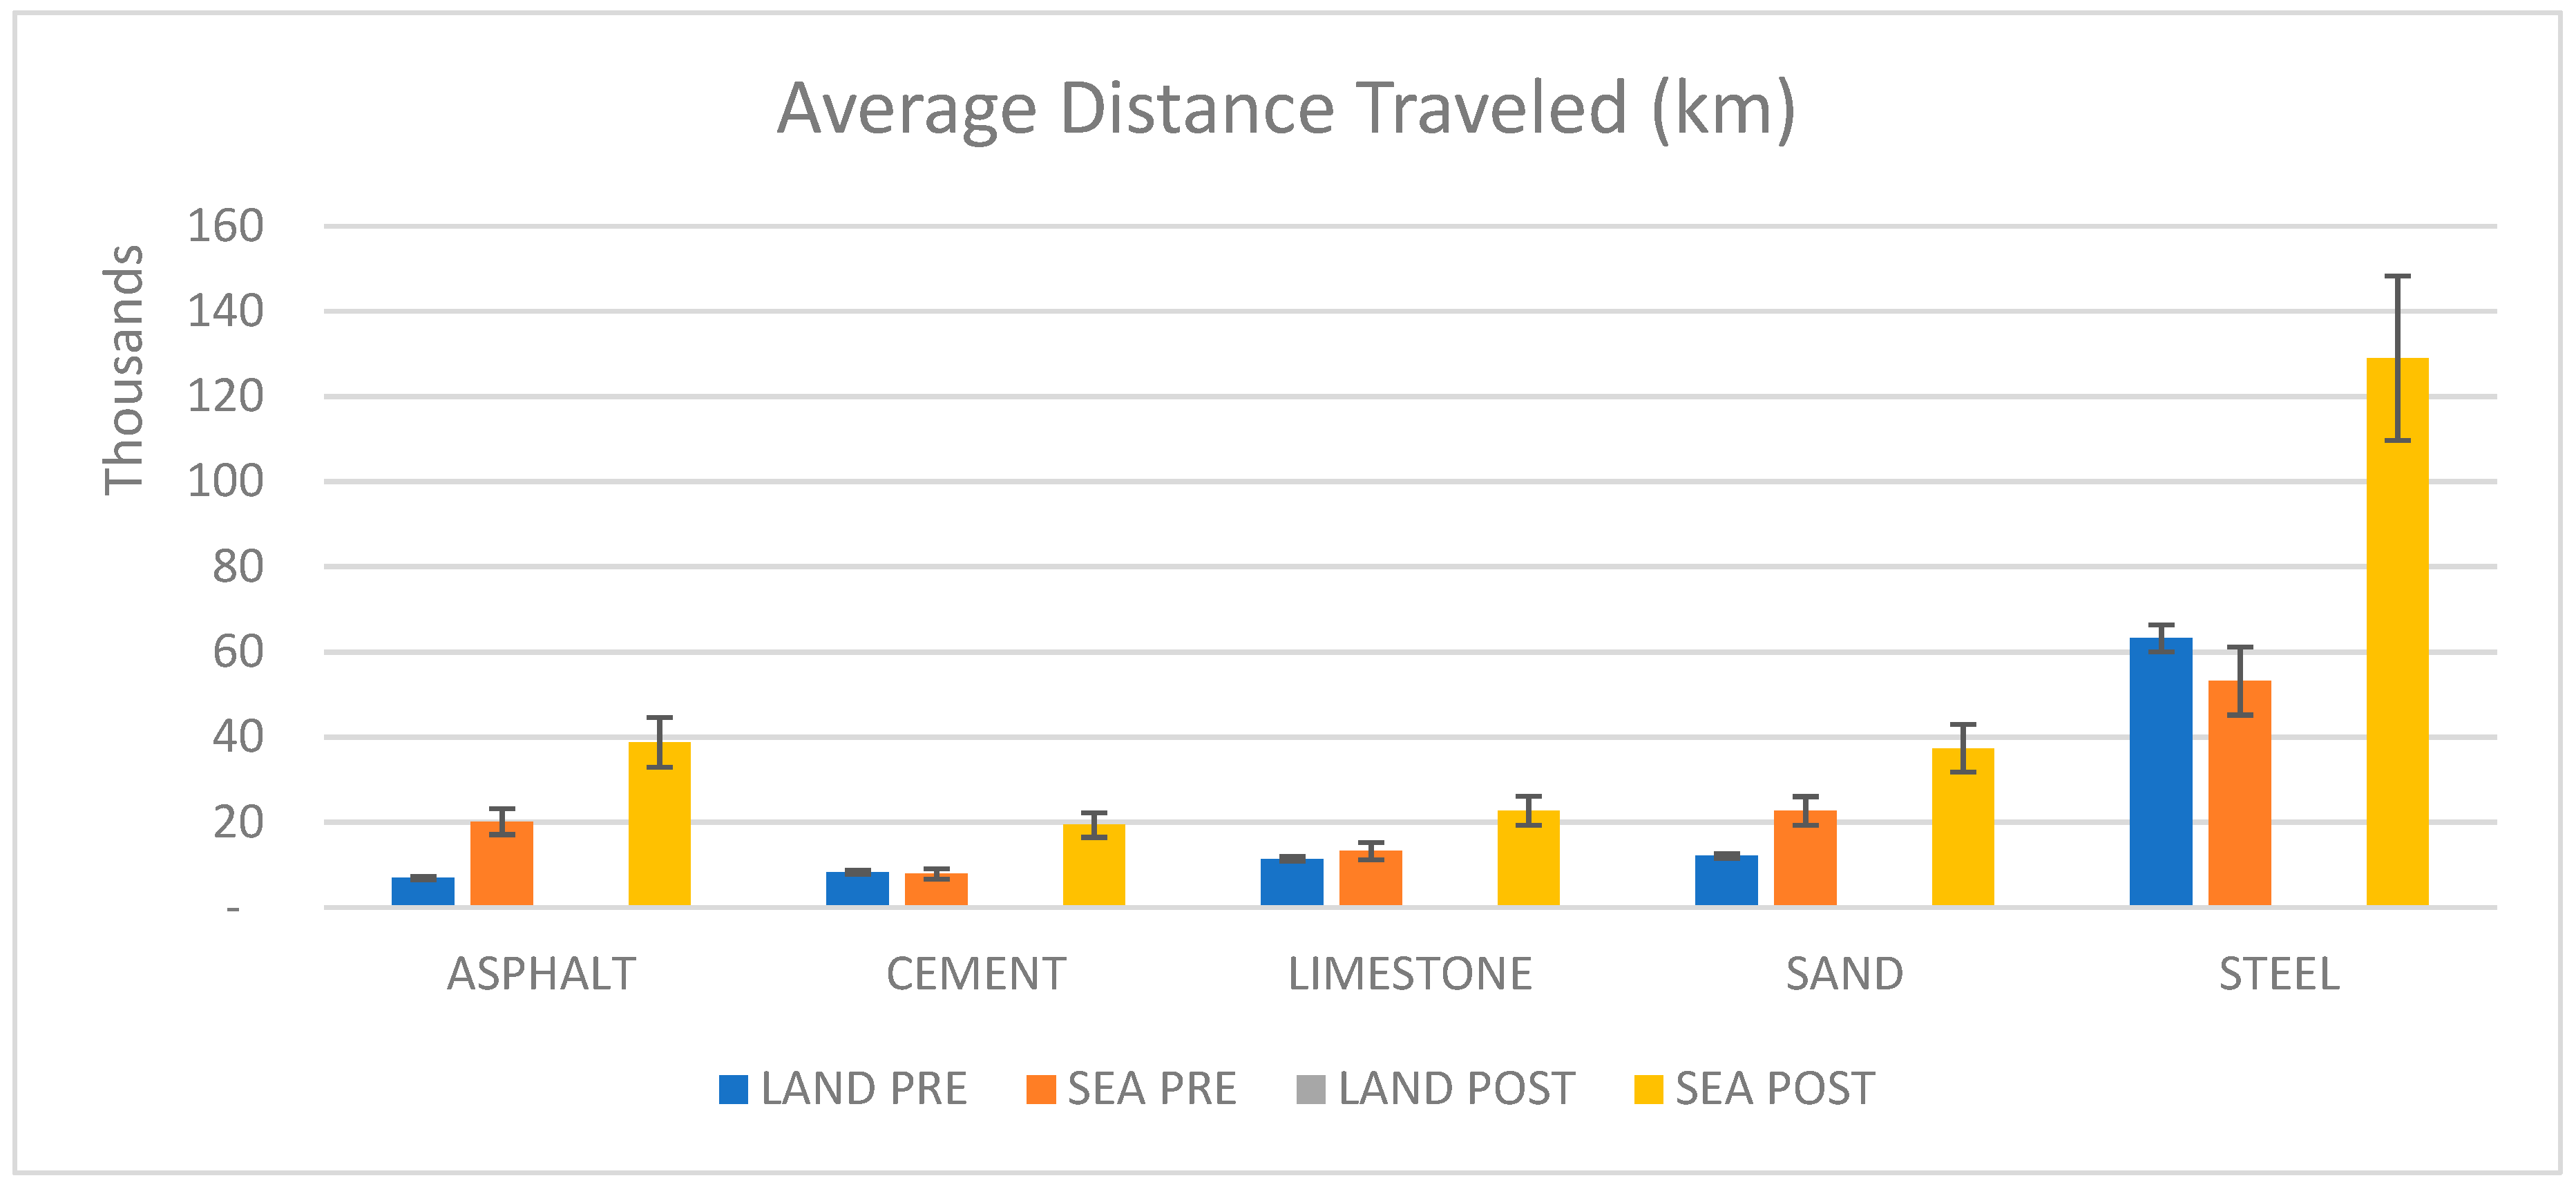
3.2. Results Based on Distance Traveled by Each Material

Before the 2017 crisis, Qatar received most of the required construction materials from neighboring countries; therefore, these materials traveled relatively short distances. In the year that the geopolitical crisis occurred, the travel distances became shorter than those pre-crisis. In 2018, the distances that each material traveled increased because of the need to import construction materials from other countries. The data represented in Figure 4 indicate the average distance traveled by construction materials imported into Qatar.

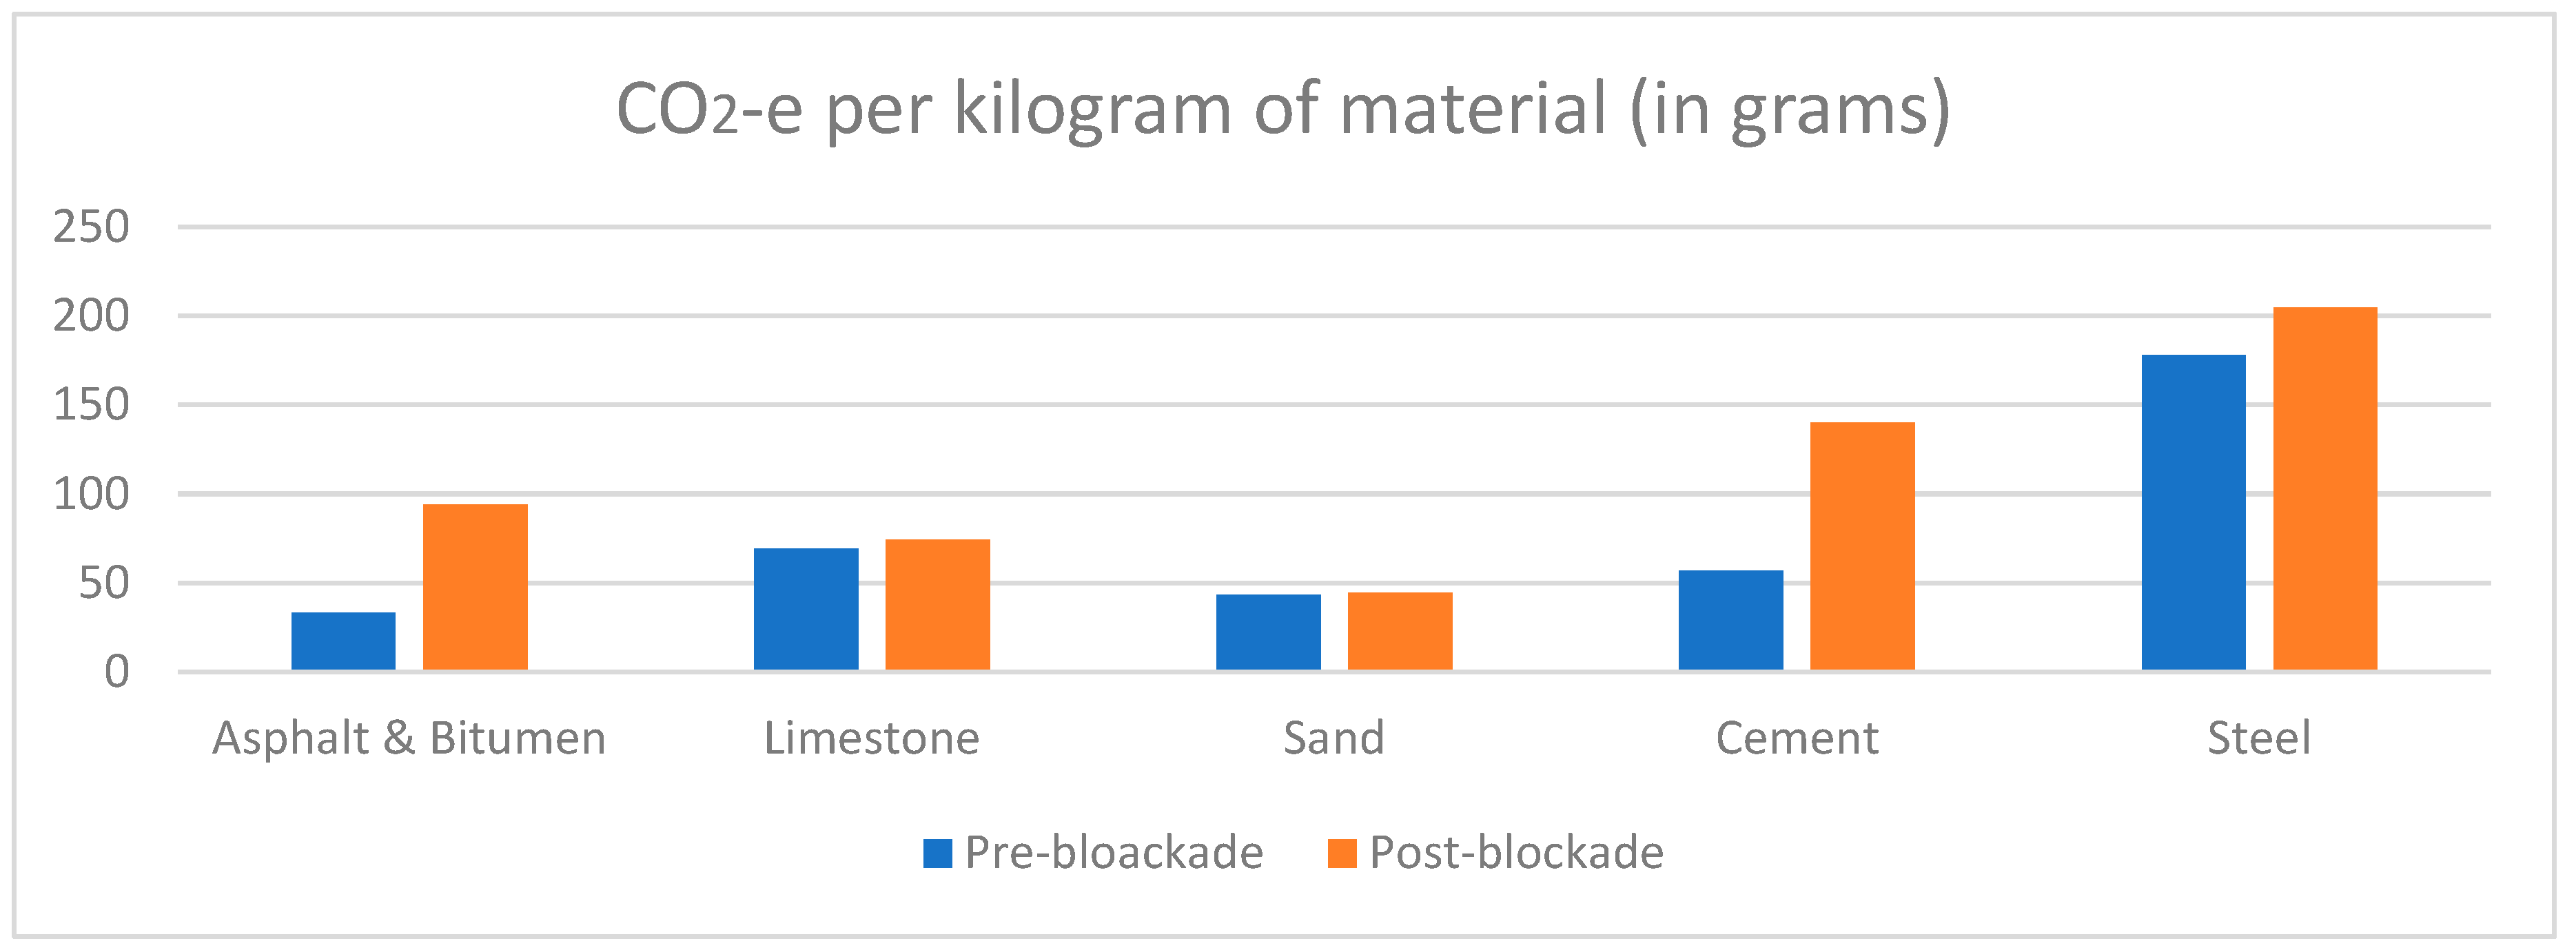
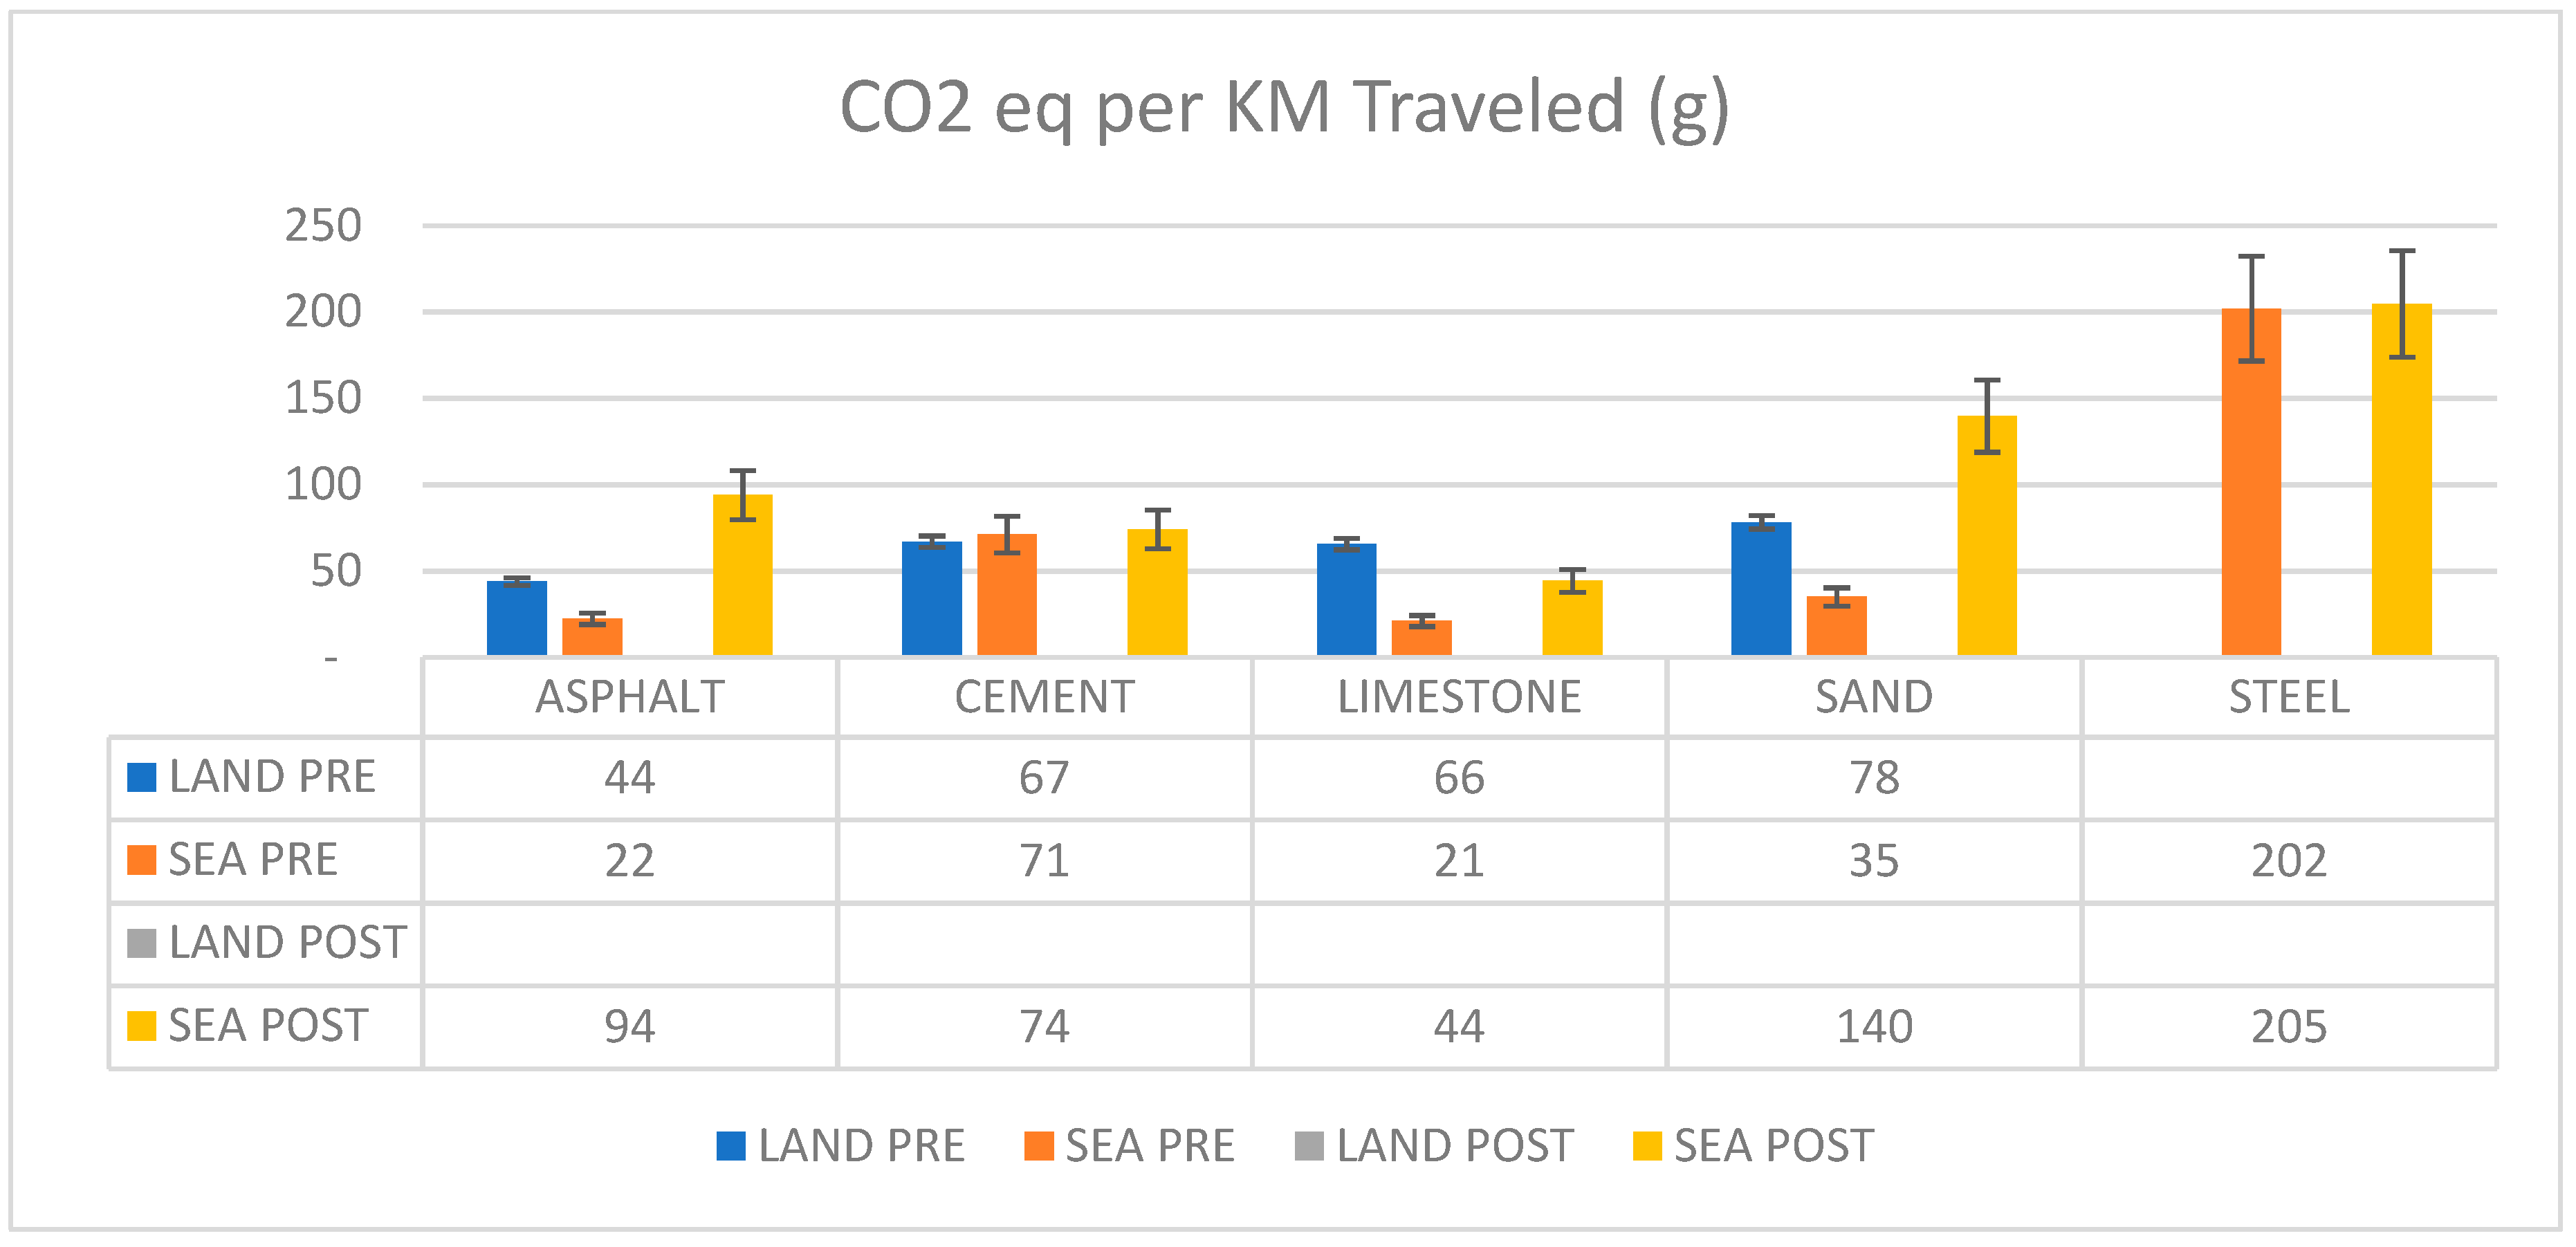
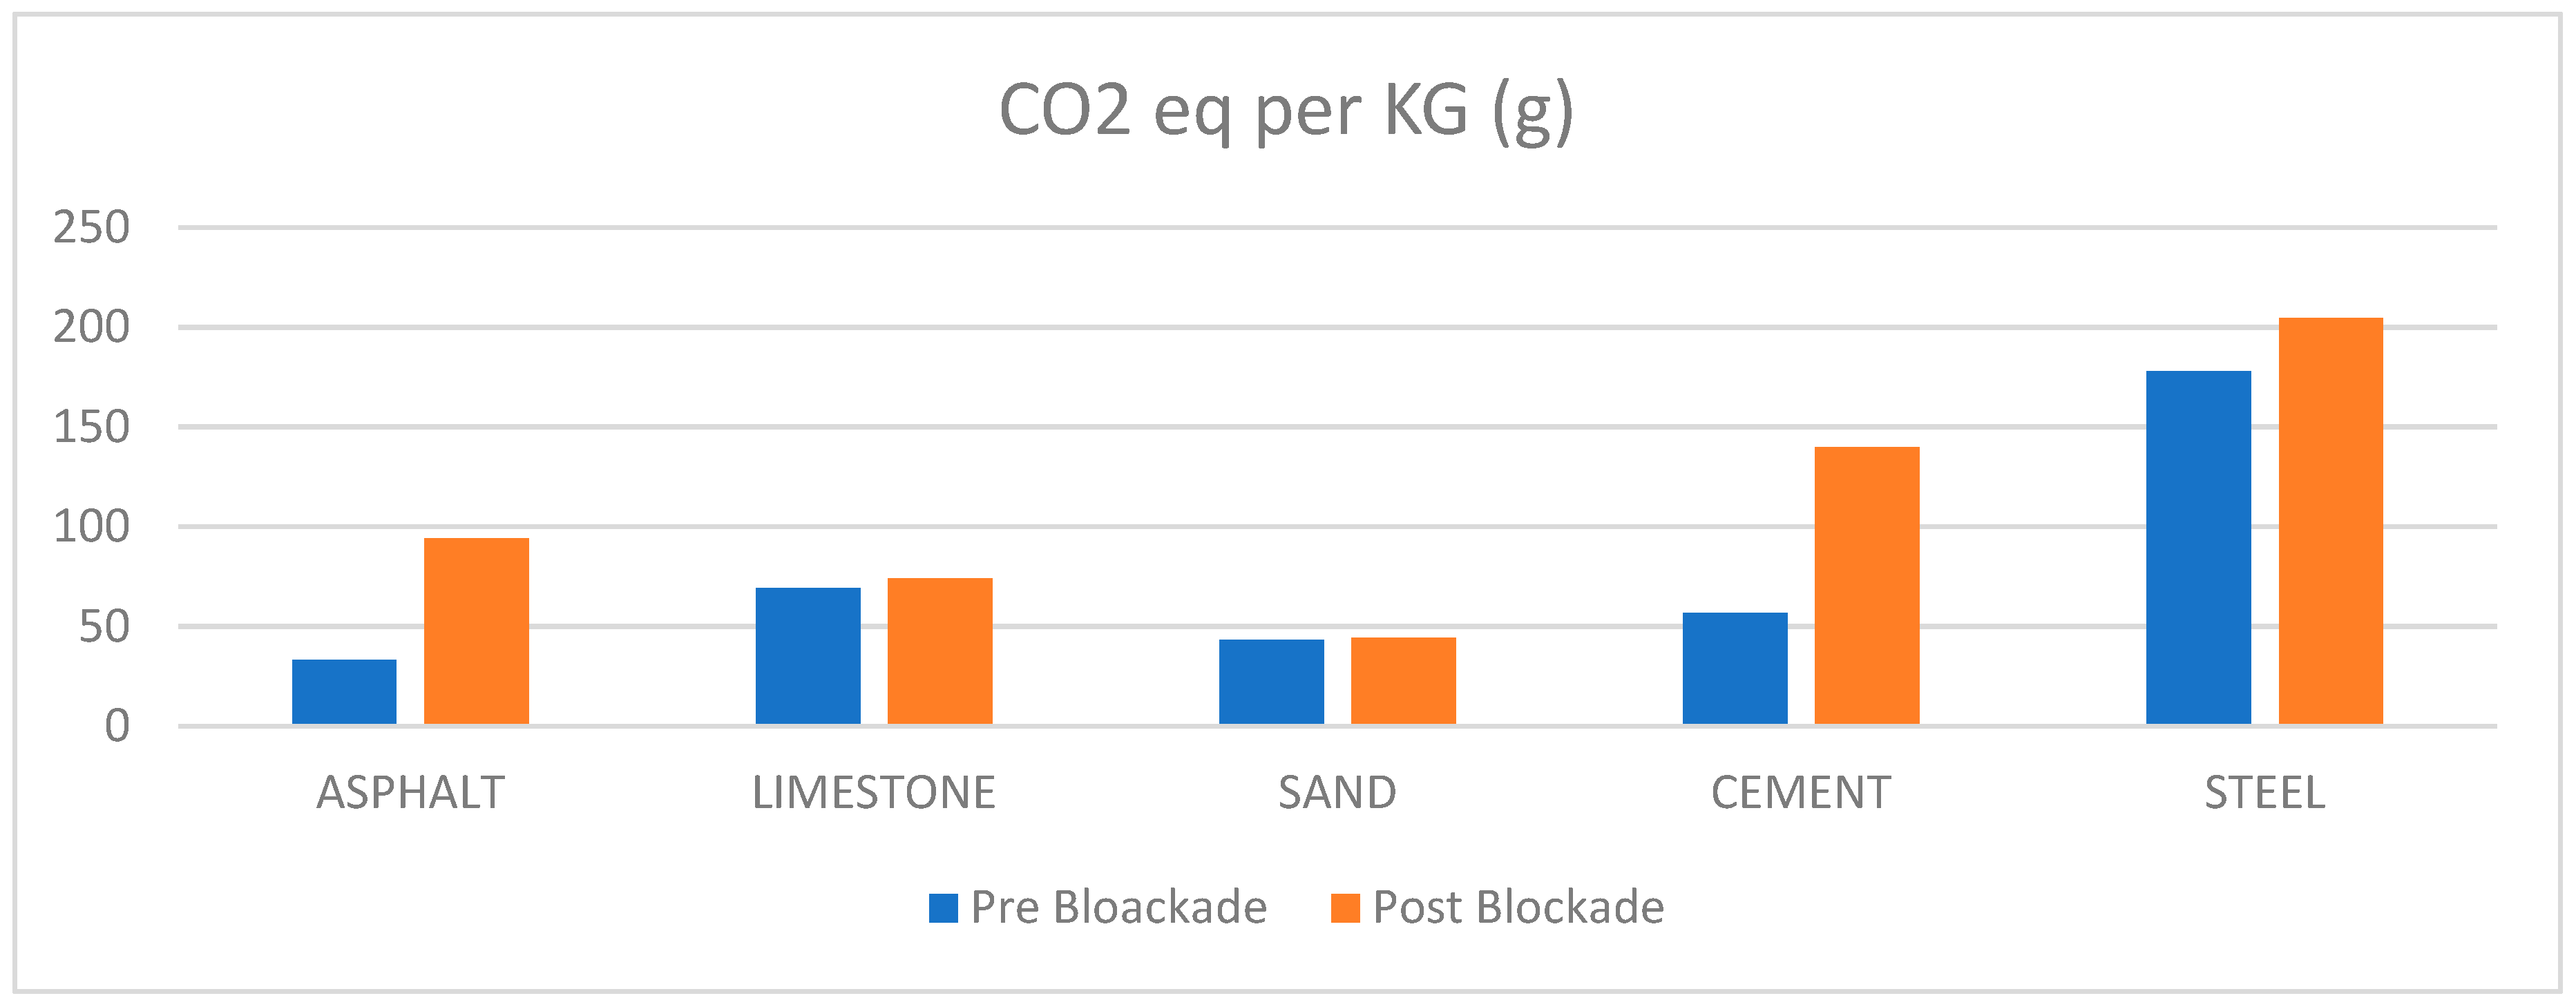
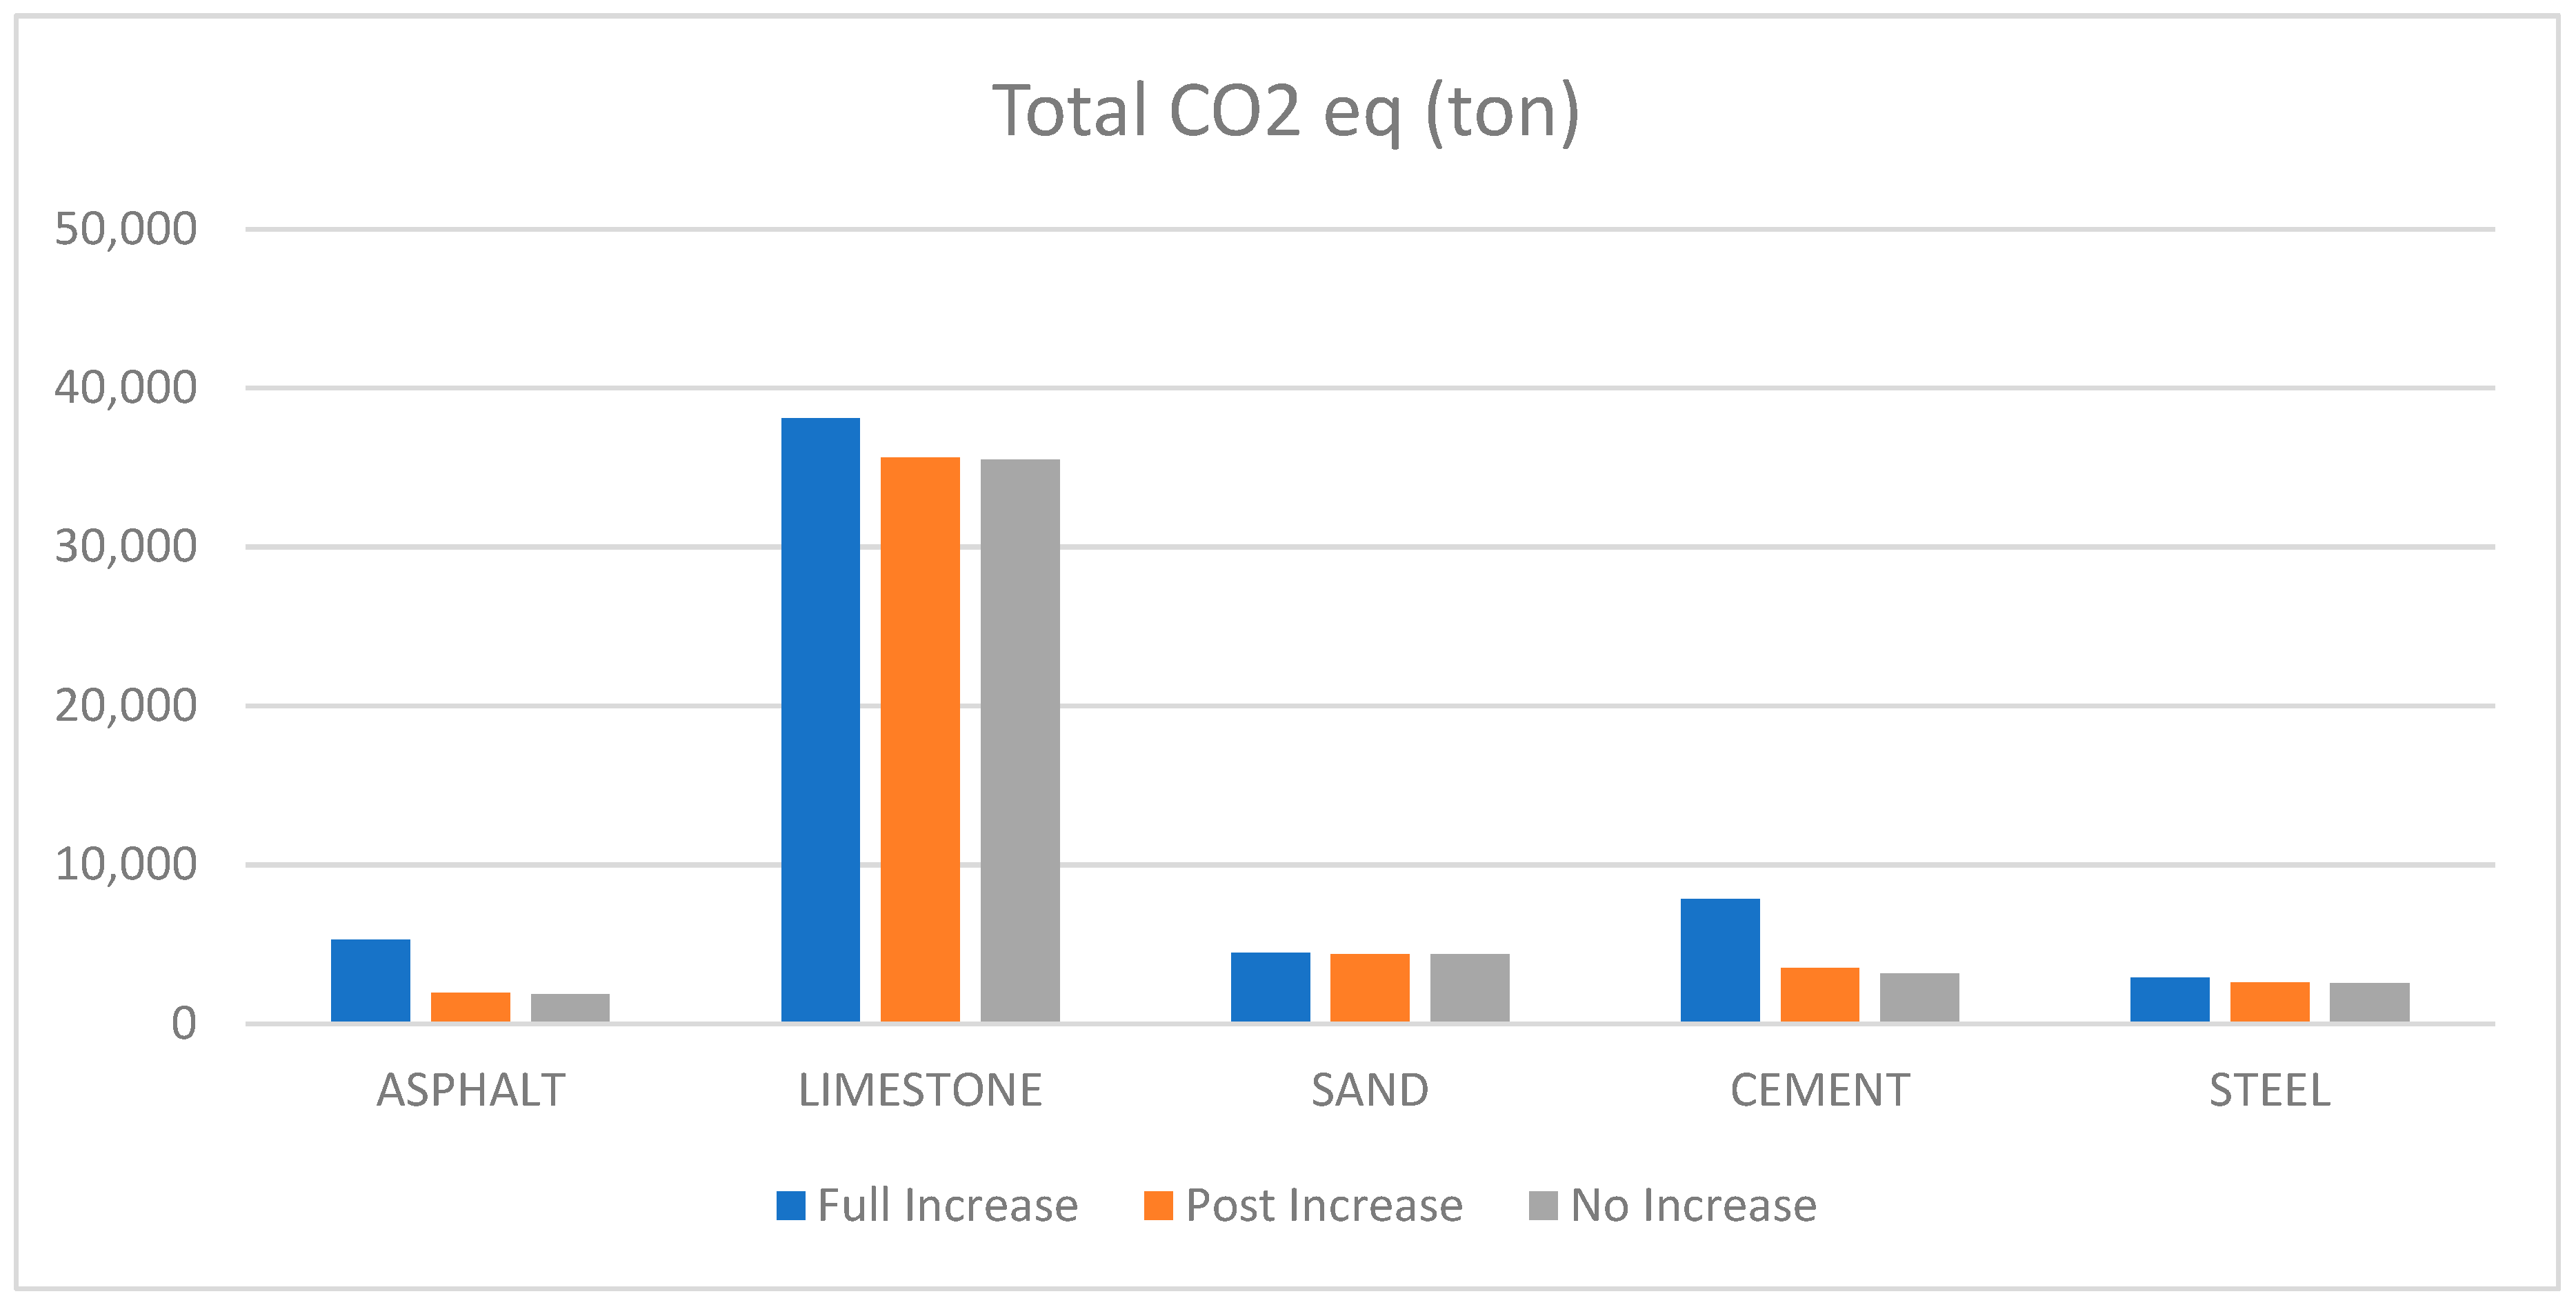
3.3. Results Relating to GHG Emissions

Data were generated using the GREET model to determine the amount of CO2-e (in tons) emitted per 1 kg traveled by imported construction material transported by land or sea. For all imported construction materials, we calculated CO2-e emissions for quantities of more than 1 ton of traveled construction materials. Overall, we found that the 2018 CO2-e emissions were higher than those pre-crisis (Figure 5). Since the only land port in the State of Qatar was blocked, the graph shows no data of land transport post-blockade.

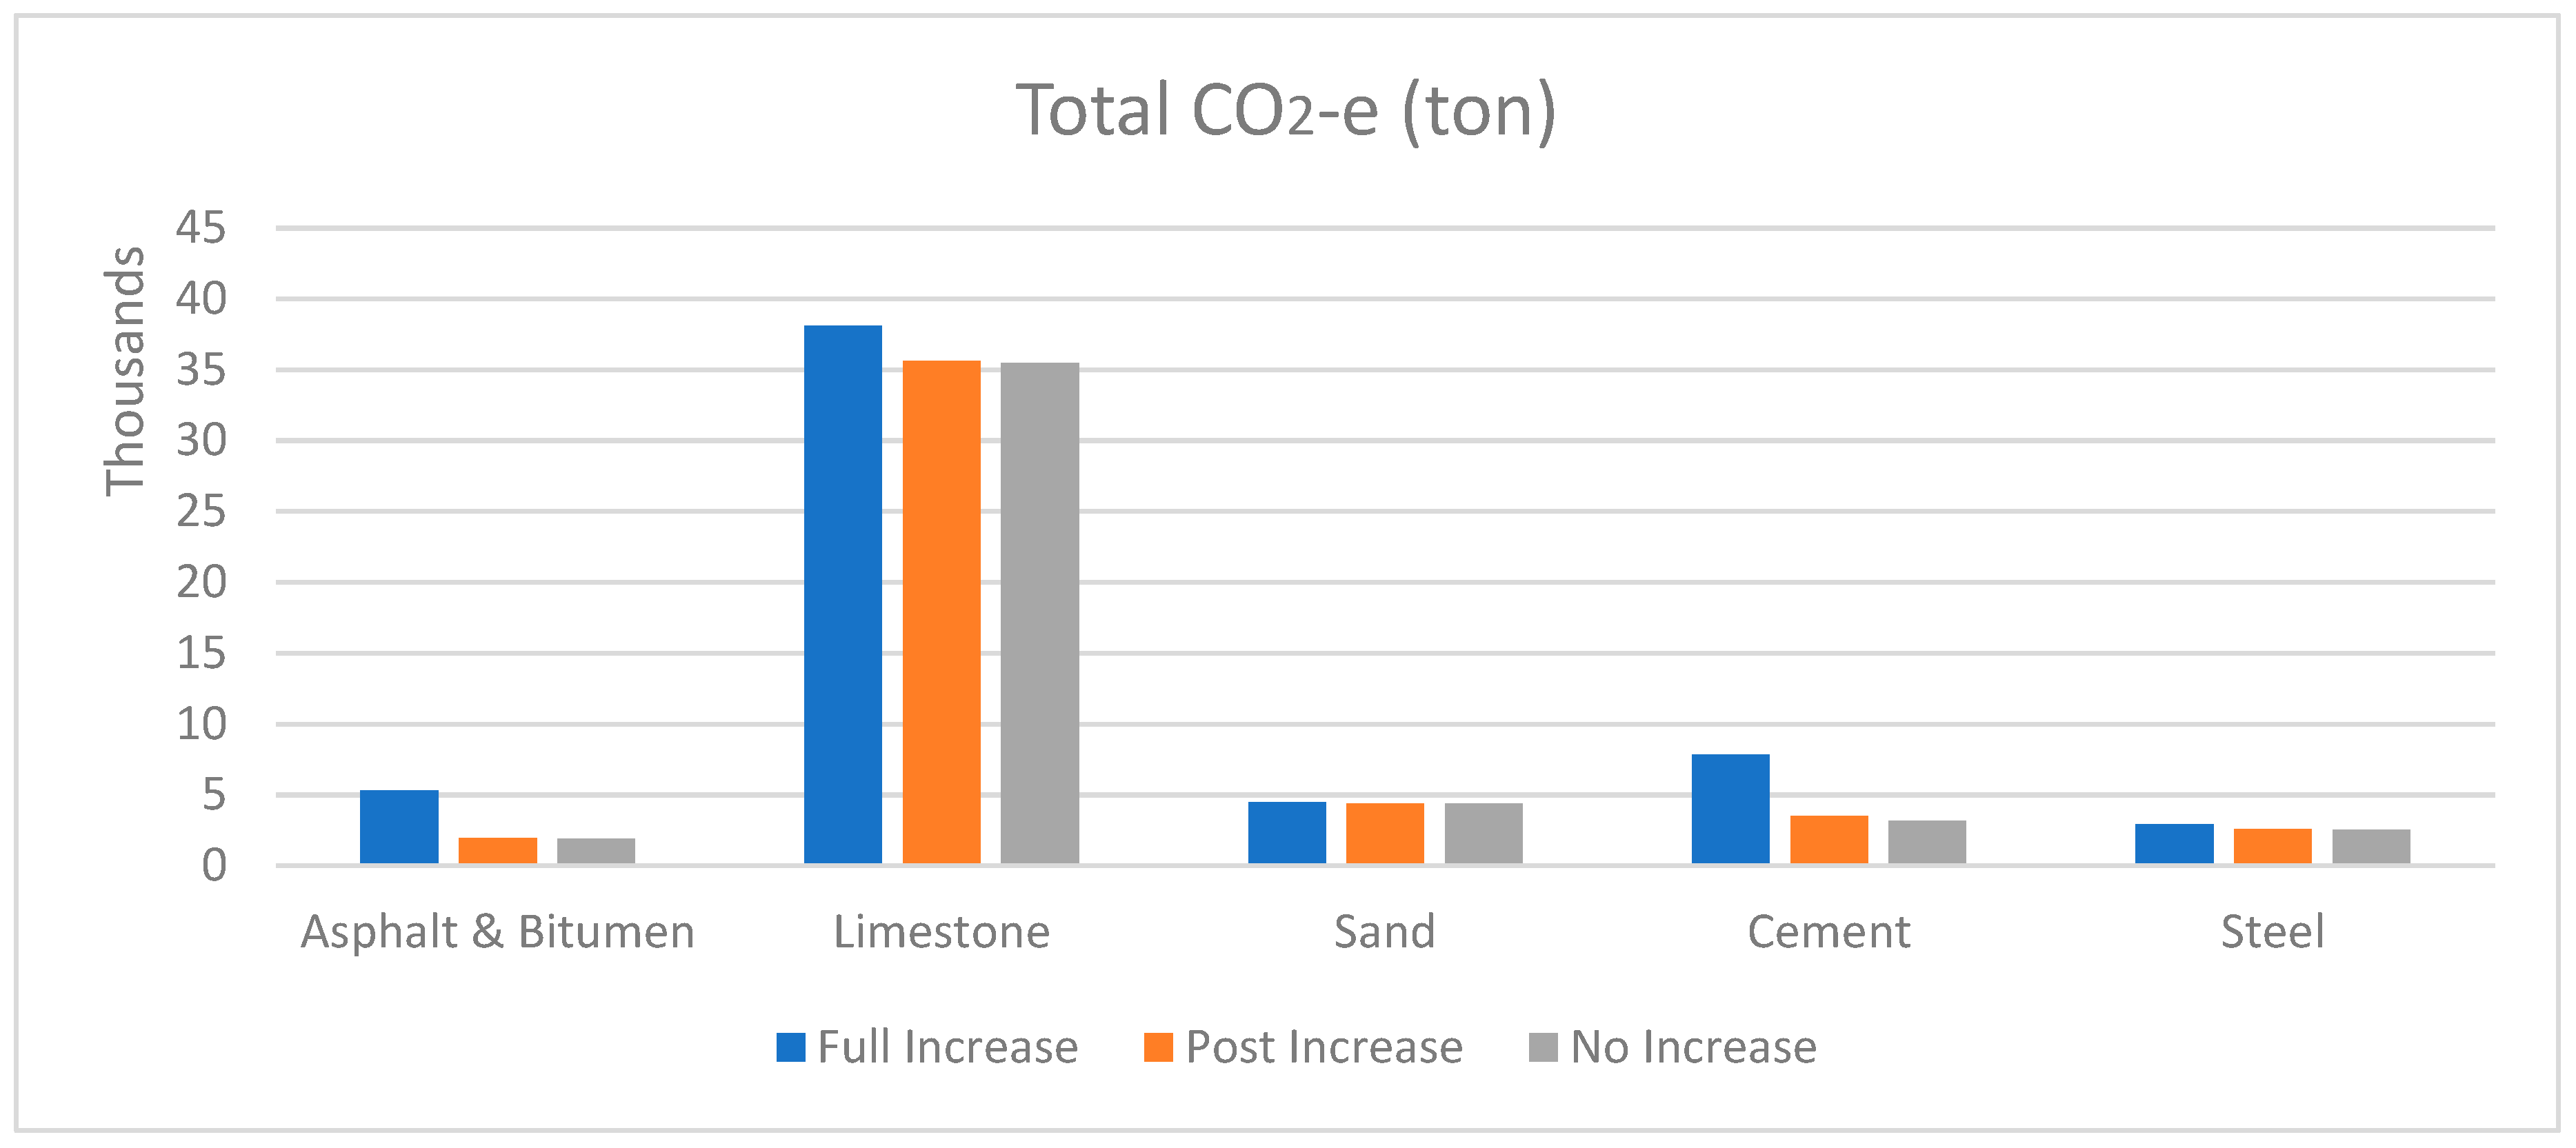
3.4. Environmental Forecast

The CO2-e per kilogram was previously calculated for both the pre- and post-blockades scenarios (Figure 5). An initial analysis presented a significant increase from the pre-blockade scenario to the post-blockade scenario in the average CO2-e per kilogram of material (Figure 6).
Within the combined scenario, because the demand significantly decreased around 2018, the impact was softened when comparing a total figure within the future projection. The increase occurred post-blockade (2018); however, this post-blockade increase was compared to the no increase scenario (i.e., no blockade) and full increase scenario (i.e., blockade occurs in 2012) to represent the relative difference in total carbon emissions within the important materials based on the demanding scheme (Table 2). However, this result was still significant, as it represented the increase in emitted carbon associated with global uncertainties (Figure 7).

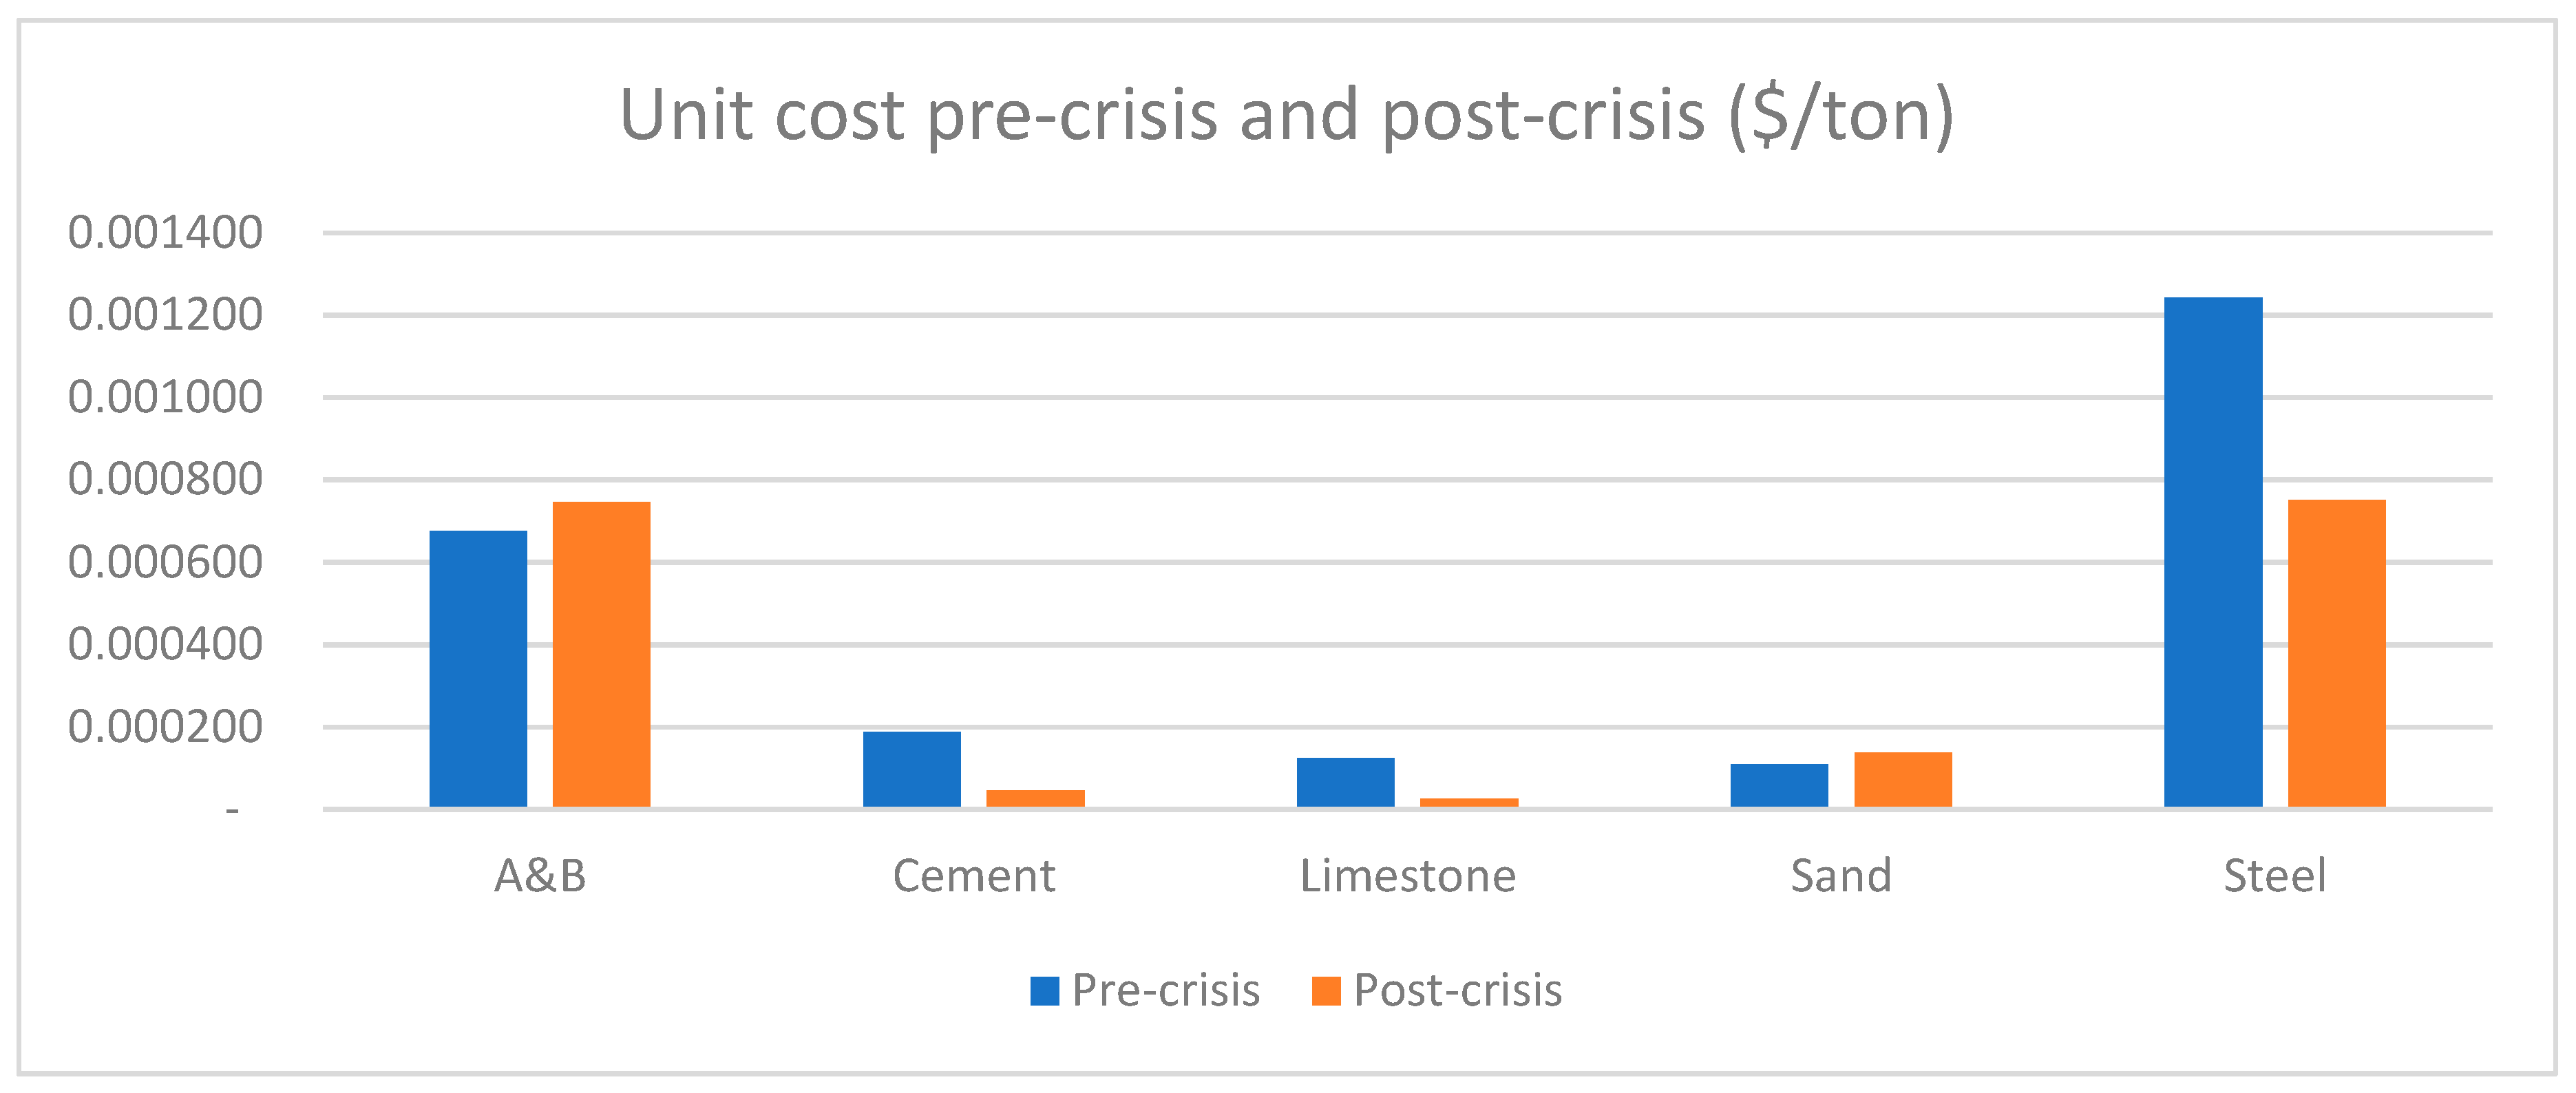
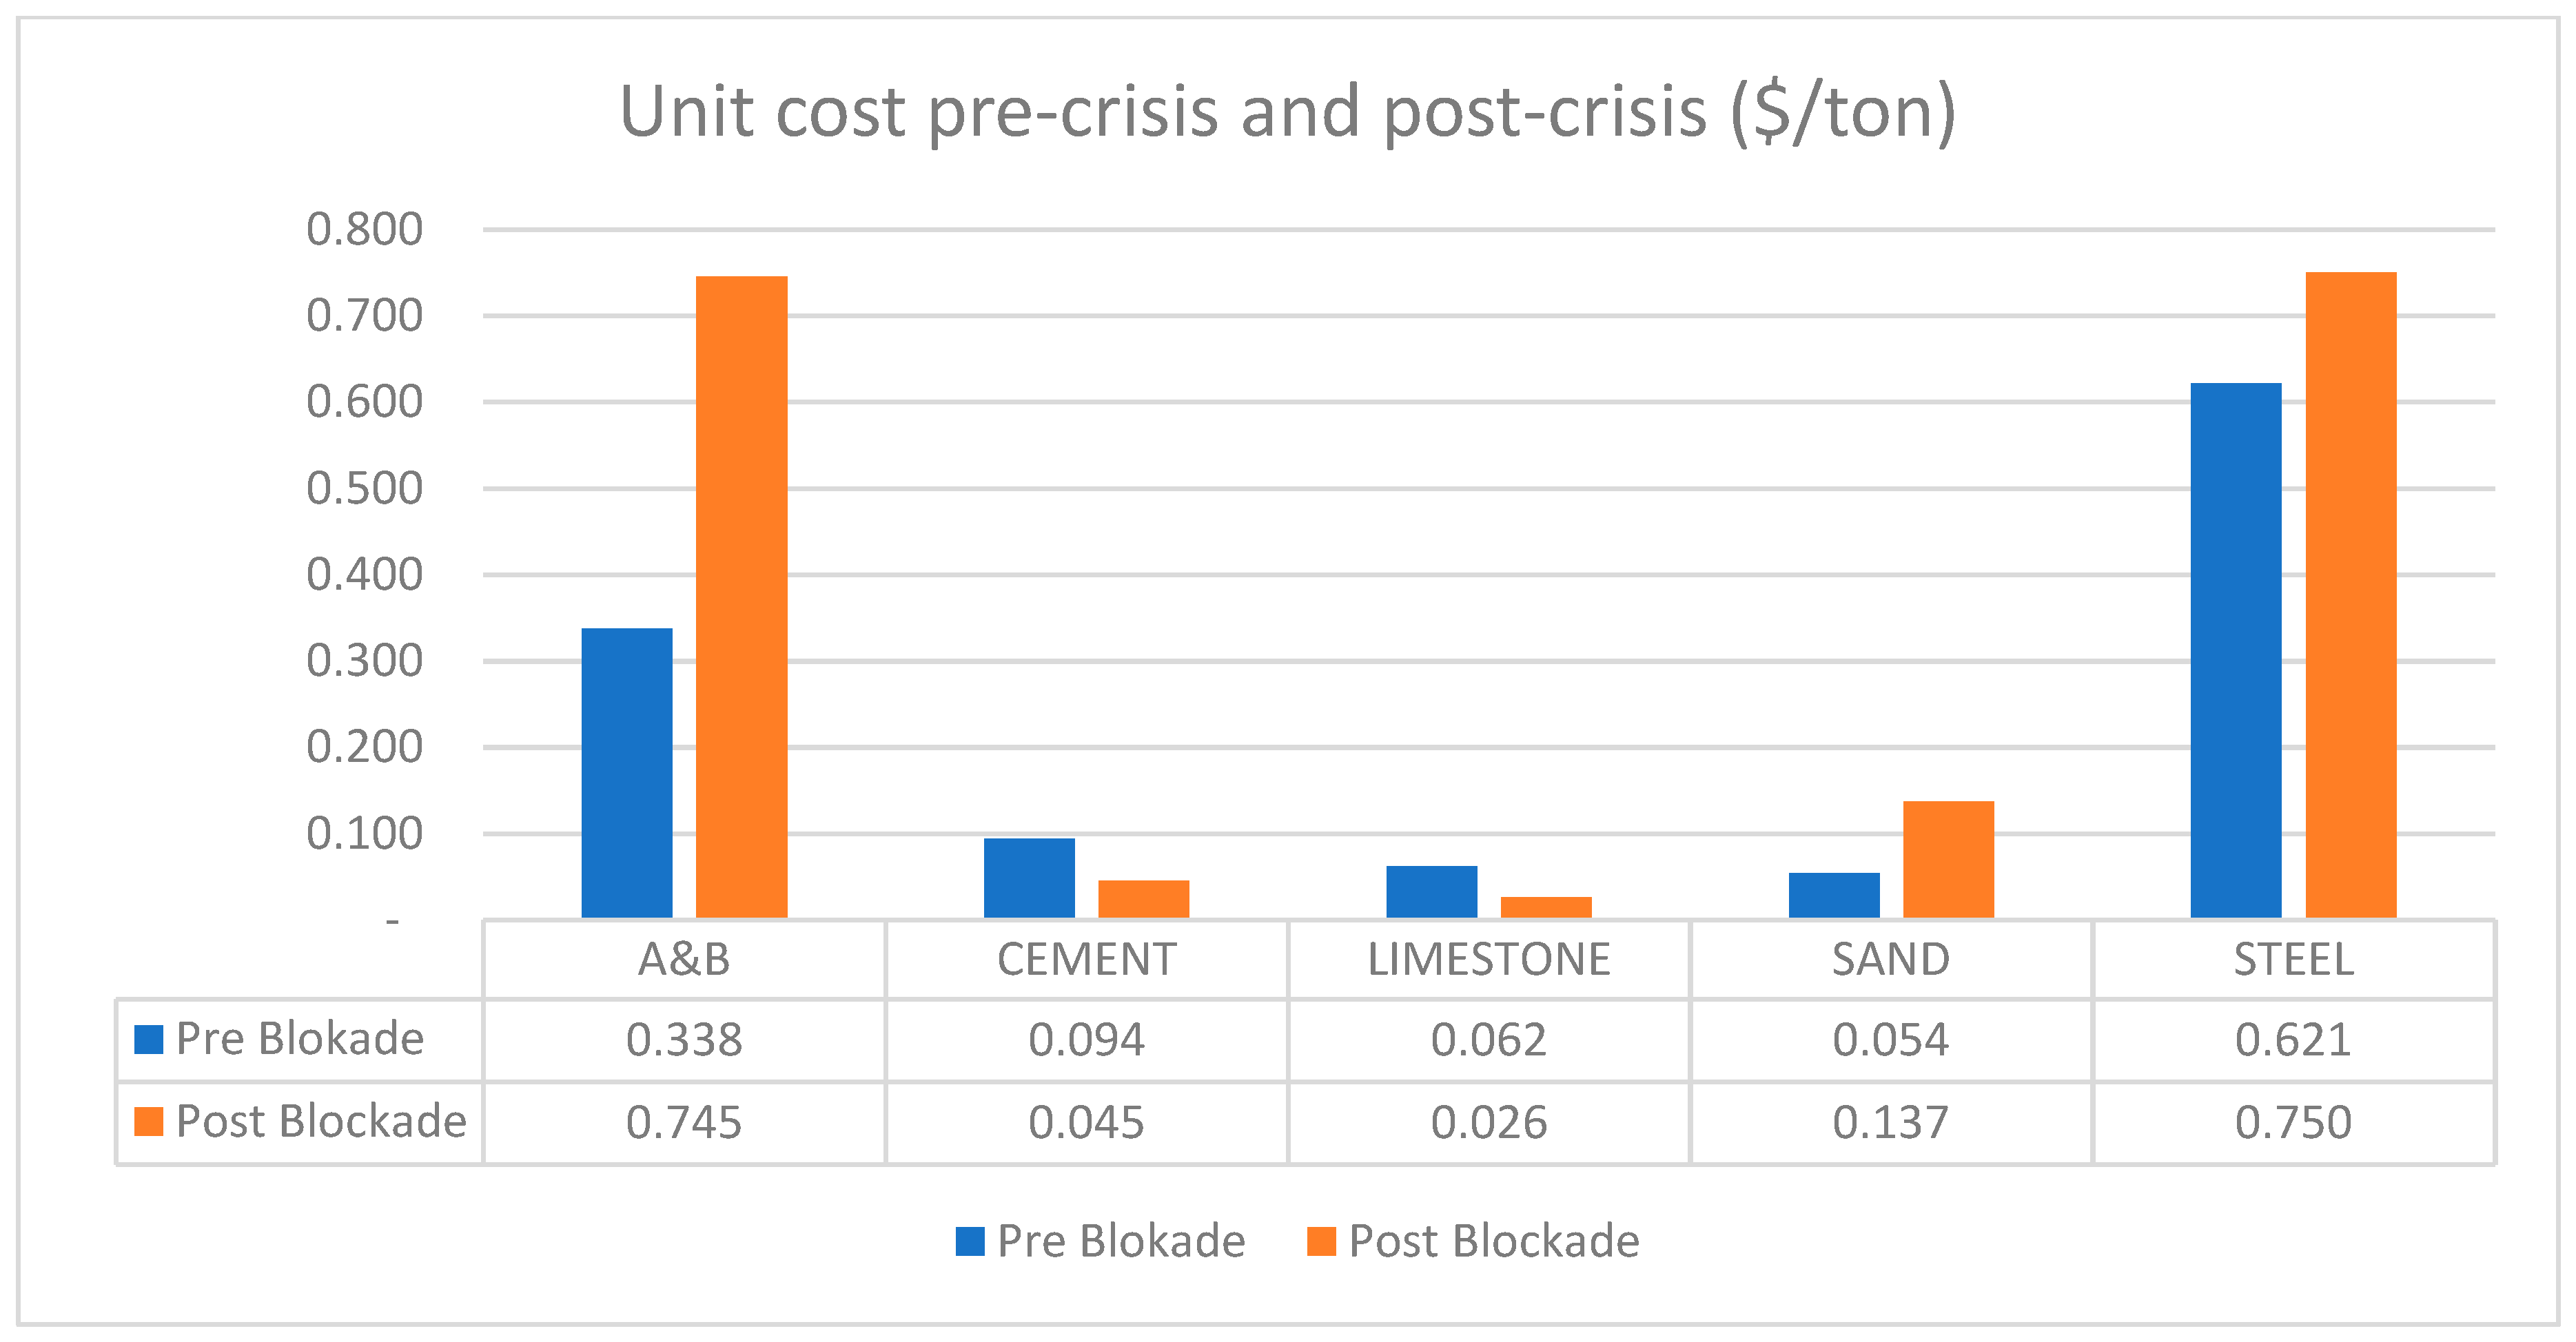
Cost of Construction Materials

The prices of construction materials varied as a result of changes in suppliers. Figure 8 represents the prices of each ton of construction material in U.S. Dollars (USD). The prices were found in the database of Qatar’s Authority of Customs and Ports. The prices of cement, limestone, sand, and steel reduced as compared to those of asphalt and bitumen, which increased.

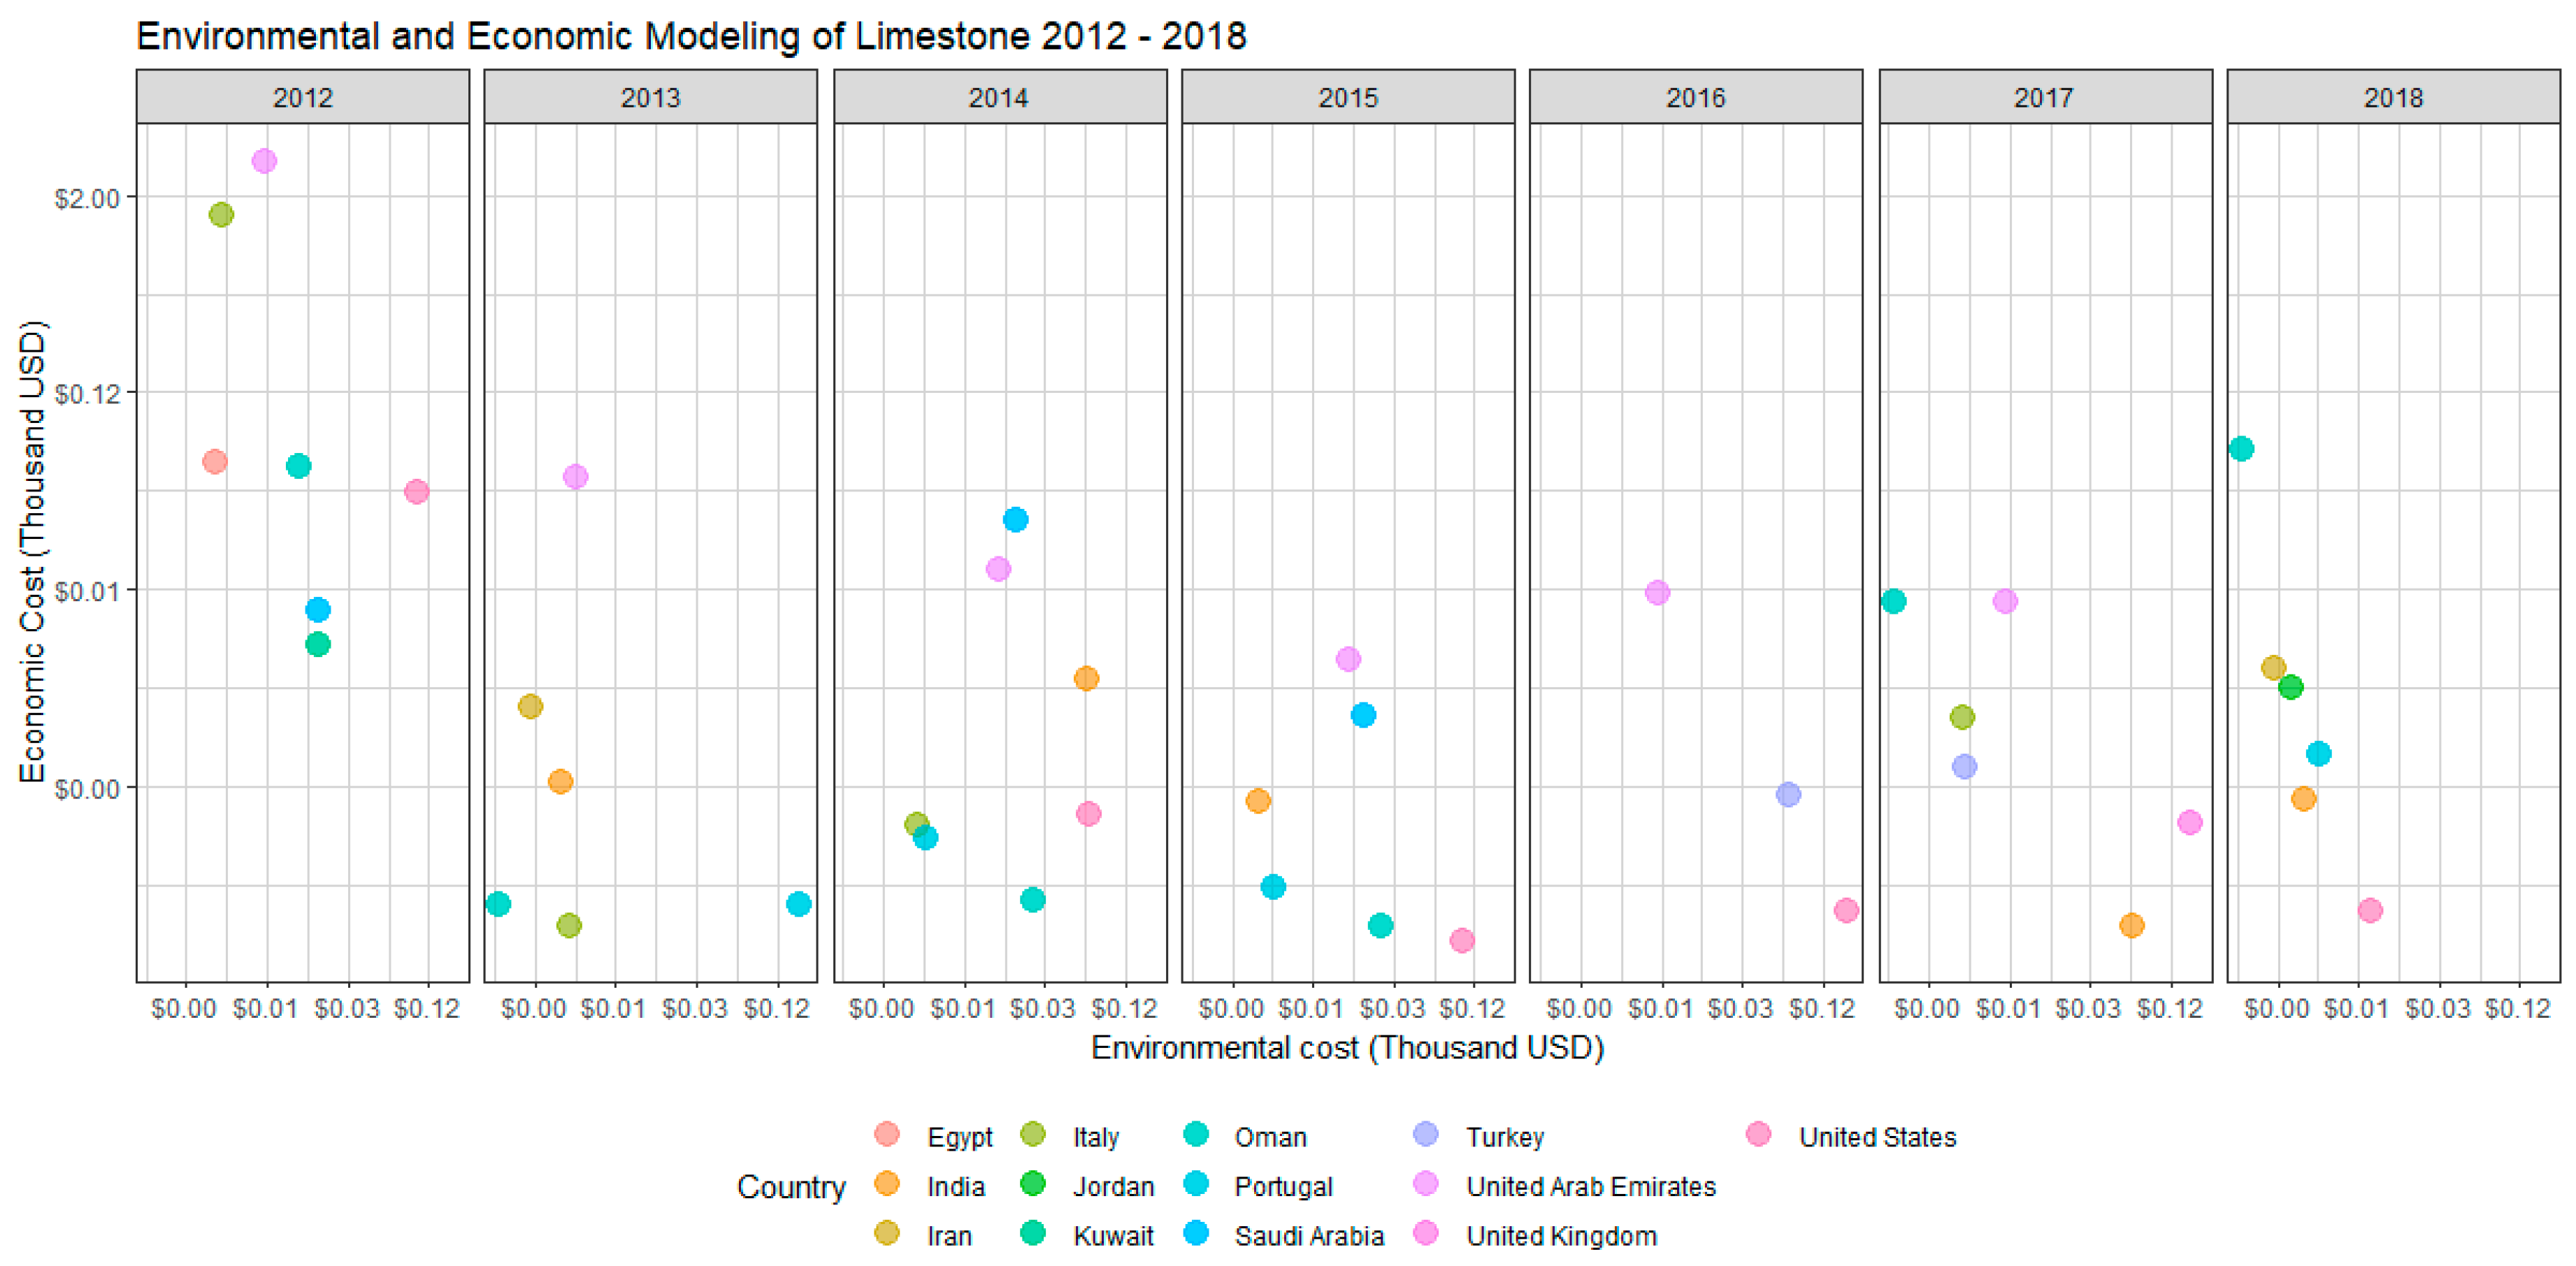
3.5. Discussion and Interpretation

The post-blockade subperiod is represented by the year 2018. We noted that in 2018, the quantities of imported construction material were reduced in comparison with the previous years. This decrease could have attenuated total adverse environmental effects, as, under the circumstances, less material was being imported. Had the quantity of materials imported in 2018 been at levels seen in previous years, the environmental and economic effects could have been greater.
On the basis of our analysis of the results, we found that as the distance traveled by imported construction materials increased, the amount of CO2-e emissions increased. One explanation for this relationship could be the quantities of construction materials transported. When Qatar imported construction materials from neighboring countries via land, the GREET analysis indicated that the amounts of CO2-e emissions increased; therefore, the selection of the transportation mode is essential for reducing CO2-e emissions.
Sea transport produces less CO2-e than other transport modes; therefore, it imposes a relatively smaller environmental impact [39]. Qatar discovered this following its geopolitical crisis, during which Qatar shifted to sea transport to satisfy its demand for construction materials. Based on the literature, road transport is responsible for around 74% of carbon emissions [74]. However, since Qatar has only one land port that is shared and blocked by Saudi Arabia, Qatar exchanges goods with other countries by either sea or air transport. According to our analytical results, travel distances have a lesser effect on CO2-e emissions than the choice of transportation mode; therefore, sea transport can be considered a more environment-friendly mode of transport than air or land transport. Together, in-land and sea transportation are less green than sea transportation and less green than land transportation alone. However, shipment transported via land for a shorter distance produces fewer emissions than shipping through the sea for longer distances, even though sea transportation modes are considered more environment-friendly and produce lesser emissions.
Before the crisis, the steel used to be delivered using land transport from neighboring countries, and the associated environmental impact was 850.7 g of total CO2-e per kilometer traveled. Moreover, for cement, limestone, sand, and asphalt, the total CO2-e per kilometer land transportation was 344.2, 322.6, and 402.9 g, respectively. Though in the post-crisis period, there was no environmental effect on land transportation due to the blocking of the only land port, environmental impacts generated from sea transport have increased. Materials are imported from non-neighboring countries mainly using sea transport. Therefore, GHG emissions generated from sea transport after the crisis have increased. Sea transport is considered as the most environmentally friendly mode of transport; however, when accompanied by land transport, it becomes less green.
Though Qatar is receiving fewer construction materials, the overall cost of construction materials increased in 2018. This could be due to the importing of fewer quantities of materials, which affects the unit price of the imported substance. In addition, the suppliers of construction materials have changed post-crisis; consequently, the costs of construction materials have changed.
The integration of environmental analysis and economic analysis was presented by assigning the associated values on a two-dimensional axis, with the horizontal axis representing the environmental cost result and the vertical axis showing the economic cost results [75]. Environmental and economic modeling results showed that when both the environment and economy were considered, the post-crisis period resulted in a significant reduction in CO2 emissions as a result of changing suppliers. Though traveling distance increased, air pollutants were lessened compared with the pre-crisis period. Based on the results, economic analysis has a greater effect on the objective function. The calculation of the environmental and economic modeling showed that the economy is the driving force in the overall objective function since it caused major change in the environmental and economic modeling analysis (Figure A8). When using an environmental and economic modeling analysis, a decision maker has the option to select suppliers based on his preference. For instance, a company that claims to be green would consider only the environmental analysis. On the other hand, other companies can select suppliers chosen based on economic analysis or combined environmental and economic analyses. Figure A8 shows the calculation of a real case example of cement shipments in 2018. It demonstrates how the optimal supplier would differ if the decision-maker chose to consider environmental analysis, economic analysis, or both. Moreover, Figure 9 and Figure A9, Figure A10, Figure A11, Figure A12 and Figure A13 in Appendix A demonstrate the results of the environmental and economic modeling analysis of the five construction materials.

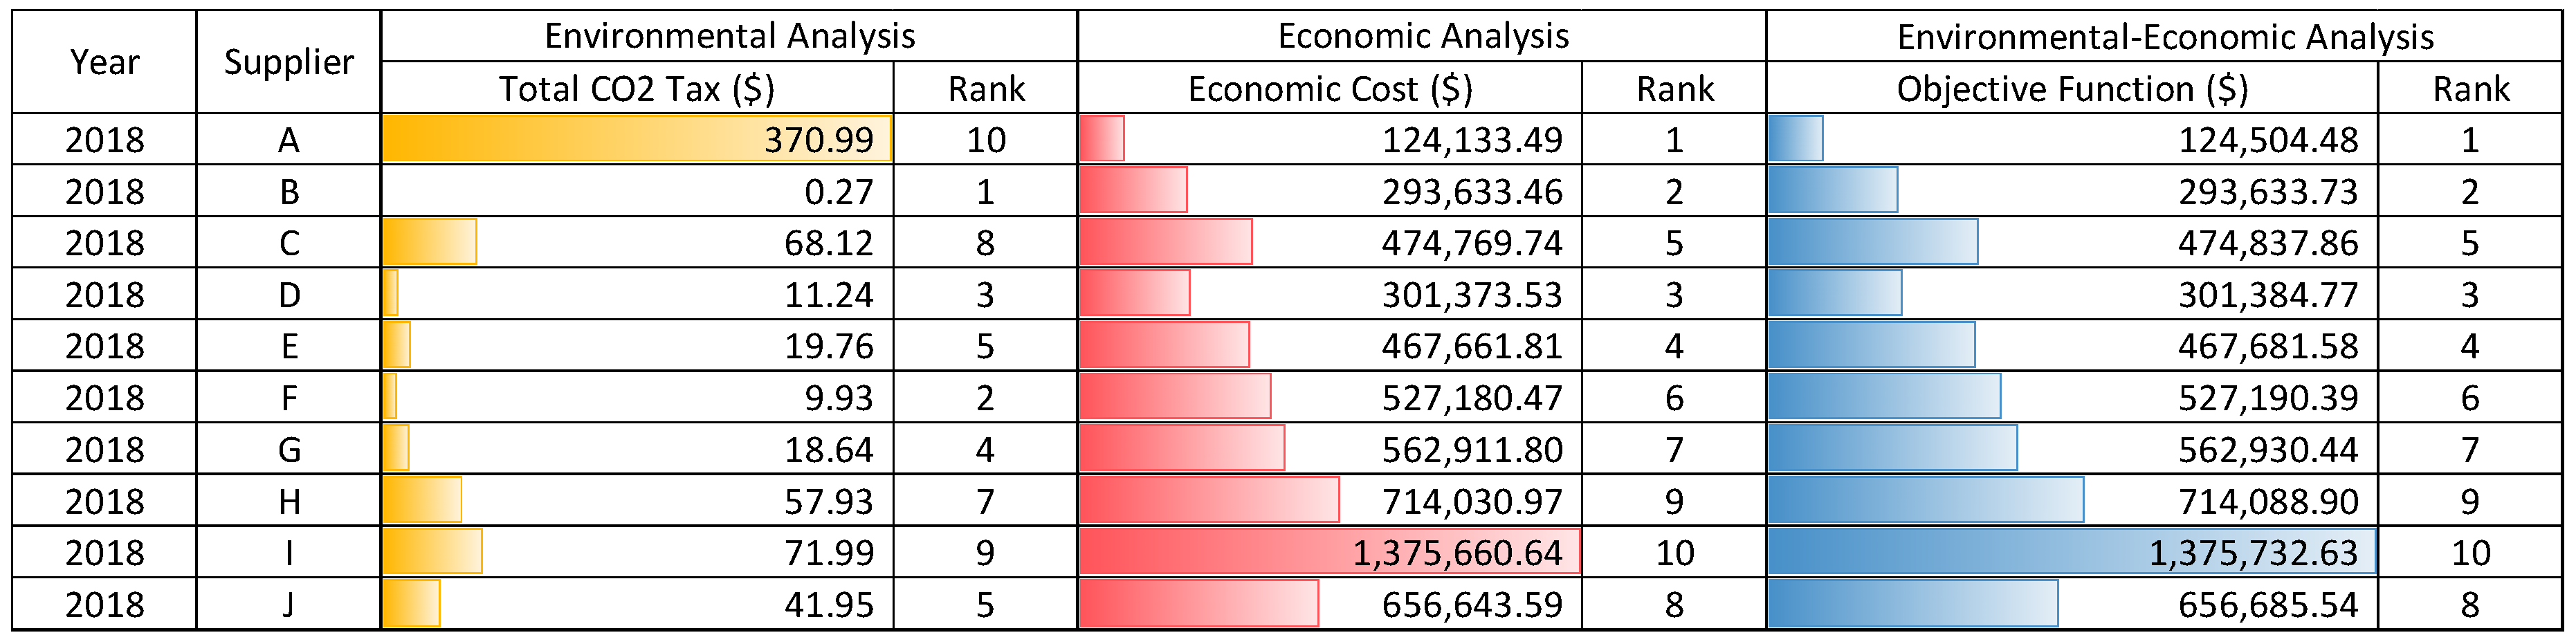
3.6. Sensitivity Analysis

Since distances were calculated using the web map service (WPS), it is expected that some uncertainties may have arisen. Moreover, in real case scenarios, roads and routes may change, thus changing the amount of air emissions. Therefore, a sensitivity analysis was performed to find the environmental and economic effects resulting from distances varying for 5% and 10%. Based on the analysis, varying distances resulted in a directly proportional relationship with environmental emissions. That is, when more distances are covered, more emissions are generated. Thus, the environmental and economic modeling analysis changes accordingly. However, since the economy is the driving force in an environmental and economic modeling analysis, overall results change at the same rhythm.

4. Conclusions

In the current study, we applied an integrated life cycle assessment (LCA) model to the flow of construction materials into Qatar. The assessment focused on the movement of five primary construction materials with the highest demand during geopolitical challenges, with the endpoint of minimizing environmental and economic impact. The model findings revealed some results with respect to the most environmentally friendly transportation mode, the relationship between travelled distance and quantities of shipment, global warming potential impact, and economic costs.
We found that transportation mode, more than any other factor, has the greatest effect on the quantities of CO2-e emitted in the course of material flow. A longer travel distance does not necessarily imply a greater environmental impact, as it remains dependent on the transportation mode. Sea transport can be considered the most environment-friendly transport mode. The shipment of larger quantities during fewer trips is environmentally better, because it contributes to less CO2-e production. This conclusion agrees with results of previous studies (e.g., [30,76]
There is a notable increase in the quantities of CO2-e emitted within the entire study, as geopolitical uncertainties have increased the average distance traveled for the materials imported. The percentage of greater land-based transport has shifted to sea transport within the post-blockade period; however, the increase in distance far outweighs any reduction in CO2-e emitted by the transportation method, creating an overall increase in emissions. The analysis of the environmental impact assessment using the average CO2-e per kilogram of the five construction materials represented a significant increase in GWP after the crisis by 70.68%. Specifically, GWP values caused by changes in the supply chain of asphalt and bitumen, cement, limestone, sand, and steel were 182.5%, 146.5%, 7.4%, 2%, and 15%, respectively.
In terms of economic analysis, a demand cost analysis revealed that the overall cost of construction materials has risen in the period post-blockade, leading to a negative economic effect. The drop in the economic values has had an effect on the overall environmental and economic impact of the sourcing of primary construction materials.
Using the CO2-e generated for each scenario (pre- and post-blockade), total carbon emissions were calculated, and an environmental forecast was established based on the demand of each material. The increase occurred post-blockade (2018); however, this post-blockade increased as compared a scenario where the blockade did not occur and another scenario where a blockade occurred in 2012 to represent the relative difference in total carbon emissions within the important materials based on the demanding scheme. The result indicates that there was a significant increase between scenarios where blockade occurred, which represents the increase in emitted carbon associated with global uncertainties.
A further analysis can be applied to establish the recommended number of traveled miles of each mode of transport under which it is considered environmentally risky. The proposed mathematical model can be applied to sectors other than the construction sector. In addition, an analysis could include uncertainty modeling with respect to material flow and the incorporation of additional types of geopolitical challenges.

Author Contributions

S.A.-N. designed the study and wrote the manuscript; A.-A.A.B. reviewed and approved the final manuscript; S.G.A.-G. designed, supervised the study, reviewed and approved the final manuscript.

Funding

This research was supported by a scholarship from Qatar National Research Fund (QNRF) a member of Qatar Foundation (QF). Any opinions, findings, and conclusions or recommendations expressed in this material are those of the author(s) and do not necessarily reflect the views of QNRF or QF.

Conflicts of Interest

The authors declare no conflict of interest.

Appendix A

Figure A1. Life-cycle assessment (LCA) framework according to ISO14040.
Sustainability 11 06000 g0a1
Figure A2. Total material imports in metric tons based upon the largest five quantities of materials projected to be imported to Qatar during 2012–2022.
Sustainability 11 06000 g0a2
Figure A3. Average distance traveled for each material in periods pre-blockade and post-blockade.
Sustainability 11 06000 g0a3
Figure A4. CO2 equivalent in grams of each material imported for each km traveled within periods pre-blockade and post-blockade.
Sustainability 11 06000 g0a4
Figure A5. Unit cost per metric ton in USD for each material based upon periods pre-blockade and post-blockade.
Sustainability 11 06000 g0a5
Figure A6. CO2 equivalent in grams for each kg of material imported within periods pre-blockade and post-blockade accounting for the percentage increased.
Sustainability 11 06000 g0a6
Figure A7. Forecasted Total CO2 equivalent in metric tons for each material imported based upon demand within the 2018–2022 period considering all the full increase, post-blockade increase, and the no increase scenarios.
Sustainability 11 06000 g0a7
Figure A8. Ranking of suppliers based on environmental analysis, economic analysis, and environmental-economic analysis. The analyses demonstrate that Supplier B has the least environmental impact and Supplier A has the least economic impact and environmental–economic impact.
Sustainability 11 06000 g0a8
Figure A9. Asphalt and Bitumen material imports into Qatar illustrated as an environmental and economic modeling analysis for years 2012–2018, representing a pattern that shows the most environmental and economic friendly supplier in pre-blockade sub-period and post-blockade period. The vertical axis represents the economic cost per kg imported, while the horizontal axis represents the environmental cost per kg imported. Different suppliers are represented by different colors. A point that is located further right means that importing from a supplier would lead to higher environmental cost. A higher point indicates that this supplier applies a greater economic cost.
Sustainability 11 06000 g0a9
Figure A10. Cement material imports into Qatar illustrated as an environmental and economic modeling analysis for years 2012–2018, representing a pattern that shows the most environmental and economic friendly supplier in pre-blockade sub-period and post-blockade period. The vertical axis represents the economic cost per kg imported, while the horizontal axis represents the environmental cost per kg imported. Different suppliers are represented by different colors. A point that is located further right means that importing from a supplier would lead to higher environmental cost. A higher point indicates that this supplier applies a greater economic cost.
Sustainability 11 06000 g0a10
Figure A11. Limestone material imports into Qatar illustrated as an environmental and economic modeling analysis for years 2012–2018, representing a pattern that shows the most environmental and economic friendly supplier in pre-blockade sub-period and post-blockade period. The vertical axis represents the economic cost per kg imported, while the horizontal axis represents the environmental cost per kg imported. Different suppliers are represented by different colors. A point that is located further right means that importing from a supplier would lead to higher environmental cost. A higher point indicates that this supplier applies a greater economic cost.
Sustainability 11 06000 g0a11
Figure A12. Sand material imports into Qatar illustrated as an environmental and economic modeling analysis for years 2012–2018, representing a pattern that shows the most environmental and economic friendly supplier in pre-blockade sub-period and post-blockade period. The vertical axis represents the economic cost per kg imported, while the horizontal axis represents the environmental cost per kg imported. Different suppliers are represented by different colors. A point that is located further right means that importing from a supplier would lead to higher environmental cost. A higher point indicates that this supplier applies a greater economic cost.
Sustainability 11 06000 g0a12
Figure A13. Steel material imports into Qatar illustrated as an environmental and economic modeling analysis for years 2012–2018, representing a pattern that shows the most environmental and economic friendly supplier in pre-blockade sub-period and post-blockade period. The vertical axis represents the economic cost per kg imported, while the horizontal axis represents the environmental cost per kg imported. Different suppliers are represented by different colors. A point that is located further right means that importing from a supplier would lead to higher environmental cost. A higher point indicates that this supplier applies a greater economic cost.
Sustainability 11 06000 g0a13

References

  1. Al-Ansary, M.; Iyengar, S.R. Physiochemical Characterization of Coarse Aggregates in Qatar for Construction Industry. Int. J. Sustain. Built Environ. 2013, 2, 27–40. [Google Scholar] [CrossRef]
  2. Mallidis, I.; Dekker, R.; Vlachos, D. The Impact of Greening on Supply Chain Design and Cost: A Case for a Developing Region. J. Transp. Geogr. 2012, 22, 118–128. [Google Scholar] [CrossRef]
  3. Ghisellini, P.; Cialani, C.; Ulgiati, S. A Review on Circular Economy: The Expected Transition to a Balanced Interplay of Environmental and Economic Systems. J. Clean. Prod. 2016, 114, 11–32. [Google Scholar] [CrossRef]
  4. Prajapati, H.; Kant, R.; Shankar, R. Bequeath Life to Death: State-of-Art Review on Reverse Logistics. J. Clean. Prod. 2019, 211, 503–520. [Google Scholar] [CrossRef]
  5. Govindan, K.; Soleimani, H. A Review of Reverse Logistics and Closed-Loop Supply Chains: A Journal of Cleaner Production Focus. J. Clean. Prod. 2017, 142, 371–384. [Google Scholar] [CrossRef]
  6. Peidro, D.; Mula, J.; Poler, R.; Lario, F.-C. Quantitative Models for Supply Chain Planning under Uncertainty: A Review. Int. J. Adv. Manuf. Technol. 2009, 43, 400–420. [Google Scholar] [CrossRef]
  7. Gupta, A.; Maranas, C.D. Managing Demand Uncertainty in Supply Chain Planning. Comput. Chem. Eng. 2003, 27, 1219–1227. [Google Scholar] [CrossRef]
  8. Jung, J.Y.; Blau, G.; Pekny, J.F.; Reklaitis, G.V.; Eversdyk, D. A Simulation Based Optimization Approach to Supply Chain Management under Demand Uncertainty. Comput. Chem. Eng. 2004, 28, 2087–2106. [Google Scholar] [CrossRef]
  9. Al-Thani, S.; Skelhorn, C.; Amato, A.; Koc, M.; Al-Ghamdi, S. Smart Technology Impact on Neighborhood Form for a Sustainable Doha. Sustainability 2018, 10, 4764. [Google Scholar] [CrossRef]
  10. Léonardi, J.; Baumgartner, M. CO2 Efficiency in Road Freight Transportation: Status Quo, Measures and Potential. Transp. Res. Part D Transp. Environ. 2004, 9, 451–464. [Google Scholar] [CrossRef]
  11. IPCC. AR5 Climate Change 2014: Mitigation of Climate Change; Cambridge University Press: New York, NY, USA, 2014. [Google Scholar]
  12. U.S. Green Building Council. LEED 2009 for New Construction and Major Renovations Rating System; U.S. Green Building Council: Washington, DC, USA, 2009. [Google Scholar]
  13. Akbarnezhad, A.; Ahmadian, A.; Akbarnezhad, A.; Rashidi, T.H.; Waller, S.T. Importance of Planning for the Transport Stage in Procurement of Construction Materials. In Proceedings of the International Symposium on Automation and Robotics in Construction; IAARC Publications: Sydney, Australia, 2014. [Google Scholar]
  14. Ahmadian, F.F.A.; Akbarnezhad, A.; Rashidi, T.H.; Waller, S.T. Accounting for Transport Times in Planning Off-Site Shipment of Construction Materials. J. Constr. Eng. Manag. 2016, 142, 04015050. [Google Scholar] [CrossRef]
  15. The U.S. Census Bureau. Monthly Construction Spending. Available online: https://www.census.gov/construction/c30/pdf/release.pdf (accessed on 21 October 2019).
  16. Tserng, H.P.; Yin, S.Y.L.; Li, S. Developing a Resource Supply Chain Planning System for Construction Projects. J. Constr. Eng. Manag. 2006, 132, 393–407. [Google Scholar] [CrossRef]
  17. Yılmaz, E.; Arslan, H.; Bideci, A. Environmental Performance Analysis of Insulated Composite Facade Panels Using Life Cycle Assessment (LCA). Constr. Build. Mater. 2019, 202, 806–813. [Google Scholar] [CrossRef]
  18. Jang, M.; Hong, T.; Ji, C. Hybrid LCA Model for Assessing the Embodied Environmental Impacts of Buildings in South Korea. Environ. Impact Assess. Rev. 2015, 50, 143–155. [Google Scholar] [CrossRef]
  19. Babaizadeh, H.; Haghighi, N.; Asadi, S.; Broun, R.; Riley, D. Life Cycle Assessment of Exterior Window Shadings in Residential Buildings in Different Climate Zones. Build. Environ. 2015, 90, 168–177. [Google Scholar] [CrossRef]
  20. Abd Rashid, A.F.; Yusoff, S. A Review of Life Cycle Assessment Method for Building Industry. Renew. Sustain. Energy Rev. 2015, 45, 244–248. [Google Scholar] [CrossRef]
  21. Alhaj, M.A.; Mohammed, S.; Darwish, M.; Hassan, A.; Al-Ghamdi, S.G. A Review of Qatar’s Water Resources, Consumption and Virtual Water Trade. Desalin. WATER Treat. 2017, 90, 70–85. [Google Scholar] [CrossRef]
  22. Qatar Economic Outlook 2018-2022. Available online: https://www.mdps.gov.qa/en/knowledge/Doc/QEO/Qatar-Economic-Outlook-2018-2020-En.pdf (accessed on 16 October 2019).
  23. el Mallakh, R. Qatar (RLE Economy of Middle East); Routledge: Abingdon, UK, 2015. [Google Scholar]
  24. Economides, M.J.; Wood, D.A. The State of Natural Gas. J. Nat. Gas Sci. Eng. 2009, 1, 1–13. [Google Scholar] [CrossRef]
  25. Al-Tamimi, A.; Al-Ghamdi, S.G. Multiscale Integrated Analysis of Societal and Ecosystem Metabolism of Qatar. Energy Rep. 2019. [Google Scholar] [CrossRef]
  26. Qatar Real GDP Growth (2012 - 2019]. Available online: https://www.ceicdata.com/en/indicator/qatar/real-gdp-growth (accessed on 28 October 2019).
  27. Al-Thani, S.K.; Amato, A.; Koç, M.; Al-Ghamdi, S.G. Urban Sustainability and Livability: An Analysis of Doha’s Urban-Form and Possible Mitigation Strategies. Sustainability 2019, 11, 786. [Google Scholar] [CrossRef]
  28. Trading Economics. Qatar GDP. Available online: https://tradingeconomics.com/qatar/gdp (accessed on 16 October 2019).
  29. Shoeb, M. Construction sector to grow by 7% until ’19: SAK-The Peninsula Qatar. Available online: https://www.thepeninsulaqatar.com/article/02/04/2018/Construction-sector-to-grow-by-7-until-’19-SAK (accessed on 16 October 2019).
  30. Nessi, S.; Rigamonti, L.; Grosso, M. LCA of Waste Prevention Activities: A Case Study for Drinking Water in Italy. J. Environ. Manag. 2012, 108, 73–83. [Google Scholar] [CrossRef]
  31. Tasca, A.L.; Nessi, S.; Rigamonti, L. Environmental Sustainability of Agri-Food Supply Chains: An LCA Comparison between Two Alternative Forms of Production and Distribution of Endive in Northern Italy. J. Clean. Prod. 2017, 140, 725–741. [Google Scholar] [CrossRef]
  32. Paksoy, T.; Bektaş, T.; Özceylan, E. Operational and Environmental Performance Measures in a Multi-Product Closed-Loop Supply Chain. Transp. Res. Part E Logist. Transp. Rev. 2011, 47, 532–546. [Google Scholar] [CrossRef]
  33. Hoen, K.M.R.; Tan, T.; Fransoo, J.C.; van Houtum, G.J. Effect of Carbon Emission Regulations on Transport Mode Selection under Stochastic Demand. Flex. Serv. Manuf. J. 2014, 26, 170–195. [Google Scholar] [CrossRef]
  34. Palak, G.; Ekşioğlu, S.D.; Geunes, J. Analyzing the Impacts of Carbon Regulatory Mechanisms on Supplier and Mode Selection Decisions: An Application to a Biofuel Supply Chain. Int. J. Prod. Econ. 2014, 154, 198–216. [Google Scholar] [CrossRef]
  35. Neely, A.; Gregory, M.; Platts, K. Performance Measurement System Design. Int. J. Oper. Prod. Manag. 1995, 15, 80–116. [Google Scholar] [CrossRef]
  36. Aramyan, L.H.; Meuwissen, M.P.M.; Oude Lansink, A.G.J.M.; van der Vorst, J.G.A.J.; van Kooten, O.; van der Lans, I.A. The Perceived Impact of Quality Assurance Systems on Tomato Supply Chain Performance. Total Qual. Manag. Bus. Excell. 2009, 20, 633–653. [Google Scholar] [CrossRef]
  37. Shen, L.; Olfat, L.; Govindan, K.; Khodaverdi, R.; Diabat, A. A Fuzzy Multi Criteria Approach for Evaluating Green Supplier’s Performance in Green Supply Chain with Linguistic Preferences. Resour. Conserv. Recycl. 2013, 74, 170–179. [Google Scholar] [CrossRef]
  38. Khasreen, M.M.; Banfill, P.F.G.; Menzies, G.F. Life-Cycle Assessment and the Environmental Impact of Buildings: A Review. Sustainability 2009, 1, 674–701. [Google Scholar] [CrossRef]
  39. Van Der Lugt, P.; Van Den Dobbelsteen, A.A.J.F. An Environmental, Economic and Practical Assessment of Bamboo as a Building Material for Supporting Structures. Constr. Build. Mater. 2006, 20, 648–656. [Google Scholar] [CrossRef]
  40. Schmidt, M.; Crawford, R.H. Developing an Integrated Framework for Assessing the Life Cycle Greenhouse Gas Emissions and Life Cycle Cost of Buildings. Procedia Eng. 2017, 196, 988–995. [Google Scholar] [CrossRef]
  41. Xue, X.; Li, X.; Shen, Q.; Wang, Y. An Agent-Based Framework for Supply Chain Coordination in Construction. Autom. Constr. 2005, 14, 413–430. [Google Scholar] [CrossRef]
  42. Cheng, J.C.P.; Law, K.H.; Bjornsson, H.; Jones, A.; Sriram, R. A Service Oriented Framework for Construction Supply Chain Integration. Autom. Constr. 2010, 19, 245–260. [Google Scholar] [CrossRef]
  43. Shi, Q.; Ding, X.; Zuo, J.; Zillante, G. Mobile Internet Based Construction Supply Chain Management: A Critical Review. Autom. Constr. 2016, 72, 143–154. [Google Scholar] [CrossRef]
  44. ISO 14040:2006. ISO 14040:2006 - Environmental management -- Life cycle assessment -- Principles and framework. Available online: https://www.iso.org/standard/37456.html (accessed on 28 October 2019).
  45. Sapkota, K.; Oni, A.O.; Kumar, A. Techno-Economic and Life Cycle Assessments of the Natural Gas Supply Chain from Production Sites in Canada to North and Southwest Europe. J. Nat. Gas Sci. Eng. 2018, 52, 401–409. [Google Scholar] [CrossRef]
  46. Ware, N.R.; Singh, S.P.; Banwet, D.K. A Mixed-Integer Non-Linear Program to Model Dynamic Supplier Selection Problem. Expert Syst. Appl. 2014, 41, 671–678. [Google Scholar] [CrossRef]
  47. Scott, J.; Ho, W.; Dey, P.K.; Talluri, S. A Decision Support System for Supplier Selection and Order Allocation in Stochastic, Multi-Stakeholder and Multi-Criteria Environments. Int. J. Prod. Econ. 2015, 166, 226–237. [Google Scholar] [CrossRef]
  48. Hsu, C.-W.; Kuo, T.-C.; Chen, S.-H.; Hu, A.H. Using DEMATEL to Develop a Carbon Management Model of Supplier Selection in Green Supply Chain Management. J. Clean. Prod. 2013, 56, 164–172. [Google Scholar] [CrossRef]
  49. Ho, W.; Xu, X.; Dey, P.K. Multi-Criteria Decision Making Approaches for Supplier Evaluation and Selection: A Literature Review. Eur. J. Oper. Res. 2010, 202, 16–24. [Google Scholar] [CrossRef]
  50. Sanayei, A.; Farid Mousavi, S.; Yazdankhah, A. Group Decision Making Process for Supplier Selection with VIKOR under Fuzzy Environment. Expert Syst. Appl. 2010, 37, 24–30. [Google Scholar] [CrossRef]
  51. Önüt, S.; Kara, S.S.; Işik, E. Long Term Supplier Selection Using a Combined Fuzzy MCDM Approach: A Case Study for a Telecommunication Company. Expert Syst. Appl. 2009, 36, 3887–3895. [Google Scholar] [CrossRef]
  52. Rezaei, J.; Fahim, P.B.M.; Tavasszy, L. Supplier Selection in the Airline Retail Industry Using a Funnel Methodology: Conjunctive Screening Method and Fuzzy AHP. Expert Syst. Appl. 2014, 41, 8165–8179. [Google Scholar] [CrossRef]
  53. Yadav, V.; Sharma, M.K. Multi-Criteria Decision Making for Supplier Selection Using Fuzzy AHP Approach. Benchmarking An Int. J. 2015, 22, 1158–1174. [Google Scholar] [CrossRef]
  54. Jain, V.; Kumar, S.; Kumar, A.; Chandra, C. An Integrated Buyer Initiated Decision-Making Process for Green Supplier Selection. J. Manuf. Syst. 2016, 41, 256–265. [Google Scholar] [CrossRef]
  55. Bruno, G.; Esposito, E.; Genovese, A.; Simpson, M. Applying Supplier Selection Methodologies in a Multi-Stakeholder Environment: A Case Study and a Critical Assessment. Expert Syst. Appl. 2016, 43, 271–285. [Google Scholar] [CrossRef]
  56. Amorim, P.; Curcio, E.; Almada-Lobo, B.; Barbosa-Póvoa, A.P.F.D.; Grossmann, I.E. Supplier Selection in the Processed Food Industry under Uncertainty. Eur. J. Oper. Res. 2016, 252, 801–814. [Google Scholar] [CrossRef]
  57. Gheidar Kheljani, J.; Ghodsypour, S.H.; O’Brien, C. Optimizing Whole Supply Chain Benefit versus Buyer’s Benefit through Supplier Selection. Int. J. Prod. Econ. 2009, 121, 482–493. [Google Scholar] [CrossRef]
  58. Shaw, K.; Shankar, R.; Yadav, S.S.; Thakur, L.S. Supplier Selection Using Fuzzy AHP and Fuzzy Multi-Objective Linear Programming for Developing Low Carbon Supply Chain. Expert Syst. Appl. 2012, 39, 8182–8192. [Google Scholar] [CrossRef]
  59. Kannan, D.; Khodaverdi, R.; Olfat, L.; Jafarian, A.; Diabat, A. Integrated Fuzzy Multi Criteria Decision Making Method and Multi-Objective Programming Approach for Supplier Selection and Order Allocation in a Green Supply Chain. J. Clean. Prod. 2013, 47, 355–367. [Google Scholar] [CrossRef]
  60. Kokangul, A.; Susuz, Z. Integrated Analytical Hierarch Process and Mathematical Programming to Supplier Selection Problem with Quantity Discount. Appl. Math. Model. 2009, 33, 1417–1429. [Google Scholar] [CrossRef]
  61. The Ministry of Development Planning and Statistics. Results of The Survey for The Future Demand of Primary Materials 2013 Executive Summary; Ministry of Development Planning and Statistics: Doha, Qatar, 2013. Available online: https://www.mdps.gov.qa/en/statistics/Statistical (accessed on 21 October 2019).
  62. Seuring, S.; Müller, M. From a Literature Review to a Conceptual Framework for Sustainable Supply Chain Management. J. Clean. Prod. 2008, 16, 1699–1710. [Google Scholar] [CrossRef]
  63. Eskandarpour, M.; Dejax, P.; Miemczyk, J.; Péton, O. Sustainable Supply Chain Network Design: An Optimization-Oriented Review. Omega 2015, 54, 11–32. [Google Scholar] [CrossRef]
  64. Gambatese, J.A.; Rajendran, S. Sustainable Roadway Construction: Energy Consumption and Material Waste Generation of Roadways. In Construction Research Congress 2005; American Society of Civil Engineers: Reston, VA, USA, 2005. [Google Scholar]
  65. Binder, M.; Florin, H.; Kreissig, J. The Use of Life Cycle Engineering/Life Cycle Assessment within the Design Process of Production Facilities; A Business Case: Different Options of Handling Overspray. MRS Proc. 2005, 895, 0895-G01-03-S01-03. [Google Scholar] [CrossRef]
  66. ISO. ISO 14040:2006(En), Environmental Management — Life Cycle Assessment — Principles and Framework; The International Organization for Standardization: Geneva, Switzerland, 2006. [Google Scholar]
  67. General Authority of Customs. Foreign Trade System. Available online: http://www.customs.gov.qa/eng/opendata.php (accessed on 16 October 2019).
  68. Li, M.; Zhang, X.; Li, G. A Comparative Assessment of Battery and Fuel Cell Electric Vehicles Using a Well-to-Wheel Analysis. Energy 2016, 94, 693–704. [Google Scholar] [CrossRef]
  69. Argonne National Laboratory. GREET Model. Available online: https://greet.es.anl.gov/ (accessed on 16 October 2019).
  70. Midler, J.-C. Non-Euclidean Geographic Spaces: Mapping Functional Distances. Geogr. Anal. 2010, 14, 189–203. [Google Scholar] [CrossRef]
  71. United States Environmental Protection Agency. Understanding Global Warming Potentials, Environ. Prot. Agency, US. 2016. Available online: https://www.epa.gov/ghgemissions/understanding-global-warming-potentials (accessed on 21 October 2019).
  72. Balaguera, A.; Carvajal, G.I.; Albertí, J.; Fullana-i-Palmer, P. Life Cycle Assessment of Road Construction Alternative Materials: A Literature Review. Resour. Conserv. Recycl. 2018, 132, 37–48. [Google Scholar] [CrossRef]
  73. European Emission Allowances (EUA). Available online: https://www.eex.com/en/market-data/environmental-markets/spot-market/european-emission-allowances#!/2019/04/02 (accessed on 2 April 2019).
  74. Rashid Khan, H.U.; Siddique, M.; Zaman, K.; Yousaf, S.U.; Shoukry, A.M.; Gani, S.; Sasmoko; Khan, A.; Hishan, S.S.; Saleem, H. The Impact of Air Transportation, Railways Transportation, and Port Container Traffic on Energy Demand, Customs Duty, and Economic Growth: Evidence from a Panel of Low-, Middle, and High -Income Countries. J. Air Transp. Manag. 2018, 70, 18–35. [Google Scholar] [CrossRef]
  75. Weldu, Y.W.; Assefa, G. The Search for Most Cost-Effective Way of Achieving Environmental Sustainability Status in Electricity Generation: Environmental Life Cycle Cost Analysis of Energy Scenarios. J. Clean. Prod. 2017, 142, 2296–2304. [Google Scholar] [CrossRef]
  76. Mallidis, I.; Dekker, R.; Vlachos, D. Greening Supply Chains: Impact on Cost and Design; Econometric Institute: Rotterdam, The Netherlands, 2010. [Google Scholar]
Figure 1. Flow scheme of the applied methodology.
Sustainability 11 06000 g001
Figure 2. Flow scheme of the environmental and economic model.
Sustainability 11 06000 g002
Figure 3. Total amounts of construction materials imported into Qatar pre-crisis and post-crisis. Note: A&B: Asphalt and Bitumen.
Sustainability 11 06000 g003
Figure 4. Average distance travelled by each kg of material pre- and post- crisis. Note: A&B: Asphalt and Bitumen.
Sustainability 11 06000 g004
Figure 5. Amounts of CO2 equivalent emitted during material transport, pre- and post- crisis. Note: A&B: Asphalt and Bitumen.
Sustainability 11 06000 g005
Figure 6. Comparisons between the amount of CO2 equivalent per kilogram of material in pre- and post-blockade periods.
Sustainability 11 06000 g006
Figure 7. Forecast of CO2 equivalent in 2012-2022 based on different scenarios.
Sustainability 11 06000 g007
Figure 8. Unit cost of construction materials pre- and post-crisis. Note: A&B: Asphalt and Bitumen.
Sustainability 11 06000 g008
Figure 9. Environmental and economic modeling analysis applied on shipments of limestone in 2012–2018. The vertical axis represents the economic cost per kg imported, while the horizontal axis represents the environmental cost per kg imported. Different suppliers are represented by different colors. A point that is located further right means that importing from a supplier would lead to higher environmental cost. A higher point indicates that this supplier applies a greater economic cost.
Sustainability 11 06000 g009
Table 1. Demand for primary construction materials in Qatar, 2012–2022.
YearsConstruction Budget BL.RPrecast Concrete (Ton)Asphalt (Ton)Ready Mix Concrete (Cu.M.)Spoil Removal and Disposal (Ton)Bitumen (Ton)Limestone (Ton)Gabbro (Ton)Fine Sand (Ton)Washed Sand (Ton)Cement (Ton)Steel (Rebar) (Ton)
20129539276,5761,922,9231,406,5205,431,37498,306424,6423,236,120311,4901,171,444809,085259,835
201316,004844,7195,704,0302,901,66518,544,038653,34333,282,53818,997,545749,7106,779,5163,964,2871,332,205
201445,1461,689,0329,608,2534,646,67549,930,6211,564,02876,742,89646,608,362748,75014,121,5538,770,9402,622,776
201543,6344,496,33517,176,1428,180,58856,366,5183,705,007174,567,01786,611,452658,71629,062,59818,260,5924,283,039
201642,2881,468,8779,580,8797,080,22129,986,6272,727,899146,707,94165,713,218175,08032,571,07516,488,6003,244,246
201728,148227,7591,528,4443,134,9435,155,424963,65260,767,84422,237,587112,7666,981,9583,905,4951,084,207
201823,04964,356529,4742,522,203604,561380,55420,879,46210,519,94570,1262,492,8911,268,412425,662
201922,56644,73788,1842,103,811106,50910,243324,1272,456,757NA1,566,341806,200312,649
202021,421105,0143152,081,134NA6037NA2,310,149NA1,524,205785,114343,116
202119,324NA1881,722,116NA6016NA2,029,423NA1,339,031690,036253,139
202216,4652514112698,017NA6011NA837,379NA552,451284,696105,533
Kahrama 2012–2022------924,9012,474,632628,2003,737,8011,159,279371,151
TOTAL287,5849,219,91946,138,94436,477,893166,125,67210,121,096514,621,368264,032,5693,454,838101,900,86457,192,73614,637,558
This table was established in 2013 by Qatar’s Ministry of Development Planning and Statistics for estimating quantities of construction materials that will be used during the ten year construction boom. (-): Indication that the quantity of construction material demand is not known or available.
Table 2. Percentage of CO2 equivalent increase.
AsphaltLimestoneSandCementSteel
282.5%107.4%102.0%246.5%115.0%

