Abstract
To improve and continue educational sustainability development, we expect to understand the learning problems of disadvantaged students for sustainability in rural areas. This study collected an integrated dataset, including 16 features with 883 records, from an elementary school in a rural area in Taiwan. Then, this paper proposes an integrated features selection method to integrate four different feature selection methods for finding the key features of academic achievement, and utilizes a statistical test to explore the differences in various student backgrounds in the nine key features and the graduated score. The statistical test shows that between the ordinary students and disadvantaged students, there were differences in the key features and the graduated score, and this paper also found that the five groups of disadvantaged students exhibit differences in academic achievements. To determine these differences, this study carried out interviews on six different students’ identity backgrounds, and the majority consensus of six groups of students was summarized as personal, family, and school aspects. The results show that there were many learning problems in this rural elementary school: (1) the education levels of most of the parents (72.3%) were below the college level; (2) 73% of parents were staff members and workers; (3) 26.4% of students in the school were disadvantaged; and (4) the age range of student’s parents was from 30 to 64 years. For the sustainable education of rural areas, this study suggests that the educational management must invest greater resources and make more effective policies a priority for teachers in rural areas and that teachers must pay more attention to aboriginal students in terms of learning motivation and must actively interact with their parents.
1. Introduction
Education has been accepted as the primary hope for a more sustainable future. The foundation of sustainable education development is to engage people and social groups in learning to live in a sustainable way. And education is identified as a key element of sustainability-focused strategies in many contexts and levels [1]. Based on sustainable education development and the concepts of DMAIC (Define, Measure, Analyze, Improve, Control)—a six sigma process improvement methodology [2], and it is a quality strategy used to improve processes, the philosophy of six sigma is to identify critical factors for educational sustainability development (process or service improvement). Therefore, it is important to find the key factors of academic achievement, and provide suggestions to the educational stakeholders for continuous improvement. The educational stakeholders must find the educational problems to improve and continue the process (educational sustainability development), then the students can achieve environmental and ethical awareness, values and attitudes, skills and behavior consistent with sustainable development and for effective public participation in decision- making.
In education, two concepts are commonly found: (1) one that broadly refers to all social communication activities that spread and learn the fruits of human civilization, that is, various knowledge, skills and social life experiences, to promote individual socialization and social individualization, which originate in the initial stage of human society, and (2) one that narrowly refers to education with specific fields and materials, that is, institutionalized education. Therefore, education includes all aspects of society, such as family education, school education, etiquette and other forms of civilized and social education. The purpose of receiving education (learning) is to help each student achieve a desired level of development. To accomplish this purpose, one must provide appropriate counseling and assistance in response to the different abilities and learning needs of students such that their potential may be fully developed. However, each student is an independent individual with differences in cognitive and emotional development, communication, ability, motivation, ambition, learning style, needs, interests and potential. In addition, the factors that shape student learning differences are complex; these factors include innate wisdom, different social and economic backgrounds, and different learning experiences; the mismatch between learners and courses, and parental styles, are also possible factors. Based on the above reasons, in order to fully understand the issue of learning differences, this study focused not only on determining the gap in student learning but also on exploring the reasons for and providing suggestions for overcoming learning obstacles.
The elementary school stage is an important period for creating a good personality and cultivating basic learning abilities. In the psychosocial development theory proposed by Eriksson [3], there is a development conflict in the fourth stage, known as “Industry vs. Inferiority”, which takes place during the early school years, from approximately ages 5 to 11, that matches the elementary school period. Children develop a sense of pride in their achievements and abilities through social interaction. If children are praised and encouraged often, they will develop a feeling of competence and belief in their skills; in the opposite situation, however, they will doubt their ability to become successful. If children develop smoothly and receive a balance at this stage of psychosocial development, they will obtain basic life skills and become full of confidence; otherwise, they will lack basic life skills and will be full of frustration. One can only rely on individuals to learn by themselves and to adapt themselves to solve crises caused by difficult problems. If self-conflict is resolved at this stage, then individuals can transition smoothly to the next stage; that is, a healthy personality can be developed [3,4].
Currently, many factors greatly affect “school education”, and these negative factors have resulted in a learning gap in some students. The main factors include (1) the rapid changes in society, (2) parents without enough time for family education, (3) the differences in parental education concepts, and (4) the gap in social economic status. Based on cognitive differences, fairness, and justice, educational institutions must treat disadvantaged students differently to eliminate the double peak (double normal distribution) phenomenon in learning. For sustainability in rural areas, an important educational issue is to determine the related key factors in students’ academic achievement and then formulate strategies to bridge the learning gap for disadvantaged students and help them to develop their full potential.
Based on sustainability-focused strategies in education, this study employs the concepts of a six sigma process improvement methodology [2] and the philosophy of six sigma is to identify critical factors for educational sustainability development (process or service improvement). This paper focuses on finding the key factors of academic achievement, and provides some suggestions to the educational stakeholders for continuous improvement. Furthermore, this study aims on finding the learning problem of disadvantaged students in rural areas, if the stakeholders can find the educational problems to improve and continue the process (educational sustainability development), the disadvantaged students can also achieve environmental and ethical awareness, values and attitudes, skills and behavior consistent with sustainable development and for effective public participation in decision-making.
The remaining contents of this paper are organized as follows: Section 2 describes the related work, including education for sustainability, rural education in Taiwan, academic achievement and its related factors, disadvantaged students, and feature selection. Section 3 describes the proposed method. The results and findings are presented in Section 4. Finally, Section 5 concludes the study.
2. Related Work
This section introduces the related work, including education for sustainability, rural education in Taiwan, academic achievement and its related factors, disadvantaged students, and feature selection.
2.1. Education for Sustainability
In recent decades, education has been described as the primary hope for a more sustainable future. The foundation of sustainable education development is to engage people and social groups in learning to live in a sustainable way. This approach includes a new educational vision that supports learners in reflecting on their priorities and defining their vision for sustainable development [5]. The focus of education for sustainability is on pedagogy because it aims to enable learners to cope with future complexities and uncertainties and to use mature and less well-known teaching methods [6], such as learning to change and systems thinking. The mainstreaming of sustainability in teacher education has been identified as a key priority in authoritative international documentation [7]. Preservice teacher education plays a vital role in achieving changes in school teaching and learning [8] and in shaping the knowledge and skills of future generations [9]. Bourn and Hunt [10] emphasized that education for sustainability can explain issues related to the goals of social teachers. These teachers are not only the key to promoting understanding and a capacity for sustainable development, they also support social justice, equity and environmental responsibility in our communities.
There are many studies on reorienting teacher education for sustainable development [10,11]; they emphasize the need to rethink content and abilities while also promoting the clarification of sustainability values and reflecting the development of practice. There are many experiences in embedding sustainability principles into specific preservice teacher education subjects, such as language or science education [12]. Many subjects have been rethought in order to tackle the sustainability challenge and help preservice teachers understand their personal and professional responsibilities regarding sustainable development.
2.2. Rural Education in Taiwan
Educational opportunities are often inextricably linked to geographic factors [13]. Due to the geographical location, the basis of education and industrial development in rural areas is not as good as that in urban areas [14]. Residents in remote areas have relatively weak learning motivations, aging population structure, a lack of cultural stimuli, a closed social atmosphere, and poverty in daily life. Children of low socioeconomic backgrounds cannot get well because of insufficient family education resources [15]. Furthermore, when the number of schools in the township is relatively small, then education problems are more easily overlooked by policy [16].
Taiwan is a relatively small island; the education system faces many of the same challenges as others in providing high-quality teaching to students living in more remote areas. All the top schools are located in the biggest cities and are a magnet for the most highly-qualified teachers—not to mention the most highly-motivated parents eager to make sure that their offspring make it into the best universities. This makes it very difficult for schools in smaller towns and rural areas to attract the talent they need to provide students from poorer families with a proper start in life [17]. Now, regarding rural education in Taiwan, there have been many groups of non-profit organizations engaged in after-school care or counseling, and many have achieved considerable results, such as the Bo Youth Foundation, the Yongling Hope Primary School, TFT (Teaching for Taiwan), etc. In 2015, the Minister of Education announced a program for rural education, and 29 teams will promote it in 224 schools nationwide. After the act for Education Development of Schools in Remote Areas [18] were released in 2017, the EDSRA act emphasized educational means, broad funding, flexible use of personnel, and improvement of teacher welfare means.
However, Taiwan’s various after-school programs implemented in rural areas are still based on cognition and remedial teaching, and teach the main courses such as Chinese, English and mathematics. Furthermore, teachers are still far away from the countryside to work in big cities, which leads to poor quality of rural education, and students’ learning motivation is not high. Therefore, this study was expected to find the learning factors of the disadvantaged students for a more sustainable future and provide some suggestions to educational organizations.
2.3. Academic Achievement and Its Related Factors
Academic achievement refers to the academic performance of an individual and is classified as low achievement and high achievement. Low achievement refers to the lower-than-expected standard of student achievement, such as high-intelligence students, and when the degree of academic achievement is in the middle or even lower levels, there is clearly a gap between expected achievements and real status, with “high intelligence but low achievement” often mentioned on campuses being a typical example. On the other hand, high achievement refers to students with a higher academic achievement than expected. For example, when medium-intelligence students have a higher academic achievement than expected, these students are high achievers [19,20].
Through an ability test, students’ general academic achievements, or achievements in special fields, can be understood [21]. These results can be used to classify capacity, group students, diagnose teaching, evaluate whether students have a high IQ but low achievement, determine whether there are special learning problems, or to serve as a reference for identifying outstanding talents; current academic achievements can even be used to predict entrance examination scores and the development of a student’s future. Therefore, assessing student academic achievement is not only used for obtaining a set of achievements but more importantly, for improving teaching and learning, diagnostic learning weakness and remedial teaching, the application of counseling and prediction.
Academic achievement is one of the explicit indicators of student performance in school; therefore, the study of factors affecting academic achievement has always been highly valued [20,22]. Factors affecting student academic achievement are highly extensive. As early as the 1960s, there was the “Coleman report”, a large-scale research report on academic achievement [23,24], and subsequently many submodels and applications based on this research were developed, which is important for academic achievement issues.
Regarding factors related to student achievement, Hattie [25] applied meta-analysis to analyze a huge body of empirical research, and calculate effect sizes (denoted d) for 138 influences covering six domains (student, home, school, curricula, teacher, and teaching strategies). Hattie’s research involved many millions of students and represents the largest ever evidence based research into what actually works in schools to improve learning. The six most effective influences relating to student achievement in Hattie’s work were: student self-reporting grades (d = 1.44), formative evaluation (d = 0.9), teacher clarity (d = 0.75), reciprocal teaching (d = 0.74), feedback (d = 0.73), and teacher-student relationships (d = 0.72). Guo et al. [26] explored factors related to students’ academic achievement, the factors, including learning motivation, learning strategies, classroom observation, and teacher perception. Furthermore, Guo et al. [26] also applied students’ final grades to evaluate academic achievement.
The factors affecting academic achievement can be roughly summarized as follows: psychological perspectives, student ability perspectives, environmental and ecological perspectives; the factors involved in environmental and ecological perspectives can be further divided into internal perspectives of the school, e.g., school effectiveness, and external perspectives of the school, e.g., social studies [27]. Some scholars have come to believe that four factors affect academic achievement: individual, family, school, and environment. (1) The individual aspect includes intellectual performance, learning attitude, motivation, and self-ambition [28,29]. (2) The family aspect refers to tangible and intangible resources that parents provide in terms of resources for their children, such as giving them the opportunity to attend after-school class and talent classes, a nurturing family environment, and a good parent-child interaction [30]. (3) The school aspect is the educational quality and facilities that schools can provide teachers, such as the campus environment, teaching quality, teacher-student interaction, and peer interaction [20,31,32]. (4) The environmental aspect refers to the impact of the external environment on schools or students, such as the gap between urban and rural environments [33].
2.4. Disadvantaged Students
Economic and educational inequalities hinder social mobility and decrease the chances of disadvantaged students achieving the same levels of academic success [34] as other students. Disadvantaged students are those whose family, social, or economic circumstances hinder their ability to learn at school; disadvantaged students usually come from families with a low socioeconomic status, and their parents are of a lower education background and have lower expectations for their children. These students lack experience in learning success, are likely to drop out of school, and exhibit low self-esteem [35,36]. The disadvantaged learner can be widely regarded as coming from a disadvantaged background: for example, a disadvantaged culture, disadvantaged socioeconomic status, and disadvantaged hardware equipment. The so-called disadvantaged learner is not necessarily a quantitative minority but has less power to control or dominate society than other social groups. Compared with advantaged groups, the disadvantaged group is more restricted in education, pursuit of financial success, and personal opportunities.
In Taiwan, the Ministry of Education divides disadvantaged students into three categories [37]: (1) students with physical and mental disabilities; (2) aboriginal students; and (3) socially disadvantaged students. Among these, the socially disadvantaged include three types: (i) social and environmental factors, as a lack of educational opportunities placing the individual in a disadvantaged environment of the community; (ii) family disadvantage, due to economic ability (low-income households, unemployed households), family type (intergenerational families, violent families, no-parent families), and language and culture (immigrant families, minorities, foreigners), which cause disadvantaged learning; and (iii) personal disadvantage factors, due to personal traits or experience, although this does not include physical and mental disabilities [38]. Based on social, family and personal disadvantages, the difficulties faced by disadvantaged students in learning can be divided into three facets: (1) academics - insufficient preparation for learning, weak learning ability, low learning motivation; (2) life - lack of basic living needs, poor family supervision, healthy living habits, and parents who cannot provide education counseling to children; and (3) behavior - deviant behavior, introverted problem behavior, and extroverted problem behavior.
2.5. Feature Selection
Feature selection is also called feature subset selection (FSS) or attribute selection. FSS refers to selecting fewer features from the original features to optimize the specific indicators of the system. FSS is the process of selecting some effective features from the original features to reduce the data dimension and improve the performance of the learning algorithm and is an important means and the key data preprocessing in research. For a learning algorithm, a good learning sample is the key to training the model [39].
“The better the features that can be selected, the greater the achievable performance will be”; this sentence is correct, but it can also easily cause misunderstanding. In fact, the experimental results depend on the selected model, data, and features, and indeed, the form of the problem and the objective methods to evaluate accuracy are also important factors. In addition, the results are also affected by many interdependent features; hence, the key features are needed because they can properly describe the internal structure of the data [40].
For a dataset, even a normal model (or algorithm) can achieve a better performance as long as the features are chosen effectively because most models (or algorithms) perform well under good data features. The flexibility of key features is that they allow the selection of an uncomplicated model while running faster and are easier to understand and interpret. With good features, even if the parameter is not optimal, model performance will still be effective; hence, researchers need not spend excessive time searching for the best parameters, which strongly reduce the complexity of the model to make the model easier. Clearly, the better the features that can be selected, the greater the achievable performance [41,42].
3. Proposed Method
For sustainability education in rural areas, this study aimed to determine the related key factors in student academic achievement and then formulate strategies to bridge the learning gap for disadvantaged students and help them develop their potential. The following introduces the previous studies and the concept behind the proposed method:
Most studies on student academic achievement have been based on the three steps: (1) use of the self-report scale to collect data, which is prone to bias in degree of authenticity and objectivity; (2) use of descriptive statistics analysis, whose degree of data interpretation may be a superficial phenomenon and not thorough enough; and (3) a linear model, which is established to predict student academic achievement. Moreover, the relevant background factors are lower in analysis and interpretation.
Therefore, based on data objectivity, this study collected the raw data from the “Student Profile” and “Tutorship Record” database of an elementary school as the research dataset. After preprocessing, four feature selection methods were employed to extract the key features affecting student academic achievement, then a difference analysis of various student backgrounds was conducted. Finally, various students were interviewed to determine the focus of their education and upbringing.
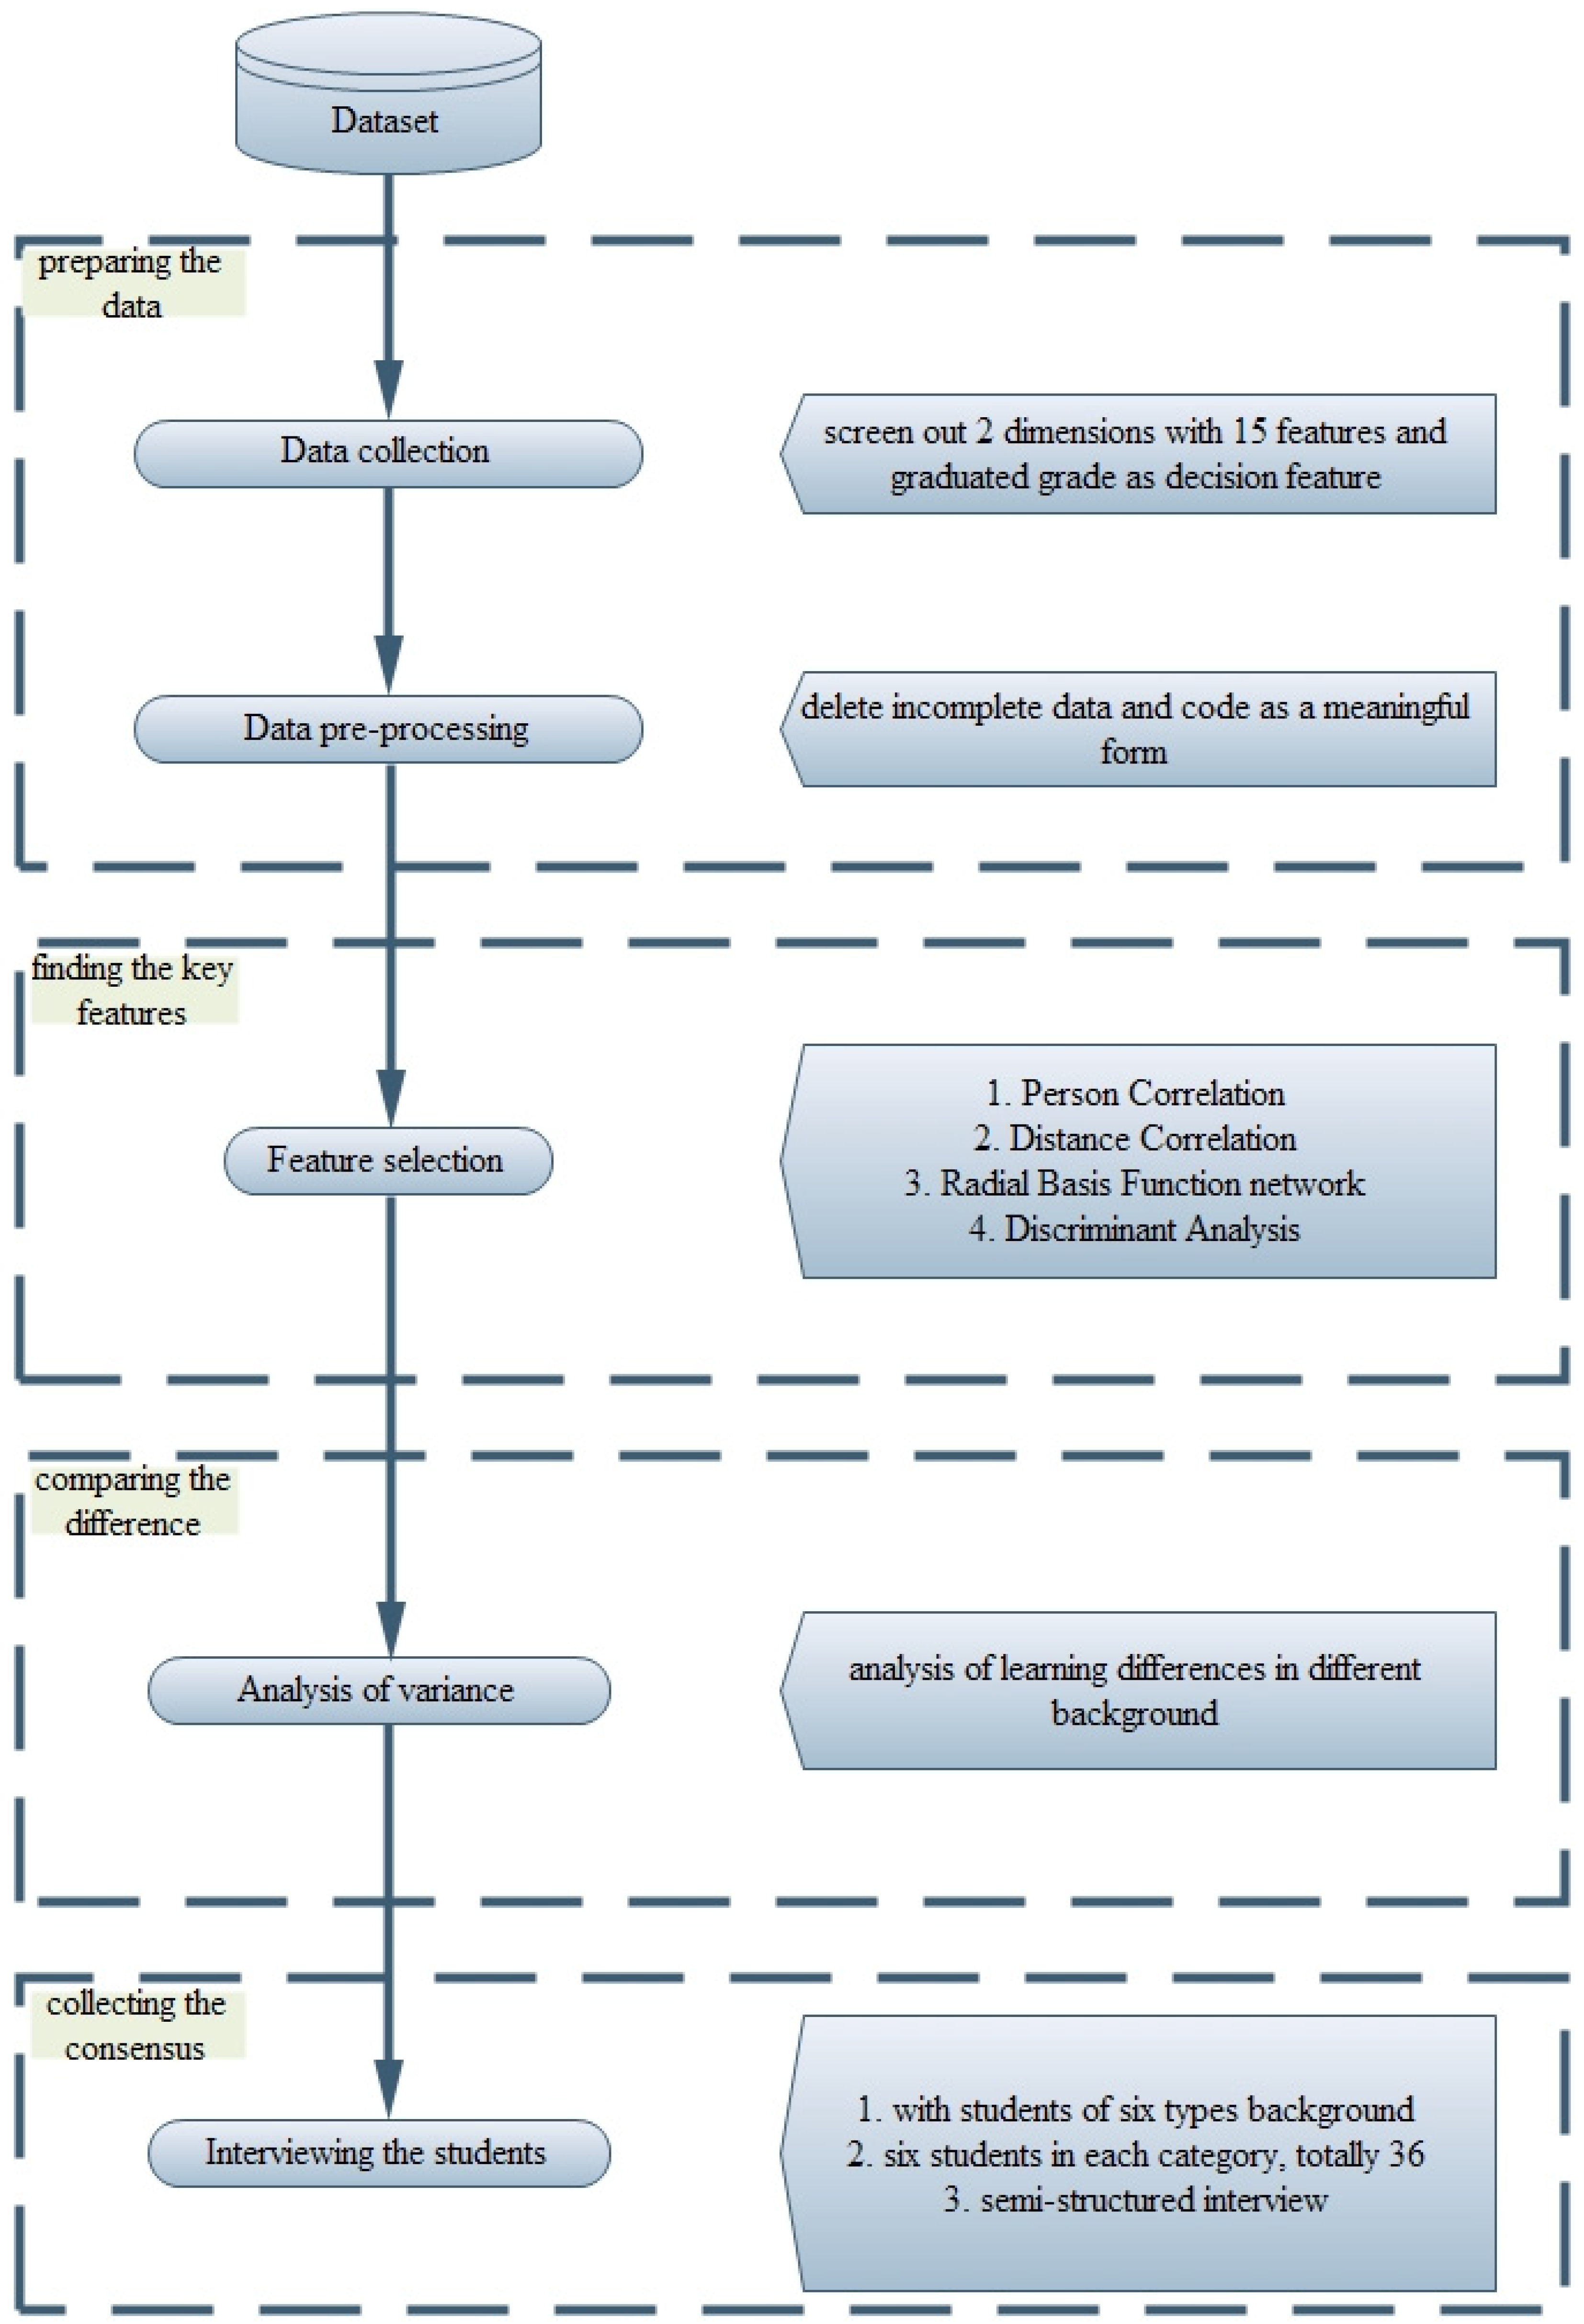
To facilitate a more rapid understanding of the proposed method, this study followed a procedure that included five steps, as shown in Figure 1. The detailed steps are introduced below.

Figure 1.
The procedure of the proposed method.
Step 1 Data Collection
The raw data was collected from an elementary school in central Taiwan. From student entry to graduation, all the relevant student information was recorded by the teachers in the “Student Profile” and “Tutorship Record” databases. To obtain the related factors in student academic achievement, this study was based on the available factors (total 16 features) affecting student academic achievement (see Table 1) to conduct a majority consensus, which asked 12 senior professional teachers to carry out the focus interviews. Last, based on the majority consensus, all 16 features were retained and partitioned into two dimensions with 15 features and one decision feature (class). Lastly, this step consolidates the “Student Profile” and “Tutorship Record” databases into an integrated dataset to obtain the six-year dataset; the integrated dataset has 16 features with 883 records (see Table 2).

Table 1.
Available factors affecting student academic achievement.
Table 2.
Dataset description.
Step 2 Data Preprocessing
The integrated dataset includes 883 records; after removing incomplete data and missing values, 870 records were retained. Because of the many textual description data in the integrated dataset, for our research objective, this step converts textual description data into a meaningful symbol (see the last column in Table 2).
Step 3 Feature Selection
After data preprocessing, this step utilizes four feature selection methods to select the important features, the four feature selection methods were: (1) Pearson Correlation [57]—linear relationships, (2) Distance Covariance [58]—nonlinear correlation, (3) Radial Basis Function network [59]—machine learning algorithm, and (4) Discriminant Analysis [60]—statistical method. Next, this study proposed an integrated feature selection method to select the key features, which included four steps:
- Employ four feature selection methods to calculate the important degree of the features;
- Rank the ordering of each feature selection method from first name to fifteenth name. If the feature selection method shows N/A, then give the fifteenth name (see Table 9);
- In each feature, sum the rankings of four feature selection methods (see Table 9);
- From the four feature selection methods, when the weight of the feature was smaller than the threshold (such as 9%) in two feature selection methods, this denotes that these features had a lower correlation with students’ academic achievement. Next, the top nine features were selected as the key features (see Table 9).
Step 4 Difference of Analysis for Students’ Background
This study aimed to analyze the difference in the various backgrounds in key factors and the graduated score, as well as to determine the focus of education and upbringing. Step 3 shows that a student’s identity background (FB_6) is the key feature of academic achievement, and the key feature FB_6 contains six different students’ backgrounds: Ordinary student (O), Aboriginal student (A), Foreign bride family student (F), Low-income student (L), Single-parent student (S), and Intergenerational education student (T).
First, this step applied a t-test to determine whether there were differences between ordinary and disadvantaged students in eight key features and the graduated score. Secondly, this study employed analysis of variance (ANOVA) to test whether there were differences among five groups of disadvantaged students in eight key features and the graduated score; i.e., the ordinary students group was removed to test their results.
Step 5 Interviews
To verify the analysis results and determine the focus of education and upbringing, this study designed a semi-structured questionnaire [61] to interview students with different backgrounds; the questionnaire includes three aspects with nine questions (see Table 3). Data saturation of the grounded theory is known as theoretical saturation [62], which means that the data (usually number of interviews) collected adds nothing new to the understanding of the research topic. Therefore, this study randomly sampled 36 students from six different background groups, and each group comprised six students for reaching the majority consensus. Most groups had apparently reached nothing new when interviewing the third student of each group, because the interview employed a semi-structure questionnaire. The interview collected student’s experiences and perceptions in learning situations, after which we integrated the majority consensus to show the differences among various groups of students.
Table 3.
Open-ended questions in the interview.
Ethical considerations
Interviews were conducted on 1 February 2018. This study designed a semi-structured questionnaire to interview 36 students in six different background groups, and each group comprised 6 students. The interviews were approved by the parents of the 36 students, and the parents signed the agreement form. During the interview process, any student could choose to respond or not to respond to any question, and the interview data remained confidential and was only used for research analysis.
4. Data Analysis and Results
This section utilized the proposed procedure in Section 3 to determine the key features and analyze the differences in various students’ identity backgrounds. The results of the analysis, interviews, and findings are also presented in this section.
4.1. Descriptive Statistics
The collected dataset is from a public elementary school built in 1899 in central Taiwan with uniformly standard curriculum planning, teaching goals, and related criteria created by the Ministry of Education. There were 80 teachers and staff members, and the first-year to sixth-year students were divided into 40 classes with a total of 1300 students in the school. From Step 1 and in light of the proposed procedure in Section 3, the 12 senior professional teachers recommended 15 features and a decision feature (class) to collect data for the research dataset. The collected dataset contained many texts written by teachers to describe the students’ living and learning status; hence, this study coded the contents in symbolic form to denote its original meaning. Next, the collected dataset, including 15 features and one class feature, was partitioned into three parts to introduce their features for numeric, symbolic, and class in detail.
(1) Numeric feature
The numeric feature includes 10 features: average score of language (LE_1), average score of mathematics (LE_2), average score of science (LE_3), average score of arts (LE_4), average score of social (LE_5), average score of physical education (LE_6), average score of integrated activities (LE_7), average score of behavior (LE_8), parent’s age (FB_3), and the number of children (FB_4). The descriptive statistics of the 10 features are shown in Table 4.
Table 4.
Descriptive statistics for numeric features.
(2) Symbolic feature
The Symbolic feature contained five features: education levels of parents (FB_1), occupations of parents (FB_2), birth order (FB_5), student identity background (FB_6), and teacher (FB_7). Therefore, this study coded the five features as meaningful values for further research. The following describe the coding method for the FB_1, FB_2, FB_5, FB_6, and FB_7 features, respectively:
- Education levels of parents (FB_1): The highest educational level of one of the parents, and its code and frequency are listed in Table 5.
Table 5. Education degree of parents (FB_1).
- Occupations of parents (FB_2): The feature records one of the parents who is the family’s main income source, and the occupation classification based on the Council of Labor Affairs Vocational Training Council (Taiwan); the code and frequency of each occupation classification are shown in Table 6.
Table 6. Parent’s occupation (FB_2).
- Birth order (FB_5): The rankings of students among their brothers and sisters in their family, which was coded as numerical ordering (see FB_5 of Table 2).
- Student identity background (FB_6): This feature was recorded by the teacher who undertook the students’ family visits. To determine the students’ identity background, the feature was divided into six different groups: the symbol for the aboriginal student was “1”, the foreign child student was coded as “2”, the low-income household student was “3”, the single-parent student was coded as “4”, the intergenerational education student was “5”, and the ordinary family student was “6”. The code and frequency of each group are listed in Table 7.
Table 7. Student identity background (FB_6).
- Teacher (FB_7): Each teacher who tutored a class of students from entry to graduation; the collected data included 15 teachers who taught and tutored their class students. Hence, this study coded the 15 teachers as a symbolic value of 1–15 to represent each teacher (see Table 2).
(3) Decision Class
This study employed the students’ graduated total average score as the decision feature based on five grade assessments by the Ministry of Education. The total average score was transformed into five grades, as shown in Table 8. From the collected data, the total average score below 70 was small; hence, we merged the three poor grades into one grade (value 3). Thus, the coding method was the following:
Table 8.
Decision class.
- (a)
- a score greater than 90 was labeled as “1”,
- (b)
- an 80–89 range was labeled as “2”, and
- (c)
- others below 80 were labeled as “3”.
Therefore, the decision class and the frequency of each class were listed in Table 8.
4.2. Finding the Key Features
After data preprocessing, the integrated dataset contained 870 records employed as the study’s dataset. Based on Step 3 of the proposed procedure, this section utilized (1) Pearson Correlation (PC), (2) Distance Covariance (DC), (3) Radial Basis Function (RBF) network, and (4) Discriminant Analysis (DA) to determine the key features that affected the academic achievement of students. Based on Step 3 of the proposed procedure, the selected features using the four feature selection methods are listed in Table 9. To determine the key features, this study had to integrate the selected features using the four feature selection methods. After integrating the selected features in Table 9, the features with a lower correlation with students’ academic achievement were discarded. For example, for the FB_7 in the last row of Table 9, the weight of two feature selection methods was smaller than 0.09 (9%), then this study discarded the FB_7 feature. Similarly, the same situation applied for FB_1, FB_2, FB_3, FB_4, and FB_5 (the weight of two feature selection methods was smaller than 0.09). Hence, this study selected the top nine features-LE_1, LE_2, LE_3, LE_4, LE_5, LE_6, LE_7, LE_8, and FB_6-as the key features.
Table 9.
Result of feature selection.
4.3. Difference Analysis of Different Student Identity Backgrounds
To understand the difference problems in various of students’ identity backgrounds, this study employed a t-test to determine if there was a significant difference between the mean of ordinary and disadvantaged students in the eight key features and the graduated score. The results show that the average scores of ordinary family students were better than those of disadvantaged students except for LE_4 and LE_7, which show no significant difference (see Table 10). Since this study considered a set of statistical inferences simultaneously, to understand whether erroneous inferences were made, Bonferroni correction [63] and Benjamini-Hochberg procedure correction [64] were employed. After multiple testing corrections, the language average score (LE_1) and math average score (LE_2) also had a difference in the Bonferroni correction; from the Benjamini-Hochberg procedure correction, the results were same, with no multiple testing correction. The results show that ordinary family students were better than those of disadvantaged students except for LE_4 and LE_7.
Table 10.
Differences analysis of two groups of students for t-test.
To understand whether there were differences among the five groups of disadvantaged students in the eight key features and the graduated score, this study employed analysis of variance (ANOVA) to test if there was a significant difference. The collected dataset included 203 disadvantaged students; the five groups of disadvantaged students were 27 aboriginal students, 55 foreign child students, 36 low-income household students, 51 single-parent students, and 34 intergenerational education students. The detailed codes and frequencies of each group are listed in Table 7. The results of ANOVA are shown in Table 11. We found that the average scores of the five groups had significant differences among the eight key features and the graduated score, except LE_3 and LE_6. In addition, the post hoc analysis of Tukey HSD [65] showed that (1) the foreign bride family students are better than the aboriginal students in LE_1, LE_2, LE_4, LE_5 and the graduated score, and that (2) the single-parent students are better than the aboriginal students in LE_1, LE_2, LE_4, LE_7, LE_8, and the graduated score. All in all, teachers must pay more attention to aboriginal students in terms of learning motivation and situation.
Table 11.
ANOVA analysis of student identity background.
4.4. Interviews
To trace and understand the differences between ordinary students and the five groups of disadvantaged students, this study used the open-ended questions in Table 3 to collect interview data from the six groups with 36 students, with each group comprising 6 students. The interviews collected student experiences and perceptions in learning situations, after which we integrated the majority consensus to show the differences among various groups of students. The interview results are summarized based on personal, family, and school aspects as follows.
A. Personal aspect:
In Table 3, the personal aspect contains three questions, and the interview results based on the majority consensus are summarized in Table 12. Based on Table 12, we see the following:
Table 12.
Majority consensus of the personal aspect.
- (1)
- The ordinary family students with full learning resources must finish their homework and conform to parents’ expectations; however, they have little personal and recreation time;
- (2)
- The aboriginal students lack learning resources and their parents have not monitored their learning/homework; thus their learning attitude is negative; therefore, they have much recreation time to remain outside and participate in religious activities and make friends with the many students who have dropped out.
- (3)
- The foreign child students are similar to the ordinary family students, except for recreation time and feeling disagreeable.
- (4)
- The low-income household students lack learning resources and must help in family work, have no money to play online games, and their parents have no time to monitor their learning/homework. However, they have personal time to participate in religious activities and make friends with the many students who have dropped out.
- (5)
- The single-parent students are the same as the foreign bride family students, except for staying outside, having many friends, and making friends with the many students who have dropped out.
B. Family aspect:
This family aspect included three questions (see Table 3) based on the majority consensus; this study summarized the interview results in Table 13, which showed the following:
Table 13.
Majority consensus of the family aspect.
- (1)
- The parents of ordinary family students take active care of their children’s life and learning, and when their children have any questions, they first seek their parents’ assistance. Furthermore, these parents tell their children, “Now, you must study hard for a better life in the future,” and their support of children’s learning is high.
- (2)
- The parents of aboriginal students are more indulgent than disciplinary, occasionally exhibit inappropriate educational behavior (e.g., alcohol and tobacco use), and are similar to friends. However, their educational concepts include being “free, happy, and living”, and their support of their children’s learning is low.
- (3)
- Compared with ordinary students, the parents of foreign child students are more prone to an extreme upbringing. Furthermore, foreign brides often talk to their children about their life in their home country, and they pay attention to children’s clothing and dressing. Moreover, their expectations include “Now, you must study hard for a better life in the future,” and their support of children’s learning is medium.
- (4)
- The parents of low-income household students are often not at home for work-related reasons; thus, the parents’ educational concepts include “Try to learn; don’t force yourself,” and their support of children’s learning is low.
- (5)
- The parents of single-parent students are often not at home for work-related reasons; they often arrange tours or eat together on holidays, and they tell their children “Now, you must study hard for a better life in the future”; however, their support of their children’s learning is medium.
- (6)
- The parents of intergenerational education students have various reasons not to be with their children, and the parents and grandparents often give money and toys to children. However, their educational concepts include, “Try to learn, don’t force yourself”, and their support of their children’s learning is medium.
- (7)
- The intergenerational education students are similar to the low-income household students, except for recreation time and playing online games.
C. School aspect:
Table 3 shows that the school aspect also had three questions, and this study was based on the majority consensus to summarize the interview results in Table 14. We found the following:
Table 14.
Majority consensus of the school aspect.
- (1)
- All groups of students enjoy interacting with classmates and teachers, except aboriginal students, who consider that if classmates and teachers were friendly, then they would interact with them.
- (2)
- The parents of ordinary family students who participate in all school activities and courses often interact with teachers. However, the parents of aboriginal students select their favorite school activities and very rarely interact with teachers.
- (3)
- The parents of foreign child students and single-parent students only select the parent-child issue to participate in school activities and courses and sometimes interact with teachers.
- (4)
- The parents of low-income household and intergenerational education students rarely interact with teachers. Furthermore, the parents of low-income household students only participate in school activities and courses without paying fees, and the parents of intergenerational education students only participate in no-stress school activities and courses.
4.5. Findings
Based on the aforementioned analysis in Section 4.1, Section 4.2, Section 4.3 and Section 4.4, the results show that (1) the key features were found using an integrated feature selection approach, (2) there are indeed differences in academic achievement between ordinary students and disadvantaged students, (3) the five different disadvantaged groups show significantly differences, and (4) after interviewing, the integrated majority consensus of the six groups could determine the difference in learning environment. In the following section, we summarized some findings and provided references for sustainable education for educational organizations.
A. Sustainable education
The collected data came from an elementary school in rural areas in central Taiwan. From Table 5, we see that most of the parents (72.3%) had education levels below the college-degree level, 73% of the parents were staff members and workers (Table 6), and 26.4% were disadvantaged students in this school (Table 7). From Table 3, we see that the age range of students’ parents was from 30–64 years, and the average number of children was 2.57 for students’ families.
We are most concerned with an elementary school with 26.4% disadvantaged students, which means that the education problem is highly serious in rural areas. Based on sustainable education, this study suggests that educational organizations must invest in significant resources and make more effective policies a priority for teachers. Since Taiwan comprises six major metropolitan areas and other rural suburbs, due to rapid economic growth, the metropolis areas provide a large number of employment opportunities, and these opportunities have pushed many rural laborers into the city to earn a living in industry and commerce and, at the same time, caused the rapid expansion of the urban population. This urbanized development has led to an aging population in rural areas and rural residents who are less skilled and competitive.
Therefore, there are many educational problems for disadvantaged students in rural areas, and disadvantaged parents in particular have low expectations for their children. Furthermore, there is the aging of teachers, the loss of teachers, the difficulty in recruiting new teachers, and the increasingly heavy burden of tutors. These problems require that the government and related organizations invest in significant resources and make more effective policies a priority for teachers.
B. Key features
Section 4.2 shows that this study discovered the key features using the proposed integrated features selection method; these key influential features were the following: language average score (LE_1), math average score (LE_2), science average score (LE_3), arts average score (LE_4), social average score (LE_5), physical average score (LE_6), integrated activities average score (LE_7), behavior average score (LE_8) and students’ identity background (FB_6). We are most concerned with students’ identity background (FB_6), and the results show that this resulted in a learning difference.
C. Conformity of significant difference and interviews
(1) Ordinary students and disadvantaged students
This section uses a t-test to determine the differences between ordinary students and disadvantaged students, and the results show that ordinary family students do better than the disadvantaged students in the average scores of the eight key features and the graduate score, except LE_4 and LE_7, which showed no significant difference, as seen in Table 10. From the majority consensus of the interviews in Section 4.4, because ordinary family students had full learning resources, they had to finish their homework and conform to their parents’ expectations, whereas the parents of ordinary families told their children, “Now, you must study hard for a better life in the future”, and showed a very high level of support for their children’s learning. Finn and Rock [36] found that student engagement was an important component of academic resilience (academically successfully school completer). This study also found that the disadvantaged students usually came from families with a low socioeconomic status, and their parents were of a lower education background and had lower expectations for their children. Therefore, we suggest that the teachers must actively interact with disadvantaged students and their parents for a deeper understanding students’ learning motivation.
(2) Five disadvantaged groups
The disadvantaged students numbered 203 in this case study, were divided into five groups (see Table 7). This study applied ANOVA to test the differences among the five groups of disadvantaged students in the eight key features and the graduated score. The results of ANOVA show that the average scores of the five groups exhibited significant differences in the eight key features and the graduated score, except LE_3 and LE_6. In addition, the post hoc comparison of Tukey HSD shows that
- Foreign child students were better than the aboriginal students in LE_1, LE_2, LE_4, LE_5 and the graduated score; and
- The single-parent students were better than the aboriginal students in LE_1, LE_2, LE_4, LE_7, LE_8 and the graduated score.
- From Table 12, Table 13 and Table 14, we obtained a new finding that foreign child students and single-parent students were better than the aboriginal students in some academic achievements. Because foreign child students and single-parent students had to: (1) do homework, (2) attend after-school class and talent class, (3) have a positive learning attitude, strive and be obedient to parents’ expectations, (4) their parents expected that their children must study hard for a better life in the future, (5) their parents participated in school activities and courses (selected pattern), and (6) they interacted with classmates and teachers.
(3) Aboriginal students
The aforementioned results show that the aboriginal students were the worst group among the disadvantaged students. The reasons can be found in the majority consensus of Section 4.4:
- The aboriginal students lacked learning resources and their parents did not monitor their learning/homework. Furthermore, their learning attitude was negative, and they made friends with the majority of students who dropped out;
- The parents of aboriginal students were more indulgent than disciplinary, occasionally exhibiting inappropriate educational behavior (e.g., alcohol and tobacco use), and their educational concepts were “free, happy, and living”; and
- The parents of aboriginal students showed low support for their children’s learning, select their favorite school activities, and rarely interact with teachers.
Overall, the parents of aboriginal students were more indulgent than disciplinary, occasionally exhibiting inappropriate educational behavior, and their educational concepts were “free, happy, and living”, and low support for their children’s learning. Therefore, the teachers must pay more attention to aboriginal students in terms of making friends, learning motivation, and actively interact with their parents.
(4) Foreign child student and single-parent students
Table 10 and Table 11 show that the average score of foreign child students and single-parent students was slightly lower than the ordinary students in eight key features and the graduated score; however, the two groups show better academic achievements in the disadvantaged students.
Their parents told their children, “Now, you must study hard for a better life in the future”, and their support of their children’s learning was medium; furthermore, parents only selected the parent-child issue to participate in school activities and courses, and they sometimes interacted with teachers. However, teachers need to pay attention to the foreign child students and single-parent students who make friends with the majority of students who drop out.
5. Conclusions
This study proposed an integrated features selection method to integrate four different feature selection methods and determine the key features of academic achievement. To understand the differences in various students’ backgrounds, this paper utilized a t-test and ANOVA to explore the differences in various students’ backgrounds in nine key features and the graduated score. The results show that the ordinary students and disadvantaged students indeed showed differences, and further analyzing the five disadvantaged groups also showed differences, with the aboriginal students being the worst group among the disadvantaged students. To explain these differences, this study carried out interviews with six different students’ identity backgrounds, and the majority consensus of the six groups of students was divided into personal, family, and school aspects.
Given the research results, we suggest that: (1) teachers and staff members must pay more attention to aboriginal students in terms of learning motivation and situation and actively interact with their parents, (2) teachers need to pay attention to foreign brides’ families and the single-parent students in terms of making friends with the majority of students who dropped out, (3) the teachers and staff members must actively interact with the disadvantaged students and care about their lifestyle, (4) student engagement is an important component of academic resilience [35], teachers should encourage students to participate in school activities and stimulate learning motivation and self-efficacy, and (5) based on an elementary school with more than 25% disadvantaged students, the government must establish a disadvantaged care act (proposed law) for resource investment and teacher education.
To reach sustainable education in rural areas, this study suggests that the Taiwan Ministry of Education and stakeholders must invest more effects and resources, and develop more effective policies to inspire teachers who are willing to work in rural areas. To shape a good educational environment, teachers are willing to input their effects, and take the initiative to care for disadvantaged students. Teachers must pay more attention to aboriginal students in terms of learning motivation and actively interact with their parents. We know that the sustainable education is the responsibility of everyone, it is not the responsibility of a few decision makers; all people must understand that education is all social activities that enhance people’s knowledge and skills and influence people’s ideas. Therefore, sustainable educational development is a very important issue to inspire people and social groups in learning to live in a sustainable way.
In future research, we can further study subjects such as how resources are allocated to disadvantaged students, how teachers actively interact with disadvantaged students and parents, and how qualified teachers are recruited for disadvantaged students.
Author Contributions
Conceptualization, C.-H.C.; Methodology, C.-H.C. and W.-X.L.; Validation, Y.-C.W.; Formal Analysis, W.-X.L.; Investigation, W.-X.L.; Resources, W.-X.L.; Data Curation, Y.-C.W.; Writing-Original Draft Preparation, W.-X.L.; Writing-Review & Editing, C.-H.C.
Funding
This research received no external funding.
Conflicts of Interest
The authors declare no conflicts of interest.
References
- The Section Information of Sustainable Education and Approaches in Sustainability Journal. 2019. Available online: https://www.mdpi.com/journal/sustainability/sections/education_and_approaches (accessed on 5 October 2019).
- Narula, V.; Grover, S. Improving Quality of Education using Six Sigma DMAIC Methodology: A Case Study of a Self-Financed Technical Institution in India. Int. J. Qual. Assur. Eng. Technol. Educ. 2015, 4, 49–61. [Google Scholar] [CrossRef]
- Erikson, E.H.; Erikson, J.M. The Life Cycle Completed (Extended Version); W. W. Norton & Co.: New York, NY, USA, 1997. [Google Scholar]
- Hoare, C.H. Erikson’s general and adult developmental revisions of Freudian thought: Outward, forward, upward. J. Adult Dev. 2005, 12, 19–31. [Google Scholar] [CrossRef]
- Tilbury, D.; Wortman, D. Engaging People in Sustainability, Commission on Education and Communication; IUCN: Cambridge, UK, 2004. [Google Scholar]
- Mulà, I.; Tilbury, D.; Ryan, A.; Mader, M.; Dlouhá, J.; Mader, C.; Benayas, J.; Dlouhý, J.; Alba, D. Catalysing change for sustainability in higher education: A review of professional development initiatives for university educators. Int. J. Sustain. High. Educ. 2017, 18, 798–820. [Google Scholar] [CrossRef]
- UNESCO. UNESCO Roadmap for Implementing the Global Action Programme on Education for Sustainable Development; UNESCO: Paris, France, 2014; Available online: https://unesdoc.unesco.org/ark:/48223/pf0000230514 (accessed on 14 June 2019).
- Ferreira, J.A.; Ryan, L.; Tilbury, D. Mainstreaming education for sustainable development in initial teacher education in Australia: A review of existing professional development models. J. Educ. Teach. 2007, 33, 225–239. [Google Scholar] [CrossRef]
- UNESCO. Guidelines and Recommendations for Reorienting Teacher Education to Address Sustainability. In Education for Sustainable Development in Action; UNESCO: Paris, France, 2005; Available online: https://unesdoc.unesco.org/ark:/48223/pf0000143370 (accessed on 14 June 2019).
- Bourn, D.; Hunt, F. A Review of Education for Sustainable Development and Global Citizenship Education in Teacher Education. Background Paper Prepared for the 2017/8 Global Education Monitoring Report. 2017. Available online: https://unesdoc.unesco.org/ark:/48223/pf0000259566 (accessed on 15 June 2019).
- Hopkins, C.; McKeown, R. Teacher Education and Education for Sustainable Development: Ending the DESD and Beginning the GAP. Report from the UNESCO Chair on Reorienting Teacher Education to Address Sustainability. 2014. Available online: https://www.kdp.org/initiatives/pdf/TeacherEdESDChairReport.pdf (accessed on 13 June 2019).
- Wals, A.E.J.; Brody, M.; Dillon, J.; Stevenson, R.B. Convergence between science and environmental education. Science 2014, 344, 583–584. [Google Scholar] [CrossRef]
- Tate, W.F. Geography of opportunity: Poverty, place, and educational outcomes. Educ. Res. 2008, 37, 397–411. [Google Scholar] [CrossRef]
- Miller, L.C. Situating the rural teacher labor market in the broader context: A descriptive analysis of the market dynamics in New York state. J. Res. Rural Educ. 2012, 27, 1–31. [Google Scholar]
- Burton, M.; Johnson, A.S. “Where else would we teach?”: Portraits of two teachers in the rural south. J. Teach. Educ. 2010, 61, 376–386. [Google Scholar] [CrossRef]
- Trinidad, S.; Sharplin, E.; Ledger, S.; Broadley, T. Connecting for innovation: Four universities collaboratively preparing pre-service teachers to teach in rural and remote western Australia. J. Res. Rural Educ. 2014, 29, 1–13. [Google Scholar]
- Learn Mode 2018. Available online: https://brownbeat.net/2018/09/ (accessed on 10 September 2018).
- EDSRA Act 2017. Available online: https://law.moj.gov.tw/ENG/LawClass/LawAll.aspx?pcode=H0070073 (accessed on 5 October 2019).
- Fan, X.; Chen, M. Parental involvement and students’ academic achievement: A meta-analysis. Educ. Psychol. Rev. 2001, 13, 1–22. [Google Scholar] [CrossRef]
- Rivkin, S.G.; Hanushek, E.A.; Kain, J.F. Teachers, schools, and academic achievement. Econometrica 2005, 73, 417–458. [Google Scholar] [CrossRef]
- Dornbusch, S.M.; Ritter, P.L.; Leiderman, P.H.; Roberts, D.F.; Fraleigh, M.J. The relation of parenting style to adolescent school performance. Child Dev. 1987, 58, 1244–1257. [Google Scholar] [CrossRef] [PubMed]
- Hansford, B.C.; Hattie, J.A. The relationship between self and achievement/performance measures. Rev. Educ. Res. 1982, 52, 123–142. [Google Scholar] [CrossRef]
- Coleman, J.S. Social capital in the creation of human capital. Am. J. Sociol. 1988, 94, S95–S120. [Google Scholar] [CrossRef]
- Coleman, J.S.; Campbell, E.Q.; Hobson, C.J.; McPartland, J.; Mood, A.M.; Weinfeld, F.D.; York, R.L. Equality of Educational Opportunity (Washington, DC, Government Printing Office). J. R. Stat. Soc. 1966, 156, 938. [Google Scholar]
- Hattie, J. Visible Learning: A Synthesis of Over 800 Meta-Analyses Relating to Achievement; Routledge: New York, NY, USA, 2008. [Google Scholar]
- Guo, H.; Tong, F.; Wang, Z.; Min, Y.; Tang, S. English- vs. Chinese-Medium Instruction in Chinese Higher Education: A Quasi-Experimental Comparison. Sustainability 2018, 10, 4230. [Google Scholar] [CrossRef]
- Dijkstra, A.B.; Peschar, J.L. Social capital in education. Theoretical issues and empirical knowledge in attainment research. In The International Handbook on the Sociology of Education; Rowman Littlefield: Lanham, MD, USA, 2003; pp. 58–81. [Google Scholar]
- Gardner, R.C.; Lambert, W.E. Attitudes and Motivation in Second-Language Learning; Newbury House Publishers: Rowley, MA, USA, 1972. [Google Scholar]
- Hammouri, H. Attitudinal and motivational variables related to mathematics achievement in Jordan: Findings from the Third International Mathematics and Science Study (TIMSS). Educ. Res. 2004, 46, 241–257. [Google Scholar] [CrossRef]
- Lee, J.S.; Bowen, N.K. Parent involvement, cultural capital, and the achievement gap among elementary school children. Am. Educ. Res. J. 2006, 43, 193–218. [Google Scholar] [CrossRef]
- Baker, J.A. Teacher-student interaction in urban at-risk classrooms: Differential behavior, relationship quality, and student satisfaction with school. Elem. Sch. J. 1999, 100, 57–70. [Google Scholar] [CrossRef]
- King, A. Enhancing peer interaction and learning in the classroom through reciprocal questioning. Am. Educ. Res. J. 1990, 27, 664–687. [Google Scholar] [CrossRef]
- Qian, X.; Smyth, R. Measuring regional inequality of education in China: Widening coast—Inland gap or widening rural–urban gap? J. Int. Dev. 2008, 20, 132–144. [Google Scholar] [CrossRef]
- Sammons, P.; Toth, K.; Sylva, K. The drivers of academic success for ‘bright’ but disadvantaged students: A longitudinal study of AS and A-level outcomes in England. Stud. Educ. Eval. 2018, 57, 31–41. [Google Scholar] [CrossRef]
- Croninger, R.G.; Lee, V.E. Social capital and dropping out of high school: Benefits to at-risk students of teachers’ support and guidance. Teach. Coll. Rec. 2001, 103, 548–581. [Google Scholar] [CrossRef]
- Finn, J.D.; Rock, D.A. Academic success among students at risk for school failure. J. Appl. Psychol. 1997, 82, 221. [Google Scholar] [CrossRef]
- MOE (Ministry of Education). The Record of Review and Improving on Education Reform Conference; Ministry of Education: Taipei, Taiwan, 2001. [Google Scholar]
- Lee, V.E.; Burkam, D.T. Inequality at the Starting Gate: Social Background Differences in Achievement as Children Begin School; ERIC; Economic Policy Institute: Washington, DC, USA, 2002. [Google Scholar]
- Guyon, I.; Elisseeff, A. An introduction to variable and feature selection. J. Mach. Learn. Res. 2003, 3, 1157–1182. [Google Scholar]
- Yu, L.; Liu, H. Feature selection for high-dimensional data: A fast correlation-based filter solution. In Proceedings of the Twentieth International Conference (ICML 2003), Washington, DC, USA, 21–24 August 2003. [Google Scholar]
- Liu, H.; Motoda, H. Computational Methods of Feature Selection; eBook Published: New York, NY, USA, 2007. [Google Scholar]
- Liu, H.; Motoda, H. Feature Selection for Knowledge Discovery and Data Mining; Springer Science & Business Media: Berlin, Germany, 2000. [Google Scholar]
- Bosworth, D. Truancy and pupil performance. Educ. Econ. 1994, 2, 243–264. [Google Scholar] [CrossRef]
- DiMaggio, P.; Mohr, J. Cultural capital, educational attainment, and marital selection. Am. J. Sociol. 1985, 90, 1231–1261. [Google Scholar] [CrossRef]
- Katsillis, J.; Rubinson, R. Cultural capital, student achievement, and educational reproduction: The case of Greece. Am. Sociol. Rev. 1990, 55, 270–279. [Google Scholar] [CrossRef]
- Mayer, S.E. What Money Can’t Buy: Family Income and Children’s Life Chances; Harvard University Press: Cambridge, MA, USA, 1998. [Google Scholar]
- Astone, N.M.; McLanahan, S.S. Family structure, parental practices and high school completion. Am. Sociol. Rev. 1991, 56, 309–320. [Google Scholar] [CrossRef]
- Israel, G.D.; Beaulieu, L.J.; Hartless, G. The influence of family and community social capital on educational achievement. Rural Sociol. 2001, 66, 43–68. [Google Scholar] [CrossRef]
- Thomson, E.; Hanson, T.L.; McLanahan, S.S. Family structure and child well-being: Economic resources vs. parental behaviors. Soc. Forces 1994, 73, 221–242. [Google Scholar] [CrossRef]
- Boccio, C.M.; Beaver, K.M. Further examining the potential association between birth order and personality: Null results from a national sample of American siblings. Personal. Ind. Differ. 2019, 139, 125–131. [Google Scholar] [CrossRef]
- Bleske-Rechek, A.; Kelley, J.A. Birth order and personality: A within-family test using independent self-reports from both firstborn and laterborn siblings. Personal. Ind. Differ. 2014, 56, 15–18. [Google Scholar] [CrossRef]
- Birdsall, N. Birth order effects and time allocation. Res. Popul. Econ. 1991, 7, 191–213. [Google Scholar] [PubMed]
- Hao, L.; Bonstead-Bruns, M. Parent-child differences in educational expectations and the academic achievement of immigrant and native students. Sociol. Educ. 1998, 71, 175–198. [Google Scholar] [CrossRef]
- Caprara, G.V.; Barbaranelli, C.; Steca, P.; Malone, P.S. Teachers’ self-efficacy beliefs as determinants of job satisfaction and students’ academic achievement: A study at the school level. J. Sch. Psychol. 2006, 44, 473–490. [Google Scholar] [CrossRef]
- Lareau, A. Invisible inequality: Social class and childrearing in black families and white families. Am. Sociol. Rev. 2002, 67, 747–776. [Google Scholar] [CrossRef]
- Roscigno, V.J.; Ainsworth-Darnell, J.W. Race, cultural capital, and educational resources: Persistent inequalities and achievement returns. Sociol. Educ. 1999, 72, 158–178. [Google Scholar] [CrossRef]
- Pearson, K. Notes on regression and inheritance in the case of two parents. Proc. R. Soc. Lond. 1895, 58, 240–242. [Google Scholar]
- Székely, G.J.; Rizzo, M.L. Brownian distance covariance. Ann. Appl. Stat. 2009, 3, 1233–1303. [Google Scholar] [CrossRef]
- Broomhead, D.S.; Lowe, D. Multivariable functional interpolation and adaptive networks. Complex Syst. 1988, 2, 321–355. [Google Scholar]
- Martinez, A.M.; Kak, A.C. PCA versus LDA. IEEE Trans. Pattern Anal. Mach. Intell. 2001, 23, 228–233. [Google Scholar] [CrossRef]
- Foulkes, L.; McMillan, D.; Gregory, A.M. A bad night’s sleep on campus: An interview study of first-year university students with poor sleep quality. Sleep Health 2019. [Google Scholar] [CrossRef] [PubMed]
- Fusch, P.I.; Ness, L.R. Are we there yet? Data saturation in qualitative research. Qual. Rep. 2015, 20, 1408. [Google Scholar]
- García-Arenzana, N.; Navarrete-Muñoz, E.M.; Lope, V.; Moreo, P.; Laso-Pablos, S.; Ascunce, N.; Casanova-Gómez, F.; Sánchez-Contador, C.; Santamariña, C.; Aragonés, N.; et al. Calorie intake, olive oil consumption and mammographic density among Spanish women. Int. J. Cancer 2014, 134, 1916–1925. [Google Scholar] [CrossRef]
- Benjamini, Y.; Hochberg, Y. Controlling the false discovery rate: A practical and powerful approach to multiple testing. J. R. Stat. Soc. 1995, 57, 289–300. [Google Scholar] [CrossRef]
- Tukey, J. Comparing Individual Means in the Analysis of Variance. Biometrics 1949, 5, 99–114. [Google Scholar] [CrossRef]
© 2019 by the authors. Licensee MDPI, Basel, Switzerland. This article is an open access article distributed under the terms and conditions of the Creative Commons Attribution (CC BY) license (http://creativecommons.org/licenses/by/4.0/).