1. Introduction
Desiccation cracking is the development of cracks at the soil surface and throughout the depth of a cohesive soil layer as a result of soil shrinkage due to the reduction of the water content through solar radiation or vegetation absorption. The desiccation of cohesive soils leads to an undesirable impact on the mechanical, hydrological, thermal, and physico-chemical soil properties. For instance, desiccation cracking can lead to decreased soil strength which in turn can cause uneven settlement and catastrophic failures in structures of all types. In addition, this type of soil cracking results in a dramatic increase in the permeability of clayey soils. The increase in soil permeability is particularly problematic when the clay is used as a liner for both landfills and hazardous waste storage [
1]. Therefore, the prevention of desiccation cracking is of significant importance to safety, structural, and environmental issues.
Due to the lack of an accepted American Society for Testing and Materials (ASTM) standard, desiccation tests have been conducted in a variety of ways with different boundary conditions, specimen geometry, and properties measured [
1,
2,
3,
4,
5]. By utilizing a bar of clay seated on a grooved plate, the cracks only propagate in that same direction, creating a series of parallel cracks that can be easily analyzed for aperture and spacing [
3]. More realistic two-dimensional (2D) cracking patterns can be obtained as a result of a complete horizontal constraint, allowing for crack intersections to be studied [
1]. Therefore, it can be deduced that the geometry of the crack pattern depends strongly on the nature of the boundary conditions and the sample geometry [
3]. A parameter called the crack distribution frequency has been developed to evaluate the change in the area of a sample relative to a sample’s original surface area [
5]. A similar measurement, the crack intensity factor, has also been developed to analyze the ratio of the area of the cracks to the total specimen area [
2]. In addition to the surface crack analysis, the crack depth can be analyzed using either manual means or more advanced image analysis techniques.
Image analysis has proven to be an incredible tool to quantitatively analyze crack characteristics in natural and humanmade geomaterials. To this end, several experimental test methods have been suggested and developed to assess the desiccation crack initiation and propagation within the different geomaterials. These include an analysis of images acquired with a scanning electron microscope (SEM) [
6,
7], a 2D profile laser [
4,
8] and different digital image acquisition systems [
1,
2,
5]. A SEM has been extensively used to analyze micro-cracking in concrete and rocks [
6] and to evaluate the effect of sodium chloride on the cracking of bentonite clay samples [
7]. Despite the power of this technique, the main SEM drawback is its destructive nature. In particular, the specimen needs to be cut into thin slices and the sample faces need to be polished to make cracks and material constituents visible before taking high-resolution 2D images. Furthermore, due to the destructive and complex specimen preparation, the gradual propagation of a single crack cannot be studied. The 2D laser profile imaging has been successfully utilized in studying the propagation and geometry of desiccation cracking in clay soils [
4] and the soil curling as a result of soil dehydration [
8]. While 2D profile lasers are powerful tools to study desiccation cracking, their initial high price creates a barrier to entry for the academic and industry communities. All of these shortcomings are resolved by utilizing a user-friendly inexpensive digital image acquisition system to analyze the cracking behavior of clay soils.
To resolve safety, structural, and environmental issues caused by desiccation cracking, chemical additives, such as cement and lime, are used as binding agents to increase a clay’s strength and resistance to cracking [
9]. However, the current solutions have negative implications on the environment such as CO
2 emissions, the prevention of the vegetation growth, and the contamination of groundwater among others [
7]. To rectify this, several research studies have been conducted in order to determine the viability of different sustainable soil-strengthening additives. The soil additives are considered sustainable if they have originated and have been refined from the industrial waste which remains toxic and hazardous to the environment when left unattended [
10]. While this repurposing does not eliminate all negative side effects of the material as a waste product, it does prevent the negative effects of the use of alternative solutions [
10]. The most commonly used sustainable soil additives are fly ash from thermal power plants [
10,
11,
12], furnace slag from the steel industry [
13,
14], silica fume from the silicon and ferrosilicon industry [
2,
7,
15,
16], and carpet waste [
17,
18,
19].
Chloride salts, such as ammonium chloride (NH
4Cl) and ferric chloride (FeCl
3), have demonstrated the ability to stabilize the volume of clays with high swelling potential [
15]. The cations in the compounds reduce the swelling of montmorillonite minerals by replacing the interlayer metallic cations [
16]. Furthermore, bentonite samples treated with sodium chloride (NaCl) developed cracks with greater lengths, but the overall crack density was significantly lower [
7]. This was due to the effect of salt on the bentonite colloidal interactions that alter the double layer and particle association in a clay slurry [
7]. Kalkan [
15] used silica fume waste material as a sustainable alternative, and it was shown to significantly reduce desiccation cracking in clay liner systems.
The different types of fibers have also been examined as potential solutions to desiccation cracking [
2,
7,
20]. Recycled carpet fibers have been lightly investigated as a potential soil improvement technique, with most studies being focused on the improvement of the strength properties of granular soil [
18,
19]. More recently, they have been examined as a potential method to reduce the swelling properties of cohesive soils [
17]. The recycled carpet fibers were shown to decrease swelling pressure, with a 1% fiber content providing the most significant pressure drop [
17]. Other unsustainable, fiber reinforcements have been shown to cause a significant reduction of desiccation cracking in expanding clay, with crack width decreasing by 50% [
20]. Polypropylene fiber reinforcement has been proven to prevent tension crack growth in soils and stabilize soils against shrinking by increasing the soil’s tensile strength [
7]. In addition, polypropylene fibers have been utilized to reinforce clay liners, leading the liners to be more rigid in compression and more ductile in tension [
11]. The soils treated with fibers have also been shown to perform better than unreinforced soils when exposed to wetting and drying cycles [
20].
Other forms of industrial waste have been examined as potential soil improvement techniques [
11,
12,
21,
22]. Fly ash has shown the ability to reduce plastic strain in clay soils when exposed to freeze-thaw cycles [
12]. In addition, fly ash has been shown to increase compressive strength and produce similar behavioral trends to Portland cement [
11]. The use of limestone waste has been shown to reduce the swelling properties of soil, producing a more compact microstructure when examined using SEM imaging [
21]. Milled brick debris has also been shown to improve the compressive strength of soils when tested using the unconfined compression test [
22].
This study seeks to investigate novel eco-friendly soil improvement techniques and their effect on the desiccation cracking behavior of soils. Three sustainable soil improvement techniques were tested, including fly ash, recycled carpet fibers, and bioplastic. Both recycled carpet fibers and fly ash were considered sustainable materials under the idea that repurposed industrial waste is a sustainable material. Numerous studies have been conducted investigating the effects eco-friendly additives have on soil strength and swelling properties, yet their effect on the crack resistance of cohesive soils has been largely under-investigated. To date, neither recycled carpet fibers nor bioplastics have been examined as a potential solution to desiccation cracking and their effectiveness is presented in this research. This is also the first study to compare these techniques at two different temperatures and to subject them to cyclic wetting and drying. Consequently, a comparative analysis of the mentioned improvement techniques’ effectiveness has not been completed. A qualitative analysis was conducted by analyzing the geometric characteristics of cracking patterns in the plain and improved soil samples. The quantitative analysis was completed using an original code powered by MATLAB’s image analysis software before performing image matrix operations in a Visual Basic for Applications (VBA) program. The utilized image analysis process is simple and inexpensive due to the widespread public familiarity and access of both VBA and MATLAB. A comparative analysis of the soil improvement techniques was completed using the area reduction factor (ARF), average crack width (wavg) and maximum crack width (wmax) of the treated and non-treated cohesive soil samples.
3. Results
Using the data obtained from the image analysis, the performance of each soil improvement technique was examined. The final crack count,
wavg, and
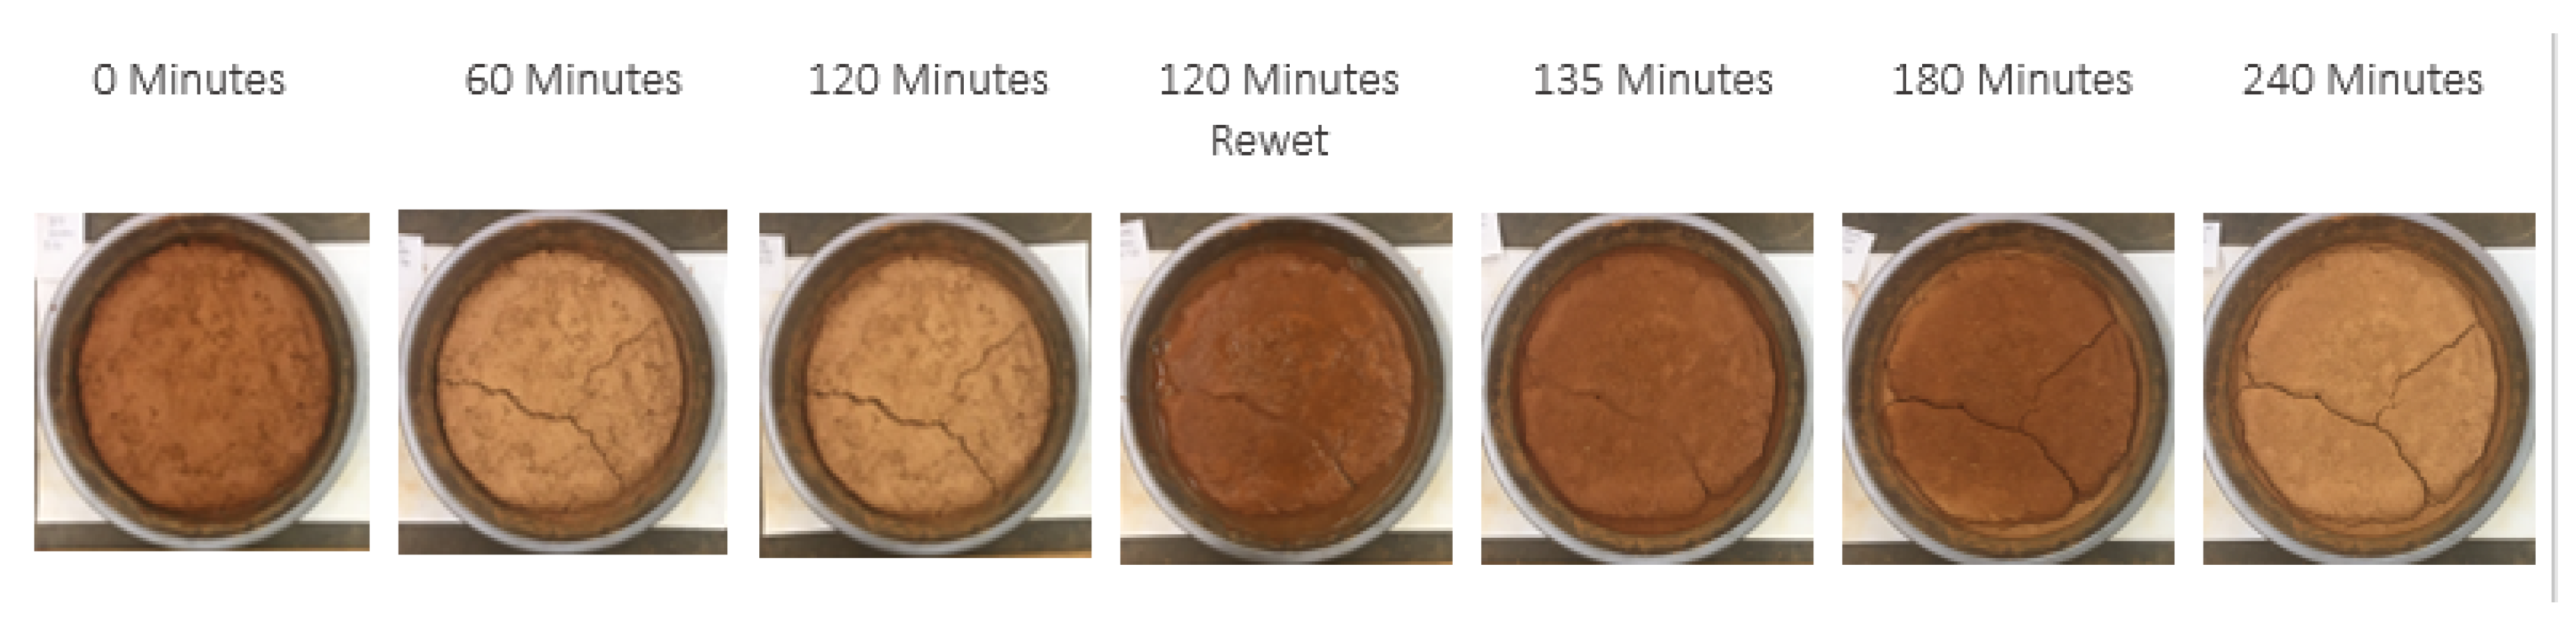
wmax were recorded at each time frame during the accelerated desiccation test. In general, the cracks developed rapidly, with the samples often going from no cracks to a fully-realized crack network in one photocycle (15 min time frame). The development of the desiccation cracking throughout the first drying cycle of the accelerated test can be seen in
Figure 3. The figure shows that the cracking pattern of the base soil sample propagated in a three-pronged, letter Y-like shape (
Figure 3 and
Figure 4). However, the specimens with the ash and fibers sometimes deviated from this shape. Once the samples with the added fiber cracked in the second cycle, they took on a more circular manner like the letter C with smaller segments radiating out to the edges (
Figure 5). This was most likely due to the transverse isotropic fiber distribution as a result of the clay mixing process. As the clay was mixed in a circular motion, many of the fibers became orientated in the same pattern. Consequentially, the cracks formed parallel to the fiber alignment because of the lack of reinforcement oriented perpendicular to the crack. The fly ash samples tended to have a more lopsided shape and propagated in a more clustered manner.
For the standard desiccation test, only the ARF results were recorded for each chronologic digital image due to crack propagation not occurring at room temperatures during the first eight hours of the testing process. The final crack count, wavg, and wmax were recorded at the 24-hour mark.
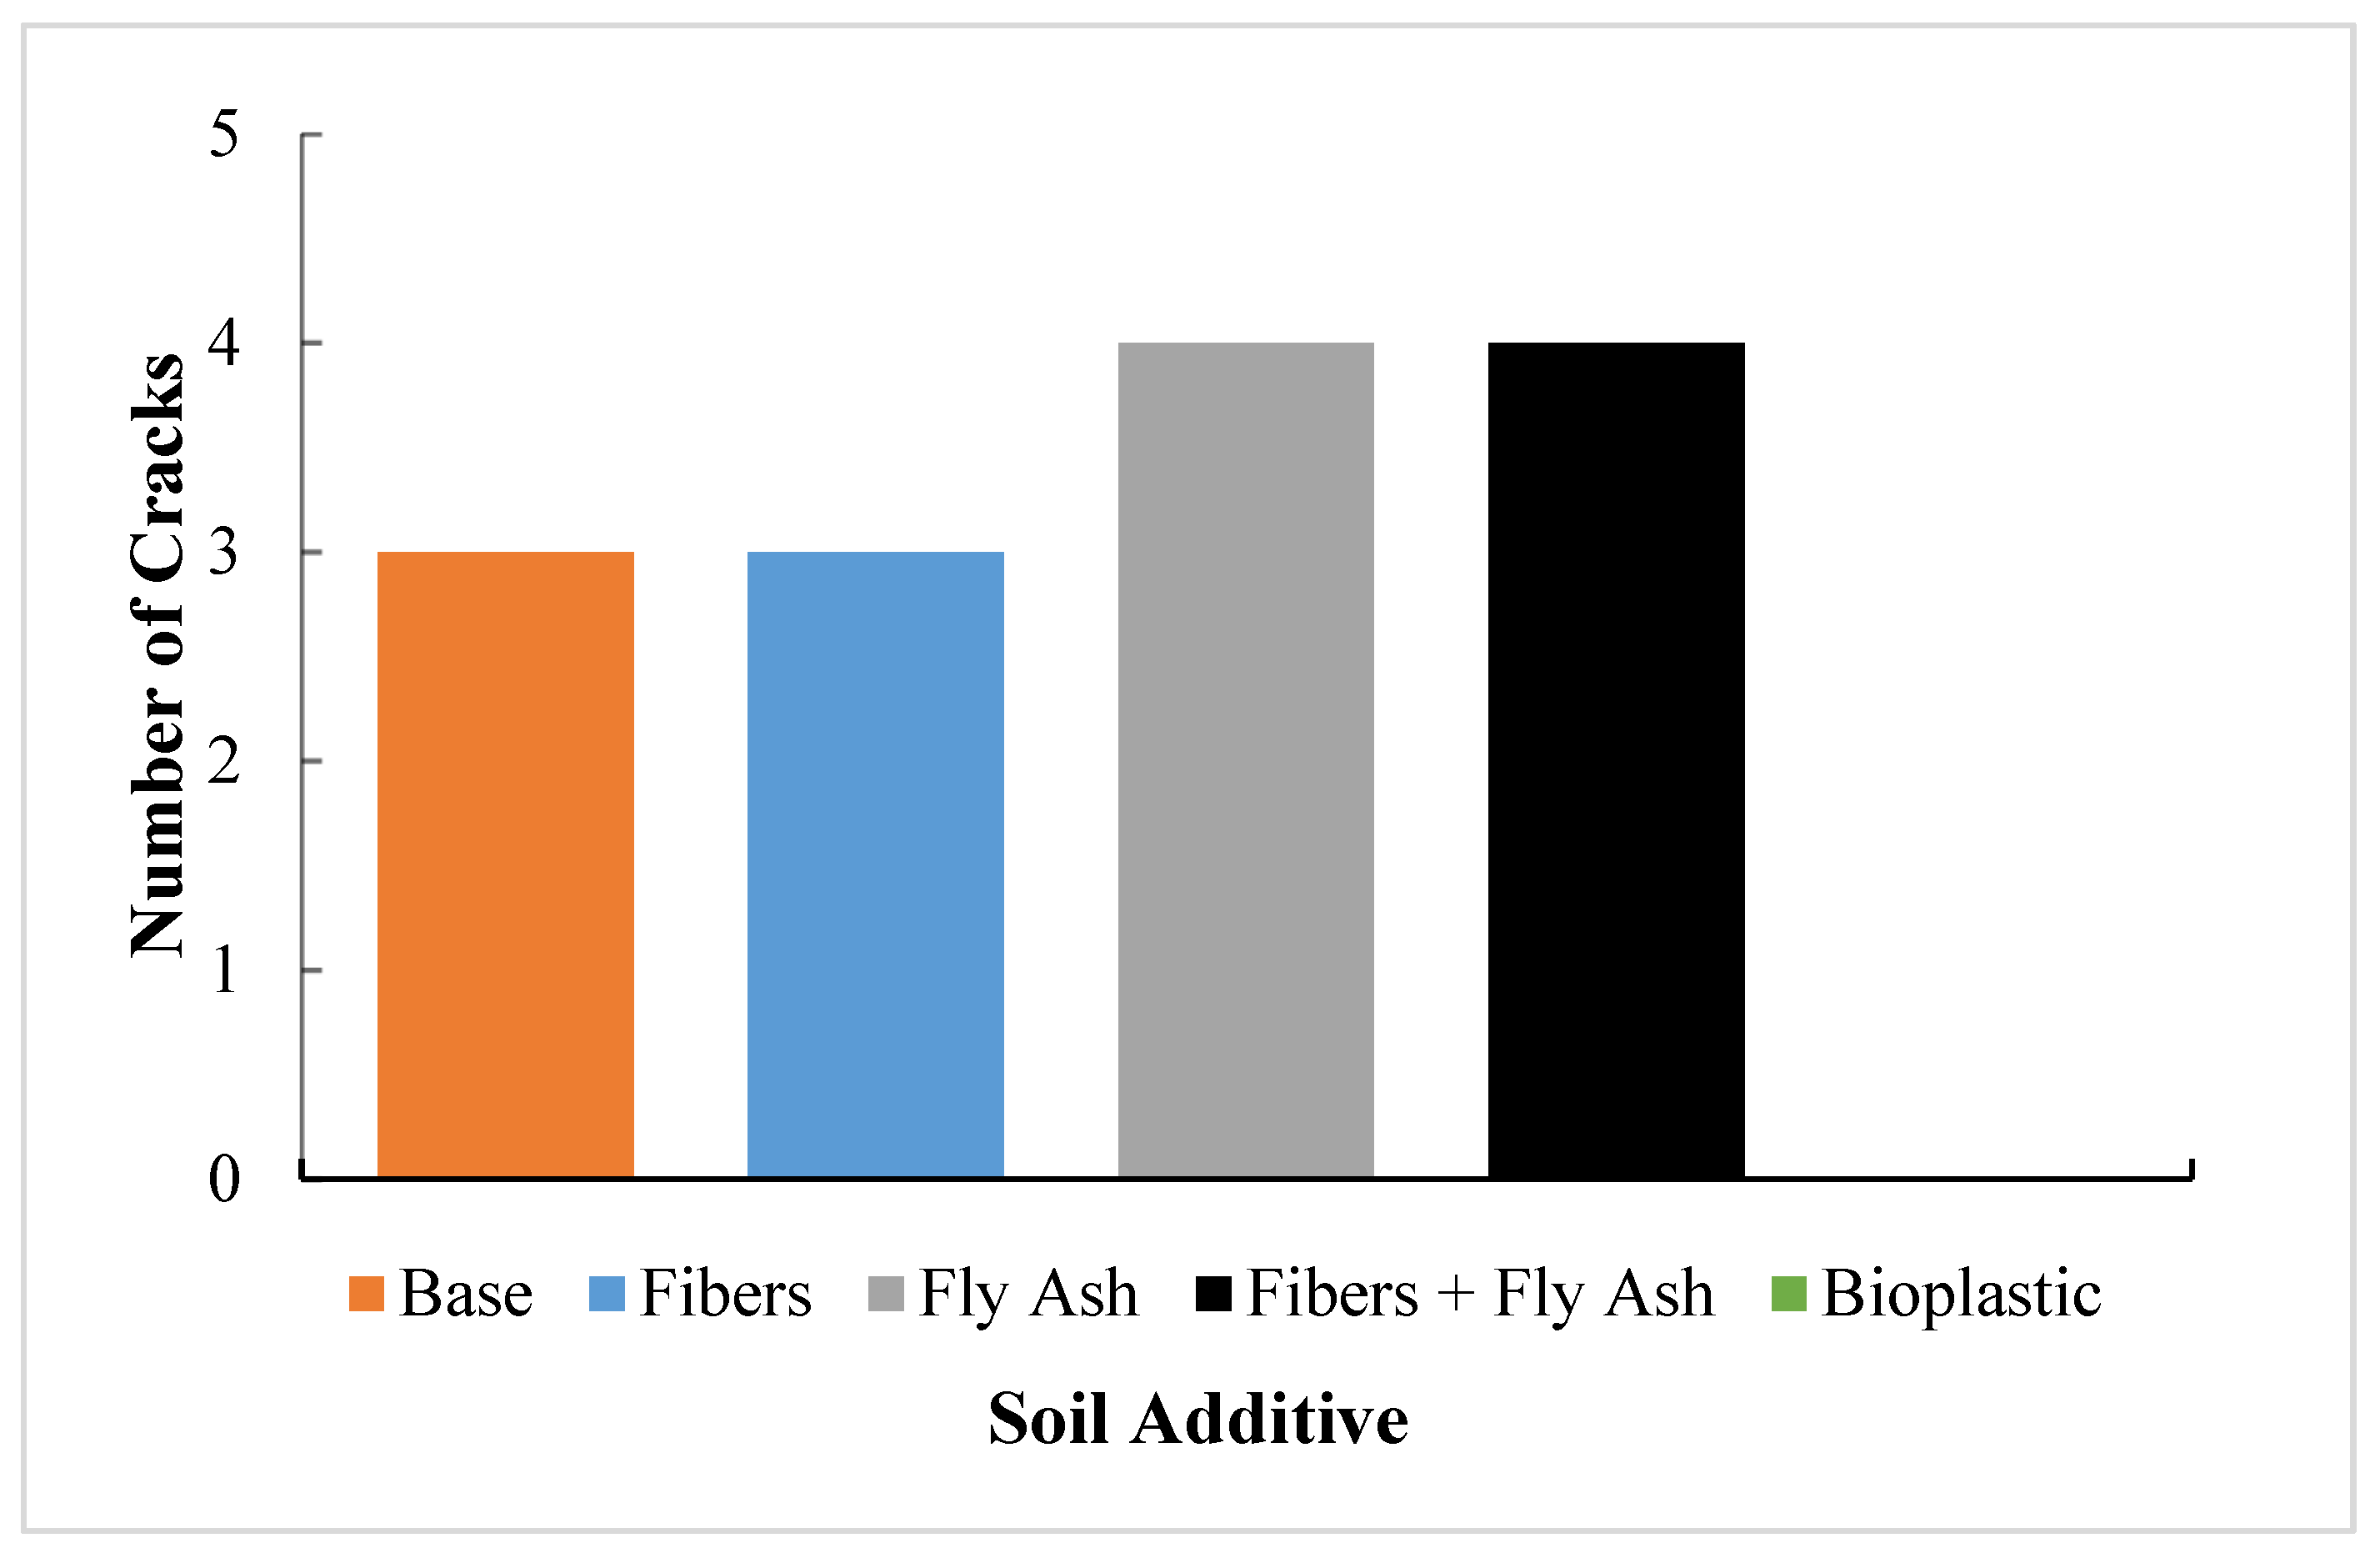
The crack count was recorded in order to quantitatively analyze the crack network morphology. The results from the standard desiccation test can be seen in
Figure 6. The figure shows that aside from adding the gelatin-based bioplastic, the soil additives did not materially affect the total number of crack segments after 24 h of drying at room temperature. Both samples that included fly ash developed an additional crack segment over the untreated soil.
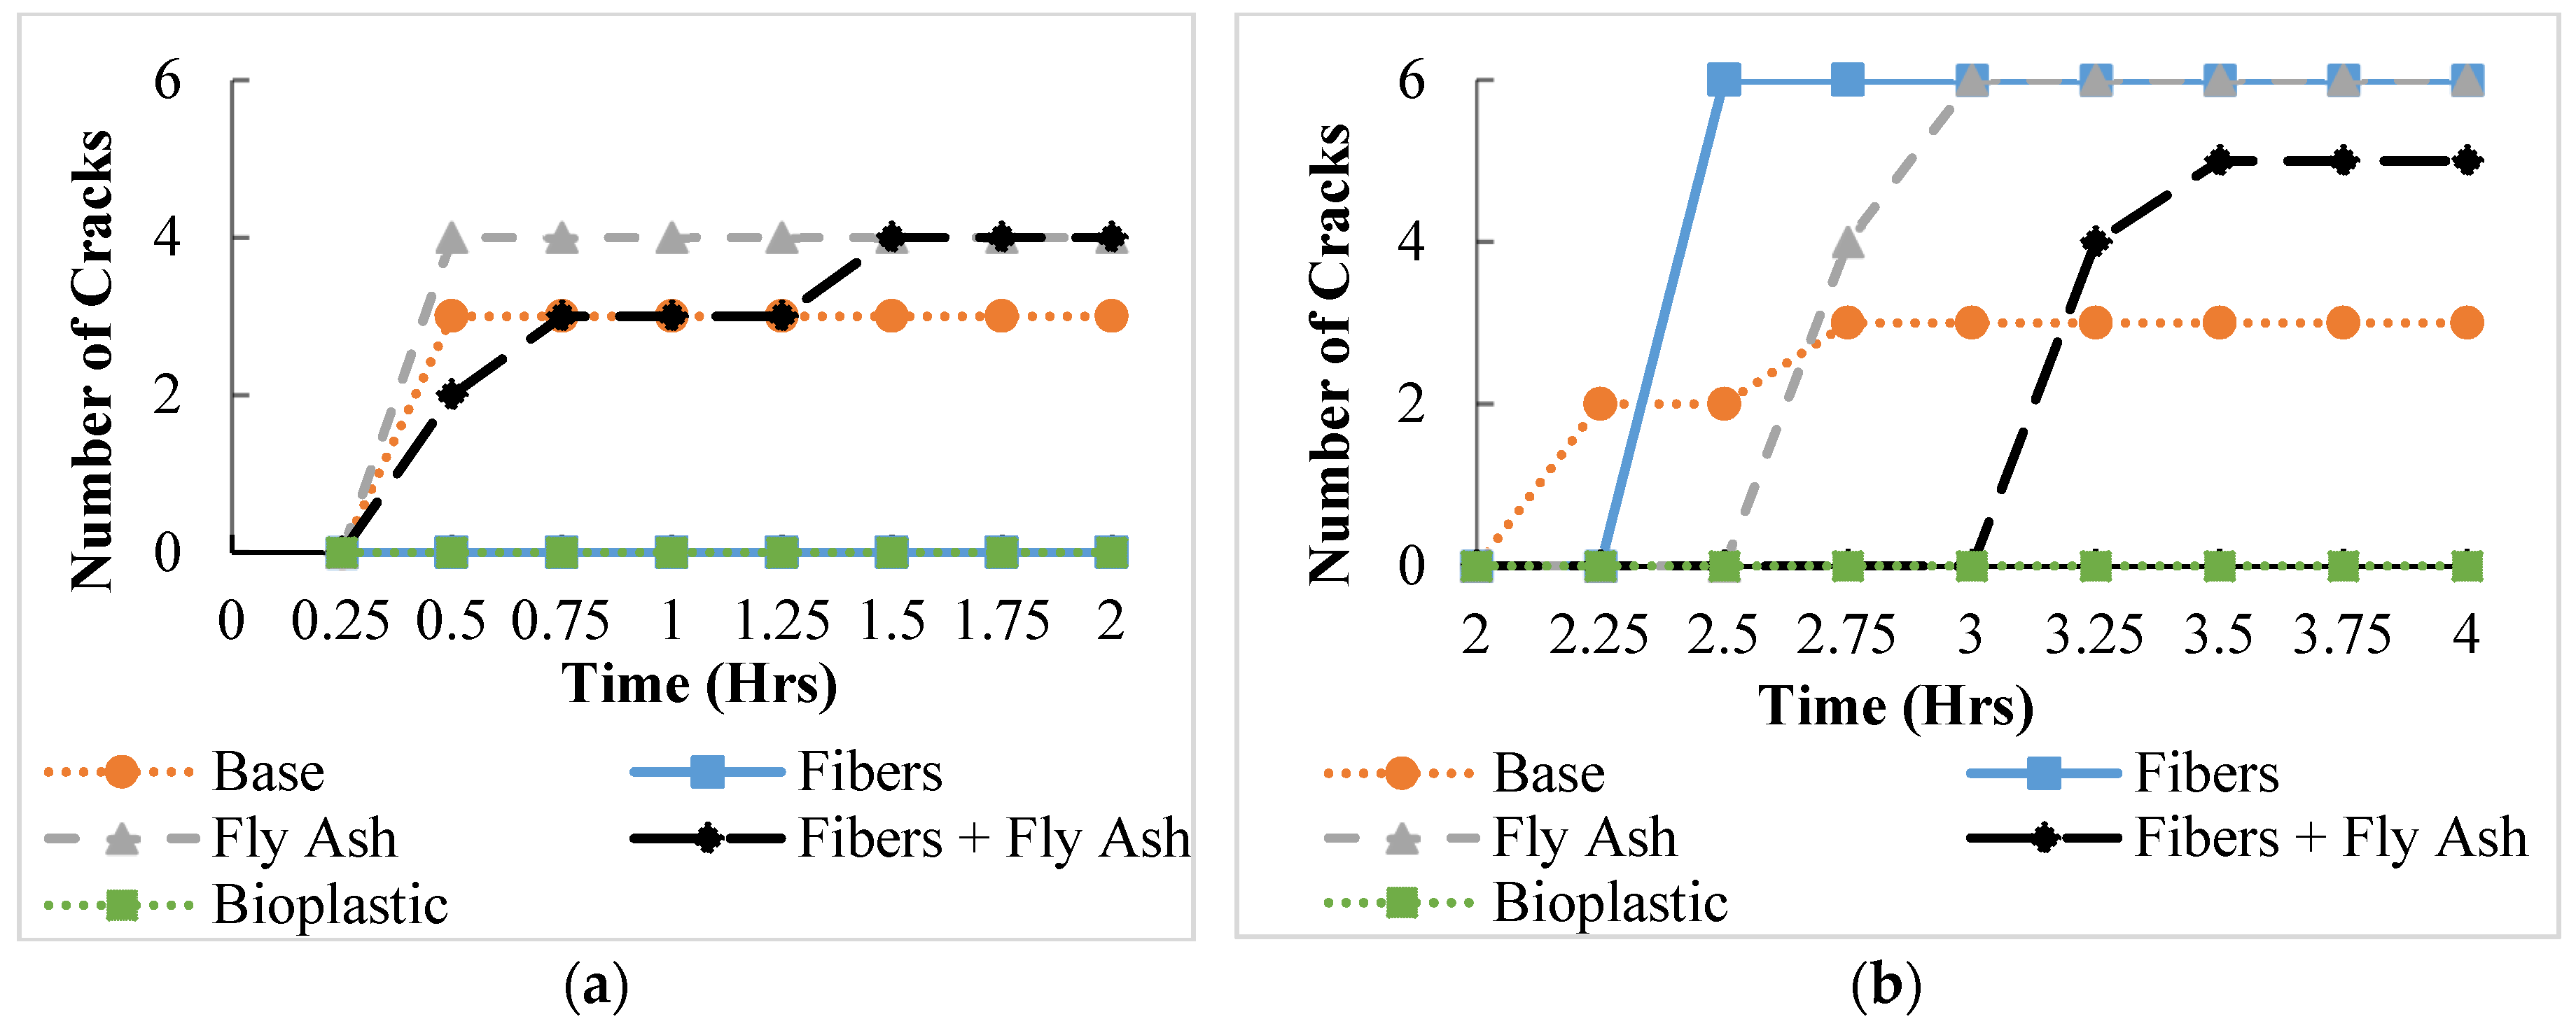
The crack count data for the accelerated desiccation test can be seen in
Figure 7. The figure shows that in the first drying cycle (
Figure 7a), no cracks developed in the samples mixed with the bioplastic and with the carpet fibers only. In the samples where cracks did develop, they generally appeared between the 15- and 30-min marks. After the rewetting process (
Figure 7b), the bioplastic-improved soil sample was the only sample that did not develop any desiccation cracks. Each of the other additives developed more cracks than the base soil at the end of the second drying cycle. After rewetting, the timing of crack formation varied to a much greater degree with the plain soil cracking after 15 min, the fiber-aided soil cracking after 30 min, the fly ash sample developing cracks at the 45-min mark, and the hybrid additive preventing cracking up until 75 min after rewetting occurred.
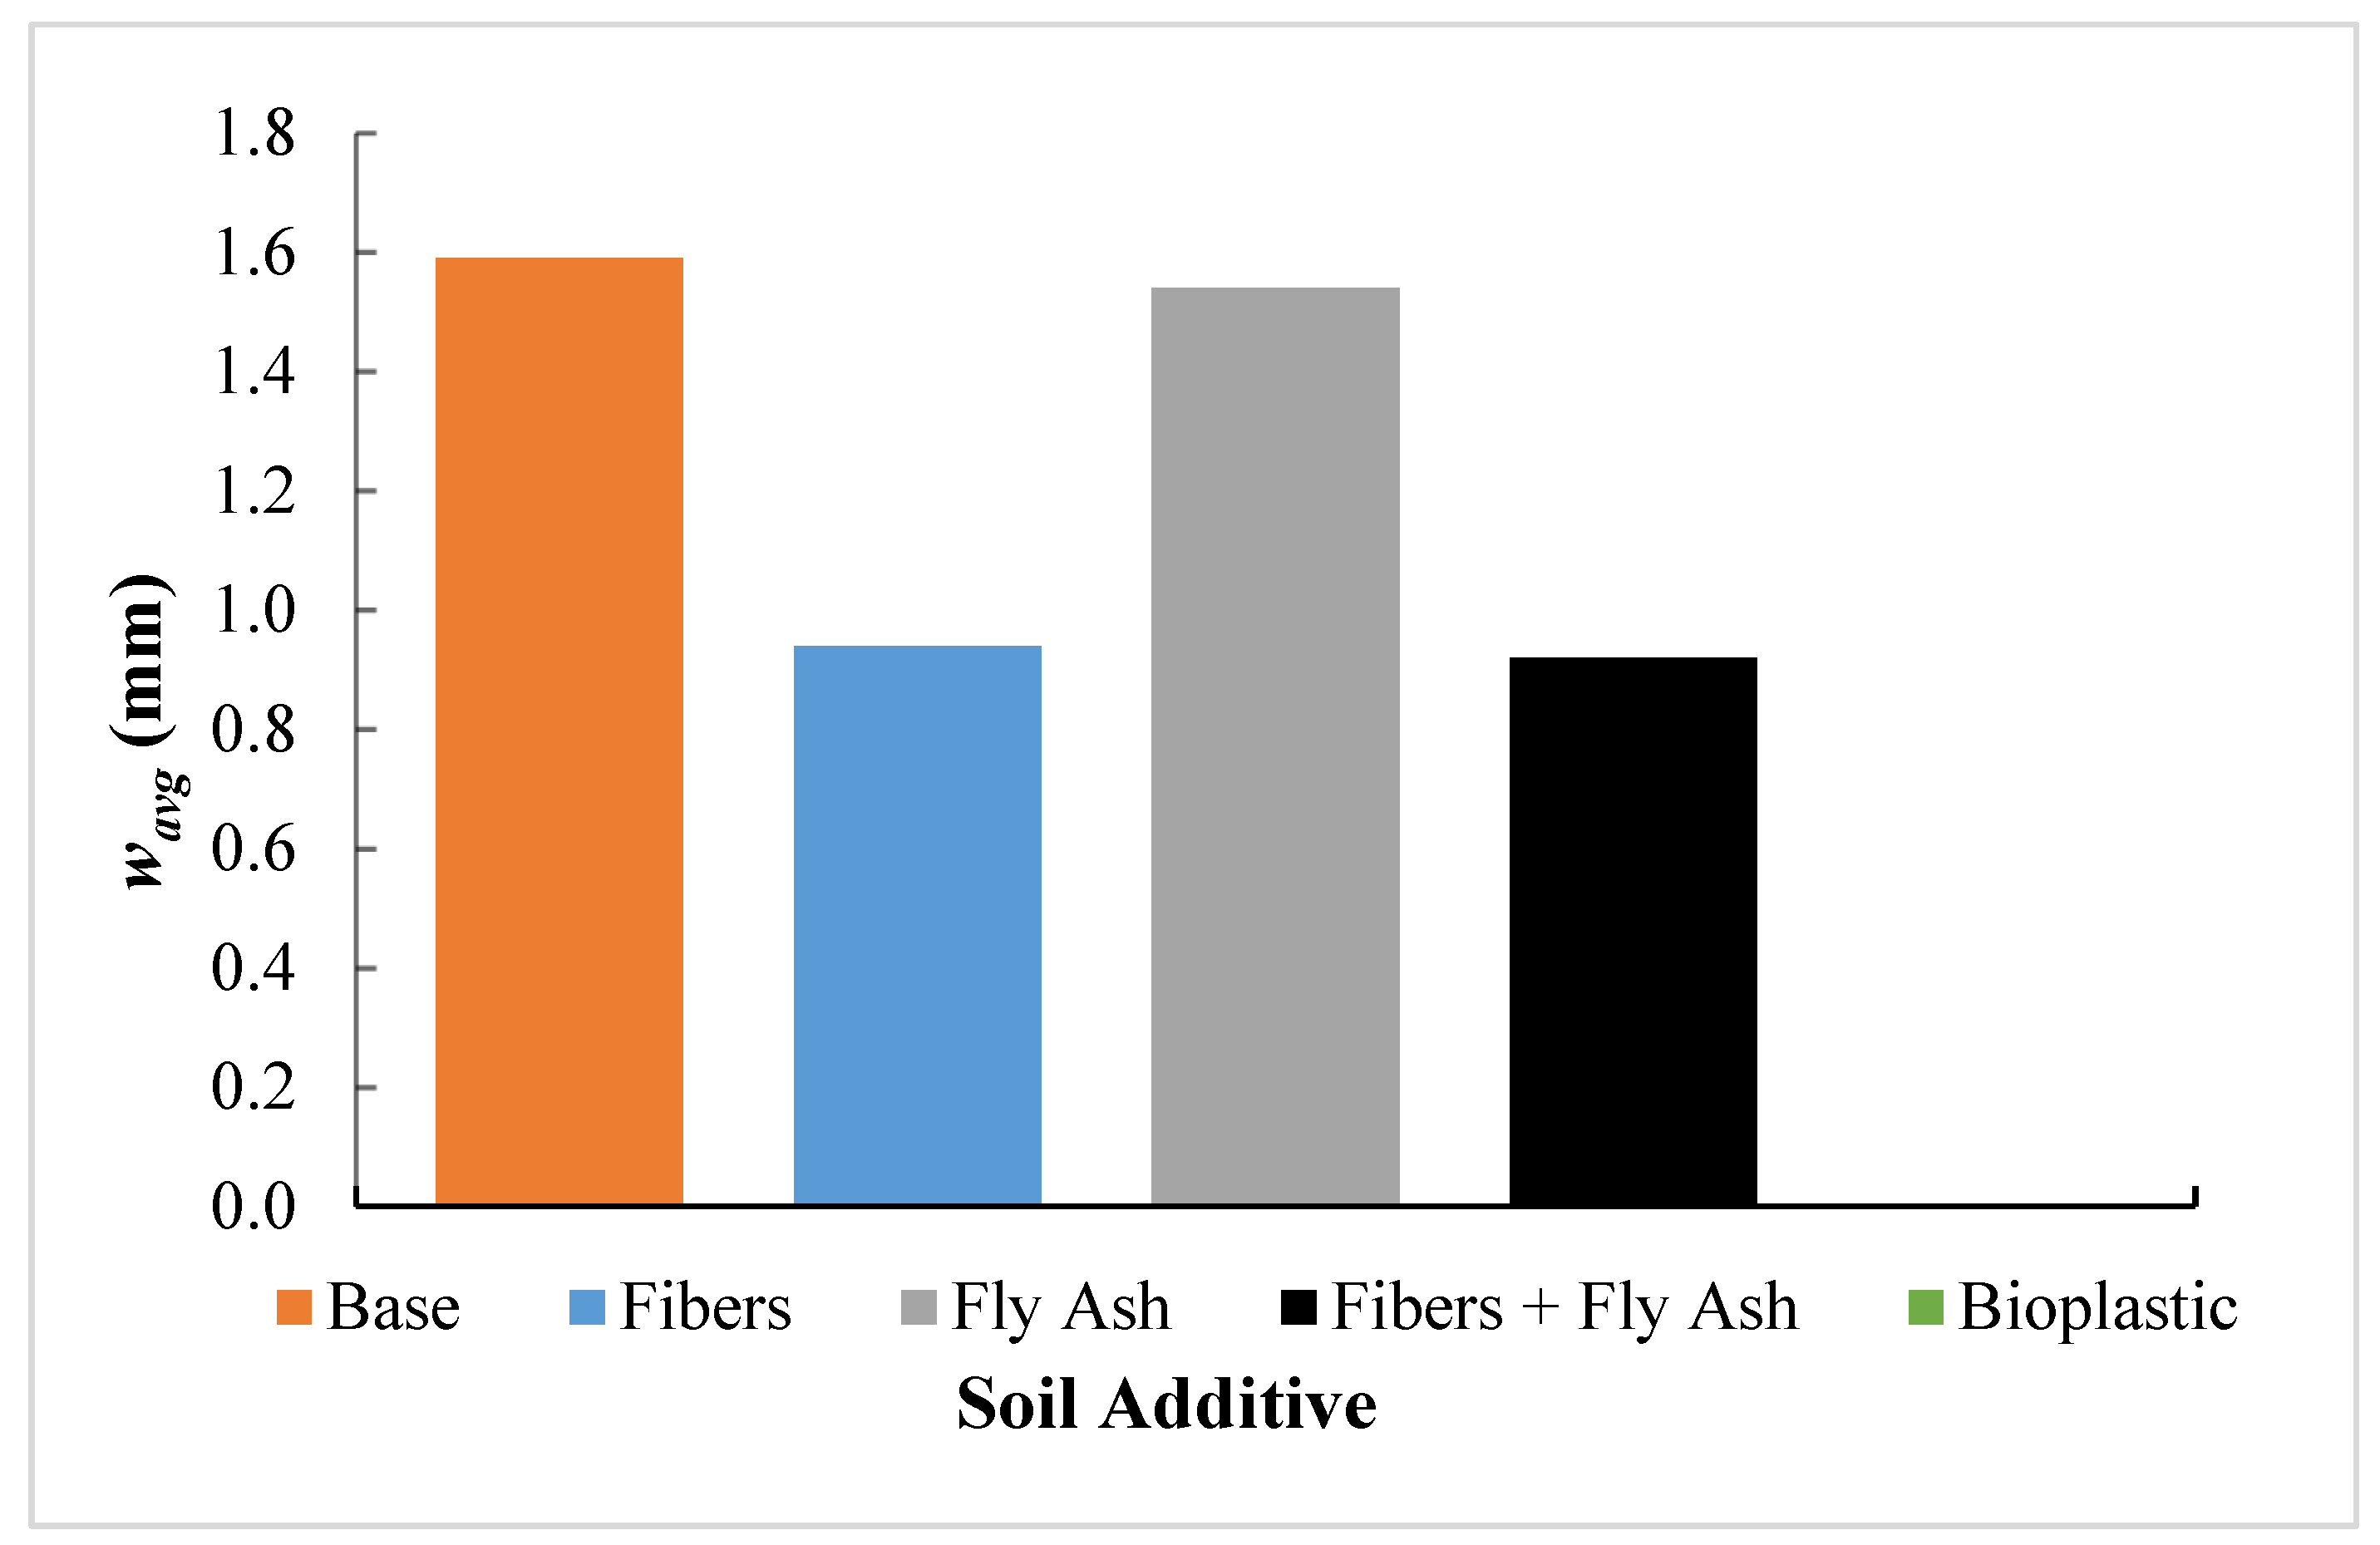
The
wavg was calculated so that each soil improvement method’s ability in solely reducing crack growth could be examined. The effect of the different soil improvement type on the
wavg for the standard desiccation test can be seen in
Figure 8. The average crack width after 24 h for the base soil was found to be 1.59 mm. The sample with fly ash showed almost no improvement over the plain specimen. The samples improved with only carpet fibers and the carpet fibers-fly ash combination developed cracks with smaller average widths of approximately 0.9 mm at the end of testing. The sample with the bioplastic had no average crack width as it did not develop cracks during the standard desiccation test.
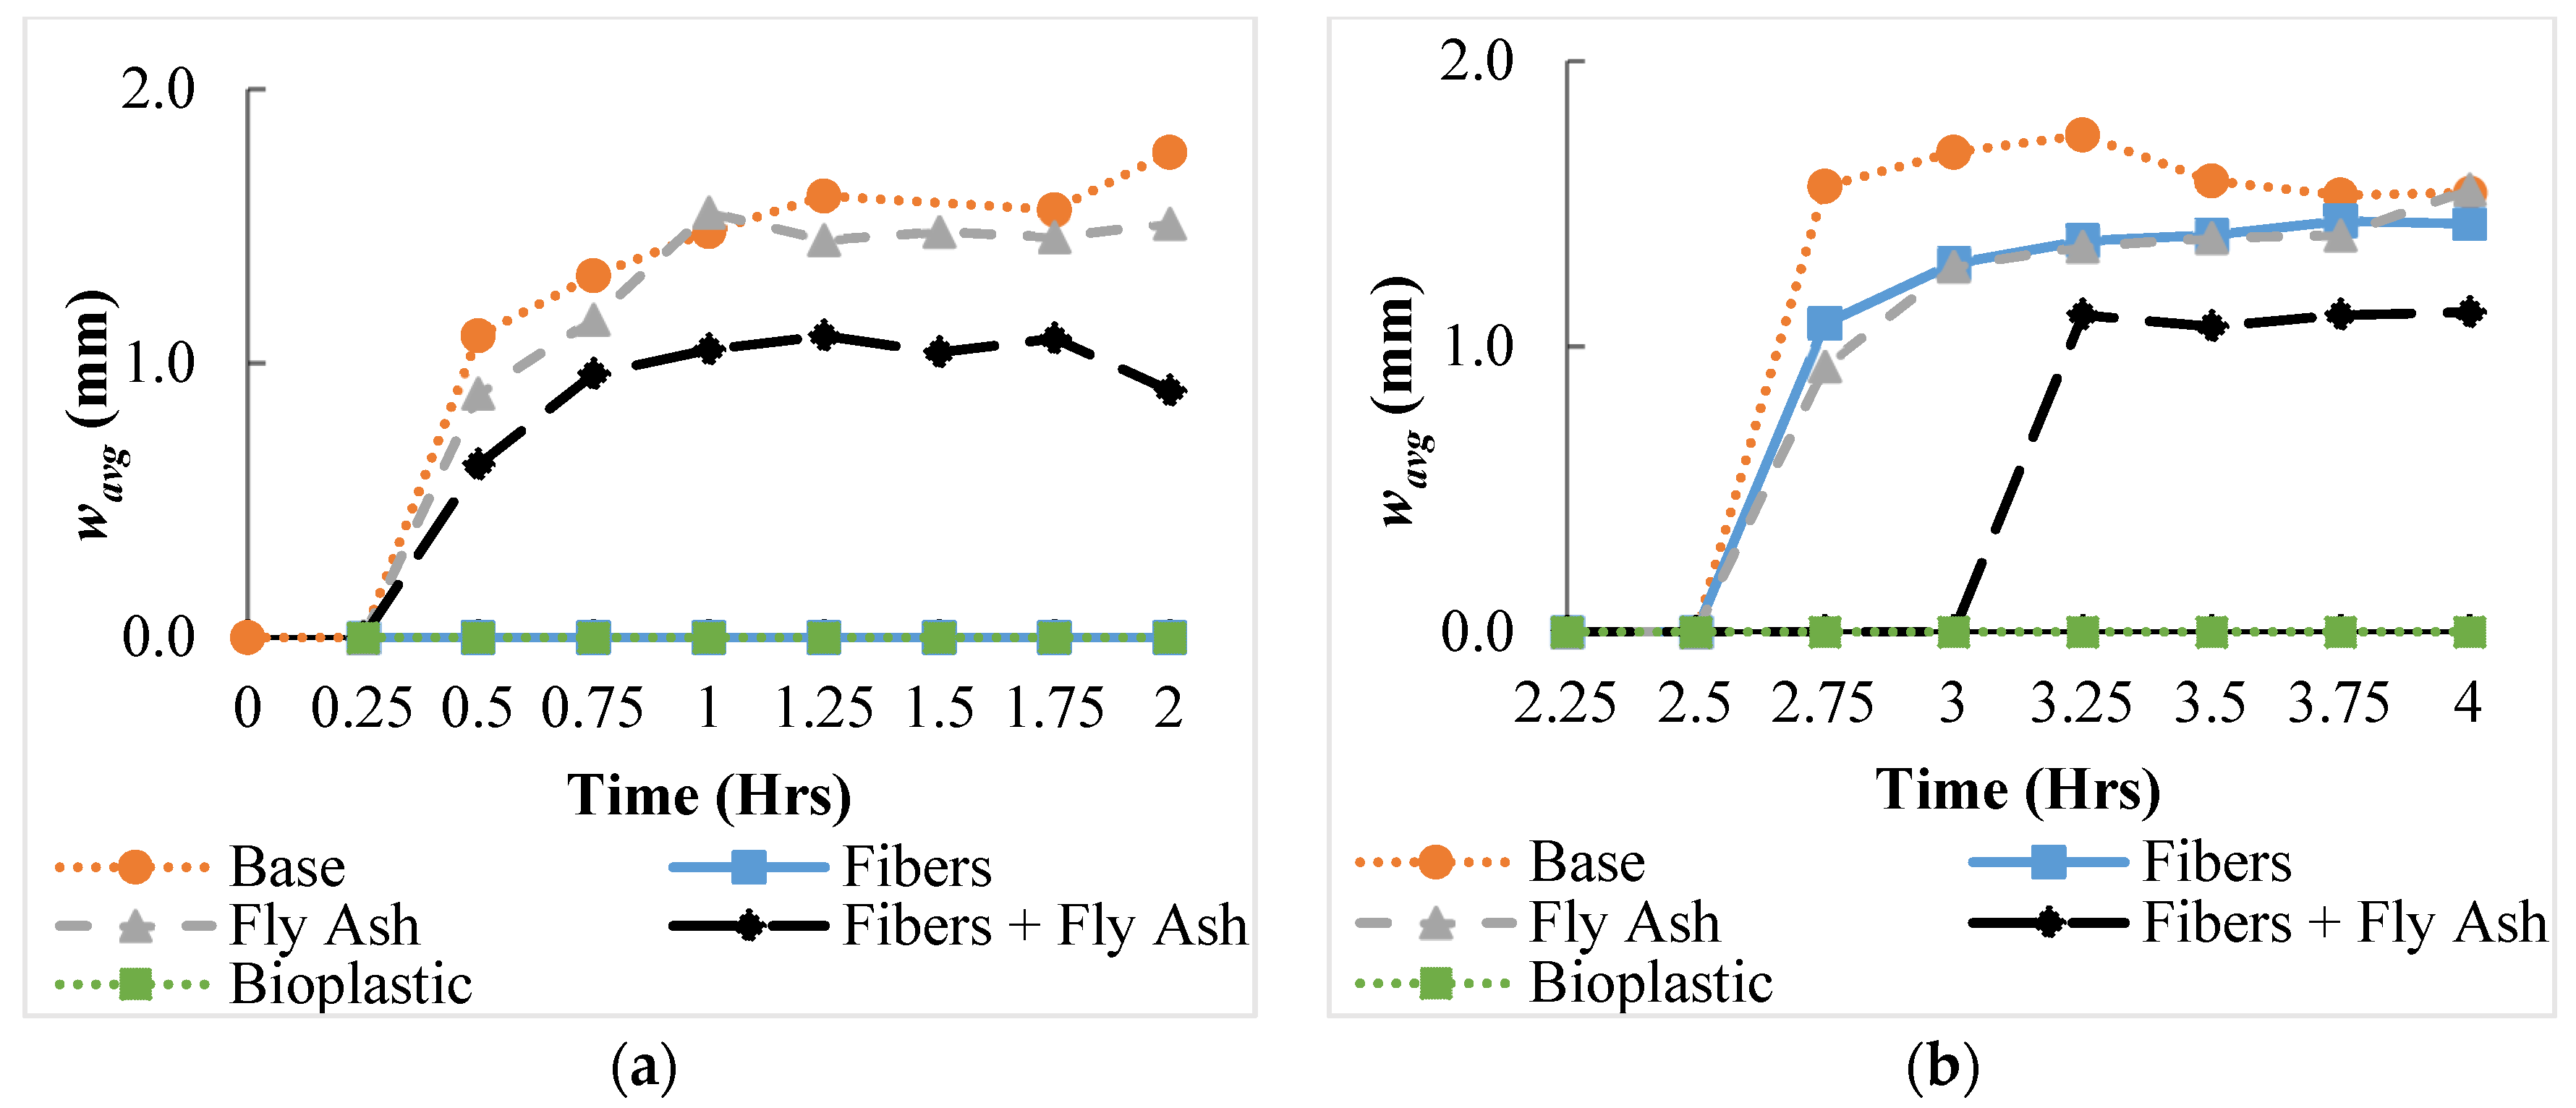
The effect of different soil improvement types on the
wavg for the accelerated desiccation test is depicted in
Figure 9. The average crack width at the end of the wetting and drying process for the base soil was found to be 1.54 mm (
Figure 9b). The samples with fly ash and carpet fibers showed almost no improvement in comparison with the non-treated soil. The samples with carpet fibers-fly ash combination developed cracks with smaller average widths at the termination point. The sample with the bioplastic did not develop cracks during the test and therefore had no average crack width. It is worth noting that the crack width after rewetting was assumed to be zero. Though some soil damage can be observed, the full depth cracks were not present at the time. In addition, in some time periods, the average crack width was shown to decrease. This was not due to the cracks shrinking, but as a result of the image processing software reading darker, wet spots in the soil near the cracks as parts of the actual crack. As the soil dried out more, the wet spots disappeared, causing the cracks to appear to be narrowing.
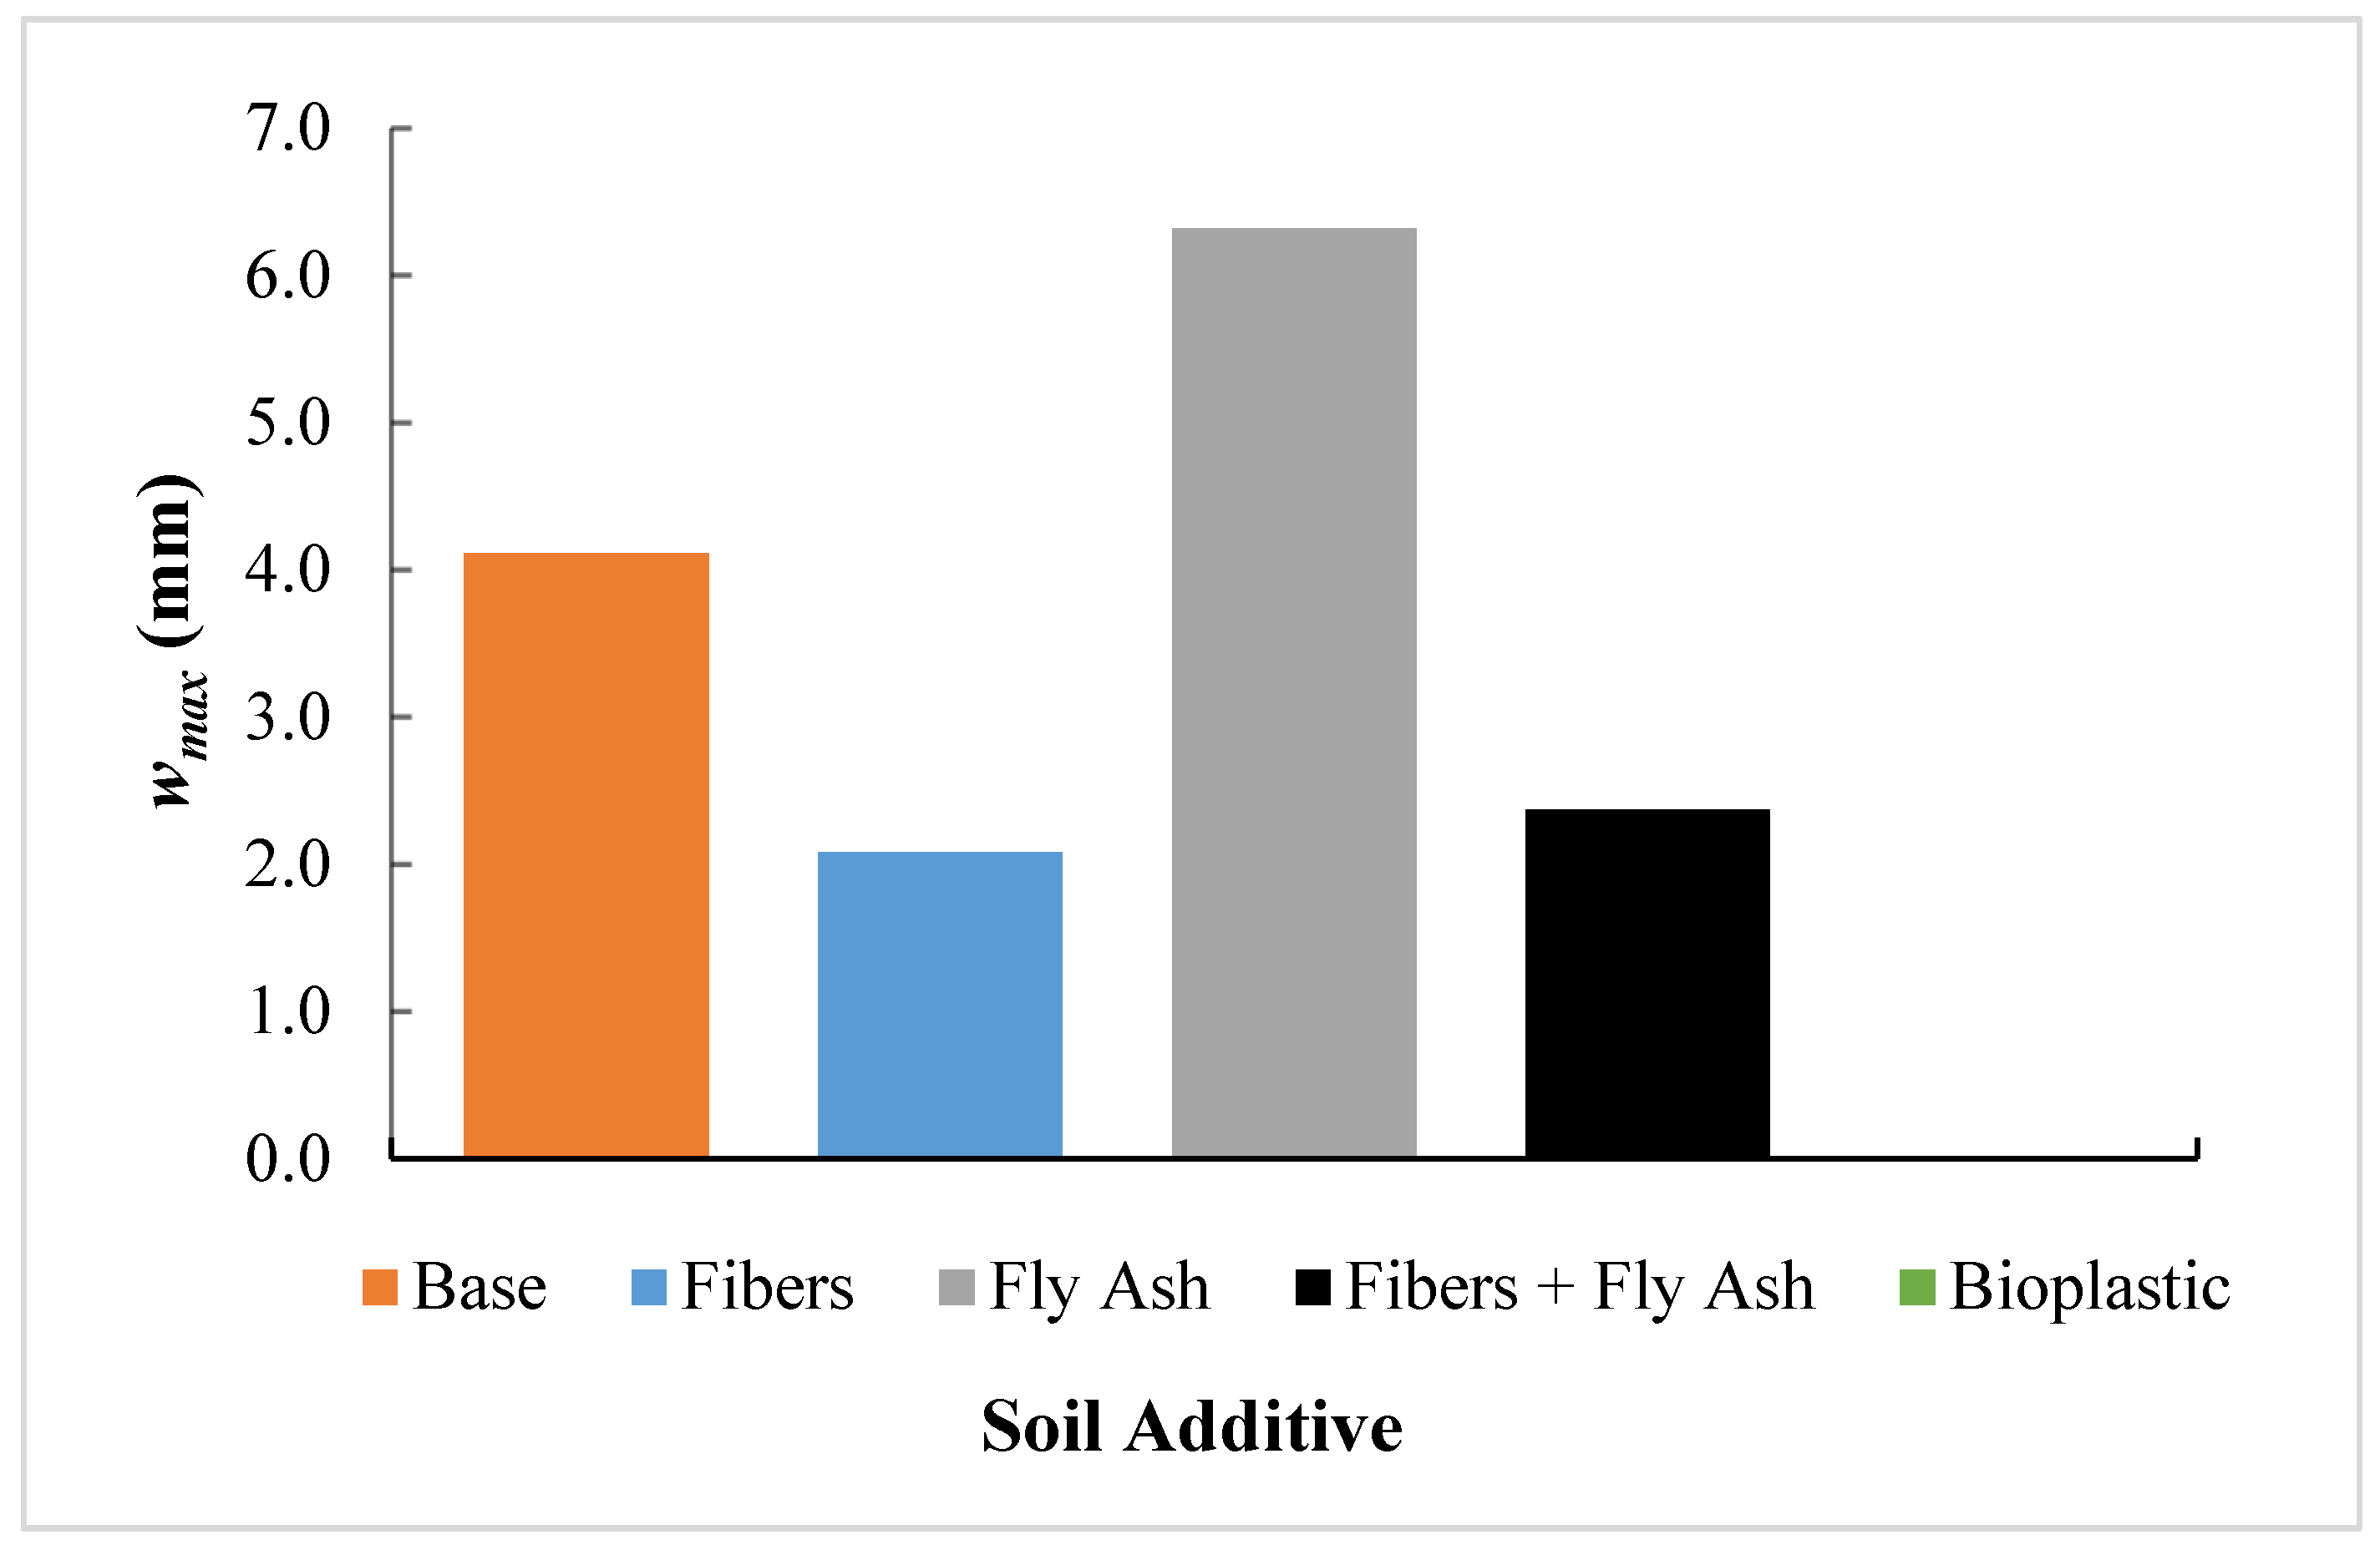
The effect of the different soil improvement types on the maximum crack width,
wmax for the standard desiccation test can be seen in
Figure 10. The reasons for finding the maximum crack width in each sample were twofold. First, the wider cracks have a greater potential to cause structural damage, meaning the maximum crack width represents the greatest potential for failure. Second, it provides context for the average crack results. For example, the fly ash sample possessed a
wavg similar to that of the untreated soil, however, the
wmax of the fly ash was approximately 2 mm greater than the base soil. This suggests that the fly ash most likely had a segment with an abnormally large crack with the remainder of the cracks being narrower than the cracks in the base soil. The maximum crack width at the end of the test for the base soil was found to be 4.11 mm. The sample with fly ash developed a crack system with a wider maximum crack width than the base clay (6.32 mm). The samples with just carpet fibers and the carpet fibers plus fly ash developed cracks with significantly smaller maximum widths of approximately 2.08 mm and 2.38 mm, respectively, at the end of testing. Again, the sample treated with the gelatin-based bioplastic never cracked during the desiccation test.
The maximum crack widths over both drying cycles for each soil improvement type are shown in
Figure 11. Each of the additives reduced the maximum crack width at the end of the testing process in comparison to the base soil but to varying degrees. Again, the sample with the gelatin-based bioplastic exhibited no changes and no cracking occurred. The samples with each of the fly ash only and the recycled carpet fiber showed approximately the same level of maximum crack width reduction, while the sample with the combined additives provided further crack reduction. In the second cycle, the plain soil’s maximum crack width exhibited the same soil drying phenomenon that affected the average crack width results and led to the appearance of crack narrowing.
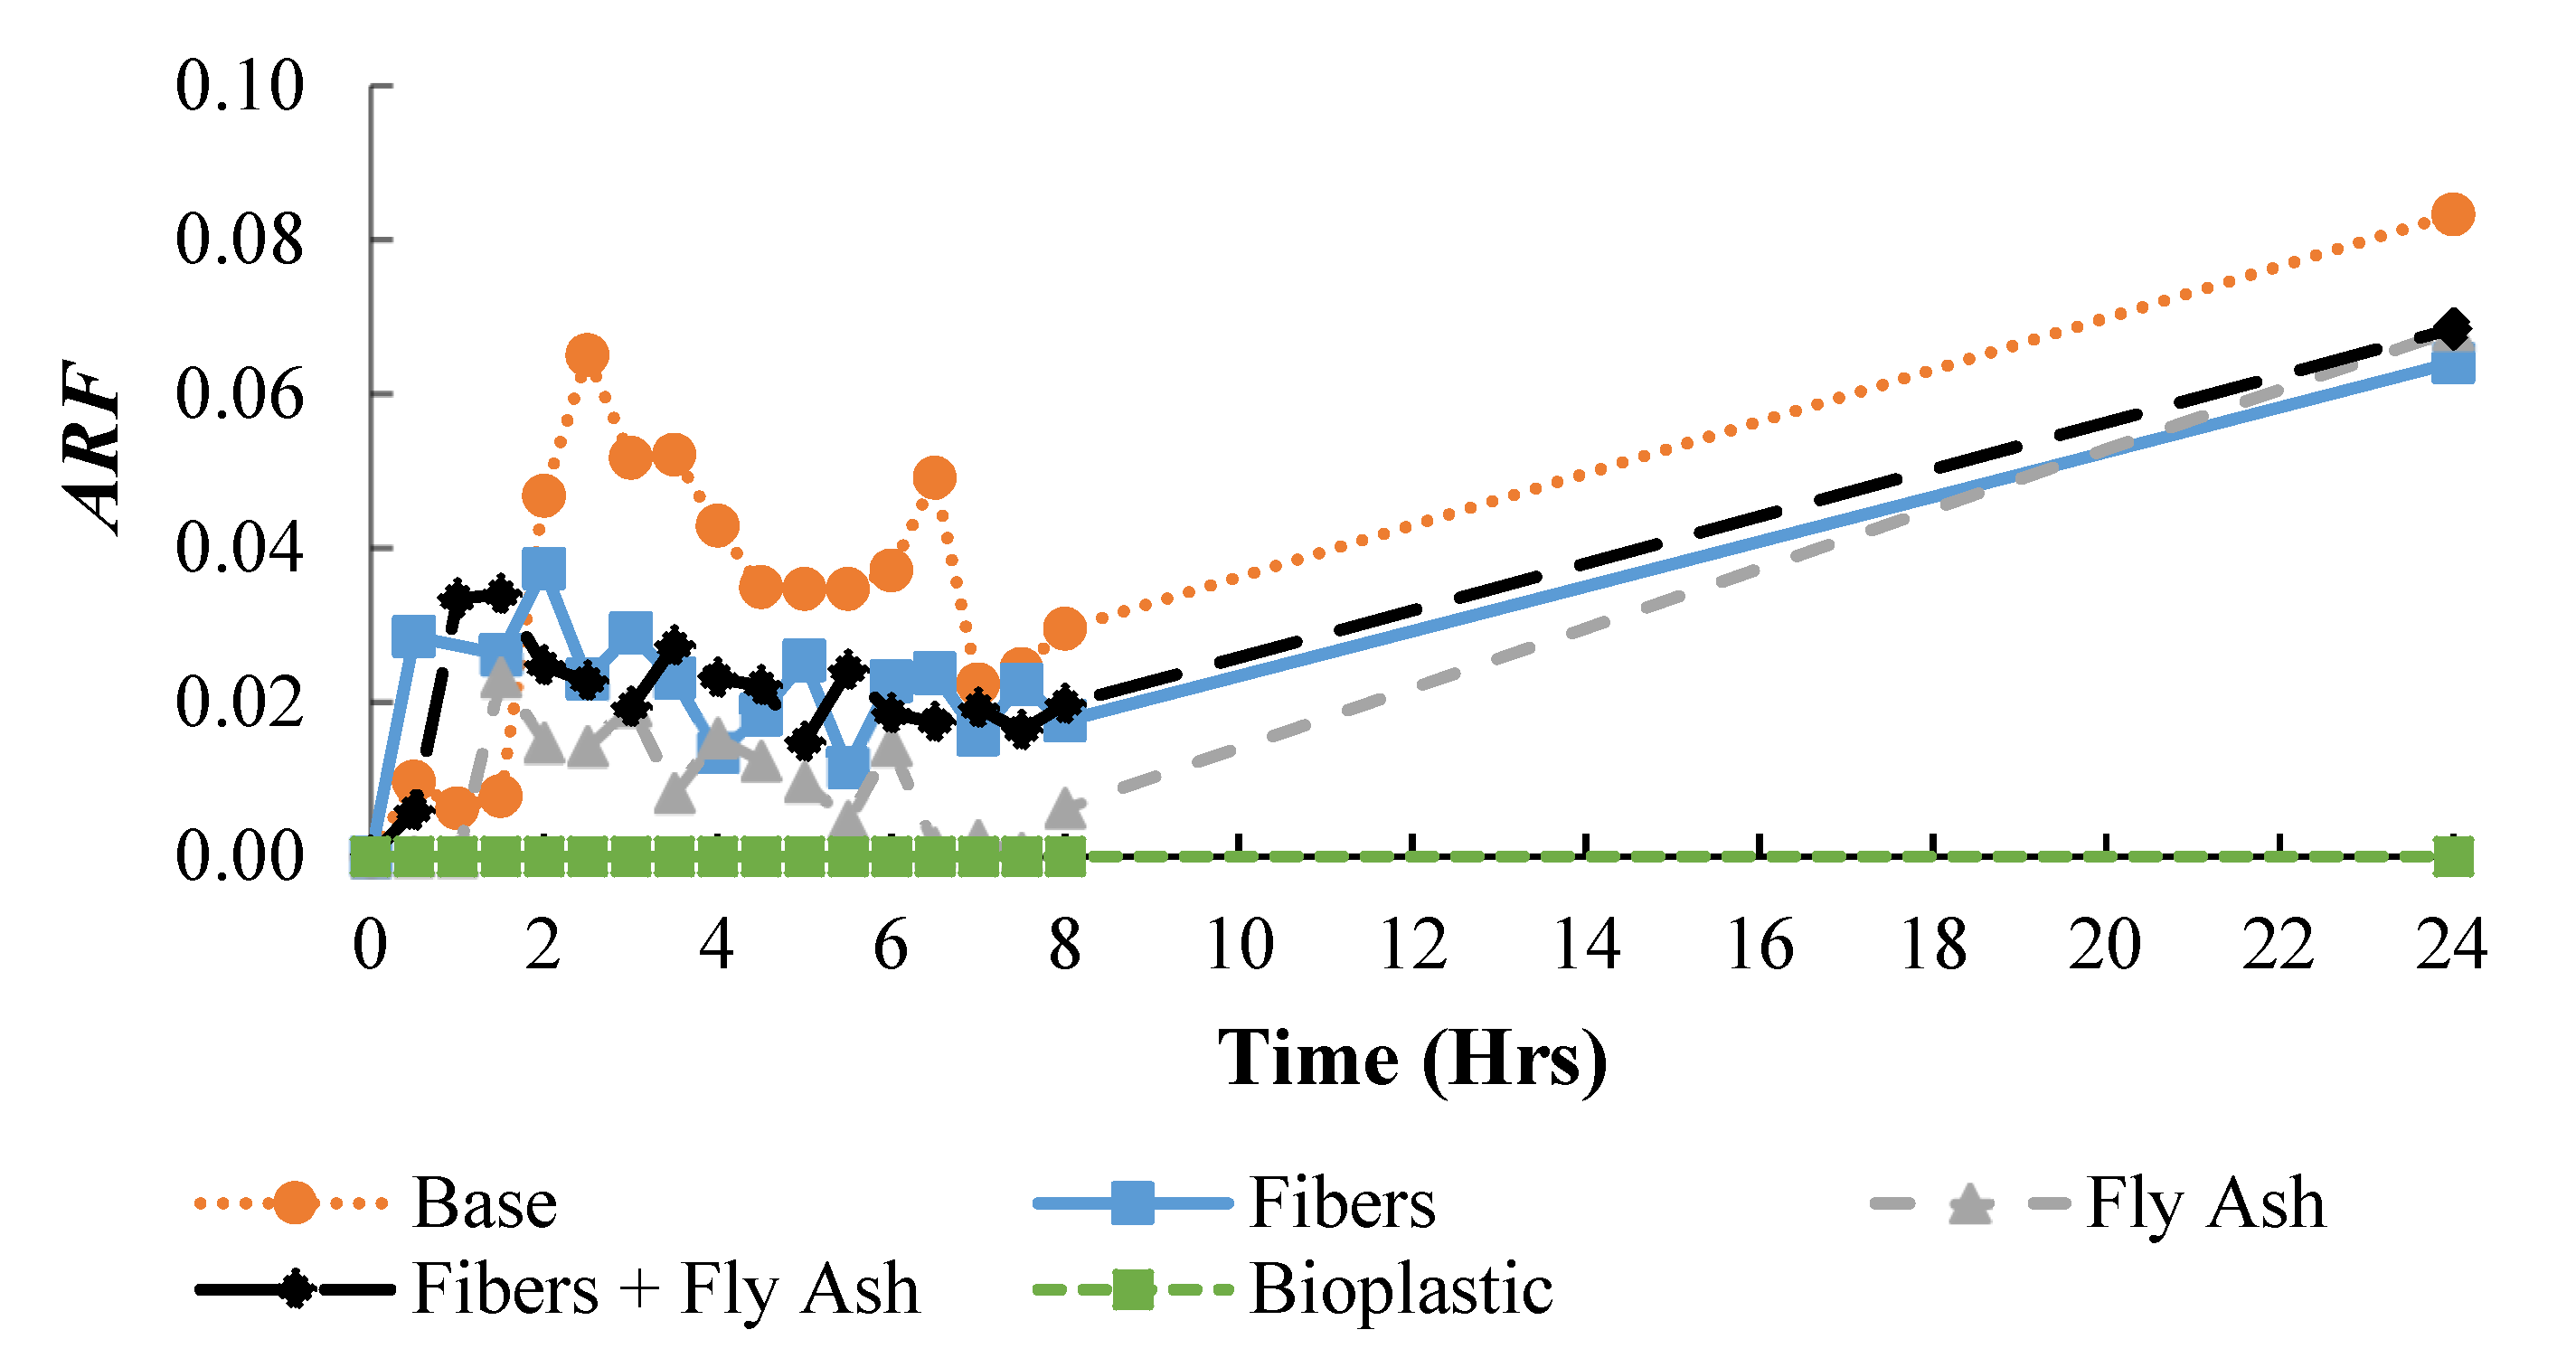
The
ARF parameter was introduced to quantitatively measure the effectiveness of each soil improvement technique in reducing desiccation cracking as well as the overall soil shrinkage. The efficacy of the respective additives for the standard desiccation test can be seen in
Figure 12. The figure shows that the base material exhibits the greatest
ARF and the bioplastic exhibits virtually no shrinkage and did not crack after 24 h. Even though no cracks developed in any specimens until the 24-h mark, the samples still had
ARF values due to lateral shrinkage of the samples before cracking. By analyzing the images, it was determined that the variations in the short-term were caused by discoloration in the clay surface as a result of uneven drying.
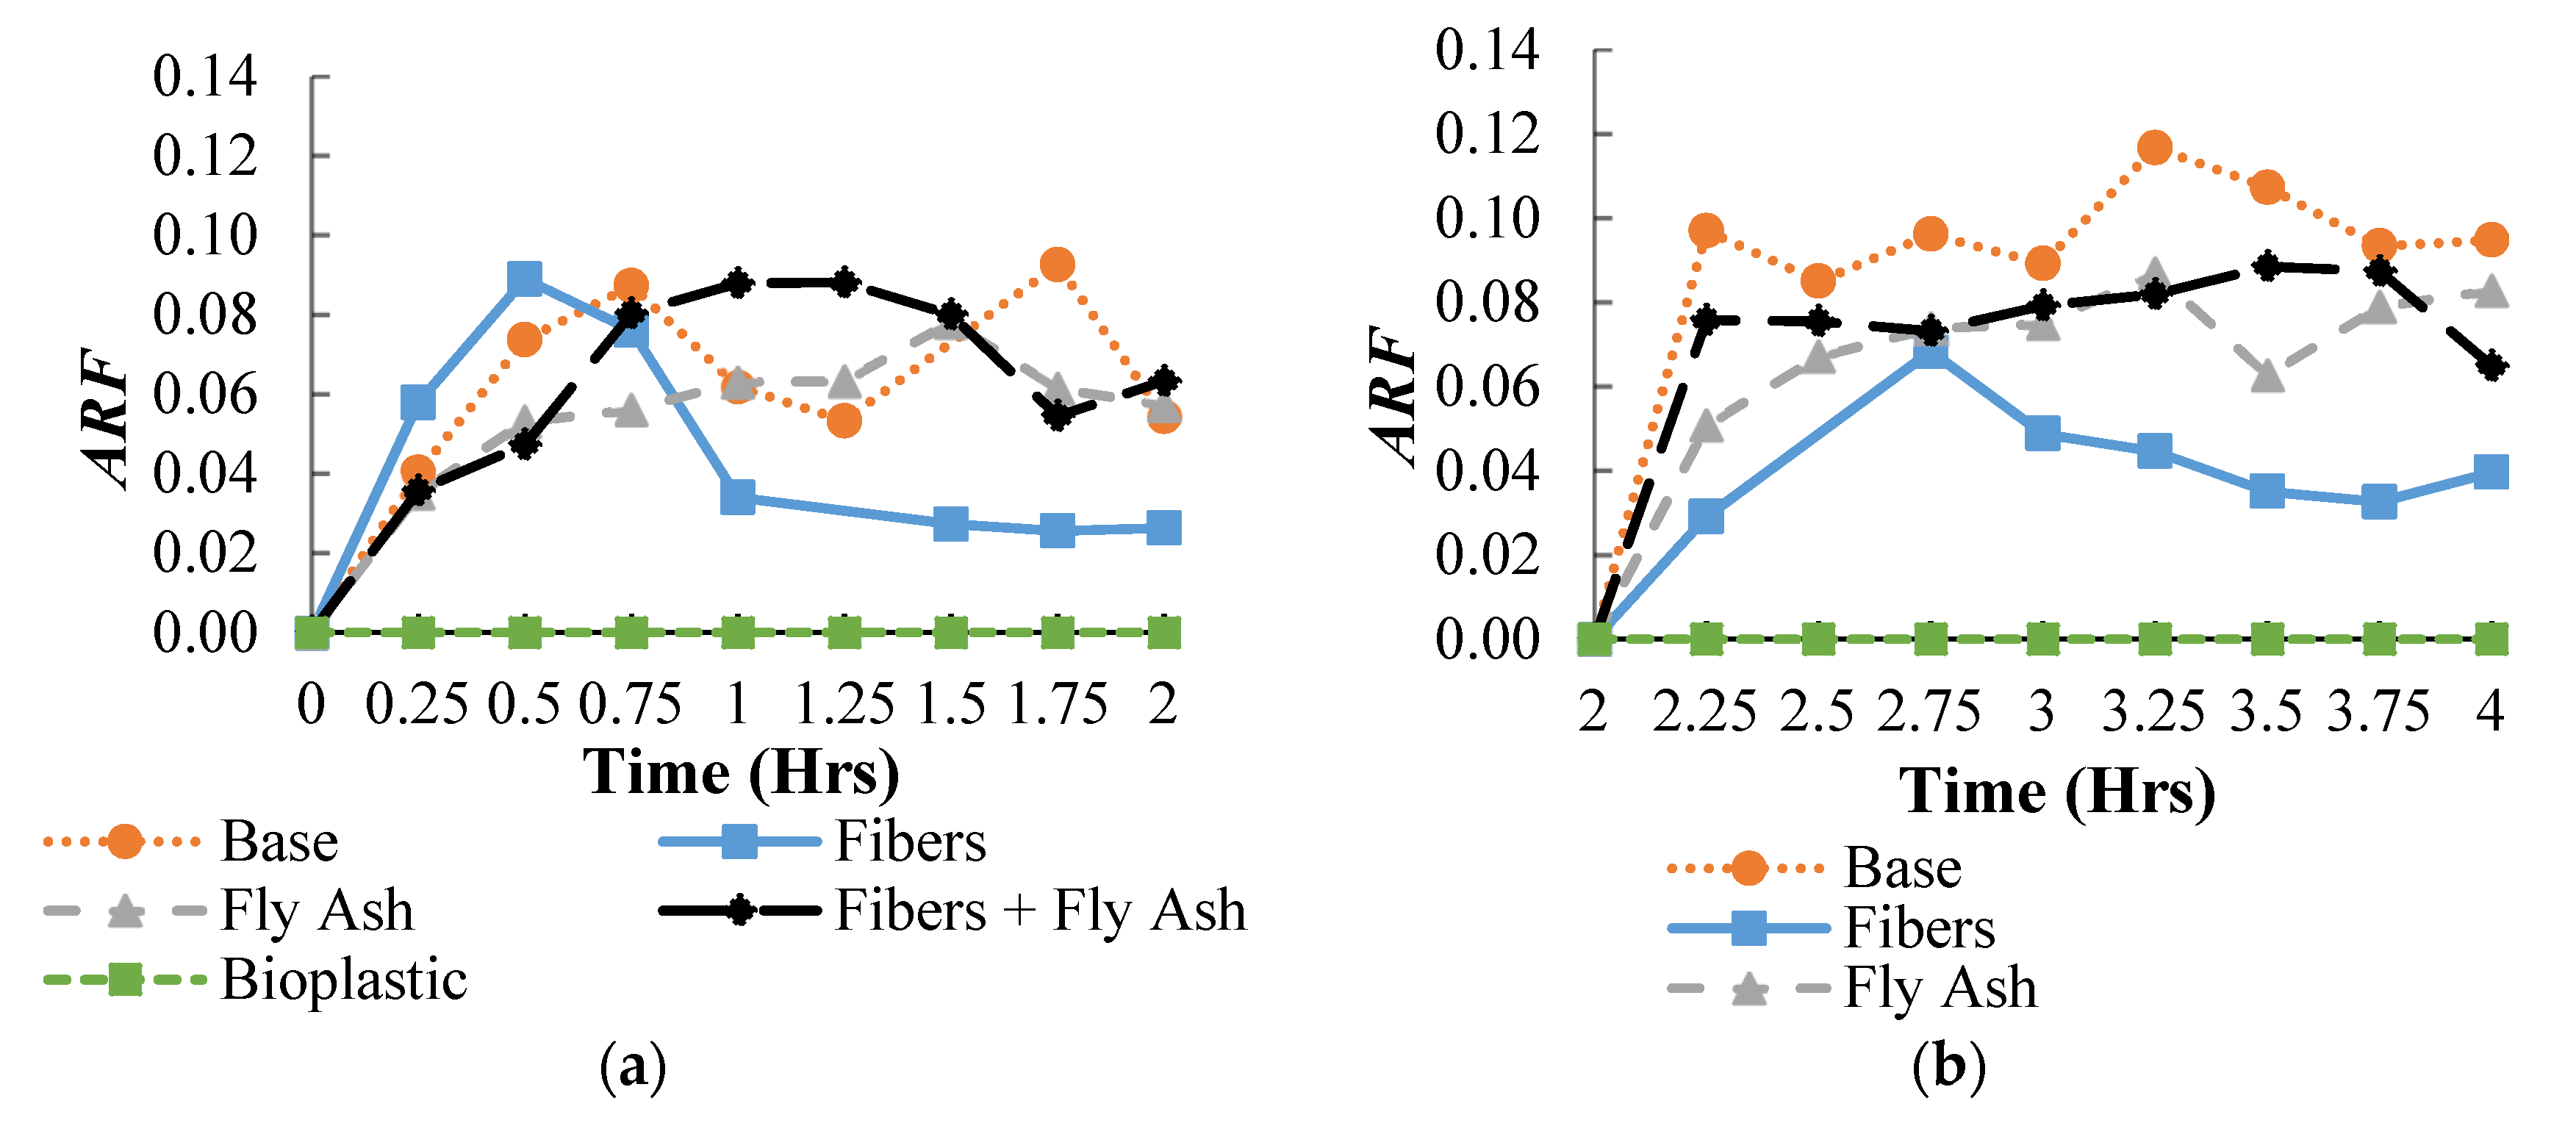
For the accelerated desiccation test, the results from before and after the rewetting process were analyzed. The ARF data for both the initial drying cycle and the drying cycle after rewetting are displayed in
Figure 13 a and b, respectively. The results showed that the samples including the fly ash provided little improvement when exposed to higher temperatures. Again, the sample mixed with the gelatin-based bioplastics showed no change in the surface area even when exposed to higher temperatures.
4. Conclusions
The main aim of this research is the development of novel, eco-friendly soil improvement techniques and the investigation of their effect on the desiccation cracking behavior. In particular, three different sustainable soil improvement types were investigated, namely, fibers, bioplastics, and fly ash, along with a fly ash-fiber hybrid. The effect on the cohesive soils’ crack resistance from the addition of a bioplastic and recycled carpet fibers were examined for the first time. In addition, the effectiveness of the techniques for crack resistance were examined at different temperatures and when subjected to cyclic wetting and drying for the first time.
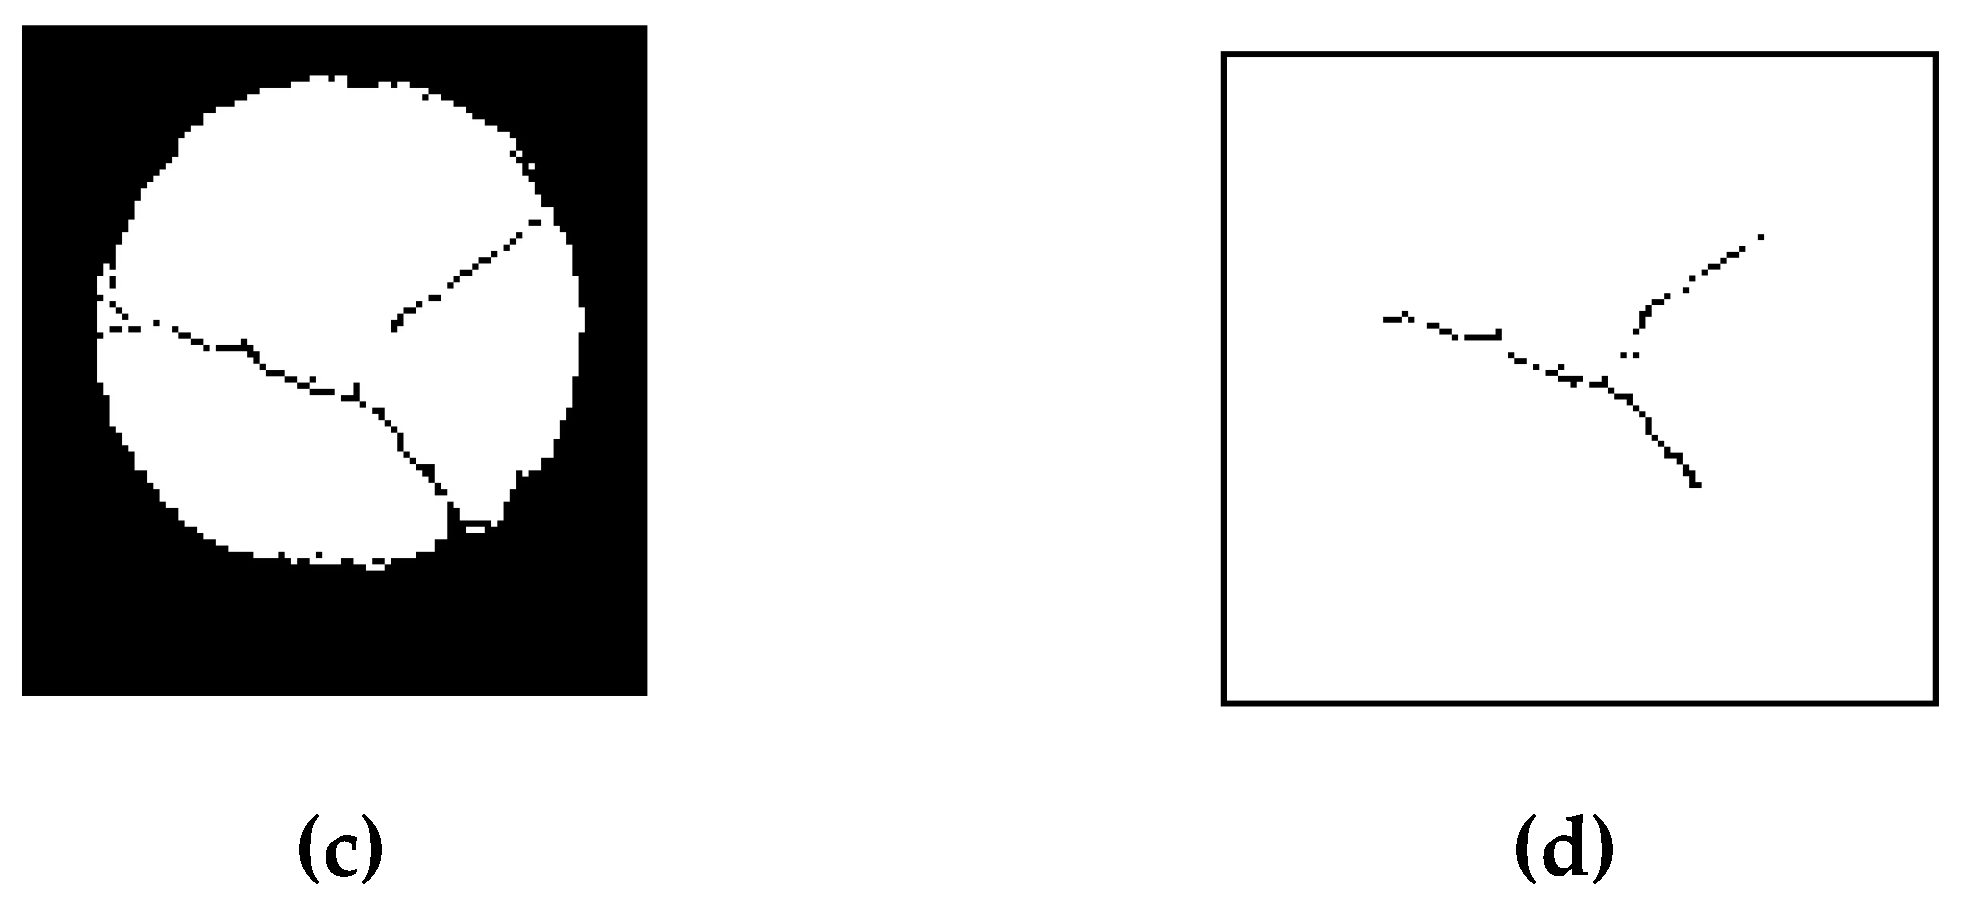
A qualitative analysis was conducted by analyzing the geometric characteristics of the cracking patterns in the plain and sustainably improved soil samples. It was completed using an original code powered by MATLAB’s image analysis software before performing image matrix operations in VBA program. MATLAB’s image processing software proved to be a powerful tool in quantifying the 2D cracking behavior of the clay soils. By converting photos of the clay samples into representative matrices, each sample’s crack geometry could be quickly and accurately attained. This is a vast improvement over the time consuming, expensive, and mostly inaccurate manual methods that have been employed to measure cracking behavior.
The ARF provided a comparative measurement that incorporated surface area change due to cracking as well as global shrinkage of the clay samples. The average crack width and maximum crack width data further described the crack geometry and each improvement techniques’ effectiveness in reducing the scope of desiccation cracking. The bioplastic proved to be the most effective technique, completely preventing cracking and surface area reduction at room temperature, elevated temperatures and when subjected to a wetting and drying cycle. The fly ash treatment was able to reduce the width of the cracks when subjected to increased temperature but supplied little improvement over the untreated soil in terms of the total surface area reduction. Conversely, when dried slowly at room temperature, the same treatment technique yielded wider cracks than the base soil, but did show a 25% improvement in terms of ARF. The fiber-reinforced samples showed a sustained decrease in the crack size in each scenario, except for when the sample was being dried a second time after the rewetting process. At that point, the fiber-reinforced soil showed little improvement in minimizing the crack size, but still reduced ARF by 60%. The sample treated by the fiber-fly ash combination significantly decreased the size of cracks in all scenarios. However, this treatment showed little improvement over the base soil when subjected to a higher temperature with regards to the ARF. In addition, the combination fared worse than the soil treated solely by fibers. The behavior of the fly ash treated samples and the combined sample suggests that fly ash loses its effectiveness when subjected to higher temperatures.
The results included in this paper are part of a larger research project examining the viability of novel sustainable soil improvement techniques. Moving forward, more research into sustainable desiccation crack reduction is warranted. Based on the success in this investigation, other recycled fibers should be studied to determine their viability. Due to the bioplastic’s overwhelming performance as a crack propagation reducer, biopolymers that behave similarly to the bioplastic, such as guar gum and xanthan gum, should be closely examined as potential solutions to desiccation cracking.

