Article

Exploring Expedient Protected Area for Ecosystem Services: Decision-Making Method with a New Algorithm

1
School of Geography and Tourism, Shaanxi Normal University; Xi’an 710119, China
2
College of Geomatics, X’ian University of Science and Technology; Xi’an 710054, China
*
Author to whom correspondence should be addressed.
Sustainability 2019, 11(20), 5599; https://doi.org/10.3390/su11205599
Submission received: 16 September 2019 / Revised: 3 October 2019 / Accepted: 7 October 2019 / Published: 11 October 2019
(This article belongs to the Section Environmental Sustainability and Applications)

Abstract

:
From the point of view of ecological environment protection, the concepts of biodiversity, carbon sequestration, water production and culture have been selected to evaluate the ecosystem services of Guanzhong-Tianshui Economic Zone. A multi-criterion decision-making method is applied to select the expedient protected area of the study area, which can provide abundant natural resources and a basis for the maintenance of ecological balance. In this paper, by setting up different risk values and weights to calculate OWA (ordered weighted averaging) operator, the scenario of the expedient protected area with the highest tradeoff value is selected. This study analyzes and evaluates ecosystem services in the study area by combining natural and human factors, and the OWA operator is used to balance the trade-offs between different ecosystem services, as well as select the expedient protected areas, which provides a reference for improving ecosystem services in the study area.

1. Introduction

With the intensive study of ecosystem structure, function and process, the concept of ecosystem services is constantly developing. Ecosystem services are the bridge between humans and the ecological environment, and they are the benefits that humans gain directly or indirectly from the ecosystem. On the basis of the contribution of ecosystem services to human beings, ecosystem services can be divided into four categories: supply services, regulation services, support services and cultural service [1]. Scholars have studied ecosystem services extensively, and some research has been conducted on ecological services, which have explored relevant models [2] or studied the impacts of certain ecosystem services on ecosystems [3,4]. Because the concept of ecosystem services is centered on the provision of the well-being of humans [5,6], it is challenging to maximize the benefits between different ecosystem services simultaneously; there are varying degrees of trade-offs and synergistic relations among the different ecosystem services [7,8]. Ecosystems are complex systems with complex interactions among their internal elements. When we selectively emphasize one type of ecosystem service, it often undermines the provision of one or more other services, which in turn leads to environmental problems. As people’s demands for ecosystem services increase, it becomes essential to scientifically evaluate ecosystem services [9,10]. Currently, the study of ecosystem services in nature is adequate. Cultural services, one of the four basic categories of ecosystem services, have undergone slower development than other services, owing to the difficulties associated with quantitative evaluation [11]. Cultural ecosystem service values relate to the nonmaterial benefits that people derive from the ecosystem, through spiritual satisfaction, cognitive development, thinking, recreation and aesthetic experience [12]. The significance and necessity of cultural services research is becoming a topic of concern to scholars, and the concern is primarily reflected by the auxiliary role of cultural services in government decision-making and policy formulation [13]. Cultural services can be combined with other ecological services through the relative contribution of different ecological landscapes and appropriate evaluation methods [14,15]. In this paper, we select some factors such as landscape aesthetics, historical culture, and spiritual satisfaction, and quantify them through such methods as social evaluation and expert assessment. The present study integrates the natural and humanistic factors of ecosystem services and allows for better integration of cultural services within the broader ecosystem services framework.
Multi-criterion decision-making refers to decisions that are made among a set of finite (infinite) schemes that are conflicting and incompatible, which is one of the important aspects of analytical decision theory. Ordered weighted average operator (OWA) is a method of combining the weights of control factors proposed by Ronald R. Yager in 1988. It reorders the index data according to the size of their attribute values. According to the order of each index, different order weights are assigned and weighted aggregation, so that decision-makers can dynamically change the level of decision-making risk, so as to obtain multi-scale evaluation results. At present, OWA is widely used in urban disaster prevention assessments and water resources management, but there are few studies combined with ecological environment protection. The OWA operator is used to generate a wide range of decision options, which can be used to resolve uncertainties associated with interactions between multiple criteria. Applying the OWA method to the study of ecosystem services, the utility of this method can be explained by different OWA scenarios, and the situation can be expressed by setting different intervals between 0–1. The visual expression of the quantitative risk level of the scenario helps us to better map the choices in the decision-making process and the results produced, and generate a final map to show the ecosystem services index of the research area. As an analytical tool, the ecosystem services index maps generated using this method can identify areas of high value ecosystem services for planning ecological protected areas. Some scholars have attempted to study suitability evaluation for disaster prevention with a GIS-based OWA method [16], and the OWA approach has also been adopted to select expedient protected areas for conservation [17].
Protected areas were originally designed to protect specific landscapes and wildlife, but now they are given more meaning, because people hope that these areas can achieve diversified protection to meet social and economic goals [18]. Actually, protected areas are a key part of nature conservation as they play an important role in offsetting the effects of ecosystem degradation, they are essential for the protection of the environment and are aimed at conserving the ecosystem integrity and maintaining ecosystem services [19]. Protected areas protect the biodiversity, safeguard ecosystem services and provide additional environmental benefits. Researchers have analyzed the impacts of nature conservation on the delivery of ecosystem services, and their analysis showed that protected areas deliver higher levels of ecosystem services than non-protected areas, with the main differences being cultural and regulation ecosystem services [20]. Some other research has included the investigation of the historical background of protected areas management, the methods of ecosystem services, the relevance of the ecosystem services method in protected areas management, and as well as certain suggestions on how the ecosystem services approach should be integrated into protected areas management [21]. Protected areas have great potential to impact the local environment. The traditional method of delimiting protected areas is often not clear and does not often consider the impact of ecosystem services. Here, we propose to define protected areas by using the OWA operator combined with ecosystem service measurement to provide reference for protected areas planning.
Although numerous studies on ecosystem services have been conducted [22,23,24], the current study is novel because few assessments of the ecosystem services provided by protected areas have been performed using the OWA multi-criterion decision-making method. In the present study, we use the OWA method to balance trade-offs between the ecosystem services. Based on this approach, we can select the areas with the highest values of ecosystem services, which can contribute to informing future policies by providing valuable assessments for decision makers. We have selected the Guanzhong-Tianshui Economic Region as the study area, which was designated by the China State Council as an important strategic development region in western China in 2009. After the Silk Road Economic Belt and 21st Century Maritime Silk Road policies were established, the Guanzhong-Tianshui Economic Region became an important area of concern for national development, due to its important geographical location. There has also been a series of ecological and environmental problems that have taken place along with the rapid development, such as land desertification and serious haze; therefore, the establishment of expedient protected areas is very important in this region to protect the ecological environment and maintain an ecological balance. We comprehensively examine natural and social factors to evaluate the ecosystem services, and through calculation using the OWA operator, the expedient protected ecological areas are selected in our research.

2. Materials and Methods

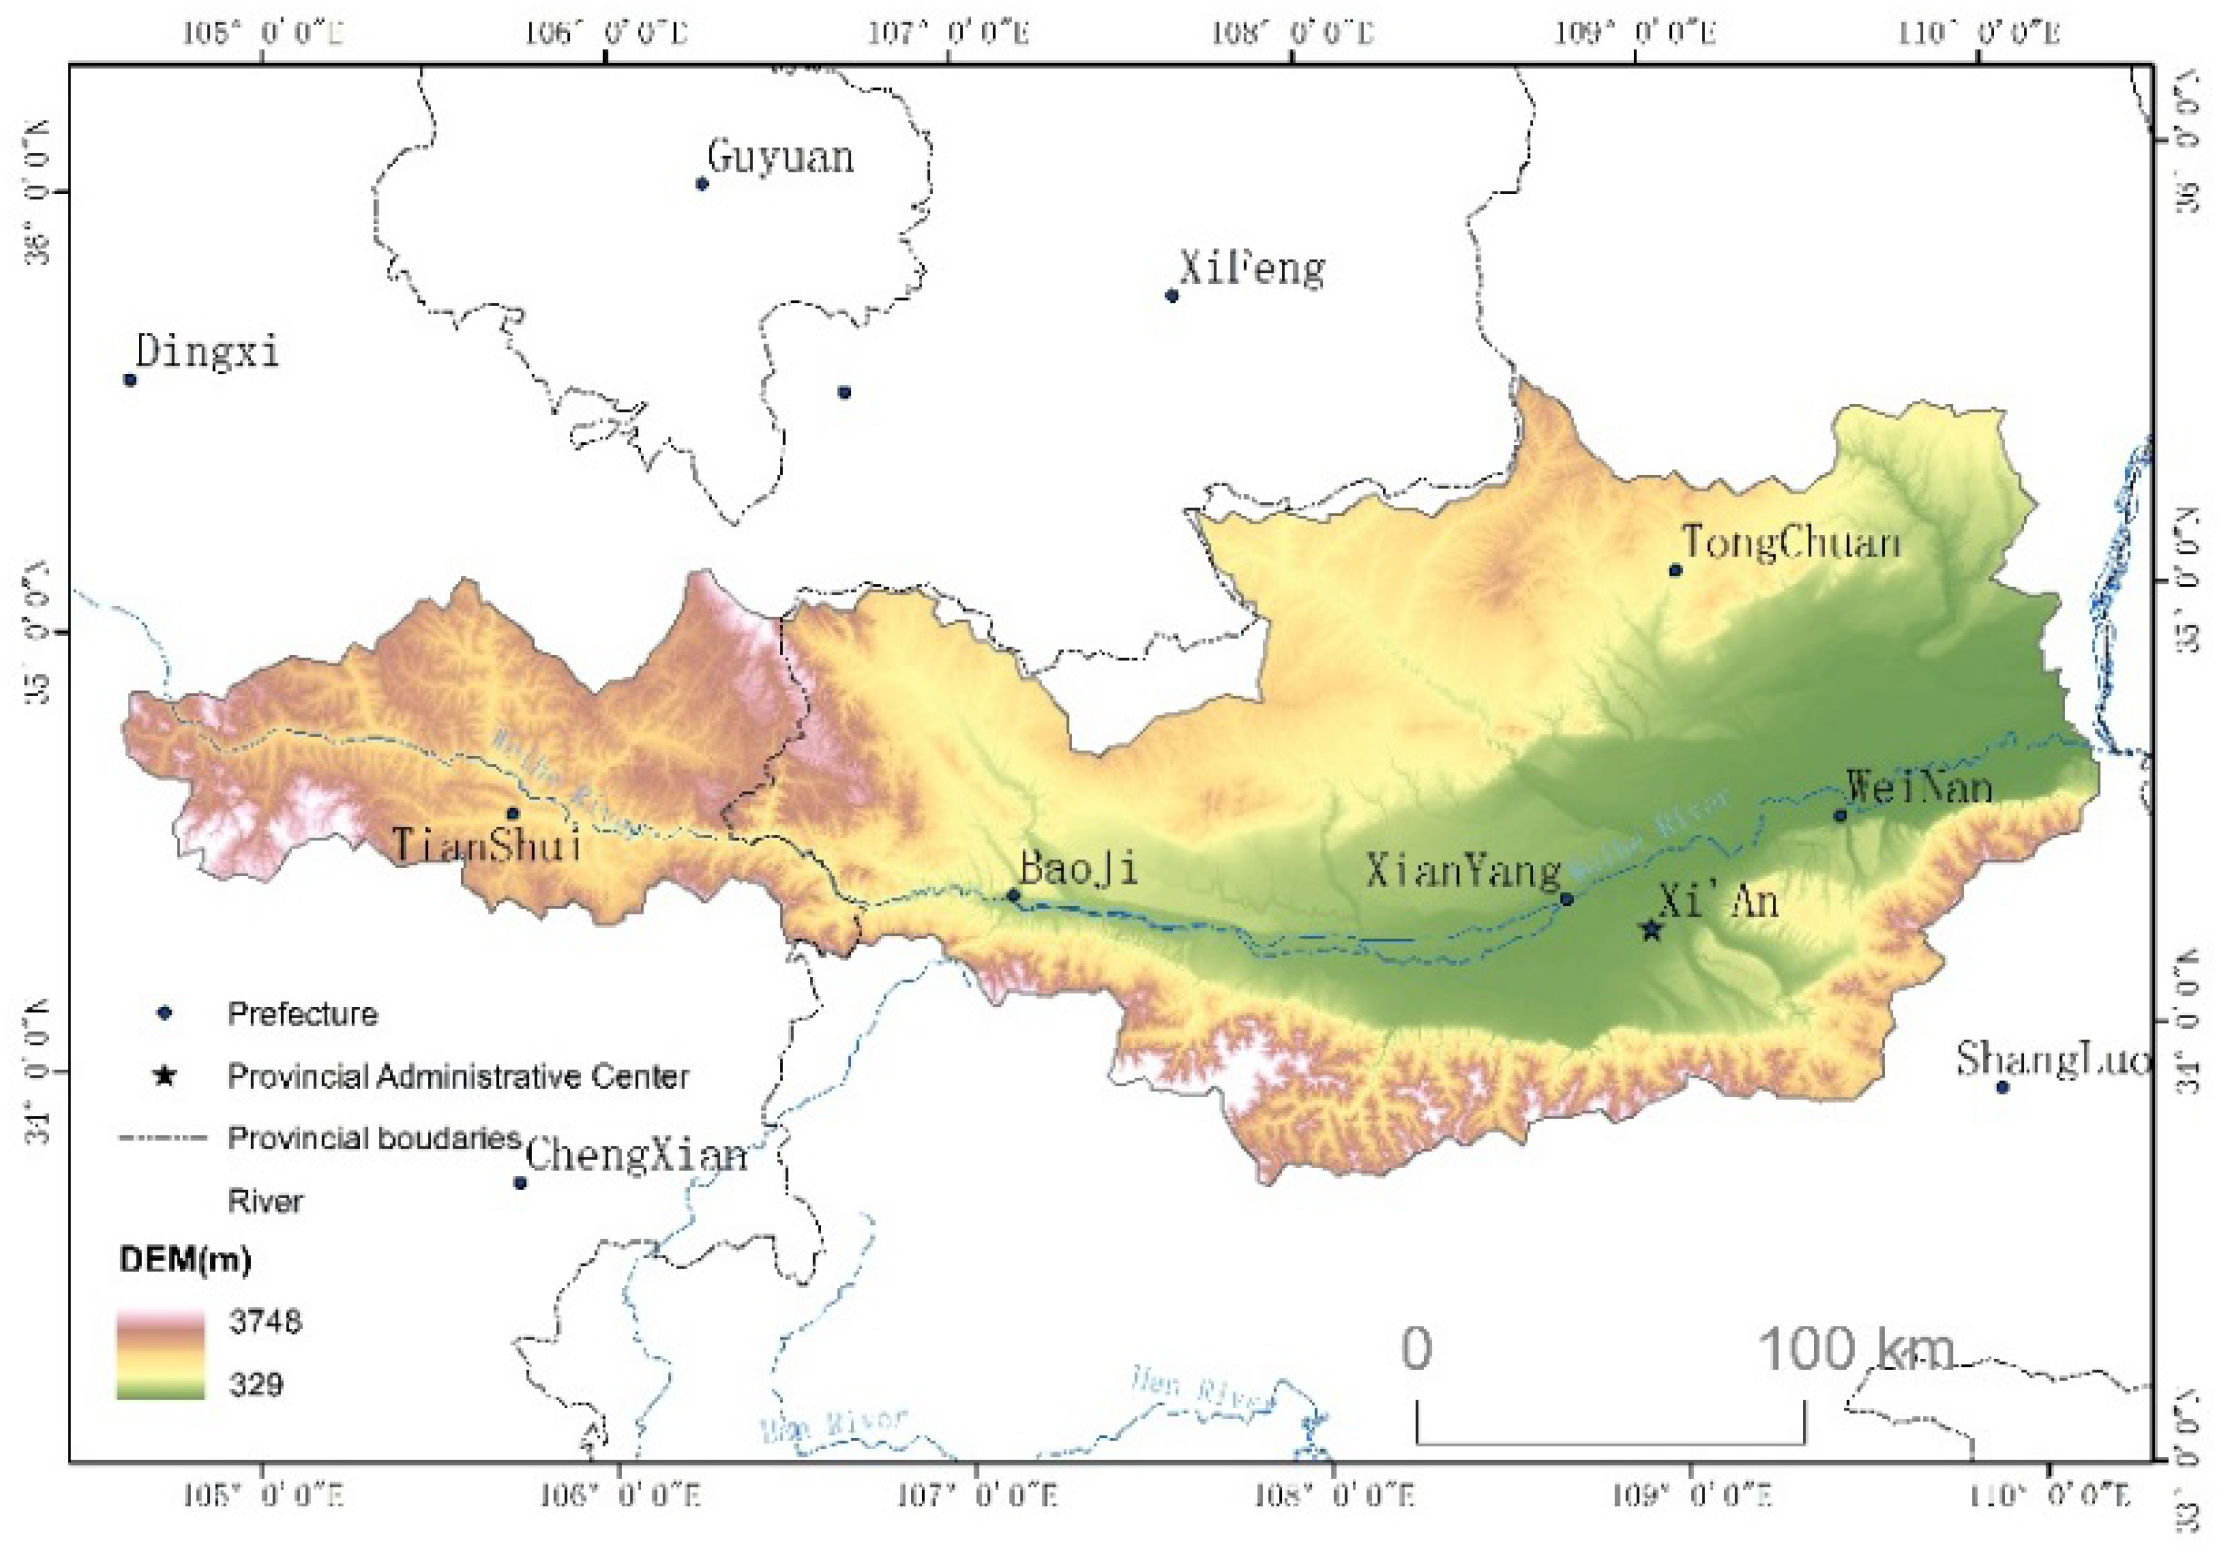
2.1. Overview of the Study Area

As the largest tributary of the Yellow River, the Weihe River originates in Dingxi city, Wuyuan County, Gansu Province, China. The Weihe River primarily flows through Tianshui in Gansu Province and the Guanzhong Plain in Shaanxi Province and then joins the Yellow River in Tongguan County. The total area of the Weihe River Basin is approximately 130,000 square kilometers, and the average annual precipitation is approximately 550 mm. The altitude range is 319–3748 m. The regional terrain is high in the west and south, low in the east and north, and the southern part mostly consists of hills. There are many types of vegetation and landforms, which makes the Weihe River Basin an important river basin ecosystem in the western region. The Guanzhong-Tianshui Economic Zone (Figure 1) was defined by the State Council in 2009 and Xi’an was established as the center of a developed urban agglomeration and industrial cluster in western China. The rapid population growth in recent years, the unreasonable development and utilization of human water resources, and the increasingly prominent discord between humans and land usage have led to a sharp deterioration in the ecological environment of the study area. Although certain problems have been addressed through comprehensive management, research on future ecological planning is still insufficient. Therefore, a comprehensive evaluation of the ecosystem service value of the Weihe River Basin (Guantian Section) and reasonable selection of expedient protected ecological areas are of great significance to the ecological development of the entire western region of China [25].

2.2. Data Sources

The data used in this study include: (1) Basic geographic data, including basin boundaries, county (city) boundaries, etc., from the National Surveying and Mapping Geographic Information Bureau. (2) Soil data, mainly including soil organic carbon content, and data such as soil bulk density and soil thickness are derived from the China Soil Dataset based on the World Soil Database (HWSD) of the Lanzhou Cold Region Arid Data Center. (3) Land use type map, with 30 m resolution, land use data from 2015, obtained from the Resource and Environmental Science Data Center of the Chinese Academy of Sciences. (4) DEM data from the geospatial data cloud, with 30 m resolution. (5) Biomass data from the Greenhouse Gas Inventory Methodology for the Identification of Agriculture, Forestry and Other Land Use Sectors established by the Intergovernmental Panel on Climate Change (IPCC) in 2006 (IPCC, 2006, http://www.ipcc-nggip.iges.or.jp/public/2006gl/pdf/4_Volume4/V4_02_Ch2_Generic.pdf). (6) Social statistics are derived from statistical yearbooks. (7) Meteorological data, including precipitation, temperature, wind speed, etc., are derived from the China Meteorological Data Network. (8) Some of the information was obtained from relevant literature.

2.3. Research Methods

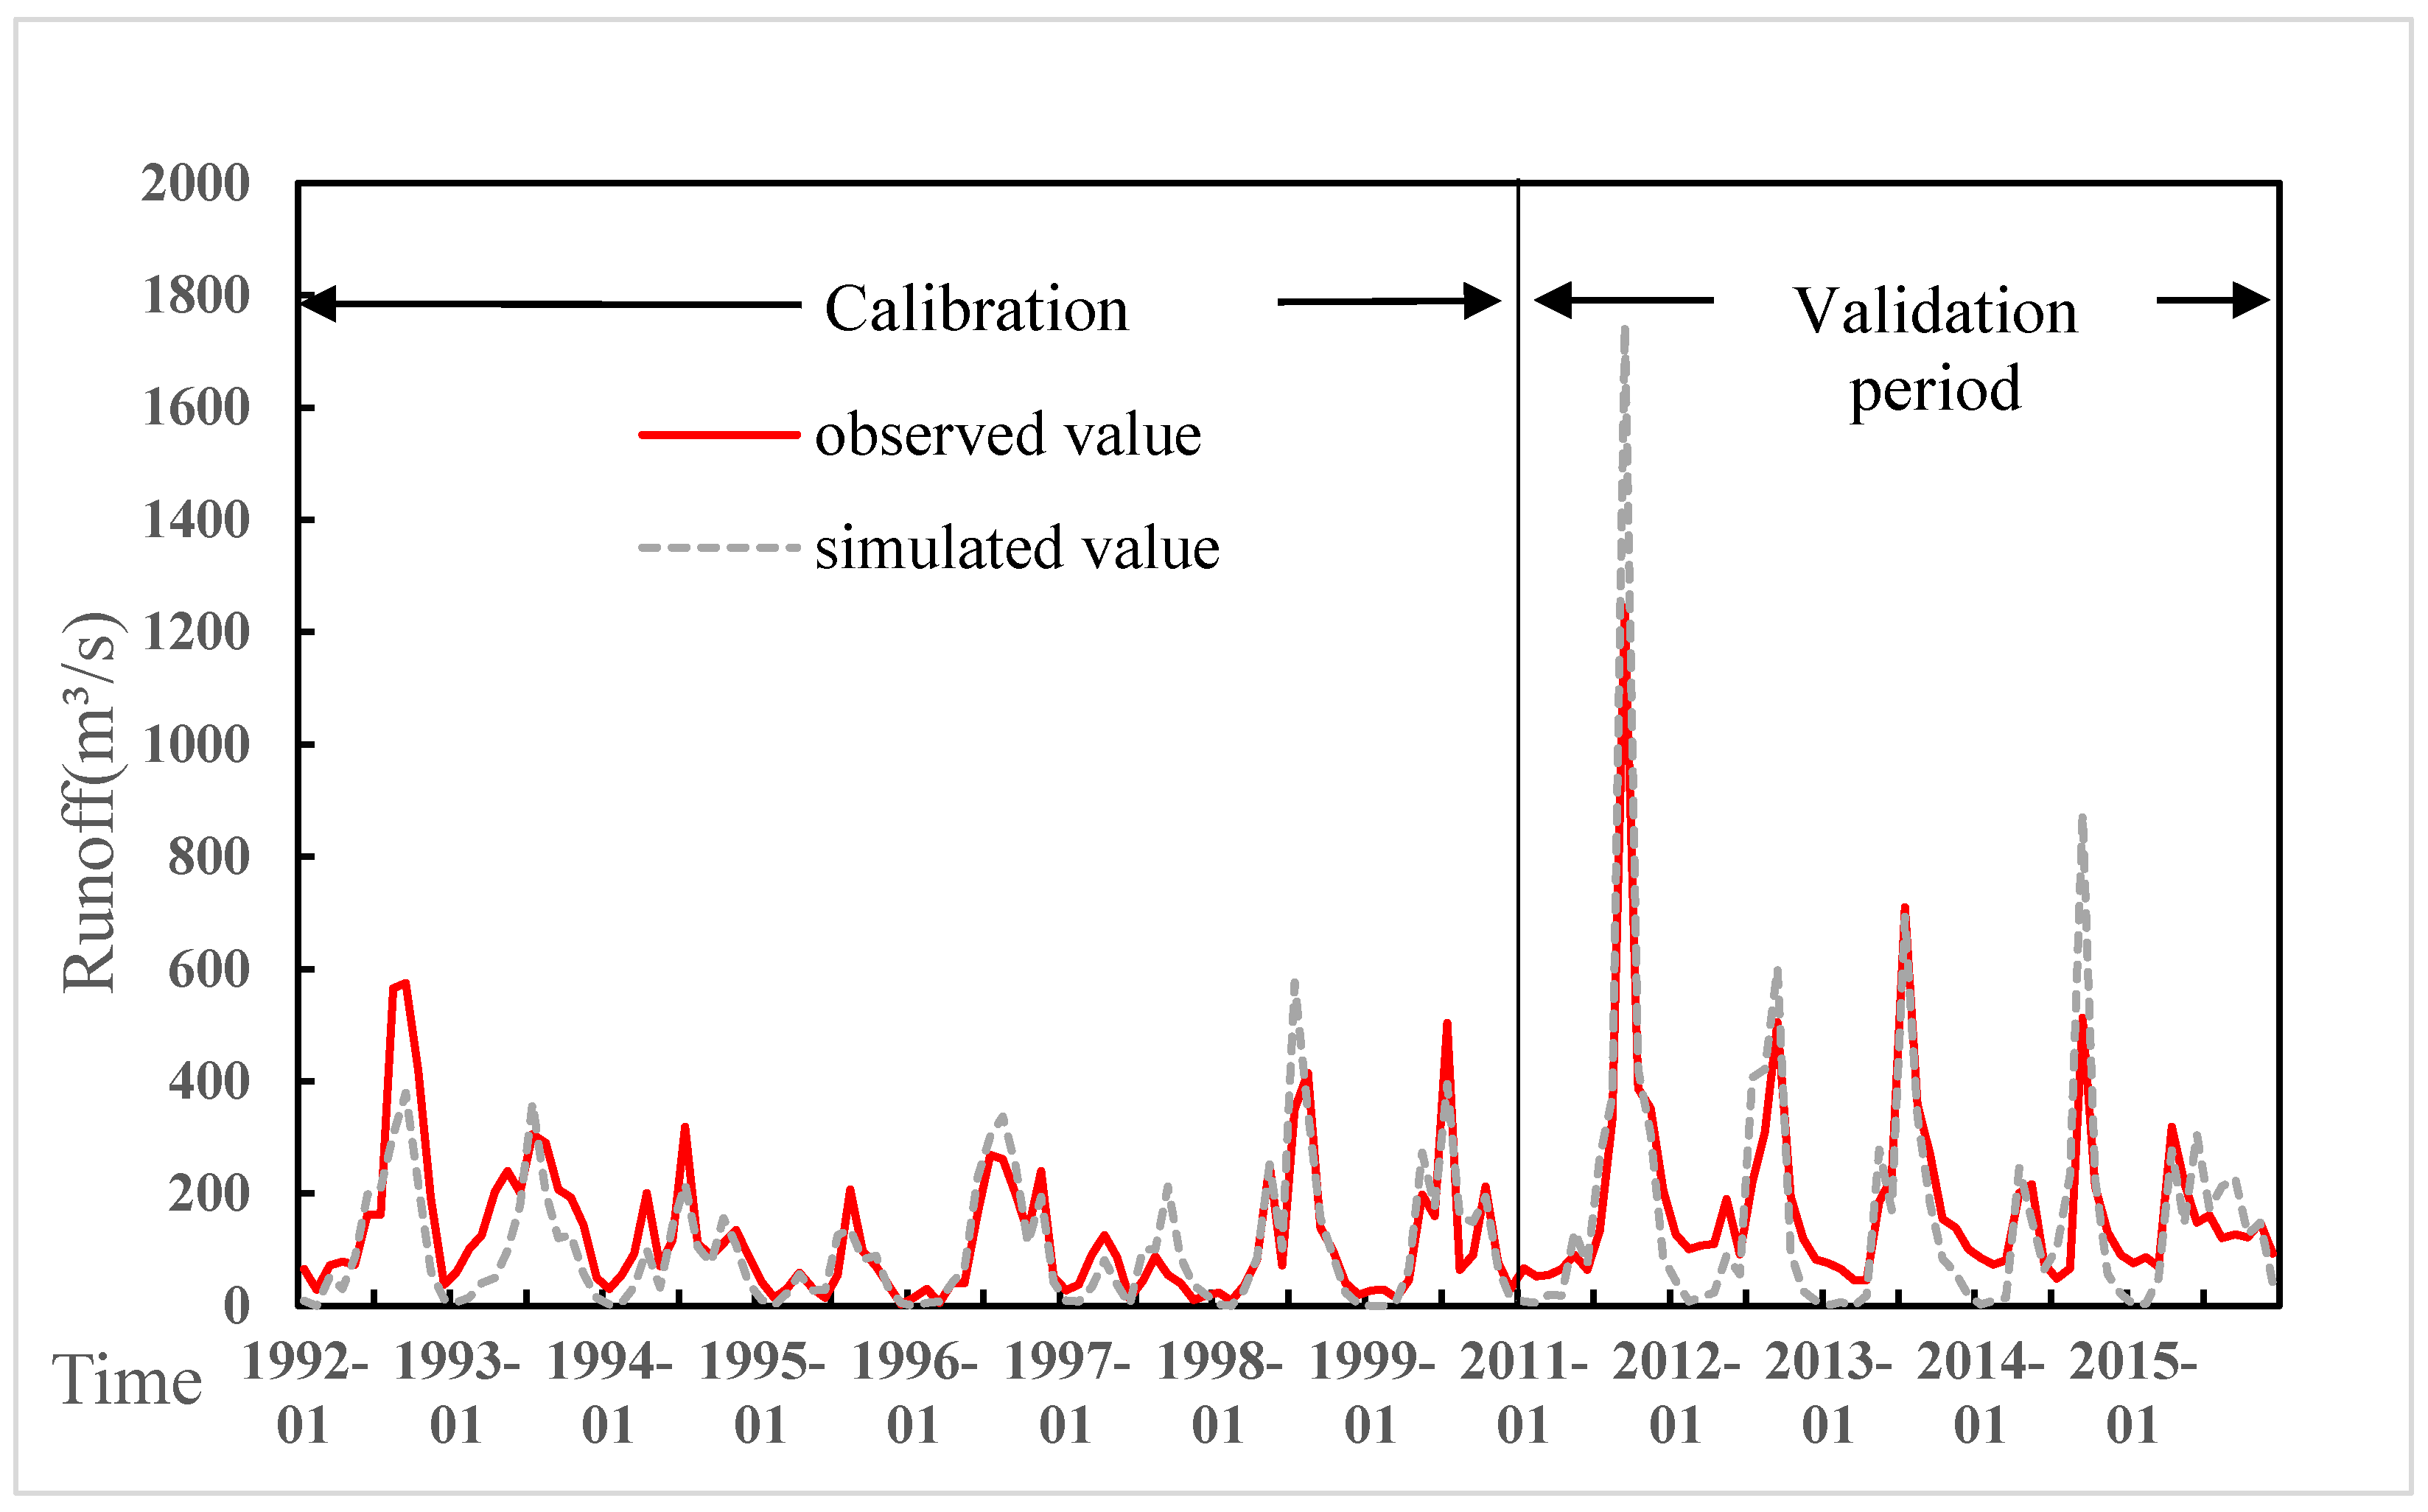
2.3.1. Principle and Structure of the SWAT Model

Water production is calculated using the SWAT (Soil and Water Assessment Tool) model, which is a distributed hydrological model developed by the U.S. Department of Agriculture. The SWAT model is widely used in the simulation and prediction of various land management measures and climate change hydrological impacts at the basin scale. The SWAT model divides the entire watershed into several subbasins based on DEMs (digital elevation models), land use type maps, and soil data. The water yield is an important criterion for evaluating ecosystem services [26,27]. In this paper, we defined 157 subbasins by considering specific conditions of the study area, including data from 8 weather stations such as the Huaxian station. The specific calculation formula is as follows:
W Y L D = S U R Q + L A T Q + G W Q T L O S S P A
In the Equation (1), WYLD is the total water production, in mm; SURQ is the contribution of the surface runoff to the total runoff, in mm; LATQ is the contribution of the lateral flow to the river runoff, in mm; GWQ is the contribution of the underground runoff to the total runoff, in mm; TLOSS is the amount of water lost through riverbed transmission, in mm; and PA is the pond interception, in mm. In this study, the runoff data of the Huaxian station were selected for parameter calibration and verification. The calibration period was from 1992 to 1999, and the verification period was from 2011 to 2015.

2.3.2. Carbon Sequestration
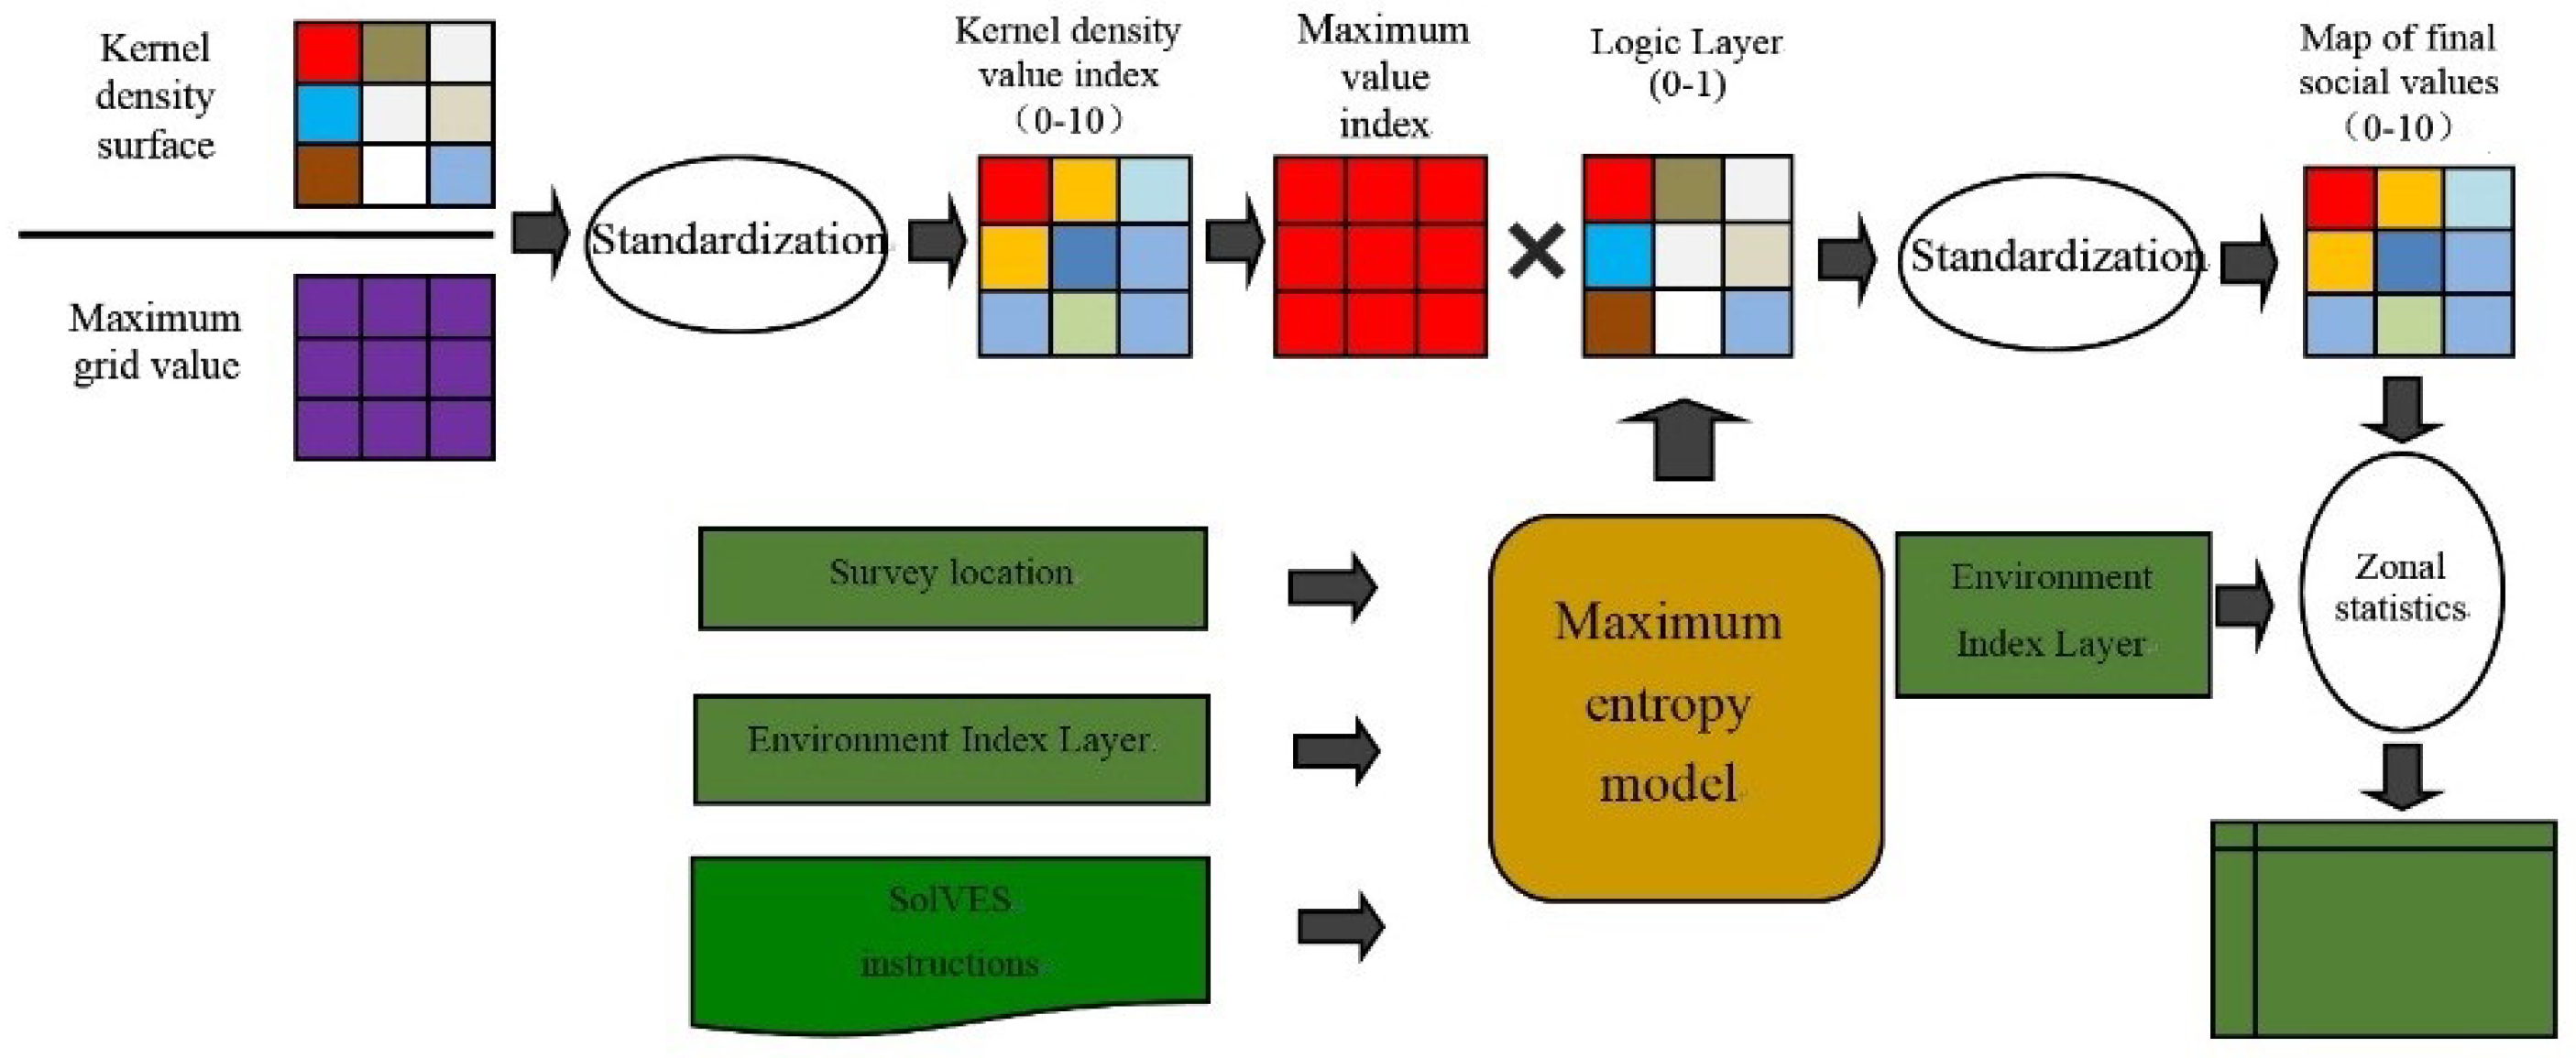
Even though there have been some studies on carbon sequestration [28,29], this paper adopts a general algorithm; the existing carbon sequestration in the environment primarily involves storage in four basic carbon pools: aboveground biomass, underground biomass, soil and dead organic matter. The necessary data to run the carbon module of the InVEST (Integrated Valuation of Ecosystem Services and Trade-offs) model, which is jointly developed by Stanford University, The Nature Conservancy (TNC) and the World Wide Fund for Nature (WWF), include land use type maps and carbon density data of the four carbon pools corresponding to each land use type; the optional data include the current timber harvesting rate, harvest period, carbon price, etc. Considering the research needs and availability of data, this paper primarily evaluates land use type data and carbon density data. The land use data in this study include six basic types: cultivated land, forestland, grassland, water body, urban construction land, and unused land.
The soil carbon density data are derived from the China Soil Dataset based on the Harmonized World Soil Database (HWSD). The selected attribute data include the soil surface and deep organic carbon content, soil surface layer and deep bulk density, and reference depth of each soil type. The soil carbon density is calculated by Equation (2).
C s o i l   = T O C × H × R × 0.1 ×   conversion   factor
In Equation (2), C s o i l is the carbon storage per unit area of soil, ie soil carbon density (kg/m2),   T O C is the organic carbon content (%); R is the average bulk density of each soil type (g/cm3); H is the reference depth of each soil type, in cm; 0.1 is the conversion unit and the conversion factor is the Bemmelen conversion factor (0. 58 g C/g SOC). Because various land use types are distributed on different soils, soil carbon stocks of the land use types are calculated and summed on the basis of soil distribution maps and combined with different land use types.
The aboveground and underground vegetation carbon density data is derived from the Greenhouse Gas Inventory Methodology established by the Intergovernmental Panel on Climate Change (IPCC) in 2006 to determine the agricultural, forestry and other land-use sectors, based on the aboveground and underground vegetation biomass, IPCC is a good source of data for estimating carbon stocks, but to use IPCC data, the climatic conditions and zoning of the study area must be clearly defined, and the aboveground and underground biomass of the main land-use types should be estimated using the tables provided by the IPCC.
C a b o v e   =   k ×   B i
In Equation (3), C a b o v e is the carbon density of aboveground plants (kg/m2); B i is aboveground biomass (kg/m2); IPCC (2006) uses biomass as the caliber, and InVEST model uses elemental carbon mass. The conversion of biomass into carbon needs to be multiplied by a conversion factor ranging from 0.43 to 0.51, where k is the conversion factor.
The calculation method of underground vegetation carbon density is as follows:
C b e l o w =   p   ×   k ×   B i  
In Equation (4), C b e l o w is the carbon density of underground plants (kg/m2); p is the ratio of aboveground biomass to underground biomass. This ratio can be obtained from IPCC data.
To calculate dead organic matter carbon density, and because the dead organic matter carbon density data is difficult to obtain, this study uses the default value of IPCC (2006). Table 1 (IPCC 2006) shows the default carbon stock values for leaf litter in forest land types. The non-forest type is estimated to be close to zero due to the small amount of litter.
Total carbon density library calculation method:
C s t o r a g e =   ( C s o i l   +   C a b o v e   +   C b e l o w +   C d e a d ) ×   S
In Equation (5), C s t o r a g e is the total carbon storage of a certain land, and the unit is kg; C s o i l , C a b o v e , C b e l o w , C d e a d are soil carbon density, aboveground and underground vegetation carbon density, and dead organic matter carbon density, and the unit is kg/m2; S is the area of the land, in m2 [30].

2.3.3. Biodiversity

Biodiversity is the ecosystem structural basis provided by ecosystem services, and is closely related to the production of ecosystem services. The habitat quality module of the InVEST model can reflect the characteristics of biodiversity. Habitat quality refers to the ability of the environment to provide suitable production conditions for the survival of individuals or populations. The habitat quality of each grid in a habitat is determined by its habitat suitability (the value ranges from approximately 0 to 1, with 1 indicating that the habitat has the highest degree of suitability; a non-habitat is indicated with 0) and habitat degradation degree. The model uses threat layer data to assess the degree of degradation of different land use types. This study defines urban land, rural residential areas, industrial and mining construction land and cultivated land as sources of habitat threats. In this study, it is assumed that the impact of the four threat sources linearly decays with the distance. The impact of threat factor r of grid x on the habitat of grid y is denoted as   i r x y and expressed as follows:
  i r x y = 1 ( d x y / d r   m a x )
If linear:
i r x y = e x p ( ( 2.99 / d r   m a x ) d x y )
If exponential:
Q x j = H j ( 1 ( D x j z ( D x j z + k z ) )
In the above equations (Equations (6)–(8)), r is the threat source of habitat, y is the grid in the threat source r, d x y is the linear distance between the grid x and y; d r   m a x is the maximum working distance of the threat r. H j is the habitat suitability of the ground class j; D x j is the habitat degradation degree of the grid x in the ground class j; k is the half-saturation constant, which is half of the maximum degree of degradation; z is the default parameter. The specific parameter settings of this study are shown in Table 1 and Table 2. Some parameters are set in the relevant literature and the InVEST user manuscript [31,32].
Cultural services are established under certain natural conditions and are a product that adapts to the natural environment. Cultural services generally refer to the nonmaterial benefits that humans obtain from the ecosystem [33,34]. The SoLVES (Social Values for Ecosystem Services) model is used to quantify cultural services, and is a typical representative model of cultural services evaluation. Cultural services, as the link between society and natural environment, can be effectively assessed to enhance the benefits of ecosystem services to humans [35]. The SoLVES model consists of a social value module for ecosystem service functions, a value mapping module and a value conversion mapping module. Each submodule is related to the others. By using the maximum entropy model and basic data, the final cultural service value map can be generated. The maximum entropy model is a model for measuring the geographical distribution of species based on its governing principle (Figure 2). The area with available data is transferred to the area where data are missing, based on the value conversion method to achieve quantitative assessment of the data for the entire region [36]. In this paper, five values of aesthetics, culture, history, entertainment and spirit are selected to evaluate the cultural services in the research area. The data used consist mainly of social survey questionnaires and environmental data, in which the environmental data include the altitude, slope, mountain shadow, distance from roads, distance from water bodies and type of land use, resulting in five value index maps. In the end, the final weight distribution and value index map of the research area are generated based on a score system of expert analysis. The contents of the questionnaire include entertainment, aesthetics, learning, cultural atmosphere, degree of economic development, degree of sustainable development, living environment and people’s well-being and so on. In order to ensure the scientific nature of the data, the questionnaire also includes a survey of people’s age, sex and education level, 836 questionnaires were sent out, including 783 valid ones.

2.3.4. OWA Algorithms

The multi-criterion decision-making method adopted in this study is aimed at sorting and optimizing the options through certain methods and existing information. The multi-criterion decision-making method based on the OWA operator is an important research aspect of this method. The OWA method is a decision-making method that can arbitrarily select the degree of importance between indicators, based on the decision risk coefficient. Risk can be understood as the possibility of making wrong decision, and it depends on the attitude of decision-makers. When the decision maker feels optimistic and willing to bear the greatest risk, the weight will be mainly assigned to the factors with high order in the decision-making process. When the decision maker feels pessimistic and can only bear the lowest risk, the weight will be mainly assigned to the factors with low order in the decision-making process in order to avoid the risk. When the risk attitude of decision-makers is unbiased, they will choose a more moderate decision-making scheme. After the OWA multi-criterion aggregation is weighted in two stages, namely, ordered weighting and standard weighting, a variety of decision-making schemes can be generated by changing the decision risk coefficient. The definition of the OWA operator is as follows:
O W A ( x i j ) = i n ω i s i j , ( ω i [ 0 , 1 ]   a n d   i n ω i = 1 , f o r   i   a n d   j = 1 , 2 , 3 , , n )
In Equation (9), x i j refers to a set of attribute values at the i t h position on the j t h normalized raster map,   S i j is a new five data sets obtained after the five ecosystem service raster maps corresponding to x i j , which have been standardized in descending order, w i is the ordered weight of the five new data sets ( S i j ).
In this paper, a standardized raster layer is selected for the four ecosystem services, namely, biodiversity, carbon sequestration, water yield and cultural services. Before the OWA sorting step, the data are all normalized to a range of 1 to 9.
In the process of risk assessment, the decision maker can make the order weight coefficient change continuously by adjusting the risk level, and obtain the appropriate evaluation results to meet the needs of the decision maker. The choice of risk range can be from 0 to any value, the range from 0 to 1 in our research. After setting different order weights, the calculation formulas for risks and trade-offs are as follows:
r i s k = ( n 1 ) 1 i n ( n i ) ω i           ( 0 r i s k 1 )
t r a d e o f f = 1 n i n ( ω i 1 n ) 2 n 1           ( 0 t r a d e o f f 1 )
In the Equations (10) and (11), n is the total number of ecosystem service raster layers, and w i is the weight of the i t h raster map. Theoretically, changing the level of risk and trade-off within the scope of the decision strategy can result in multiple scenarios, and the equilibrium degree of weight distribution controls the overall trade-off level between services. Decision risk in the OWA method refers not to the probability of decision-making errors, but to the decision maker’s attitude toward risk avoidance. The less risk decision makers want, the higher the weight given to negative indicators, and the lower the probability of risk. In contrast, when the risk is within acceptable limits, the corresponding weight will be lower. If decision makers assign the same weight to each ecosystem service, they are more likely to obtain the greatest trade-off of 1; that is, each ecosystem service is assigned a fully equal weight ( w i = 1/n). If the highest or lowest ecosystem services are assigned the maximum weight of 1, the decision makers will obtain the lowest trade-off of 0. The higher the risk value of the scenario, the higher the risk of losing ecosystem services. The higher the trade-off value of the scenario, the more equal the value of each service in the final result. Combining the specific concepts of risk and weight, the following formula can obtain the best ordered weight:
m a x i m i z e   t r a d e o f f = 1 n i n ( ω i 1 n ) 2 n 1                     ( 0 t r a d e o f f 1 )
  ω i [ 0 , 1 ]
i n ω i = 1 ,   i , j = 1 , 2 , 3 , , n .
The solution to these formulas ((Equations (12)–(14)) represents the maximum trade-off for a given level of risk. In this paper, the number of n is 4, which represents the four ecosystem service raster layers.
After comparing the protection efficiency of different ecosystem services under different scenarios, the expedient protection scenario is determined [37,38].
The formula for calculating protection efficiency is as follows:
E = E S ¯ c E S ¯ o
In Equation (15), E is the protection efficiency of a specific ecosystem service the in protected areas, and the weight of each service is assigned according to the ultimate contribution value of the ecosystem services to ecology [39]. The regulation, support, supply and cultural services account for 71.31 %, 19.01 %, 5.86 % and 3.81 % of the total ecosystem service value, respectively. In this paper, carbon sequestration, biodiversity, water production, and cultural services are assigned these weights as they are considered representatives of each type of service, and the ecosystem service value of the research area is obtained. E S ¯ c is the ecosystem service value of the protected area E S ¯ o is 5.106, which is the average service value of the ecosystem services throughout the study area.

3. Results

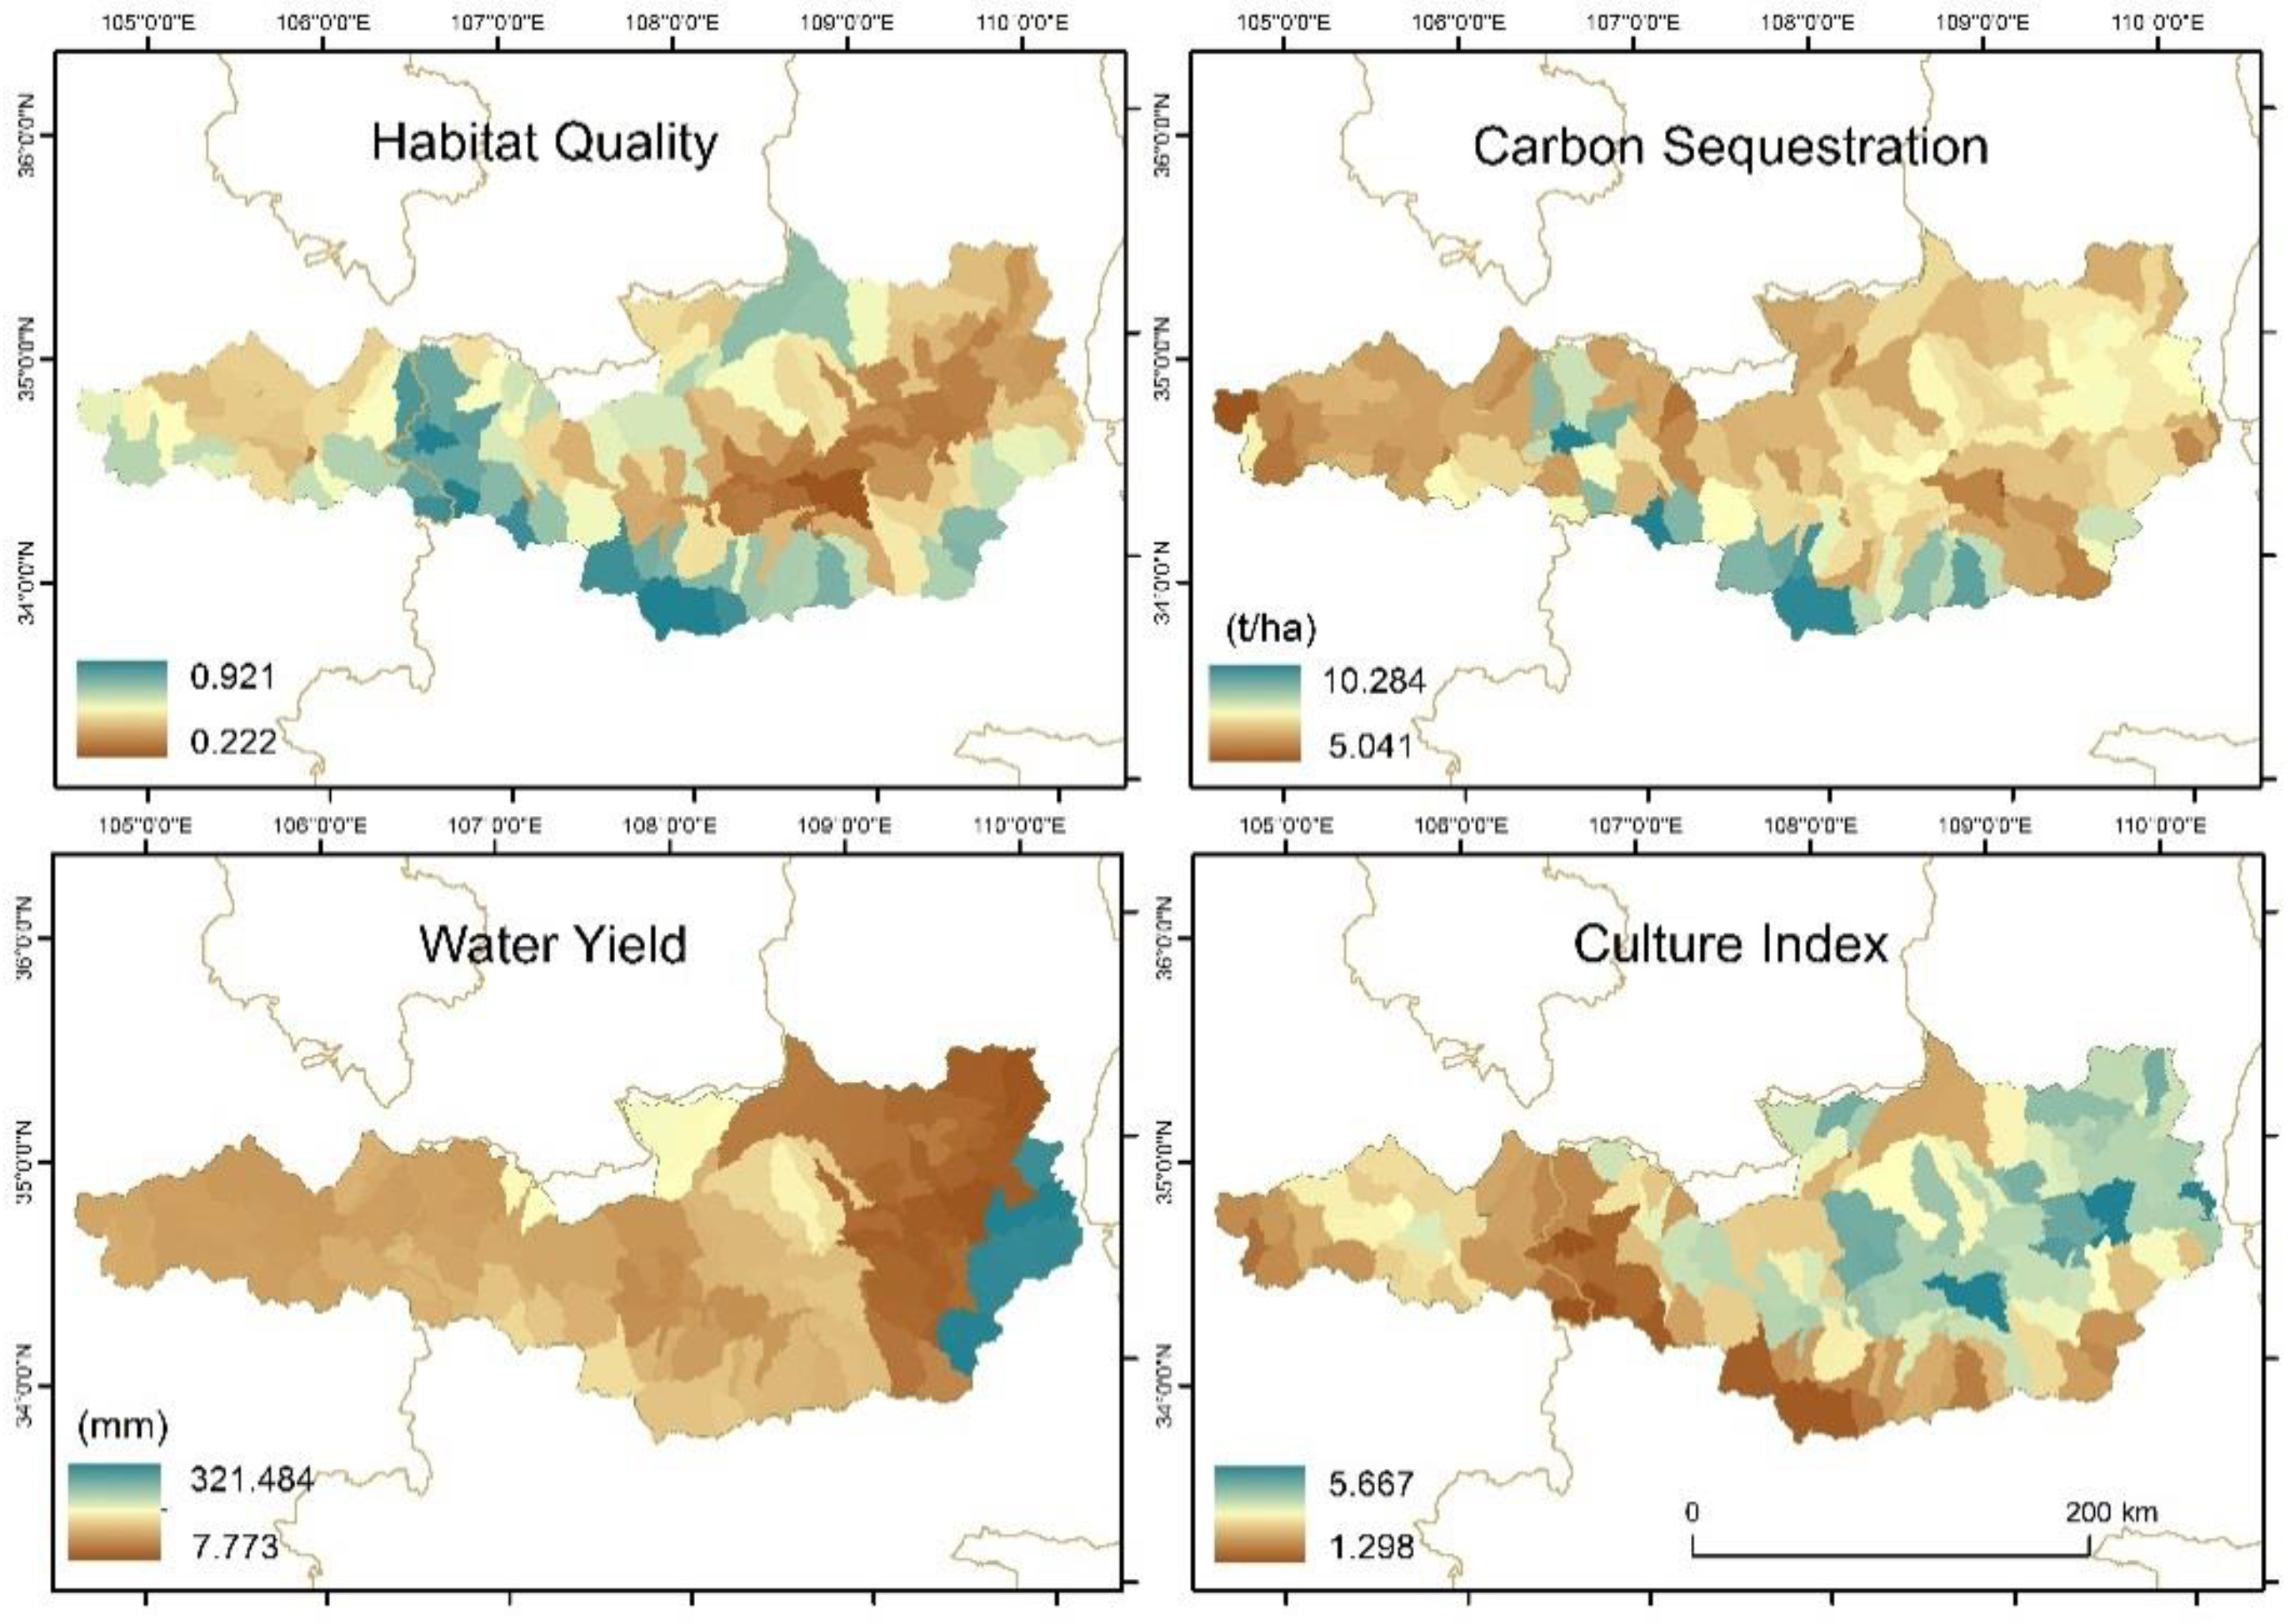
3.1. Ecosystem Service Evaluation

The SWAT (Soil and Water Assessment Tool) model adopted in this paper divides the Weihe River Basin (Guantian Section) into 157 subbasins according to the threshold of the minimum catchment area of the stator basin and specific conditions, such as the land use type and soil properties of the research area. Four types of ecosystem services, namely, carbon sequestration, water production, biodiversity and culture, are evaluated for the study area in 2015 (Figure 3) and analyzed at the subbasin scale.
The carbon storage module of the InVEST model evaluates the total carbon stock of the entire region by totaling the carbon stocks of each carbon bank. The changes in land use type and area size are the main factors affecting the carbon sequestration capacity, and the carbon density values and distribution characteristics of carbon sequestration tend to be consistent. In 2015, the carbon sequestration range in the subbasin of the research area was 55.3–114.3 t/ha. The subbasins with high values of carbon sequestration per unit area are mostly located in the Qinling mountainous areas, and their land use types are dominated by forests. The green vegetation cover area can make greater use of the ground and underground space to maximize its carbon sequestration capacity. The amount of carbon sequestration per unit area of farmland is low, but the total amount is relatively high because of the large area of farmland in the research area. The subbasin located in the Guanzhong Plain area is an urban agglomeration area. Its carbon sequestration is relatively low, and the minimum value is approximately 55.3 t/ha. The carbon storage in areas with dense construction land is very limited. The selection of areas with a relatively weak carbon sequestration capacity, such as low-covered grasslands, as target areas for urban expansion, and the implementation of policies such as the conversion from farmland to forest or grassland, which could increase carbon sequestration, will contribute to the maintenance and growth of carbon stocks in the study area. Regarding the water yield in the study area in 2015, we fit the actual monthly runoff and simulation values from 1992 to 1999. The correlation coefficient R2 is 0.70, and the E N S value is 0.67; the data from 2011 to 2015 are used for verification, and the correlation coefficient R2 is 0.90, and the E N S value is 0.66 (Figure 4).
The amount of water yield is an important reference indicator for ecosystem services. There are many factors affecting the amount of water yield, such as the vegetation, precipitation, climate, and topography. The study area is located in an arid and semiarid climate zone, and the increase in water yield will be conducive to the recharge of groundwater in the study area. The increased water yield can also provide an improved water environment for the ecosystem. The water yield in each subbasin of the Guanzhong-Tianshui Economic Zone is significantly different and ranges from 7.77 to 321.28 mm. From an overall point of view, the eastern part of the water production research area is the highest, while the central region is smaller than the western region and is combined with the administrative divisions of the research area. The habitat quality module of the InVEST model combines information on land use types and biodiversity threat factors to generate habitat quality maps, from which a preliminary assessment of the biodiversity can be made. The quality of habitats in the study area is notably different due to the differences in land use types. The distribution of threat factors and differences in the geographical types are key factors that affect the change in habitat quality. The farther the distance from the threat factor is, the higher the habitat quality score. The habitat quality score in the research area is between 0.14 and 0.94. The vegetation coverage in the Guanzhong Plain area is low, and there are more construction sites. Frequent human activities and urban development lead to dense threat factors, and therefore, the habitat quality is relatively low; the average value is approximately 0.22. The forest area in Qinling is relatively large and located far from any habitat threat factors. As a result, its average habitat quality score is high, which is approximately 0.92, and the degree of biological degradation is almost 0. The latter proves that the ecological suitability is high and that biodiversity is well maintained. According to calculations, the total cultural value index at the subbasin scale is between 1.3 and 5.7, and there are many scenic spots in the Qinling Mountains. The area is a popular destination for nearby residents to visit, and therefore its aesthetic value is considered to be high. Xi’an, Xianyang, Baoji, and Tianshui are historical cities and are rich in historical and cultural resources. People have a deep sense of identity because of the historical and cultural values of these cities. The urban areas are equipped with numerous entertainment facilities that can meet people’s daily entertainment activity needs. The area has a relatively high entertainment value; forest parks and similar places on the edge of cities are the main places for people to relax, and as such, the area has a high spiritual value. This paper synthesizes several cultural value indexes to obtain the final cultural value index. It can be seen from the spatial distribution map that, although the aesthetic value is not high in urban areas, the overall cultural value is the highest in terms of other factors.

3.2. Selection of the Priority Protected Areas

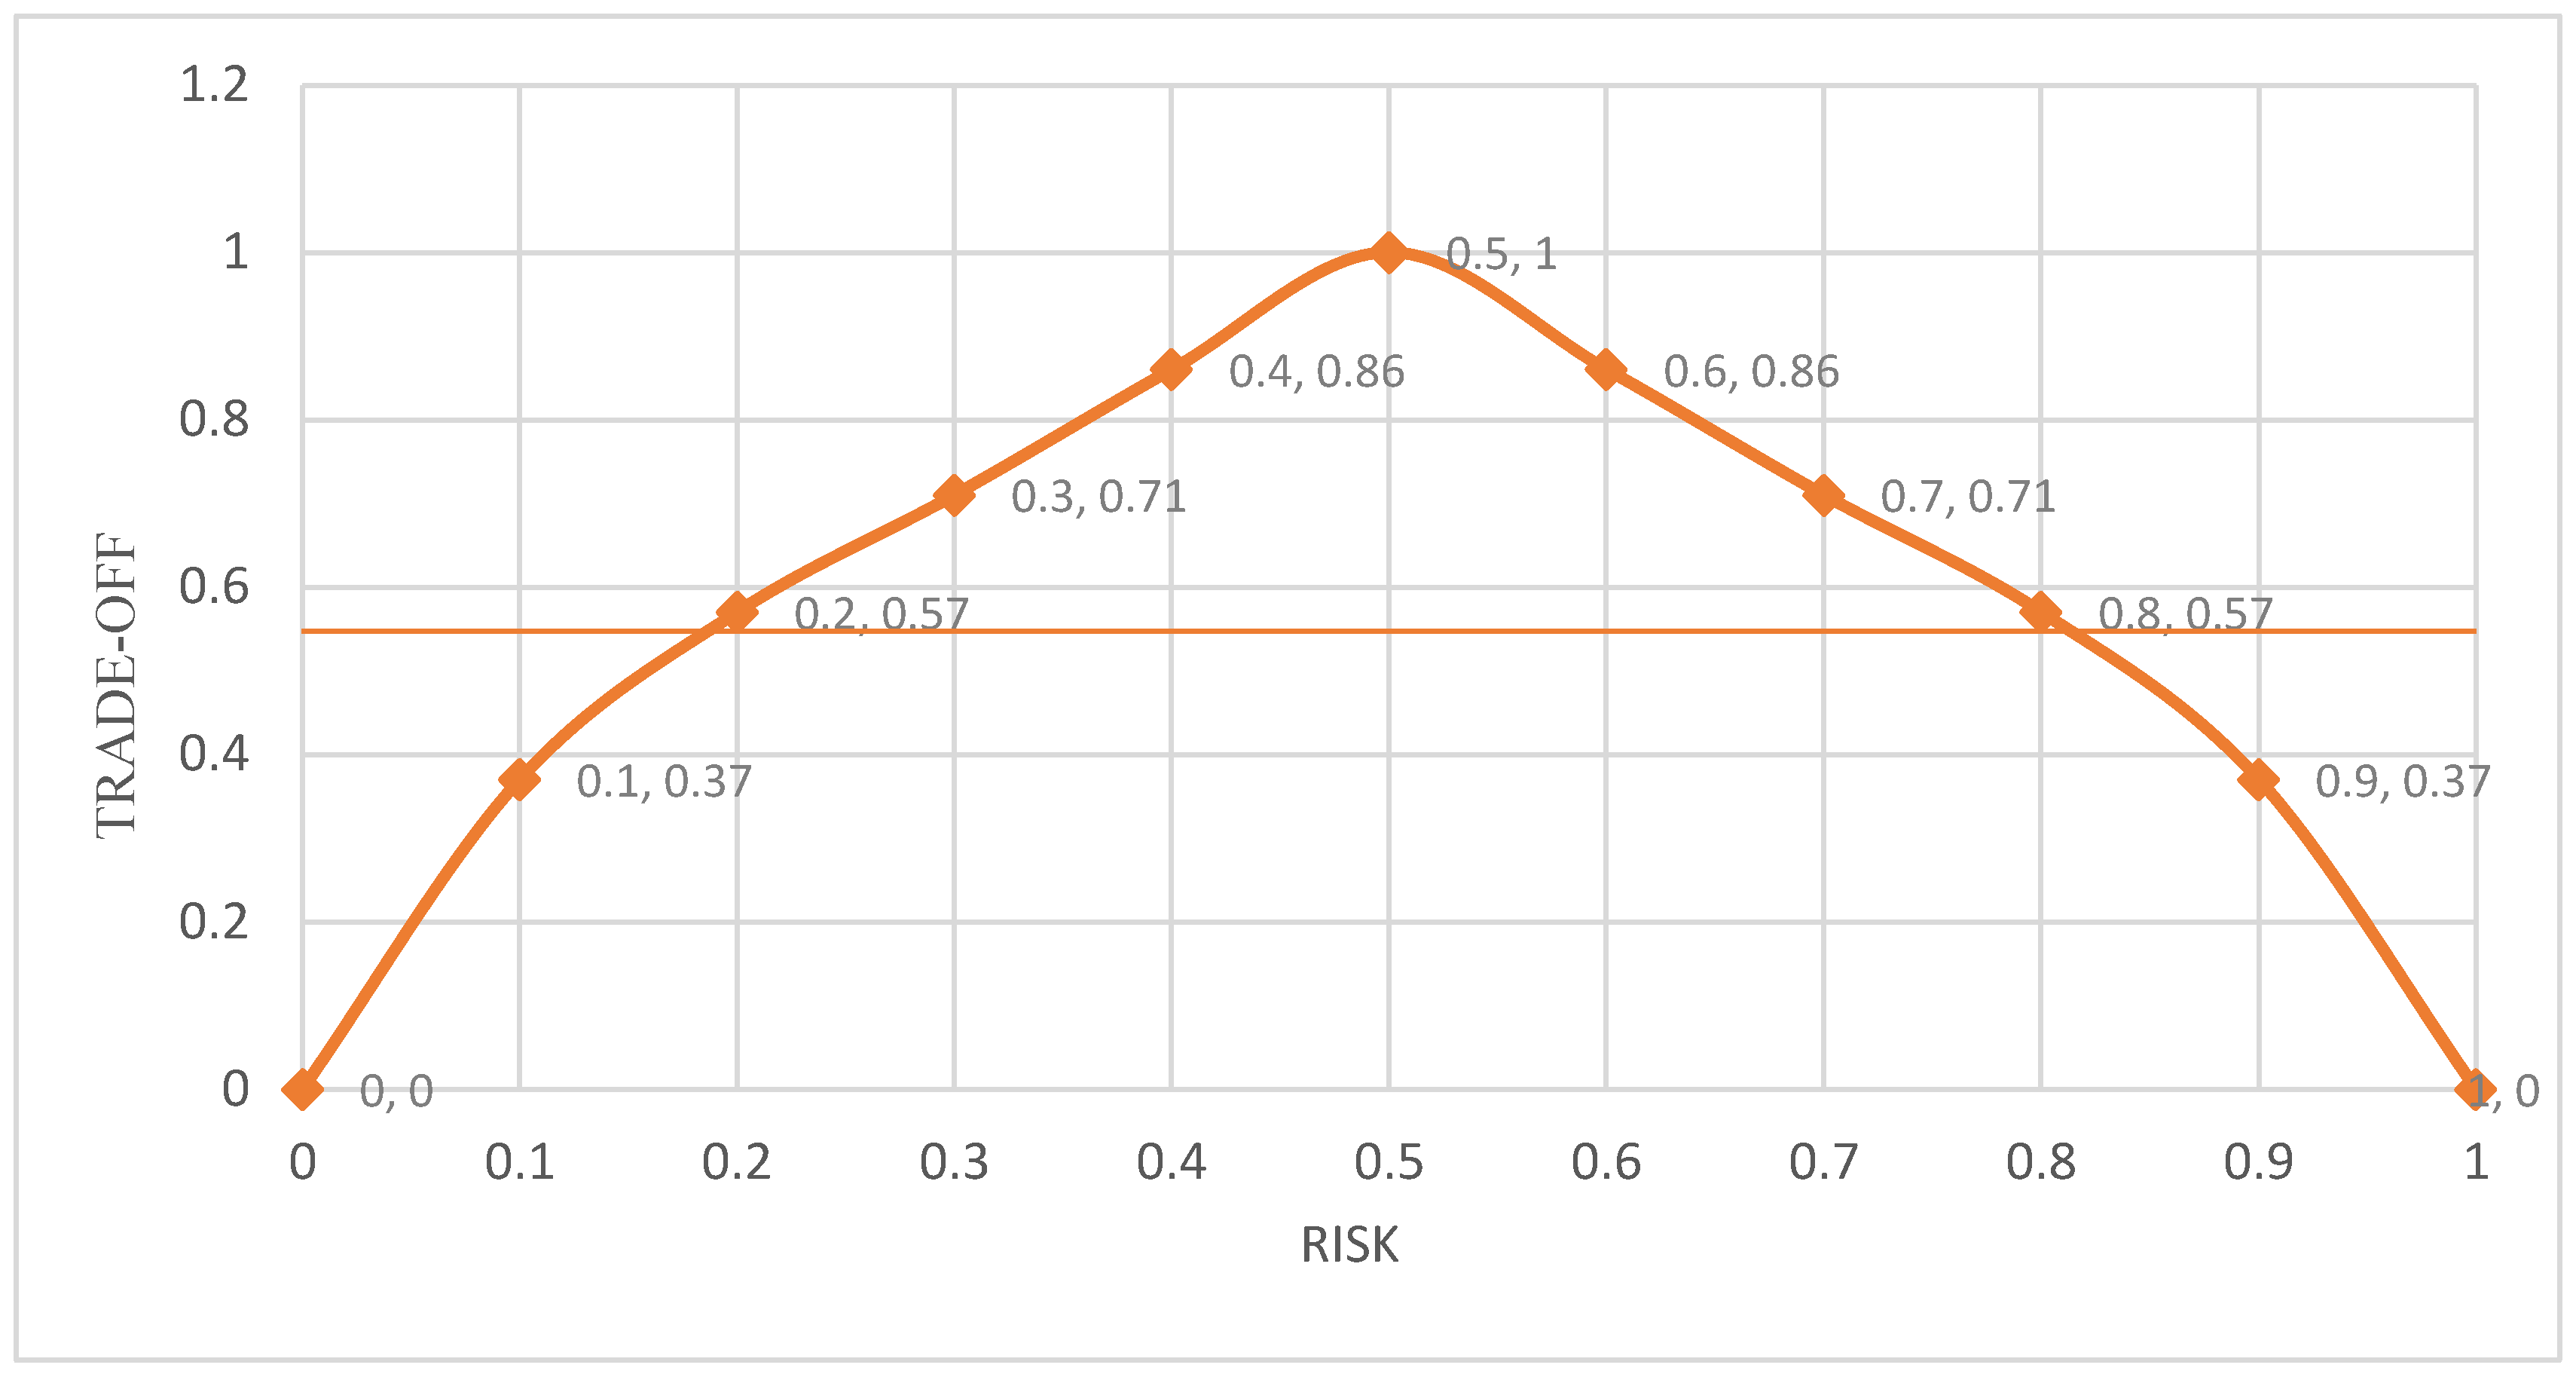
3.2.1. Risks and Trade-Offs of the OWA Operator

The OWA operator is used to select the priority areas. Within the 0–1 risk range, theoretically, any scenario can be established. Considering the actual research situation and difficulty of calculation, we select a step value of 0.1 to establish scenario intervals and 11 scenarios are accordingly defined. After calculating the expedient ordered weight (Table 1), the layers extracted by the OWA algorithm are w1–w4. The changes in risks and trade-offs are shown in Figure 5.
As shown in Figure 5, when the risk gradually increased from 0 to 1, the trade-off curve was close to a parabola. When the risk value was 0.5, the highest trade-off value of 1 was reached, and the two sides of the highest point were symmetrical. When the risk value increased from 0 to 0.5, the four ecosystem services were allocated weights based on the sorting order from the smallest to the maximum value. After having gradually reached equilibrium, a weight of 0.25 was assigned to each grid. When the risk increased from 0.5 to 1, the grid with the largest value after grid weight equalization was assigned a higher weight value.

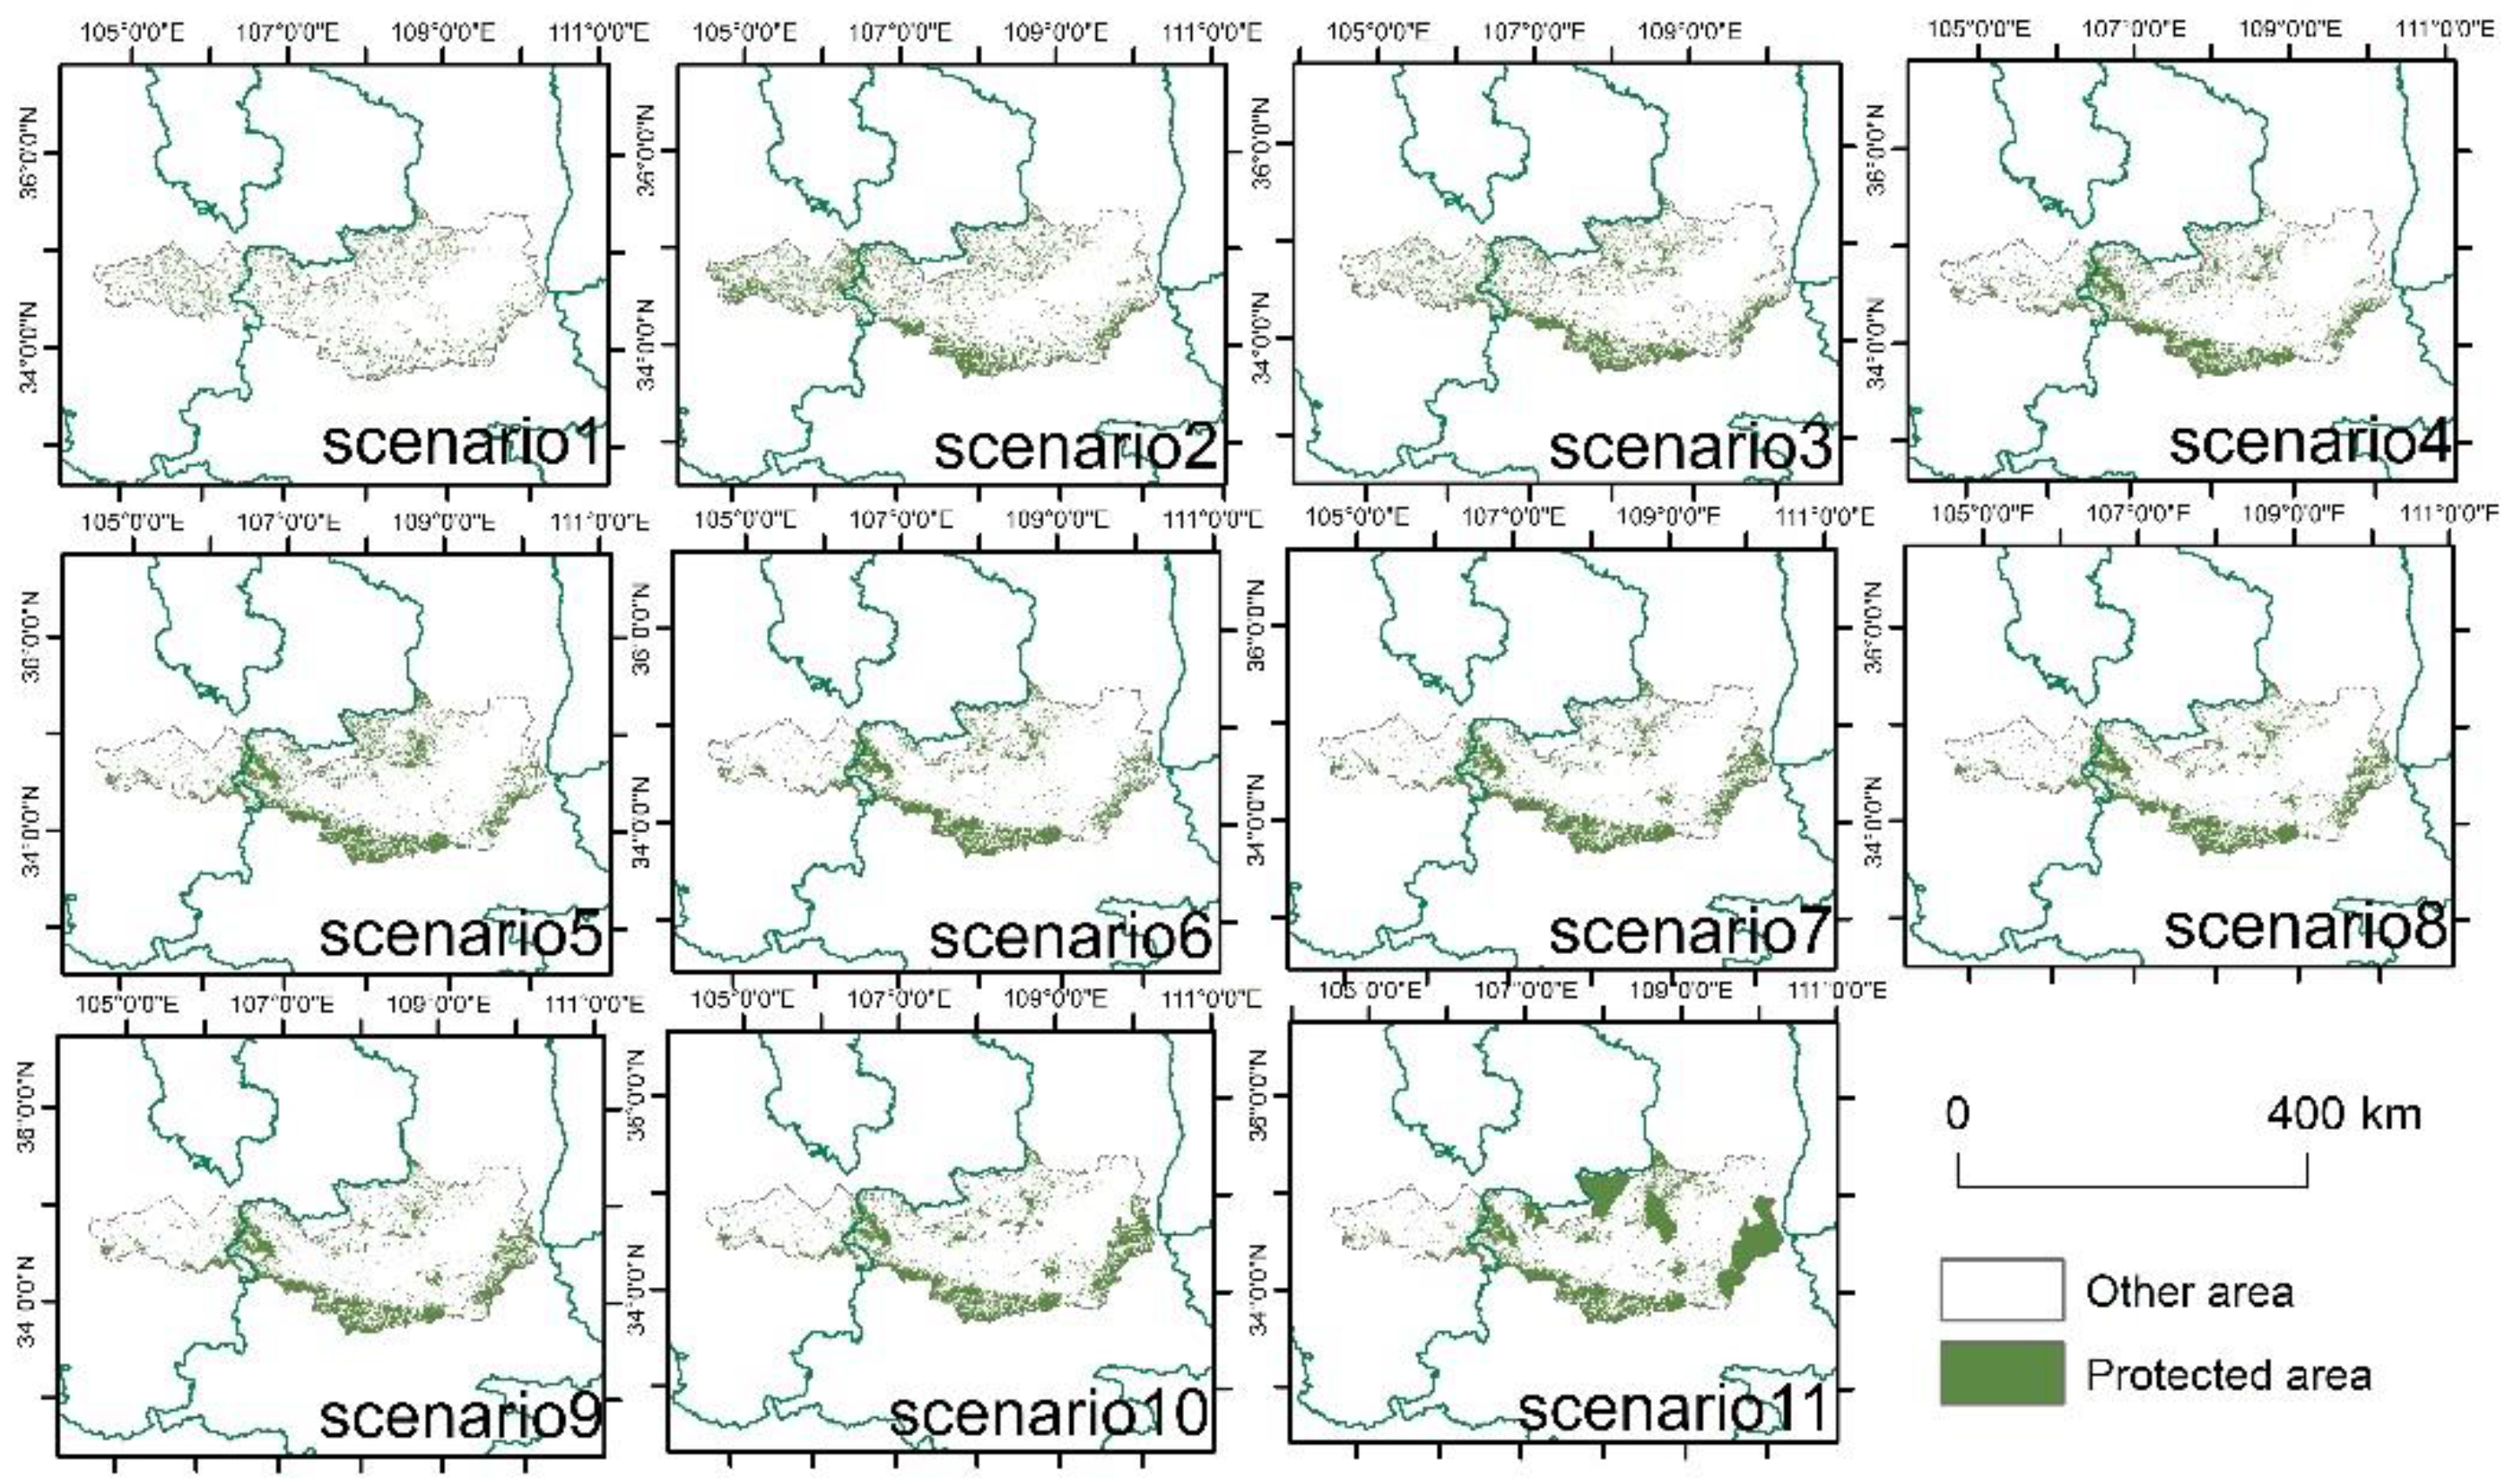
3.2.2. Protected Areas in Different Scenarios

By multiplying the four weights and corresponding ecosystem services in the 11 scenarios, the OWA-calculated grids could be obtained for each scenario. To protect the ecosystem services efficiently, we designated 20% of the area as a protected area in the Weihe River Basin (Guantian Section). The calculated protection grids are shown in Figure 6.

3.2.3. Efficiency of Protection

The calculated protection efficiency values are provided in Table 2. The risk factors can be used to characterize the bias in scenarios. In this study, when the risk factor was 0.5, this result indicated that the four types of ecosystem services were unbiased. The range of the selected expedient protected areas presented a dynamically changing trend with the risk. A risk factor of 0.5 guided the decision to balance the development of the four types of services selected in the study. According to the calculation results, scenario 6 had the highest protection efficiency, and scenario 6 had a corresponding risk factor of 0.5. In combination with the spatial distribution, the protected areas were mainly located in the south and mid-west of the research area. Considering the results of a previous study, the majority of the protected areas were areas with high carbon sequestration, which was related to the large contribution of carbon sequestration services as regulatory services to the overall value of ecosystem services. In addition, the distributions of high carbon sequestration and high habitat quality areas were similar, and it was observed that the high carbon sequestration areas were more conducive to the preservation of biodiversity. However, although forestland had a large carbon sequestration capacity, it also enhanced soil conservation. Its ability to intercept water flows had also increased accordingly, thus weakening its water-producing services. In the case of large urban areas, the cultural services were upgraded, but other services were reduced accordingly. Therefore, according to the comprehensive analysis of the calculation results, scenario 6 was selected as the best scenario. The areas of arable land, forestland, grassland, water area and urban area in scenario 6 (Table 3) were 561.15 km2, 8070.34 km2, 668.66 km2, 17.19 km2, and 11.16 km2, respectively.

4. Discussion

In the past, some scholars have studied the Weihe River Basin, but these studies have mostly focused on natural factors such as water yield and biodiversity. Based on the different scales, we are unable to directly compare these studies with our research data, but on the whole, the distribution of the results is consistent. With the improvement of material living standards, people’s demand for cultural services is also increasing, some scholars have begun to pay attention to the influence of human factors. However, human factors are difficult to quantify, so there is a lack of research on cultural services. We combined natural and human factors to conduct the research. The innovation of this study was its consideration of cultural services as part of the system of ecosystem services. The distribution of the cultural service index in the research results is in line with the human environment of the study area, for example, the aesthetic value of popular scenic tourism areas is relatively high, the historical value of some famous historical cities is higher and the entertainment value of urban areas is also relatively high. The Weihe River Basin is located in central China, straddling the east and the west, and straddling the north and south, and therefore, its strategic position is very significant. The ecosystems covered in this paper included biodiversity, carbon sequestration, water yield, and culture. Biodiversity is an important part of ecosystem services and has important statistical significance. In this study, the InVEST model was used to consider the impact of threat factors and threat distances on habitats. The spatial distribution of the biodiversity in the study area was quantified. In this study, a general algorithm was used, four kinds of carbon pools were calculated, the amount of water yield was calculated through the SWAT model, and the simulation and actual values were compared, lending the method greater credibility. Evaluation of the cultural services primarily relied on the questionnaire survey method, and even though the questionnaire method is controversial, the results could still provide references based on reliable sample data. In the future, additional cultural service information could be obtained by improving the content and methodology of questionnaire surveys.
Multi-criterion decision-making, also known as limited scheme multi-objective decision-making, refers to the decision-making problem of selecting the expedient alternative scheme or ranking the scheme under the consideration of multiple attributes. It is an important part of modern decision-making science.
Its theory and method are widely used in engineering, technology, economy, management, military and many other fields. However, the application of research in the field of ecology is very limited. This is another innovation that we are working on, and although there are some important discoveries revealed by our studies, there are also limitations. In the present study, four ecosystem services were selected, but additional ecosystem services could be considered in the future to optimize ecosystem services to a greater extent via the establishment of protected areas. With regards to evaluation of the ecosystem services, this study used the OWA decision-making method and a combination of GIS methods to calculate the corresponding weights through the determination of different risk values and classification of priority protected areas. Theoretically, within the range of risk values, multiple scenarios could be established. This study selected 11 scenarios due to time and computational considerations. Scenarios 1 and 11 were the extreme simulation scenarios. Scenario 1 contained the only element with the smallest risk attribute value (w4) and was assigned an ordered weight of 1. The other elements were assigned ordered weights of 0, which indicated that decision makers had adopted an extremely risk-averse attitude, that is, the shortsighted attitude of maintaining the barrel effect. As a result, the protection efficiency of this particular scenario was also the lowest, while scenario 11 was the opposite. The element with the highest risk attribute value (w1) was assigned an ordered weight of 1, and the other elements were assigned ordered weights of 0, indicating that policymakers were willing to bear the maximum risk of losing an ecosystem service; the protection efficiency of selecting this scenario was therefore relatively low. When the risk value was between 0 and 0.5 or between 0.5 and 1, the decision makers maintained a conservative-biased or risk-biased attitude toward the risk factor constraints, respectively. When the risk value was 0.5, the decision was more balanced. Scenario 6 represented the risk decision with the highest equilibrium value according to its protection efficiency. When the risk value of 0.4 or 0.6 is selected as the order weight, the results show that it is biased and the protection efficiency is relatively low, which does not meet the decision-making requirements of selecting protected areas. Therefore, this study considers that the risk value of 0.5 is the result of normal empowerment in different perspectives, including carbon sequestration service, water yield service, biodiversity and cultural service, which is a tradeoff value that meets the requirements of ecological protected area selection. In the study, only 11 scenarios were defined due to calculation and time considerations. On the other hand, different risk settings also reflect the tradeoffs between different ecosystem services. In the future, the risk can be investigated more thoroughly, and additional scenarios can be defined for the sake of analysis, thereby providing more persuasive research results.

5. Conclusions

In this paper, a new method is proposed to determine the selection of expedient protected areas. Illustrated by Weihe River Basin (Guantian Section), four different types of ecosystem services in the study area in 2015 are measured, and the OWA multi-criterion decision-making method is used to balance a variety of ecosystem services. The selection of expedient protected areas is carried out on the basis of comprehensive consideration of natural and human factors and the measurement of cultural services makes the research more complete. In this paper, 11 scenarios are set up by using OWA operator, which have good protection efficiency for the selected ecosystem services. The distribution of protected areas is relatively concentrated, most of which are located in the southern Qinling area, the junction of Tianshui City and Baoji City, the eastern part of Weinan City. A small proportion of protected areas are also distributed in Xianyang City, Tongchuan City and Xi’an City, the least of which is in the western part of Tianshui City. Scenario 6 has the highest protection efficiency, which is 1.499. Therefore, the expedient protected area is set as the protected area of scenario 6 in this paper. The establishment of protected areas can provide considerable ecological well-being for the residents of the study area. In order to maximize the benefit of the protected area, it is necessary to protect the forest land types of the protected area and the suburbs of the city where cultural services can be provided, and reasonably limit the rapid expansion of the city.

Author Contributions

Conceptualization, Y.Z. and J.L.; methodology, Y.Z.; software, Y.Z. and J.L.; validation, Y.Z.; formal analysis, Y.Z.; investigation, Y.Z.; resources, Y.Z.; data curation, Y.Z.; writing—original draft preparation, Y.Z.; writing—review and editing, J.L. and Z.Z.; visualization, J.L. and Z.Z.; supervision, J.L. and Z.Z.; project administration, J.L. and Z.Z.; funding acquisition, J.L. and Z.Z.

Funding

This research was funded by the National Natural Science Foundation of China (No. 41771198 and 41771576), the Fundamental Research Funds for the Central Universities (No.GK201901009), the NSFC-NRF Scientific Cooperation Program (Grant no. 41811540400), and the project supported by the Natural Science Basic Research Plan in Shaanxi Province of China (Program No. 2018JM4010).

Conflicts of Interest

The authors declare no conflict of interest.

References

  1. Fisher, B.; Turner, R.K.; Morling, P. Defining and classifying ecosystem services for decision making. Ecol. Econ. 2009, 68, 643–653. [Google Scholar] [CrossRef] [Green Version]
  2. Sánchezcanales, M.; Benito, A.L.; Passuello, A.; Terrado, M.; Ziv, G.; Acuna, V.; Schuhmacher, M.; Elorza, F.J. Sensitivity analysis of ecosystem service valuation in a Mediterranean watershed. Sci. Total Environ. 2012, 440, 140–153. [Google Scholar] [CrossRef] [PubMed]
  3. Worm, B.; Barbier, E.B.; Beaumont, N.; Duffy, J.E.; Folke, C.; Halpern, B.S.; Jackson, J.B.C.; Lotze, H.K.; Micheli, F.; Palumbi, S.R.; et al. Impacts of Biodiversity Loss on Ocean Ecosystem Services. Science 2006, 314, 787–790. [Google Scholar] [CrossRef] [PubMed] [Green Version]
  4. Chisholm, R.A. Trade-offs between ecosystem services: Water and carbon in a biodiversity hotspot. Ecol. Econ. 2010, 69, 1973–1987. [Google Scholar] [CrossRef]
  5. Posthumus, H.; Rouquette, J.R.; Morris, J.; Gowing, D.J.G.; Hess, T.M. A framework for the assessment of ecosystem goods and services; a case study on lowland floodplains in England. Ecol. Econ. 2010, 69, 1510–1523. [Google Scholar] [CrossRef]
  6. Rudolf, G.; Johan, V.D.P.; Anna, C.; Sophie, M. Ecological Functions and Socioeconomic Values of Critical Natural Capital as a Measure for Ecological Integrity and Environmental Health; Springer: Berlin, Germany, 2009; pp. 191–214. [Google Scholar]
  7. Li, S.C.; Zhang, C.Y.; Liu, J.L.; Zhu, W.B.; Ma, C.; Wang, J. The tradeoffs and synergies of ecosystem services: Research progress, development trend, and themes of geography. Geog. Res. 2013, 32, 1379–1390. [Google Scholar]
  8. Fu, B.J.; Yu, D.D. Trade-off analyses and synthetic integrated method of multiple ecosystem services. Resour. Sci. 2016, 38, 1–9. [Google Scholar]
  9. Zhang, Y.; Lin, Z.; Liu, J.Y.; Liu, Y.L.; Li, C.S. The Impact of Land Cover Change on Ecosystem Service Values in Urban Agglomerations along the Coast of the Bohai Rim, China. Sustainability 2015, 7, 10365–10387. [Google Scholar] [CrossRef] [Green Version]
  10. Tirutabarna, L.; Arbault, D.; Rivière, M.; Rugani, B.; Benetto, E. Integrated earth system dynamic modeling for life cycle impact assessment of ecosystem services. Sci. Total Environ. 2014, 472, 262–272. [Google Scholar]
  11. Nahuelhual, L.; Carmona, A.; Laterra, P.; Barrena, J.; Aguayo, M. A mapping approach to assess intangible cultural ecosystem services: The case of agriculture heritage in Southern Chile. Ecol. Indic. 2014, 40, 90–101. [Google Scholar] [CrossRef]
  12. Pröpper, M.; Haupts, F. The culturality of ecosystem services. Emphasizing process and transformation. Ecol. Econ. 2014, 108, 28–35. [Google Scholar] [CrossRef]
  13. Darvill, R.; Lindo, Z. The inclusion of stakeholders and cultural ecosystem services in land management trade-off decisions using an ecosystem services approach. Landsc. Ecol. 2016, 31, 1–13. [Google Scholar] [CrossRef]
  14. Iniesta-Arandia, I.; García-Llorente, M.; Aguilera, P.A.; Montes, C.; Martín, L. Socio-cultural valuation of ecosystem services: uncovering the links between values, drivers of change, and human well-being. Ecol. Econ. 2014, 108, 36–48. [Google Scholar] [CrossRef]
  15. Mary, P.; Steven, A.G.; Christopher, L.; Anthea, F.; Derek, F. Managing cultural ecosystem services. Ecosyst. Serv. 2014, 8, 141–147. [Google Scholar]
  16. Zhu, Q.J.; You-Po, S.U.; Chen, J. Suitability evaluation of residential area for disaster prevention with GIS-based OWA method. Geog. Res. 2009, 28, 1–9. [Google Scholar]
  17. Yager, R.R. Prioritized OWA aggregation. Fuzzy Optim. Decis. Mak. 2009, 8, 245–262. [Google Scholar] [CrossRef]
  18. Watson, J.E.M.; Dudley, N.; Segan, D.B.; Hockings, M. The performance and potential of protected areas. Nature 2014, 515, 67–73. [Google Scholar] [CrossRef] [PubMed]
  19. Liu, P.; Jiang, S.W.; Zhao, L.J.; Li, Y.X.; Zhang, P.P.; Zhang, L. What are the benefits of strictly protected nature reserves? Rapid assessment of ecosystem service values in Wanglang Nature Reserve, China. Ecosyst. Serv. 2017, 26, 70–78. [Google Scholar] [CrossRef]
  20. Eastwood, A.; Brooker, R.; Irvine, R.J.; Artz, R.R.E.; Norton, L.R.; Bullock, J.M.; Ross, L.; Fielding, D.; Ramsay, S.; Roberts, J.; et al. Does nature conservation enhance ecosystem services delivery? Ecosyst. Serv. 2016, 17, 152–162. [Google Scholar] [CrossRef] [Green Version]
  21. Hummel, C.; Provenzale, A.; Van, D.M.J.; Wijnhoven, S.; Nolte, A.; Poursanidis, D.; Janss, G.; Jurek, M.; Andresen, M.; Poulin, B.; et al. Ecosystem services in European protected areas: Ambiguity in the views of scientists and managers? PLoS ONE 2017, 12, e0187143. [Google Scholar] [CrossRef]
  22. Li, J.; Ren, Z.Y. Changes in Ecosystem Service Values on the Loess Plateau in Northern Shaanxi Province, China. Agric. Sci. China 2008, 7, 606–614. [Google Scholar] [CrossRef]
  23. Tscharntke, T.; Klein, A.M.; Kruess, A.; Ingolf, S.D.; Thies, C. Landscape perspectives on agricultural intensification and biodiversity–ecosystem service management. Ecol. Lett. 2010, 8, 857–874. [Google Scholar] [CrossRef]
  24. Li, J.; Li, H.Y.; Zhang, L. Ecosystem service trade-offs and in the Guanzhong-Tianshui economic of China. Acta Ecol. Sin. 2016, 36, 1–10. [Google Scholar]
  25. Yang, X.N.; Li, J.; Qin, K.Y.; Li, T.; Liu, J.Y. Trade-offs between ecosystem services in Guanzhong-Tianshui economic region. Acta Geogr. Sin. 2015, 70, 1762–1773. [Google Scholar]
  26. Wu, R.; Liu, G.H.; Wen, Y.H. Spatialtemporal variations of water yield and water quality purification service functions in Guanting Reservoir Basin based on InVEST model. Res. Environ. Sci. 2017, 30, 406–414. [Google Scholar]
  27. Chen, D.S.; Li, J.; Yang, X.N. Trade-offs and optimization among ecosystem services in the Weihe River basin. Acta Ecol. Sin. 2018, 38, 3260–3271. [Google Scholar]
  28. Fang, J.Y.; Guo, Z.D.; Piao, S.L.; Chen, A.P. Estimation on terrestrial vegetation carbon sinks in China from 1981 to 2000. Sci. China Ser. D 2007, 37, 804–812. [Google Scholar]
  29. Li, T.; Li, J.; Wang, Y.Z.; Zeng, L. The spatial flow and pattern optimization of carbon sequestration ecosystem service in Guanzhong-Tianshui Economical Region. Sci. Agric. Sin. 2017, 50, 3953–3969. [Google Scholar]
  30. Han, J.R. The Impact of Urban Sprawl on Carbon Stocks Based on the InVEST Model; Northeast Normal University: Changchun, China, 2013; Available online: http://cdmd.cnki.com.cn/Article/CDMD-10200-1013363008.htm (accessed on 8 October 2019).
  31. Zhang, J.; Liao, T.J.; Huang, J.L.; Zhou, L. Research of Habitat Quality in Wanzhou District. Hunan Agric. Sci. 2017, 1, 45–50. [Google Scholar]
  32. Bao, Y.B.; Liu, K.; Li, T.; Hu, S. Effects of land use change on habitat based on InVEST model: Taking yellow river wetland nature reserve in Shaanxi provinceas an example. Arid Zone Res. 2015, 32, 622–629. [Google Scholar]
  33. Bert, R. Book Review: Ecosystems and Human Well-Being: A Framework for Assessment Edited by Elena Bennett et al. Washington, D.C.: Island Press, 2003; Civil Engineering—ASCE: Reston, DC, USA, 2004; Available online: https://cedb.asce.org/CEDBsearch/record.jsp?dockey=0139805 (accessed on 8 October 2019).
  34. Martin, C.L.; Momtaz, S.; Gaston, T.; Moltschaniwskyj, N.A. A systematic quantitative review of coastal and marine cultural ecosystem services: Current status and future research. Mar. Policy 2016, 74, 25–32. [Google Scholar] [CrossRef]
  35. Bjørn, P.K.; John, D.C.L.; Erik, G.B.; Lindhjem, H.; Thomassen, J.; Chan, K.M. Ecosystem Services and Cultural Values as Building Blocks for ‘The Good life’. A Case Study in the Community of Røst, Lofoten Islands, Norway. Ecol. Econ. 2017, 140, 166–176. [Google Scholar]
  36. Zhao, Q.Q.; Li, J.; Liu, J.Y.; Qin, K.Y.; Tian, T. Assessment and analysis of social values of cultural ecosystem services based on the SolVES model in the Guanzhong-Tianshui Economic Region. Acta Ecol. Sin. 2018, 38, 3673–3681. [Google Scholar]
  37. Zhang, Y.L.; Hu, Z.J.; Qi, W.; Wu, X.; Bai, W.Q.; Li, L.H.; Ding, M.J.; Liu, L.S.; Wang, Z.F.; Zheng, D. Assessment of protection effectiveness of nature reserves on the Tibetan Plateau based on net primary production and the large-sample-comparison method. J. Geogr. Sci. 2016, 26, 27–44. [Google Scholar] [CrossRef]
  38. Zhang, L.W.; Fu, B.J.; Lü, Y.H. The using of composite indicators to assess the conservational effectiveness of ecosystem services in China. Acta Geogr. Sin. 2016, 71, 768–780. [Google Scholar]
  39. Xie, G.D.; Zhang, C.X.; Zhang, C.S.; Xiao, Y.; Lu, C.X. The value of ecosystem servicesin China. Res. Sci. 2015, 37, 1740–1746. [Google Scholar]
Figure 1. Basic information map of study area.
Sustainability 11 05599 g001
Figure 2. The application process of maximum entropy model.
Sustainability 11 05599 g002
Figure 3. The spatial distribution of the water yield, carbon sequestration, biodiversity and culture in 2015.
Sustainability 11 05599 g003
Figure 4. The calibration and validation period of runoff.
Sustainability 11 05599 g004
Figure 5. The relationship between tradeoff and risk.
Sustainability 11 05599 g005
Figure 6. The priority area under different scenarios.
Sustainability 11 05599 g006
Table 1. Protection efficiency of different scenarios.
Services Value of Protected AreaEfficiency of Protection
Scenario 15.5021.078
Scenario 25.9221.160
Scenario 36.7021.313
Scenario 47.2751.425
Scenario 57.3021.430
Scenario 67.6551.499
Scenario 77.5431.477
Scenario 87.5931.487
Scenario 97.6051.489
Scenario 107.4151.452
Scenario 116.6011.293
Table 2. The risk and tradeoff under different scenarios.
ScenarioRiskTrade-offw1w2w3w4
1000001
20.10.370.0110.0430.1820.764
30.20.570.0450.1060.2520.596
40.30.710.0980.1650.2760.461
50.40.860.1670.2130.2720.347
60.510.250.250.250.25
70.60.860.3470.2720.2130.167
80.70.710.4610.2760.1650.098
90.80.570.5960.2520.1060.045
100.90.370.7640.1820.0430.011
11101000
Table 3. The area of land use type under different scenarios.
Unit: km2Arable LandForest LandGrassland Water AreaUrban AreaUnclassified Land
Scenario 1435.6991976.3273262.3074.603512.07980.765
Scenario 2538.29094654.3985696.0136.422415.42781.7802
Scenario 3453.4296150.7673262.7255.217313.16521.3986
Scenario 4323.18017385.6711909.084.55949.96211.2528
Scenario 51019.5268192.4381407.23117.147715.70681.2717
Scenario 6561.14828070.34668.659517.787611.161.1817
Scenario 7972.14768354.525438.071429.2968177.82021.2015
Scenario 8963.15848390.232288.145834.443177.53581.1646
Scenario 9889.72388446.486295.680640.023176.94631.1727
Scenario 101247.0088663.555428.144465.7837260.61751.9638
Scenario 113579.9659382.711822.757215.7966529.603247.9349

