Abstract
Sustainability is a complex concept. It only can be achieved from a global perspective, where social, economic and environmental issues are all key factors for achieving the goal. This paper is focused on the importance of social sustainability and, as a consequence, the importance of avoiding each and everyone’s risk of poverty and exclusion as due to the recent crisis effects. Nevertheless, this crisis resulted in higher inequalities and put a lot of people at risk of poverty, even in “developed” countries. Through a statistical and econometric analysis, some of the key factors to which the European Union should aim to avoid unsustainable scenarios are analysed. A regression, factorial and cluster analysis is carried out and this leads to conclude that the labour market is key in promoting economic policies in order to achieve social sustainability.
1. Introduction
Brundtland Report— “Our Common Future” [1] is a starting point for most current discussions on the concept of sustainable development; this report “constituted a major political turning point for the concept of sustainable development” [2]. The risk of poverty and exclusion is not compatible with social sustainability. Only in the Euro-Zone (one of the most developed in the world) were there more than 75,000 people (77,832 for Euro-Zone, 19 and 76,382 for Euro-Zone 17) at risk of exclusion and 122,176 people in the European Union (28 countries), which is almost one fourth of the total population (24.4%) [3]. In some countries, like Romania, it affects 39.5% of the total population (2014), down from 45.9% in 2007 (the year Romania joined the EU). This decreasing trend could be directly related to joining the European Union. In the Euro-Zone, the situation was not substantially different (see Figure 1). The scores of this variable are lower than for the whole EU and the trend has been maintained since 2009. Some authors believe that the social exclusion has its origin in the excluded group. For example, referring to the risk of exclusion of the youth as a group, they talk of young people as a discrepancy between individuals and society, meaning that sometimes society focuses on the youth as the only ones responsible for their own situation of exclusion when this is not the right focus [4]. In fact, they suggest that there is a “social problem” that should be solved as a common issue of all individuals. The overview analysis of this issue must take into account the fact that the economic crisis has had a different performance in the member states belonging to the Euro Area compared to the others and that this issue could have some impact on the population risk of poverty and social exclusion. As the end of the crisis would have begun and new economic indicators would have arisen (becoming less dissimilar for both group of countries), we have decided not to introduce the last years, since the main goal of our paper is focused on the effect of the recent crisis on the risk of poverty during this period.
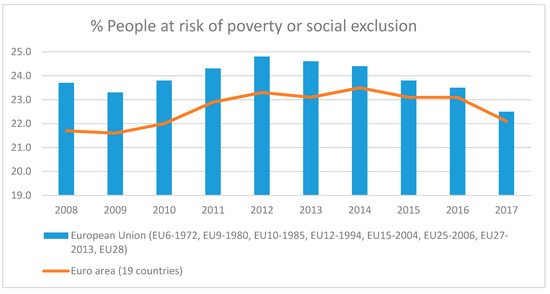
Figure 1.
% of people at risk of exclusion. Source: Author’s own from EUROSTAT data (ilc_peps01) (http://appsso.eurostat.ec.europa.eu/nui/show.do?lang=en&dataset=ilc_peps01).
Social sustainability partly relies on general welfare but the first step to achieving this goal would be getting a decent job with wages substantial enough to avoid falling into the risk of poverty (ROP) [5]. Social inclusion is closely linked to employment, so employment policies are a key factor for achieving an inclusive society [6]. In this paper, social exclusion is understood as a situation in which individuals are deprived of full participation in the society in which they live. This involuntary lack of participation can have its origin in multiple and diverse factors. This approach is adopted in line with the generic nature of the study, where the problem is addressed as an overview. The risk of exclusion is understandable in view of the fact that situations of vulnerability can lead to social exclusion. We have used the EUROSTAT approach [7]
In this paper, we have focused on the social areas of the risk of poverty, risk of social exclusion, households with low intensity of work, income (purchasing power standard, PPS), involuntary part time employment and expenses on social protection [8]. This last variable is the only one related to the direct action of public policies, by means of helping people to face their poor situations. The social protection is, then, an important issue for policy makers involved in constructing a sustainable society [9]. In this paper, we have dealt with the expenditure on social protection, including social benefits, which are “transfers, in cash or in kind, to households and individuals to relieve them of the burden of a defined set of risks or needs; administration costs, which represent the costs charged to the scheme for its management and administration; other expenditure, which consists of miscellaneous expenditure by social protection schemes (payment of property income and other)” 4]. In EUROSTAT, data is calculated using current prices. Relative measures were used, giving per-capita values. It is well known that the economic crisis affects economy and the restrictive policies, related to “anti-crisis” measures, which also affects social sustainability, so two out of three pillars of sustainability (at least) are affected. The novelty and originality of this paper relies on providing an overview of the current poverty and risk of exclusion using several methodological approaches, with the aim of giving a general framework of the situation in the European Union.
2. Who Pays for the Crisis: Groups at Risk of Exclusion and Risk of Poverty
The economic crisis was qualified as the worst of the contemporaneity [10,11,12] but it has hit different groups differently. Inequality and poverty emerged even in the most developed countries in the European Union. This has happened to countries rescued by the EU, such as Portugal or Greece, the latter being the best known case. One of the most relevant economic reasons for explaining this situation is that both belong to a single monetary area (with only one currency) and did not allow these countries to use monetary policy to cope with the crisis. This was one of the reasons, among others, for those who have been so hard hit by the crisis?
2.1. Poverty
There is a broad consensus in literature that once people are at ROP, it is difficult to get out of it [13,14,15,16,17,18]. That is why first of all we wanted to test this hypothesis:
Hypothesis 1 (H1).
There is no relation between Risk of Poverty at period t and Risk of Poverty at period t-1.
At-risk-of-poverty rate by poverty threshold (%) was the measure taken from the EUROSTAT database for this item. It came from the EUROSTAT database [19].
2.2. Risk of Exclusion
Social inclusion is one of the sustainable development goals (the first one being “no poverty”). It was also one of the goals of the Europe 2020 strategy, particularly through the reduction of poverty, because the proposed goal is getting out of poverty, risk of poverty and social exclusion (abbreviated in EUROSTAT as AROPE) more than 20 million people out of the risk of poverty and social exclusion [2]. The European Union Statistics Office explains that: “This indicator corresponds to the sum of persons who are: at risk of poverty or severely materially deprived or living in households with very low work intensity.” To avoid double count, they are only taken into account once if they are only in one or more indicators. The items are related to income (the threshold is set at 60% of equivalent national income, after social transfers). Material deprivation (considered serious for people who are restricted in at least 4 items from a list of 9), considering several factors: (i) a level of income or public services; (ii) an adequate family environment; (iii) being able to pay unexpected expenses; (iv) Eat some healthy meals over a period of time; (v) Have some holidays absent; (vi–ix) Have some electronic devices or home appliances. The very low intensity of work (for people under 59) are considered when they have worked less than a fifth of their desired potential time on the former year. [20] The equivalised disposable income is the total income of a household, once tax and other deductions are subtracted, as it is the real income to expend or save; then it is necessary to know the amount corresponding to a single individual; but each person is not weighted the same in dividing the income (because it is supposed that adults do not have the same expense necessities as children, for instance) and the equalized members are calculated in terms of adults, by means of the modified OECD equivalence scale, a formula is applied to homogenize and get the equivalent number of equalized adults for each household; then, the income can be divided by the household equalized members and that is why the income is divided by the number of people living in the same household converted into equalised adults [21,22,23].
The risk of poverty has to do with income and one specific poverty threshold. The risk of exclusion increased in the years following the beginning of the crisis. In Figure 2 the following years show positive values, which means that the rate is increasing.
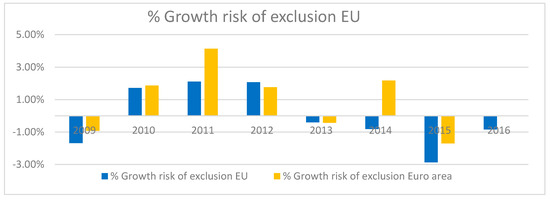
Figure 2.
Growth rate of the risk of exclusion in Europe. Source: authors own from EUROSTAT data. Calculated from % of people at risk of exclusion (Euro area (EA11-2000, EA12-2006, EA13-2007, EA15-2008, EA16-2010, EA17-2013, EA18-2014, EA19). People at risk of poverty or social exclusion by age and sex [ilc_peps01] [19].
Data show a positive relation among both risk: poverty and exclusion, as it is shown in Figure 3.
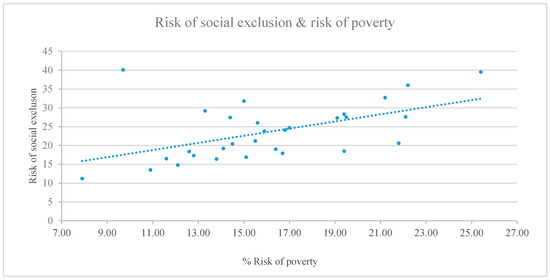
Figure 3.
Relation between “Risk of social exclusion” and “% Risk of poverty”. Source: authors own from EUROSTAT data. At-risk-of-poverty rate by poverty threshold, age and sex (source: SILC) [ilc_li02] statistics (http://appsso.eurostat.ec.europa.eu/nui/show.do?dataset=ilc_li02). People at risk of poverty or social exclusion by age and sex [ilc_peps01] [19].
There are several ways of entering the labour market. Not all of them mean that? workers are in their desired employment. Low quality employment or undesired part time contracts are some of the frequent situations, which are difficult to appreciate in statistics, since the people involved in this kind of jobs appear to be employed but they continue searching for better opportunities [24]. The importance of employment for being integrated into society and avoid risk of exclusion and poverty has been recognized as a fundamental issue [25,26,27,28].
We can see the involuntary part-time employment as a percentage of the total part-time employment for the people between 15 and 64 years in the period 2006–2015 in Figure 4. The data for this item were collected from EUROSTAT database, specifically from “Involuntary part-time employment as percentage of the total part-time employment, by sex and age (%) [lfsa_eppgai].”
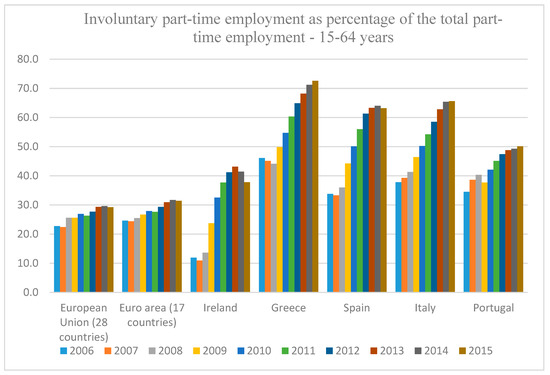
Figure 4.
Involuntary part-time employment—2006–2015. Source: authors own from EUROSTAT data. Involuntary part-time employment as percentage of the total part-time employment, by sex and age (%) [lfsa_eppgai] [29].
This kind of work employs people, but their employment is not the one they would like to have and, so, their incomes or wages are probably lower than the one required for their survival necessities. After 2015, these values seem to decrease. It is because economy has started to recover but, in some countries, like Spain, this decrease is slow and the involuntary part-time unemployment still remains very high, in fact it is 61.1% of total part-time unemployment (from 15 to 64 years) while in the Euro Zone it has fallen to 29.2% (2017), from 31.4% in 2015. In the same way that the crisis did not start equally for all European states, their recovery is not following the same pattern. Data is provided by EUROSTAT [29]. If so, it is possible that many of those formerly employed people may have lost better full-time jobs or have been demoted to part-time in the same place of work and probably these workers have become at risk of poverty and, sometimes at risk of exclusion. From this perspective, we should formulate our second and third hypothesis:
Hypothesis 2 (H2).
The risk of exclusion is not influenced by the involuntary part time unemployment.
Hypothesis 3 (H3).
The risk of poverty is not influenced by the involuntary part time unemployment.
2.3. The Household Situation
The labour market affects not only the employees but also their families, so one important aspect to take into account is the intensity of work of the household [30,31,32,33]. The household labour intensity is understood following EUROSTAT criteria. Then, “household labour intensity indicator” to the reader (e.g., “The work intensity of the household refers to the number of months that all working age household members have been working during the income reference year as a proportion of the total number of months that could theoretically be worked within the household” [34].
Hypothesis 4 (H4).
The risk of exclusion is not influenced by household labour intensity.
Hypothesis 5 (H5).
The risk of poverty is not influenced by household labour intensity.
The household labour intensity indicator comes from EUROSTAT Database, specifically from “People living in households with very low work intensity by age and sex (population aged 0 to 59 years) [ilc_lvhl11]” data [35].
2.4. A Decent Work for Sustainable Society
Getting a minimum level of earnings is a key feature for achieving a minimum standard of living compatible with wellbeing [36,37]. Despite the fact there is a common agreement about this point, the complexity of the conceptualization of decent work goes beyond the general intuitive meaning [38,39]. The earnings are expected to be negative correlated to risk of exclusion and risk of poverty, which is why we are going to test the next hypothesis:
Hypothesis 6 (H6).
The higher the mean equivalised income the lower the risk of social exclusion.
Hypothesis 7 (H7).
The higher the mean equivalised income the lower the risk of poverty.
Data for mean equivalised income were taken form “Mean and median income by age and sex (source: SILC) [ilc_di03]” part of the Database of EUROSTAT.
2.5. The Social Support
Social policies are a key matter for helping people overcome poverty and exclusion situations [40,41,42]. The social support variable was considered from the indicator [spr_exp_sum] from EUROSTAT Database [43].
Hypothesis 8 (H8).
The higher the social support, the lower the risk of social exclusion.
Hypothesis 9 (H9).
The higher the social support, the lower the risk of poverty.
2.6. Differences between Countries
Once we have analysed the causal relationships among the endogenous and exogenous variables, we analysed the differences between countries. As the economic policies are so different depending on the country’s belonging to a monetary area (Eurozone) or not, we have analysed the differences among countries regarding their belonging to the Eurozone. Our null hypotheses are:
Hypothesis 10 (H10).
There are no differences on the risk of exclusion within member states of the European Union due to their pertinence to the Eurozone.
Hypothesis 11 (H11).
There are no differences on the risk of poverty within member states of the European Union due to the pertinence to the Eurozone.
Finally, we have tried to establish some analogies between countries based on the possible differences on rates of risk of poverty and risk of social exclusion. Within the European Union, the social support and, in general, about social issues are quite different across the countries. In this work, we have established some different groups of countries according to their social advancements (see cluster analysis in Section 4-4). Therefore, we have tested the null hypothesis:
Hypothesis 12 (H12).
There are no similarities between some groups of member states in the European Union based on their scores on social issues.
For dealing with many interrelated variables and taking into account the literature, we have established a model reflected in Figure 5. This model is the one which lead us to analyse de causal relations to test hypothesis from H2 to H9.
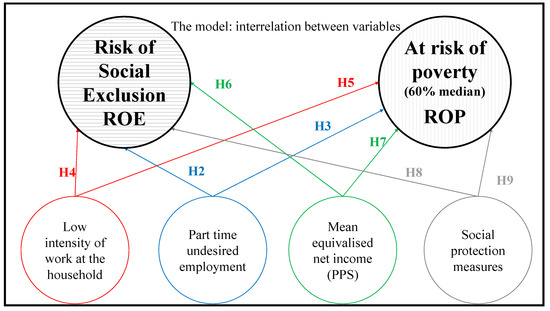
Figure 5.
The structural model proposed. Source: authors own.
3. Methodology
Our analysis is mainly based on a cross-section analysis, but, at the same time, the dynamic evolution was considered by means of studying the changes of the values during the last few years.
For solving the questions formulated in all hypotheses, we have combined several statistical and econometrical methods. We used a regression analysis for testing H1: we looked at the relationship between the risks of poverty in one year and the same variable in the previous year. This method is frequently used for this type of analysis [44,45]. The hypotheses H2 to H9 were tested by means of a structural equation model, where we elaborated the latent variables (constructs) shown in Figure 5 in relation to the indicators taken from EUROSTAT data [3]. This method analyses all the interactions between the latent variables and shows the sign of the relationships between them as well as their relative importance. This is an appropriate method for analysing social issues and it has been applied widely in academic literature, particularly in recent times [46,47,48,49]. To test hypotheses H10 and H11, we conducted a t-test for testing equal means, which is an adequate method of proving differences supported by statistics, instead of just comparing by checking the values of means and standard deviation and it is particularly useful in the field of economics [50,51]. Lastly, we conducted a cluster analysis to check the possible aggrupation of EU member states in relationship to all the social factors analysed here and testing H12. This is the best method of grouping countries on the basis of a common issue, as it is done here [52,53].
4. Results and Discussion
4.1. Regression Analysis
The Persistence of Risk of Poverty
On the basis of the EUROSTAT database [3], we have conducted a regression analysis from 2006 until 2015. Our dependent variable was the “risk of poverty” and we tried to relate it with the situation on the labour market, as literature suggests [5,14,26,54]. Then, we took as dependent variable, the risk of poverty rate by poverty threshold [3]. (Cut-off point: 60% of median equivalised income after social transfers). People with an “equivalised” disposable income below the risk-of-poverty threshold, which is set at 60% of the national median equivalised disposable income after social transfers, as a percentage of all people. According to EUROSTAT, the equivalised disposable income “takes into account the impact of differences in household size and composition,” The equivalised income attributed to each member of the household is calculated by dividing the total disposable income of the household by the equivalisation factor. Equivalisation factors can be determined in various ways. EUROSTAT applies an equivalisation factor calculated according to the OECD-modified scale first proposed in 1994—which gives a weight of 1.0 to the first person aged 14 or more, a weight of 0.5 to other persons aged 14 or more and a weight of 0.3 to persons aged 0–13” [55]. For getting the more uniform data series, we considered the data of percentage of total population “at risk of poverty” [2].
For testing H1 (There is no relation between ROP at period t and ROP at period t-1) we conducted a regression analysis where the dependent variable was ROP at 2014 (the last year with available data in EUROSTAT) and as independent variables the same indicator for years 2013, 2012, 2011, 2010, 2009, 2008, 2007 and 2006.
The results are shown in Table 1 for all available years on our dataset. The adjustment is good R-squared = 0.966 and R-squared adjusted is 0.955. It is expected that the main determinant of risk of poverty in the year “t” is the risk of poverty in the previous year. Results seem to confirm the expected solution and lead to the rejection of H1.

Table 1.
Relation between risk of poverty (ROP) in t and t-1 periods.
The results in Table 1 confirm that if there is a ROP in one year, it will probably remain for the next year. This is a strong relationship confirmed for all analysed years, even during the hardest incidence of economic crisis, where other economic and social factors were changing. That confirms that it is difficult to avoid ROP once one has become part of this group. The rejection of H1 is then clear, from this data and reflections.
Considering everything we have explained above, we should reject the Hypothesis 1 and we can state that there is a strong relationship between the ROP at one moment and ROP in the previous year.
Results in Table 2 show that there is a significant relationship between the risk of exclusion and the risk of poverty, as well as with the low work intensity of a household. The results in this table are those corresponding to the regressions, where the dependent variable is the risk of exclusion in 2014 (ROE2014) and the independent variables are the risk of exclusion in 2013 (ROP2013), the risk of poverty in 2014 (ROP2014) and, the very low intensity of work during 2014 (VLWI2014). The correspondent Equation (1) shows that ROE is related to ROP, as it is established by the theoretical framework. In addition, within our data, we found that there is a relationship between the very low work intensity and the ROE [56], which is also in accordance with the literature. This analysis contributes to a better understanding of the relationship between the variables studied here as well as their performance but its goal is not testing any of the proposed hypotheses.
Table 2.
The risk of exclusion (2014), the risk of poverty and the household situation.
From the multiple regression analysis, we can conclude that the Risk of exclusion in one year is related to the year before and that it is also explained by the risk of poverty and the very low intensity of work in the same year.
4.2. Structural Equation Model (SEM)
The results for the hypotheses H2 to H9 should be jointly analysed, since they conform to a model where all variables are part of a whole to explain the ROE and the ROP. First of all, an overview of the model is necessary, both for the construction of the latent variables (measurement model) and for the structural model (the causal relations model) as well as the general fit of the model, considering both. The SEM requires the analysis of both models: the measurement and the structural one. The first one explains how the constructs are made and their reliability and suitability to measure what it is intended to measure. For our Structural Equation Modelling analysis, the Smart-PLS (v.3.2.7) (GmbH, Boenningstedt, Germany). was the software instrument [57] whose effectiveness for casual analysis is recognized and widely used [58].
For the measurement model, the first step is to analyse the reliability and validity of the constructs (see Table 3), for testing the validity of our measurement model. All constructs have shown high scores for all indicators. The Cronbach alpha indicator estimates the internal consistency of a given latent variable, thus assessing the reliability of the instrument used to give a jointly measure for a group of observable variables that are part of the same concept. The closer to 1 the value of the indicator is, the higher the internal consistency of the analysed observed variables will be. The composite reliability (CR) informs about the consistence of the constructs in a complementary way. The AVE is the Average of Variance Extracted and it explains the information contained in the construct that comes from the observable variables.
Table 3.
Reliability and validity of the constructs.
The second step is to analyse the structural model. Solutions for the proposed model, shown in Figure 6, give the solution to the hypotheses H2 to H9. The path coefficients and their p-values are shown in Figure 6). In this kind of models, the whole interpretation gives is general and the p-values should be understood under this prism, more than if those values are above or below 0.05 [59]. Since each of the four independent latent variables (Low intensity of work at the household, Part time undesired employment, mean equivalised net income and social protection measures) try to explain both of the dependent latent variables (ROE and ROP, a specific section to explain the influence of each of those independent variables is provided in next paragraphs. The coefficients indicate the sign and the magnitude of the relations corresponding to a regression analysis and, then, the response to the established hypothesis, summarized in Figure 6. Structural model. Results. The coefficients corresponding to the established hypothesis are: H2: 0.291, H3: 0.494, H4: −0.088, H5: 0.225, H6: −0.217, H7: −0.079, H8: −0.390 and H9: −0.143. Then, there is an expected relationship between the ROE and the ROP and the four independent variables, such that the hypotheses H2 to H5 should be rejected and H6 to H9 should be assumed. Nevertheless, some reflections about the sign and nature of relations is shown in the next sections.
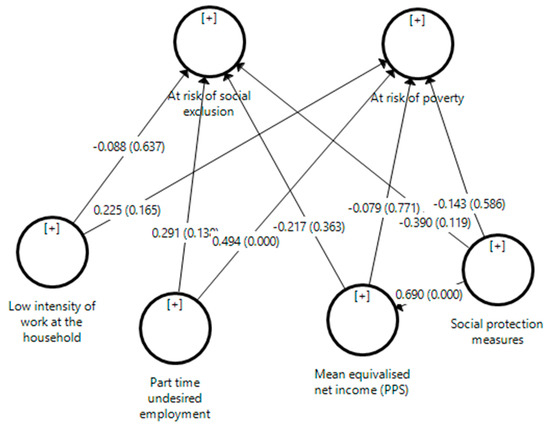
Figure 6.
Structural model. Results.
4.2.1. Low Intensity of Work at the Household
The access to the labour market is not only a way of getting economic resources but it also provides opportunities for further social inclusion, although the more time dedicated to work the less time for leisure is available. Hypothesis H4 and H5 deal with this issue. The influence of low intensity of work at the household on the ROE shows a negative sign, indicating that when the low intensity of work at the household is increasing, ROE is decreasing. This seems to be a surprising result, which could be explained if the focus is on disposable free time (due to a lower working time) and the possibility of increasing and reinforcing the relationships with relatives and friends, as the ROE is not only related to economic possibilities but also to the free time. Nevertheless, this is a suggestion that needs more research, since the authors could not find references in literature to support or deny this claim. Hence H4 should be rejected but a deeper study is needed about the sign of this relationship. Regarding the ROP, our model indicates that when the low intensity of work at the household increases, the ROP also increases. This result and according to literature, H5 should be rejected.
4.2.2. Part Time Undesired Employment
The results of the structural model show a positive relation between the part time undesired employment and both the ROE and ROP, the reasons are that spending less time at the workplace implicates not only less income but also less time in touch with different people and experiences, which increases ROP as well as ROE. As a result, H2 and H3 should be rejected.
4.2.3. Mean Equivalised Net Income
The higher level of income not only put people away from poverty but also give them the access to new relational options and social spaces. That is the explanation for the negative signs of the coefficients relating the mean equivalised net income with ROP and ROE, which justifies the rejection of the H7 and H6 hypotheses.
4.2.4. Social Protection Measures (PPS)
The negative coefficients of the relationship between the social protection measures and the ROE as well as the ROP indicates that, according to literature, the lower social protection, the higher risk of exclusion and the higher risk of poverty, suggesting the acceptance of H8 and H9.
4.3. The t-Test
Once we conducted the structural model, we saved the values of latent variables and we conducted a t-test for analysing the means equality significant differences. Previously, we conducted Levene’s test for testing equal variances. Results are shown in Table 4. This test informs about the variance of the compared groups, because when comparing them it is necessary to know if their variances are similar. There were no significant differences between member states, according to their belonging to the Eurozone.
Table 4.
t-test for means equality.
4.4. Clustering European Union Member States Attending Social Issues That Are Here Analysed
We conducted a cluster analysis in order to classify the countries of the European Union (Bulgaria is not included here because of the lack of data and we have introduced Iceland, even if is not a member of the European Union) in relation to social issues. This preliminary study gives us an approximation of the number of clusters of countries. We apply a hierarchical cluster analysis using as interval, the squared Euclidean distance and two alternative methods: the complete linkage and the Ward method (Figure 7 shows results). Both methods are used for cluster analysis with hierarchical conglomerate. We dealt with three conglomerates, we conducted a cluster analysis by using a conglomerate of K-means, based on to the Ward method. After we have set 3 conglomerates, our results indicate that in the first one we would have 13 countries, in the second one 13 countries and in the third only two countries: Denmark and Luxemburg. The other clusters are composed as shown in Table 5.
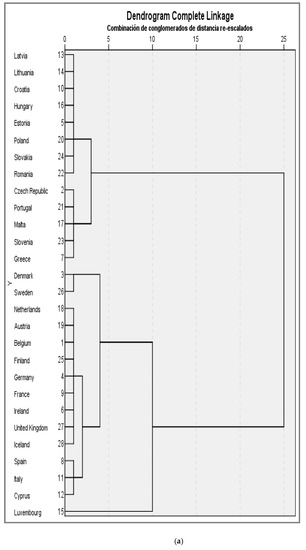
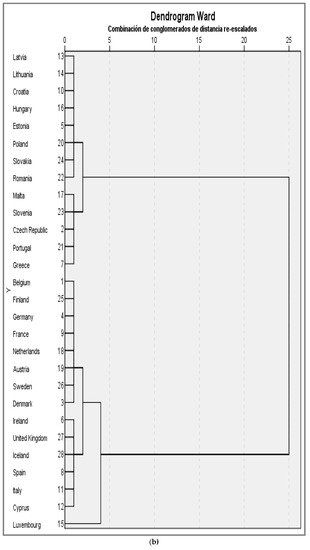
Figure 7.
Dendrogram. Complete linkage and Ward methods. (a) Complete linkage; (b) Ward methods.
Table 5.
Groups of countries attending social issues.
4.5. Summary of Acceptation or Rejection of Established Hypothesis
The summary of the results of the testing hypothesis is shown in Table 6.
Table 6.
Testing the hypothesis: results.
5. Conclusions
According to the theoretical and empirical previous studies, we have proved that there is a strong relationship between the ROP at one moment and the previous year, so we conclude that the preventive policies are highly important to avoid falling into poverty, since it is difficult to get out of it. In this sense, all the general types of general public policies addressed to education and health issues, as well as housing, can be a reference and an example of preventive policies, because they mostly affect the population in general, especially those who do not have access to private healthcare or education services. From our point of view, reinforcing these policies would act as a preventive mechanism for possible risk situations.
The risk of exclusion and the risk of poverty are both influenced by involuntary part time unemployment, because the higher this kind of employment, the higher both risks become. The low intensity of work in a household decreases the ROE and increases the risk of poverty. Whilst this last statement is not surprising, the relation between the low intensity of work at the household and the ROE is an unexpected relationship, which can be explained by the fact that income is important for social inclusion but so is free time. Nevertheless, this is a point which needs additional research to be confirmed, as it may be controversial. So, we must conclude that employment policies should be aimed at providing full time employment for all those who want it, in order to reduce the number of people at risk of exclusion and poverty. Moreover, as we have proved that the income is negatively correlated to both analysed risks, increasing the live wages and providing a good salary is an effective way of avoiding those risks. We suggest increasing wages and trying to increase productivity simultaneously for maintaining entrepreneurial benefits.
Public policies for helping people to avoid exclusion or poverty situations have been shown to be effective according to the results of our research, so we recommend continuing them. European Union policies are general for all member states, so they define a general framework. In this context, we recommend being aware of these qualitative differences and applying the most suitable policies in each country, since we have proved the differences between the member states. In our paper we have found that, in general terms, there are no differences between countries of the European Union within the Euro Zone but outside of it, however, we have found differences when the study focuses on specific countries, being able to verify some similarities in specific groups of countries that respond to other reasons other than belonging to the Euro Zone. Additional studies are needed to deepen the analysis of these differences and they are proposed as future research. This line of research could be valuable in designing specific social policies for specific countries that conform to certain common patterns regarding social needs.
Nevertheless, further studies in this area should be carried out, particularly focusing on a dynamic analysis, as well as deepening the relationship between low intensity of labour in the household and the risk of poverty seems to be a suggestive filed to deeper reflections.
Author Contributions
Conceptualization, I.N.-C., D.-M.Ț., M.Z. and X.P.; methodology, I.N.-C., X.P.; formal analysis, I.N.-C. and M.Z.; investigation, D.-M.Ț.; calculations, I.N.-C.; writing—original draft preparation, X.P.; writing—review and editing, I.N.-C., D.-M.Ț., M.Z. and X.P.; supervision, I.N.-C., D.-M.Ț., M.Z. and X.P.
Funding
Research results presented in this paper are an element of research project implemented by the National Science Center Poland (Polskie Narodowe Centrum Nauki) under the grant OPUS13 no UMO-2017/25/B/HS4/02172.
Acknowledgments
The authors would like to thank to the reviewers for the generously comments which contributed to the improvement of the paper
Conflicts of Interest
The authors declare no conflict of interest.
References
- United Nations. World Commission on Environment and Development. Brundtland GH. In Our Common Future; Oxford Univesity Press: Oxford, UK, 1987. [Google Scholar]
- European Union. EUROSTAT. Glossary: At Risk of Poverty or Social Exclusion (AROPE). Available online: https://ec.europa.eu/eurostat/statistics-explained/index.php/ (accessed on 20 May 2018).
- European Union. EUROSTAT. Statistical Information. 2016. Available online: https://ec.europa.eu/eurostat/data/database (accessed on 20 May 2018).
- Hämäläinen, J.; Matikainen, P. Mechanisms and Pedagogical Counterforces of Young People’s Social Exclusion: Some Remarks on the Requisites of Social Sustainability. Sustainability 2018, 10, 2166. [Google Scholar] [CrossRef]
- International Labour Organization (ILO). Declaración de la OIT sobre la justicia social para una globalización equitativa el 10 de junio de 2008. 2008. Available online: https://www.ilo.org/wcmsp5/groups/public/---dgreports/---cabinet/documents/genericdocument/wcms_371206.pdf (accessed on 14 May 2018).
- Atkinson, A.B.; Marlier, E.; Nolan, B. Indicators and targets for social inclusion in the European Union. JCMS J. Common Mark. Stud. 2004, 42, 47–75. [Google Scholar] [CrossRef]
- European Union. EUROSTAT. Available online: https://ec.europa.eu/eurostat/web/employment-and-social-inclusion-indicators/social-protection-and-inclusion/social-inclusion (accessed on 17 May 2018).
- Lampis, A. Social protection policy for poverty reduction in Colombia: Conceptual challenges. Revista de Estudios Soc. 2011, 41, 107–121. [Google Scholar] [CrossRef]
- Euzéby, C. Social protection to achieve sustainable inclusion: A European imperative in the current economic crisis. Int. Soc. Secur. Rev. 2012, 65, 69–88. [Google Scholar] [CrossRef]
- Soros, G. The Worst Market Crisis in 60 Years, 2008. Available online: https://www.ft.com/content/24f73610-c91e-11dc-9807-000077b07658 (accessed on 6 November 2018).
- Hilsenrath, J.; Ng, S.; Paletta, D. Worst crisis since 30s, with no end yet in sight. Wall Street J. 2008. Available online: https://www.wsj.com/articles/SB122169431617549947 (accessed on 6 November 2018).
- Underwood, J.; Khosrowshahi, F. ICT expenditure and trends in the UK construction industry in facing the challenges of the global economic crisis. J. Inf. Technol. Constr. 2012, 17, 26–42. [Google Scholar]
- Bayón, M.C. Persistence of an exclusionary model: Inequality and segmentation in Mexican society. Int. Labour Rev. 2009, 148, 301–315. [Google Scholar] [CrossRef]
- Jociles, M.I.; Rivas, A.M. Between empowerment and vulnerability: Single motherhood as SMBC family project through assisted reproduction and international adoption. Rev. Antropol. Soc. 2009, 18, 127–170. [Google Scholar]
- Mood, C. The not-very-rich and the very poor: Poverty persistence and poverty concentration in Sweden. J. Eur. Soc. Policy 2015, 25, 316–330. [Google Scholar] [CrossRef]
- Mookherjee, D. Poverty persistence and design of antipoverty policies. In Understanding Poverty; Banerjee, A.V., Benabou, R., Mookherjee, D., Eds.; Oxford University Press: Oxford, UK, 2006; p. 231. [Google Scholar]
- Scutella, R.; Wilkins, R.; Kostenko, W. Intensity and persistence of individuals’ social exclusion in Australia. Austr. J. Soc. Issues 2013, 48, 273–298. [Google Scholar] [CrossRef]
- Whelan, C.T.; Maître, B. Social class variation in risk: A comparative analysis of the dynamics of economic vulnerability. Br. J. Soc. 2008, 59, 637–659. [Google Scholar] [CrossRef]
- European Union. EUROSTAT. At-Risk-of-Poverty Rate by Poverty Threshold, Age and Sex. Available online: http://appsso.eurostat.ec.europa.eu/nui/show.do?dataset=ilc_li02 (accessed on 17 May 2018).
- European Union. EUROSTAT. Your key European statistics. People at risk of poverty or social exclusion. Available online: https://ec.europa.eu/eurostat/web/products-datasets/-/t2020_50 (accessed on 21 May 2018).
- European Union. EUROSTAT. Glossary: Equivalised Disposable Income. Available online: https://ec.europa.eu/eurostat/statistics-explained/index.php/Glossary:Equivalised_disposable_income (accessed on 17 May 2018).
- Bongers, A.; Díaz-Roldán, C.; Torres, J.L. Highly Skilled International Migration, STEM Workers, and Innovation. (No. 2018-08). 2018. Available online: https://ideas.repec.org/p/mal/wpaper/2018-8.html (accessed on 10 January 2019).
- European Union. EUROSTAT. Glossary: Material Deprivation. Available online: https://ec.europa.eu/eurostat/statistics-explained/index.php/Glossary:Material_deprivation (accessed on 22 May 2018).
- Fang, T.; Gunderson, M. Vulnerable groups in Canada and labour market exclusion. Int. J. Manpow. 2015, 36, 824–847. [Google Scholar] [CrossRef]
- Bailey, N. Exclusionary employment in Britain’s broken labour market. Crit. Soc. Policy 2016, 36, 82–103. [Google Scholar] [CrossRef]
- Canduela, J.; Lindsay, C.; Raeside, R.; Graham, H. Employability, Poverty and the Spheres of Sociability—Evidence from the British Household Panel Survey. Soc. Policy Adm. 2015, 49, 571–592. [Google Scholar] [CrossRef]
- Kretsos, L. Youth policy in austerity Europe: The case of Greece. Int. J. Adolesc. Youth 2014, 19 (Suppl. 1), 35–47. [Google Scholar] [CrossRef]
- Sanjuán, V.C. The new poverty in the labour market. Intang. Cap. 2015, 11, 270–283. [Google Scholar]
- European Union. EUROSTAT. Involuntary Part-Time Employment as Percentage of the Total Part-Time Employment, by Sex and Age. Available online: http://appsso.eurostat.ec.europa.eu/nui/show.do?dataset=lfsa_eppgai&lang=en (accessed on 20 May 2018).
- Combes, J.; Ebeke, C.H.; Maurel, M.; Yogo, T.U. Remittances and Working Poverty. J. Dev. Stud. 2014, 50, 1348–1361. [Google Scholar] [CrossRef]
- Crettaz, E. A state-of-the-art review of working poverty in advanced economies: Theoretical models, measurement issues and risk groups. J. Eur. Soc. Policy 2013, 23, 347–362. [Google Scholar] [CrossRef]
- Torraco, R.J. The Persistence of Working Poor Families in a Changing U.S. Job Market: An Integrative Review of the Literature. Hum. Resour. Dev. Rev. 2016, 15, 55–76. [Google Scholar] [CrossRef]
- Wills, J.; Linneker, B. In-work poverty and the living wage in the United Kingdom: A geographical perspective. Trans. Inst. Br. Geogr. 2014, 39, 182–194. [Google Scholar] [CrossRef]
- European Union. EUROSTAT. EU Statistics on Income and Living Conditions (EU-SILC) Methodology—Concepts and Contents. Available online: https://ec.europa.eu/urostat/statistics-explained/index.php?title=EU_statistics_on_income_and_living_conditions_(EU-SILC)methodology_%E2%80%93_concepts_and_contents#Work_intensity_.28WI.29 (accessed on 18 May 2018).
- European Union. EUROSTAT. People Living in Households with very Low Work Intensity by Age and Sex. Available online: http://appsso.eurostat.ec.europa.eu/nui/show.do?dataset=ilc_lvhl11&lang=en%20and%20%20 (accessed on 20 May 2018).
- Atkinson, A.B. On the measurement of poverty. Econom. J. Econom. Soc. 1987, 749–764. [Google Scholar] [CrossRef]
- Kanji, G.K.; Chopra, P.K. Poverty as a system: Human contestability approach to poverty measurement. J. Appl. Stat. 2007, 34, 1135–1158. [Google Scholar] [CrossRef]
- Masdonati, J.; Schreiber, M.; Marcionetti, J.; Rossier, J. Decent work in Switzerland: Context, conceptualization, and assessment. J. Vocat. Behav. 2019, 110, 12–27. [Google Scholar] [CrossRef]
- Griessler, E.; Littig, B. Social sustainability: A catchword between political pragmatism and social theory. Int. J. Sustain. Dev. 2005, 8, 65–79. [Google Scholar]
- Babic, Z.; Baturina, D. The concept of social investment in response to the crisis and the new challenges of the welfare state: Trends and perspectives. Rev. Soc. Polit. 2016, 23, 39–60. [Google Scholar]
- Barbieri, P.; Bozzon, R. Welfare, labour market deregulation and households’ poverty risks: An analysis of the risk of entering poverty at childbirth in different European welfare clusters. J. Eur. Soc. Policy 2016, 26, 99–123. [Google Scholar] [CrossRef]
- Porter, C.; Goyal, R. Social protection for all ages? Impacts of Ethiopia’s Productive Safety Net Program on child nutrition. Soc. Sci. Med. 2016, 159, 92–99. [Google Scholar] [CrossRef] [PubMed]
- European Union. EUROSTAT. Expenditure: Main Results. Available online: http://appsso.eurostat.ec.europa.eu/nui/show.do?dataset=spr_exp_sum&lang=en (accessed on 21 May 2018).
- Bernstein, S.F.; Rehkopf, D.; Tuljapurkar, S.; Horvitz, C.C. Poverty dynamics, poverty thresholds and mortality: An age-stage Markovian model. PLoS ONE 2018, 13, e0195734. [Google Scholar] [CrossRef]
- Yurkov, D.V.; Sadyrtdinov, R.R.; Karasik, E.A.; Vedikhina, A.S. The Measurement of Poverty in Modern Russia. Trends and Issues in Interdisciplinary Behavior and Social Science. In Proceedings of the 5th International Congress on Interdisciplinary Behavior and Social Science (ICIBSoS 2016), Jakarta, Indonesia, 5–6 November 2016; pp. 121–124. [Google Scholar]
- Picatoste, J.; Ruesga-Benito, S.M.; González-Laxe, F. Economic environment and health care coverage: Analysis of social acceptance of access restrictive policies applied in Spain in the context of economic crisis. J. Clean. Prod. 2018, 172, 3600–3608. [Google Scholar] [CrossRef]
- Santos, G.; Marques, C.S.; Ferreira, J.J.M. What are the antecedents of women’s entrepreneurial orientation? Int. Entrep. Manag. J. 2018, 14, 807–821. [Google Scholar] [CrossRef]
- Solano Acosta, A.; Herrero Crespo, Á.; Collado Agudo, J. Effect of market orientation, network capability and entrepreneurial orientation on international performance of small and medium enterprises (SMEs). Int. Bus. Rev. 2018, 27, 1128–1140. [Google Scholar] [CrossRef]
- Daulay, M.T.; Elfindri, S.S. An empirical investigation of business diversification and economic value on poverty in batubara regency, north sumatera, Indonesia. Int. J. Civ. Eng. Technol. 2018, 9, 841–859. [Google Scholar]
- Saguin, K. Why the poor do not benefit from community-driven development: Lessons from participatory budgeting. World Dev. 2018, 112, 220–232. [Google Scholar] [CrossRef]
- Wainberg, M.; Oquendo, M.A.; Peratikos, M.B.; Gonzalez-Calvo, L.; Pinsky, I.; Duarte, C.S.; Yu, Q.; Green, A.F.; Martinho, S.; Moon, T.D.; et al. Hazardous alcohol use among female heads-of-household in rural Mozambique. Alcohol 2018, 73, 37–44. [Google Scholar] [CrossRef] [PubMed]
- Akande, A.; Cabral, P.; Gomes, P.; Casteleyn, S. The Lisbon ranking for smart sustainable cities in Europe. Sustain. Cities Soc. 2019, 44, 475–487. [Google Scholar] [CrossRef]
- Zasada, I.; Weltin, M.; Reutter, M.; Verburg, P.H.; Piorr, A. EU’s rural development policy at the regional level—Are expenditures for natural capital linked with territorial needs? Land Use Policy 2018, 77, 344–353. [Google Scholar] [CrossRef]
- Parent-Thirion, A.; Vermeylen, G.; van Houten, G.; Lyly-Yrjänäinen, M.; Biletta, I.; Cabrita, J. Fifth European Working Conditions Survey. Eur. Union. Eurofound 2012. [Google Scholar] [CrossRef]
- European Union. EUROSTAT. Glossary: Social Protection Expenditure. Available online: https://ec.europa.eu/eurostat/statistics-explained/index.php/Glossary:Social_protection_expenditure (accessed on 21 May 2018).
- Luque, O.G.; Lechuga, M.L.; Martínez, U.F. El perfil de la exclusión social en murcia y españa: El impacto de la crisis. Recta 2013, 14, 213–228. [Google Scholar]
- Ringle, C.M.; Wende, S.; y Becker, J.M. SmartPLS 3. Boenningstedt: SmartPLS GmbH. 2015. Available online: http://www.smartpls.com (accessed on 22 May 2018).
- Hussain, S.; Fangwei, Z.; Siddiqi, A.F.; Ali, Z.; Shabbir, M.S. Structural Equation Model for Evaluating Factors Affecting Quality of Social Infrastructure Projects. Sustainability 2018, 10, 1415. [Google Scholar] [CrossRef]
- Greenland, S.; Senn, S.J.; Rothman, K.J.; Carlin, J.B.; Poole, C.; Goodman, S.N.; Altman, D.G. Statistical tests, P values, confidence intervals, and power: A guide to misinterpretations. Eur. J. Epidemiol. 2016, 31, 337–350. [Google Scholar] [CrossRef] [PubMed]
© 2019 by the authors. Licensee MDPI, Basel, Switzerland. This article is an open access article distributed under the terms and conditions of the Creative Commons Attribution (CC BY) license (http://creativecommons.org/licenses/by/4.0/).