Article

Developing a Mobile Mapping System for 3D GIS and Smart City Planning

Certified Mapping Scientist and Professional Engineer, Department of Geography, DePaul University, 990 West Fullerton Avenue, Suite 4513, Chicago, IL 60614, USA
Sustainability 2019, 11(13), 3713; https://doi.org/10.3390/su11133713
Submission received: 15 June 2019 / Revised: 4 July 2019 / Accepted: 5 July 2019 / Published: 7 July 2019

Abstract

:
The creation of augmented reality-related geographic information system (GIS) mapping applications has witnessed considerable advances in the technology of urban modeling; however, there are limitations to the technology that is currently used to create similar resources. The cost of the creation of the vehicle is an obstacle, and the rendering of textures of buildings is often lacking because of the distortion caused by the types of lenses that have been used. Generally, mobile mapping systems (MMSs) can extract detailed three-dimensional (3D) data with high quality texture information of the 3D building model. However, mapping urban areas by MMSs is expensive and requires advanced mathematical approaches with complicated steps. In particular, commercial MMS, which generally includes two GPS receivers, is an expensive device, costing ~$1 million. Thus, this research is aimed at developing a new MMS that semi-automatically produces high-quality texture information of 3D building models proposes a 3D urban model by hybrid approaches. Eventually, this study can support urban planners and people to improve their spatial perception and awareness of urban area for Smart City Planning.

1. Introduction

A three-dimensional (3D) city model allows urban planners and the public to understand areas of interest in the urban design-context in a spatial, timely, and virtual manner [1,2]. Therefore, 3D models are used in a wide range of applications such as urban planning and 3D geographic information systems (GIS) [3,4,5,6,7,8]. In general, 3D models require photorealistic representation of 3D geometrical objects, which enables urban planners to enhance spatial perceptions of geographic objects and obtain a better understanding of overall city planning [2]. As is well known, 3D representation requires texture-mapping procedures that function either manually or automatically. Various approaches for building textures for a 3D model exist, e.g., 3D city modeling can use airborne images, airborne light detection and ranging (LiDAR), ground-based or vehicle-borne sensing techniques, and combinations of these [9,10]. Although hybrid approaches that use both aerial images and ground-based sensing techniques are becoming increasingly common in urban 3D modeling, creating a 3D urban model remains a complex and difficult task owing to the quality of the texture images, labor-intensive nature of the work, complicated procedures, and high cost [11].
In light of the abovementioned issues, this study investigated the creation of a new mobile mapping system (MMS) that semi-automatically produces high-quality texture information for 3D building models and the production of 3D urban models using hybrid approaches.
This paper is structured as follows. In Section 2, we describe previous studies of MMSs. In Section 3, we discuss the proposed methods using a schematic diagram and materials. In Section 4, we describe the new MMS application with image processing and 3D building reconstruction and discuss testing Internet Protocol (IP) camera sensors mounted on a vehicle. In Section 5, we present the most significant contributions and limitations of this research. Finally, in Section 6, we provide the conclusion of this study.

2. Related Work

Over the past two decades, MMSs have been developed and used in several fields, such as urban planning [12], 3D building modeling [13,14,15,16], virtual heritage conservation [17], augmented reality [18], transportation [19,20], and forestry [21]. Recent applications of 3D urban modeling are actively used in the field of disaster management and flood-sensitive cities [22].
Originally, MMSs were used to extract detailed 3D data at a high resolution and accuracy for use in numerical city modeling and to provide spatial data in the most efficient manner possible to better understand urban environments. Moreover, MMSs provide high-quality road-related information with considerable speed, in addition to improving object modeling [20,23,24].
Initially, MMSs were used to capture spatial information to assist in mapping or navigating in urban areas [25,26,27]. Operational MMSs were first developed in the 1990s by the Center for Mapping at the Ohio State University to automate and improve the efficiency of data collection for digital mapping [25,28,29]. This group used a vehicle-equipped with a global positioning system (GPS), charge-coupled device cameras, color video cameras, and several dead reckoning sensors. In the 2000s, to meet the increasing demand for high-quality 3D urban data to delineate road details and man-made structures, MMSs were used to measure highway assets, indivisible or abnormal load route planning, and 3D city modeling. Moreover, such systems provide information on building facades or powerlines. When those developments were taking place, commercial use of MMSs (the StreetMapper system) increased [30]. In 2007, Google Maps Street View, generated using a vehicle-based survey, began providing street-level images to supplement Google’s maps. Street-level images enable people to improve their spatial perception or awareness in urban areas [31,32]. The effects of the virtual reality interactive screen images available in widespread areas from Google Street View have affected virtual tourism and geo-gaming [33,34,35].
Generally, MMSs are used to fulfill demands for high-quality data collection in a manner that is usually not possible when using airborne surveys to supply comprehensible city models. While the terrains, outlines, and roof shapes of buildings can be reconstructed using aerial surveys, there is only limited information on building facades available for data processing from this source [8,18,22,36].
To overcome the limitations of the wide-angle view used in aerial surveys, oblique images must be obtained to generate the textures of the facades. In this approach, rooftops and facades are textured using multiple airborne images at various angles; however, this method yields low-quality results because of the images obtained under variable conditions (i.e., different lighting and resolutions) [36,37,38]. Ground-based MMSs can be used to collect high-quality images from building surfaces and to texture building sides; however, the surfaces that are not close to the fronts of the buildings may be distorted, and the tops of buildings cannot be covered by a ground-based system [39].
Commercial MMSs are used to create precise and detailed 3D city modeling; however, such systems have not been developed to capture building textures, which is essential information for 3D modeling. They are rather used to survey and measure road facilities [37,40,41,42]. High-precision land-based data are frequently required to create the textures of the building facades. Note that strategies for developing 3D building facades from terrestrial data are under continuous development, e.g., shape-grammar algorithms that extract detailed information from the windows of buildings using mobile terrestrial laser scanning have been proposed for automatic façade reconstruction in virtual city models [36]. Similarly, knowledge regarding building information could be used to reconstruct occluded parts of a building façade [43]. 3D city models integrate reconstruction frameworks with object recognition module to supply realistically textured scenes to improve detection precision [18]. Despite attempts to provide realistically textured 3D city models to develop higher-level understanding of urban environments, data size constraints and cost cutting remain restrictions on the products of MMSs. To summarize, there are three primary factors that should be considered to collect 3D spatial information such as 3D city models. First, a hybrid approach is necessary to preserve high-quality texture information of the 3D building model. Second, creating a 3D urban model requires complicated procedures. Third, the hybrid approach with high-quality 3D building model is expensive. Accordingly, with respect to limitations of the three factors, this study developed a new MMS:
(1)
To acquire high-quality texture information for 3D building modeling and to create a hybrid approach;
(2)
To produce an automated 3D building model to improve the spatial perceptions of the urban area among the public; therefore, it is important that a mapping car can be made available;
(3)
To collect high-quality texture information on 3D buildings at a low price point, the application software was developed for the MMS.
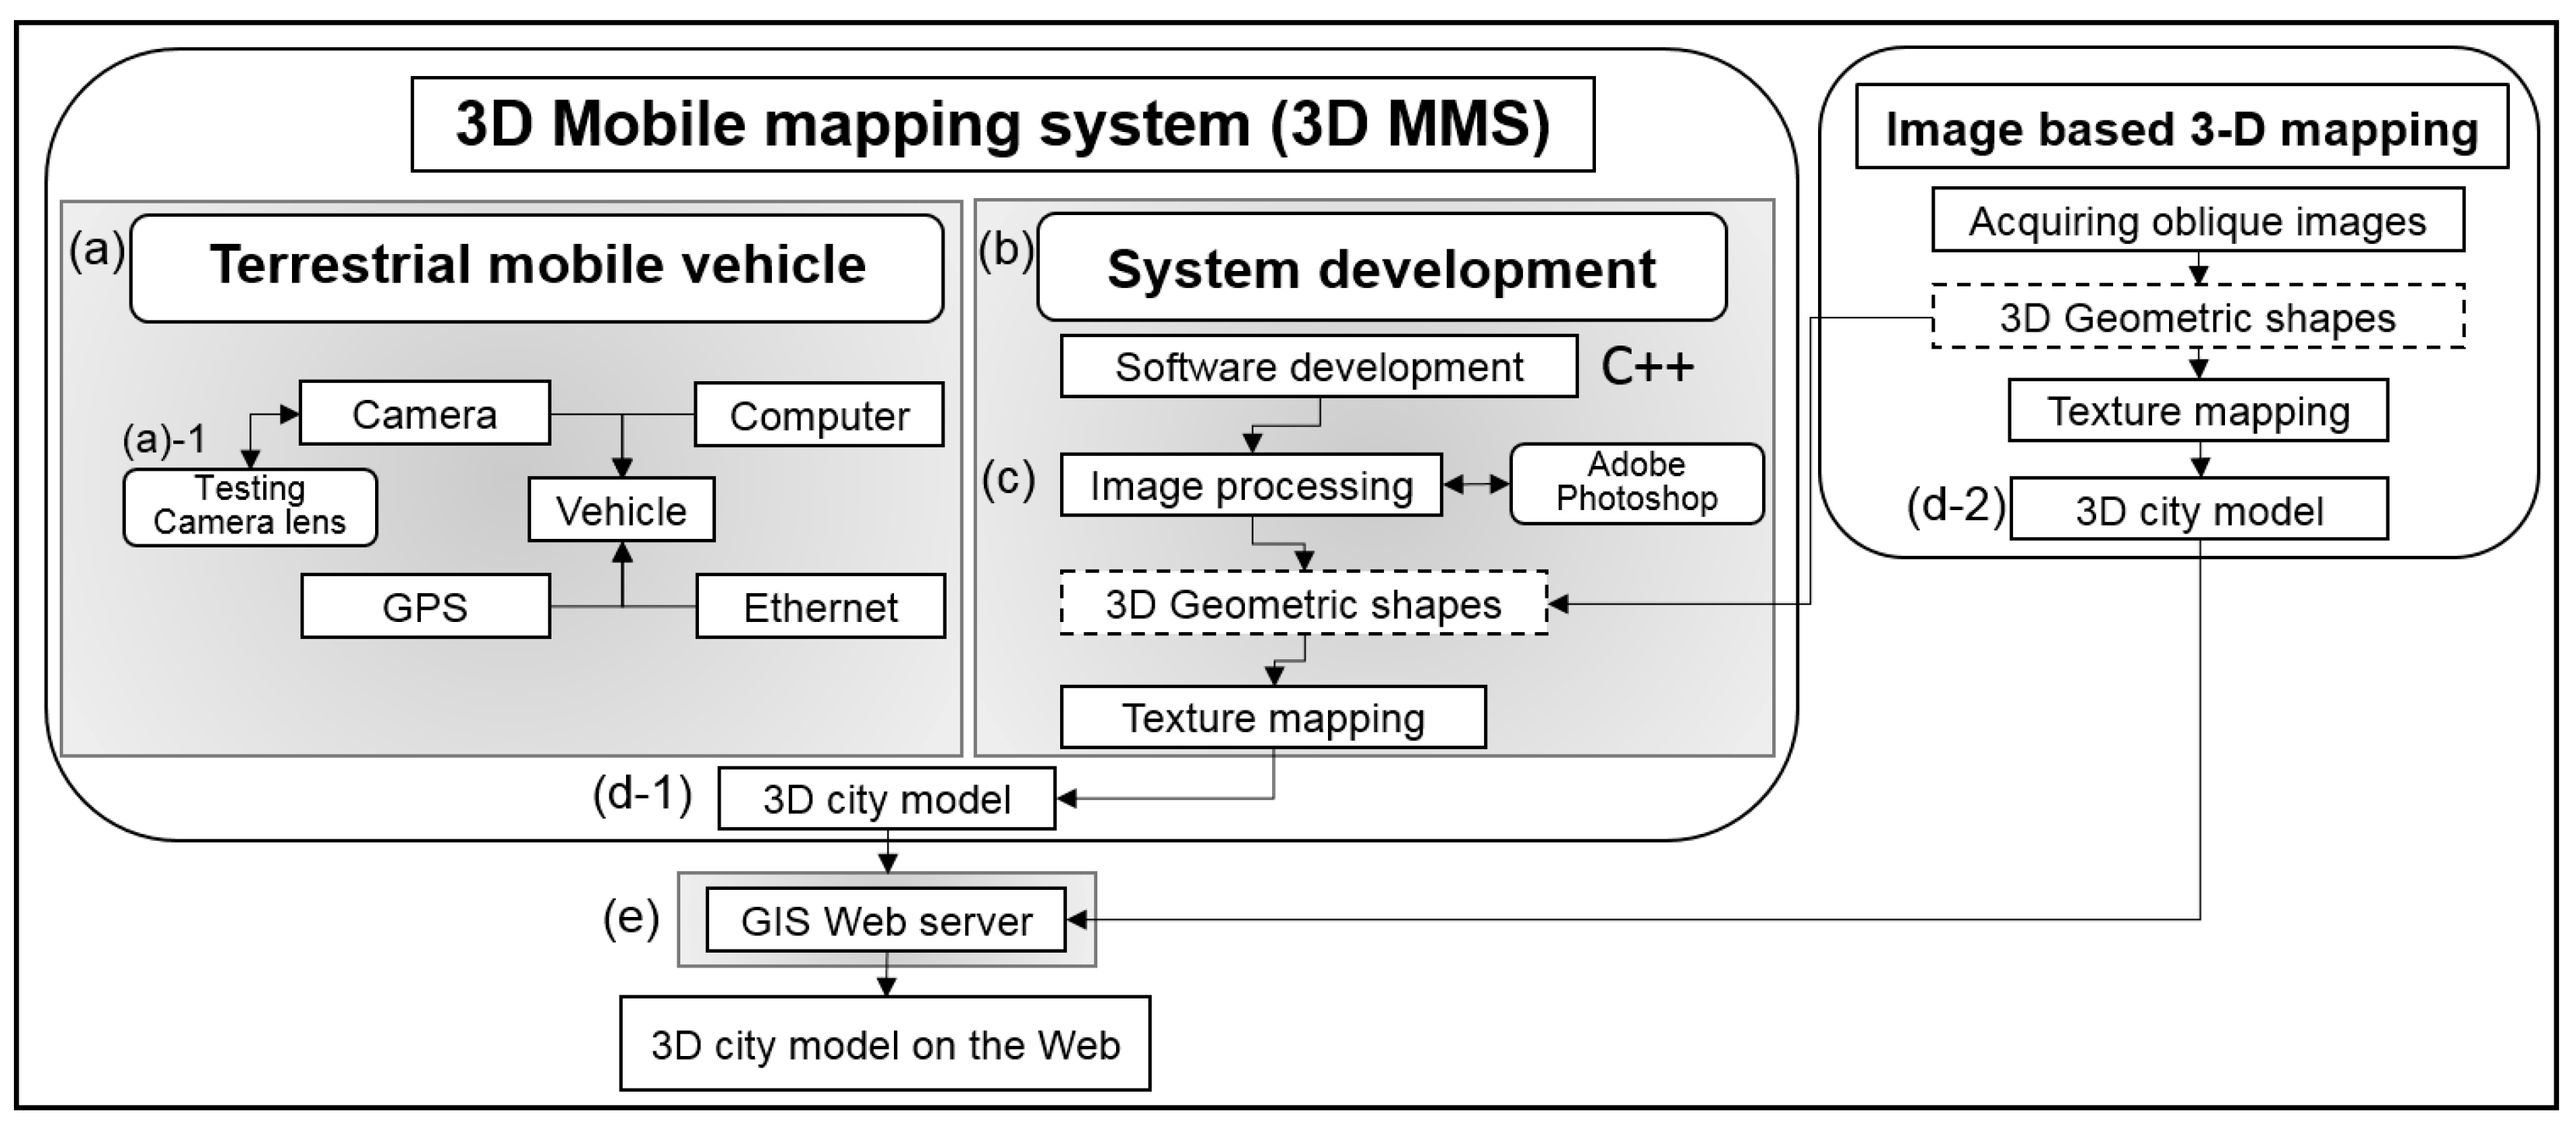
Eventually, the car-based mobile mapping can produce high-quality 3D building models at a low cost for an MMS. The author believes that the system will be beneficial for increasing demands of 3D GIS or applications of augmented reality.

3. Methods

3.1. Workflow and Data Collection

In this study, an MMS was developed to produce high-quality textured 3D building models. Moreover, an integrated system was developed to combine the results from high-resolution aerial photographs. Figure 1 shows a schematic of the workflow for this study.
As shown in Figure 1, the MMS included two sections. The vehicle-based system was developed and equipped with a camera, computer, GPS receiver, and ethernet connectivity. The application software was designed in C++ to collect and control the acquired images in real time (Figure 1b). The application software provided location and texture information for geographical objects with links to mobile terrestrial equipment. Image processing was performed using Adobe Photoshop CS3 to provide distortion calibration and the warp tool that can be used in the images (Figure 1c). The MMS developed in this study was used to improve the texture quality of the sides of low-rise buildings, whereas airborne images were used to collect the texture information for the tops of buildings and for the sides of high-rise buildings. 3D geometric objects were extracted from overlapping aerial images for 3D building models. 3D city models developed from ground and airborne-based system were eventually produced for use by public services using a GIS web server. Before the textured images are revised, this research assessed positional accuracy of the 3D geometric objects and then the images were attached to the 3D geometric objects. As for the positional accuracy, this study used virtual reference points that were determined by Total Station (TS) and GPS statistic surveying.

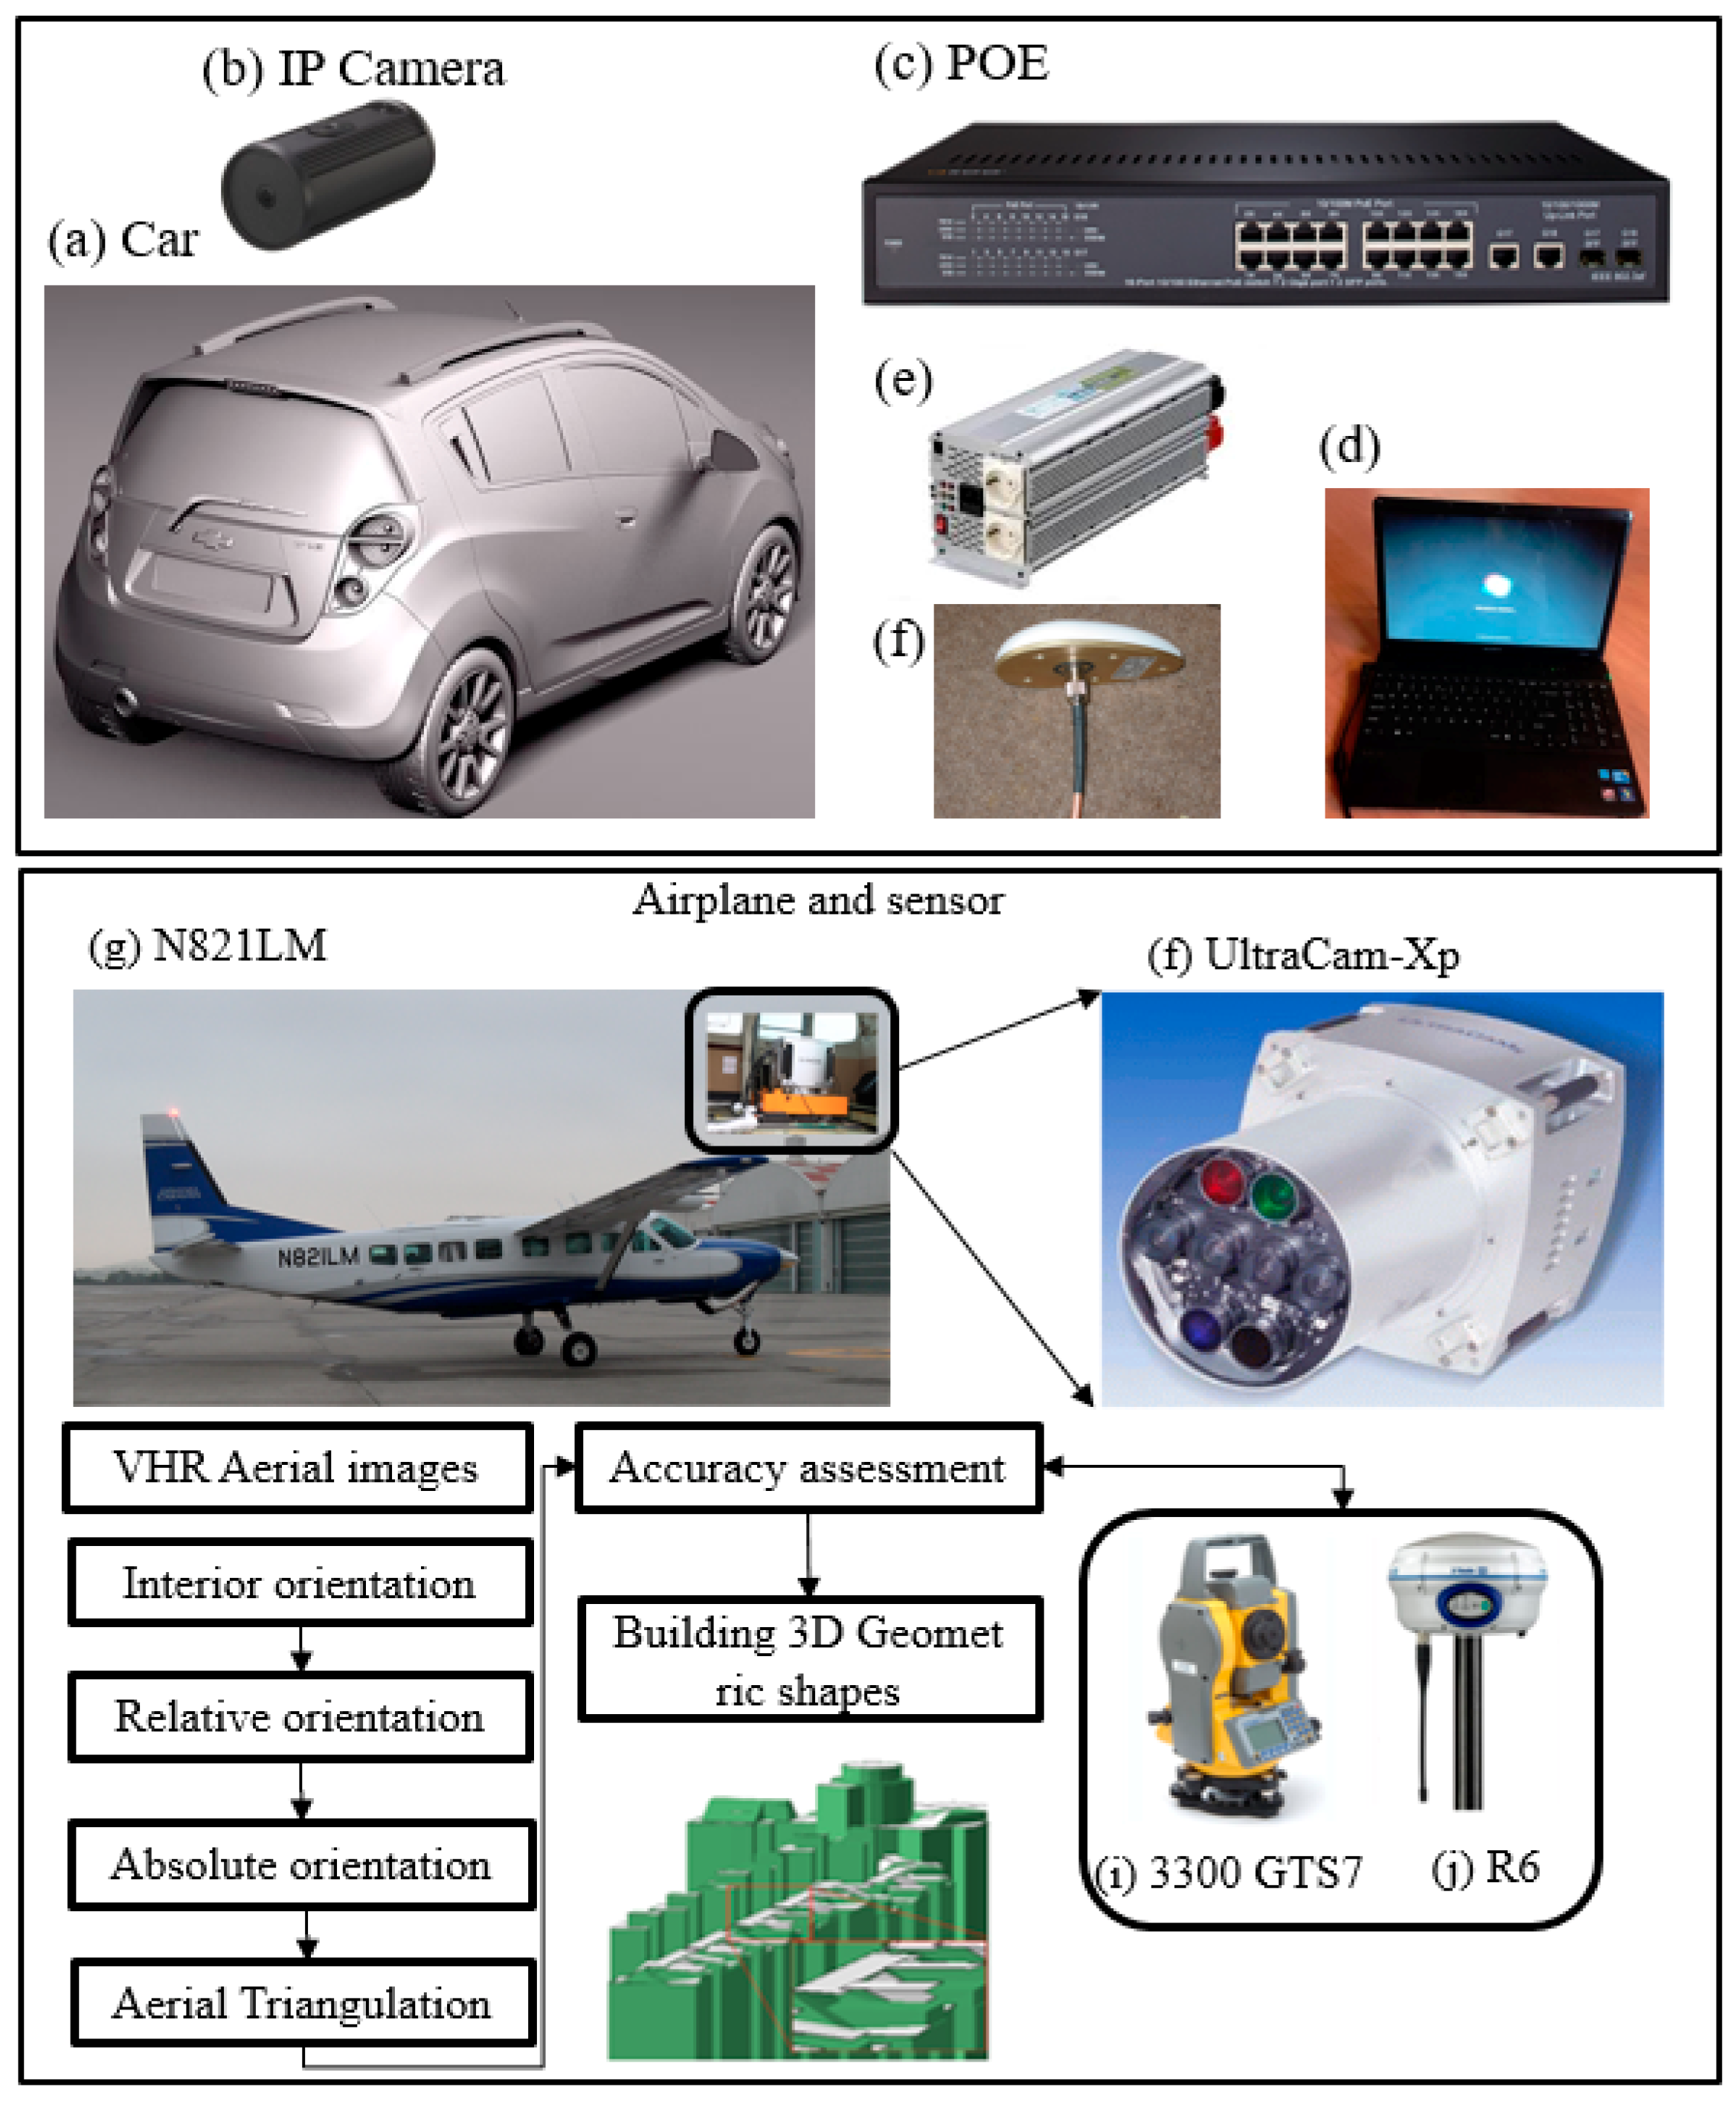
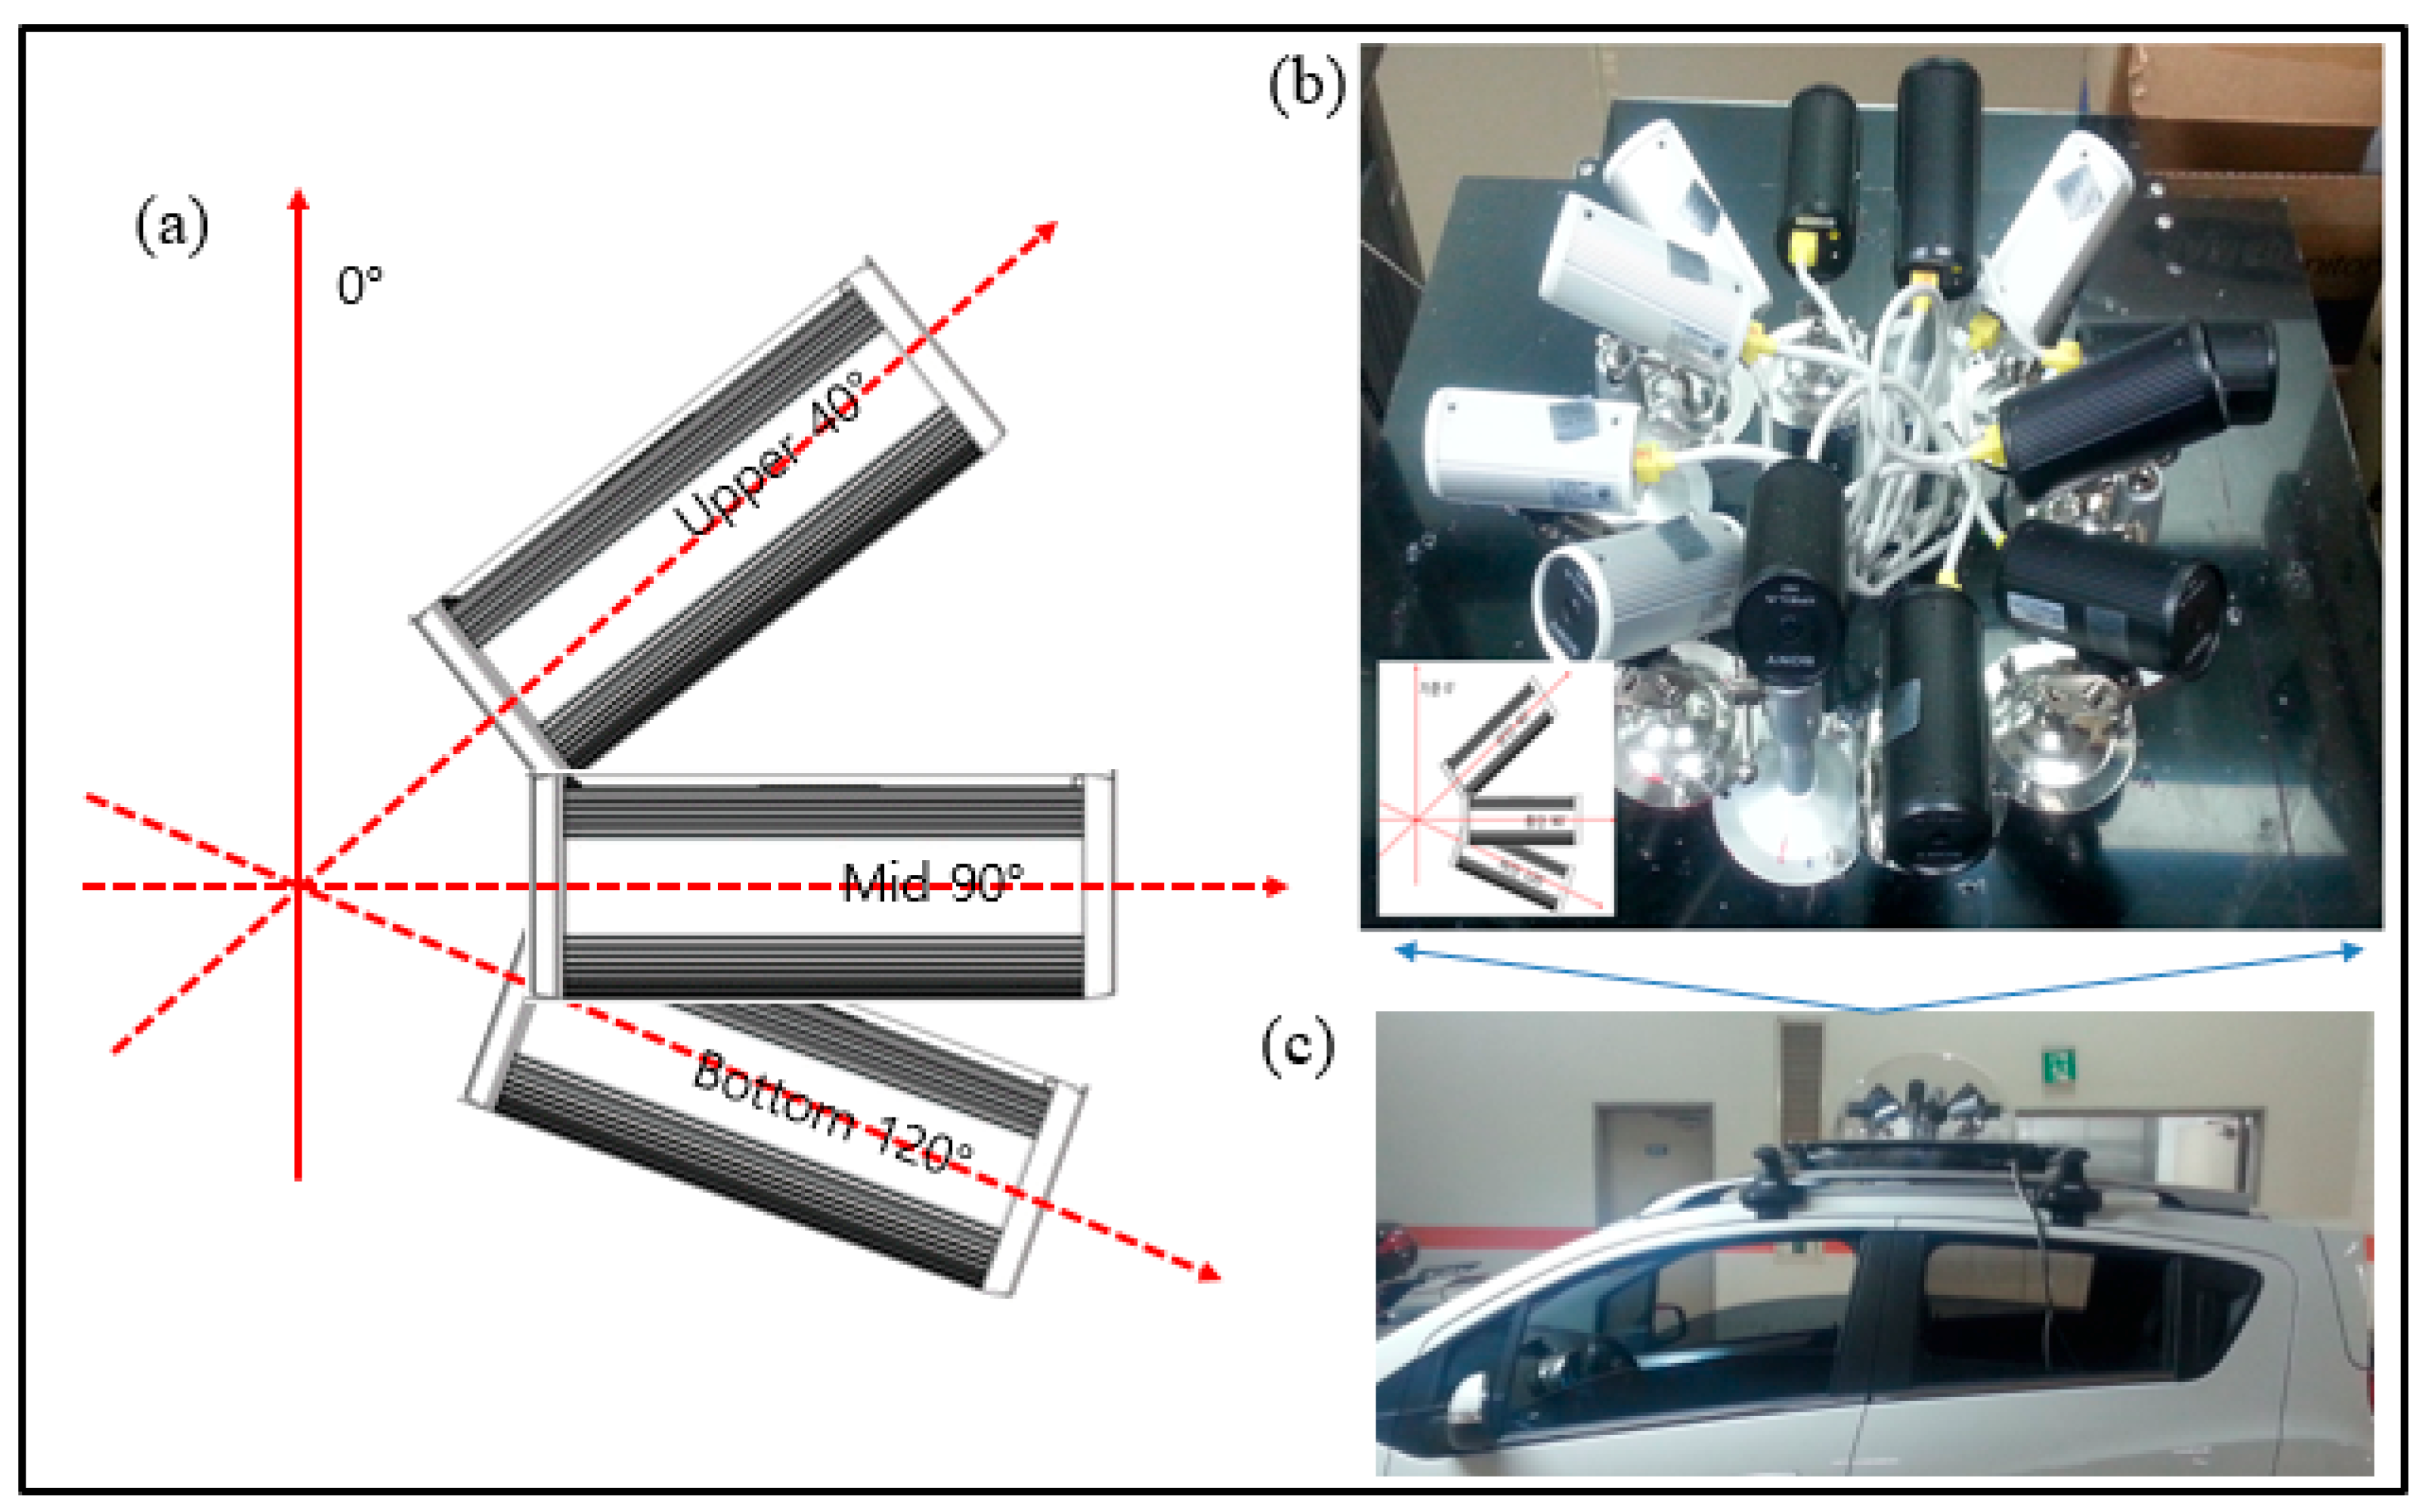
3.2. Materials and MMS Design

Figure 2 shows the materials and equipment used to develop the new MMS.
In Figure 2, the components of the mobile equipment are shown. This mobile terrestrial equipment provided the texture information required to produce 3D geographical information. The system used included a photographic system to collect the images, a GPS receiver to record location information, a control and transmission system to obtain and store data, a recording system, a power supply system, and a mobile vehicle. A Chevrolet Spark with a volume of 995 cm3 was used as the mobile vehicle [44]. Figure 2b shows the IPELA SNC Network Camera from SONY, which was used for the MMS. The 12 cameras used were controlled through a network function. Power over Ethernet (POE) was used to supply electric power to the camera and transmit the signal in a central control system, as shown in Figure 2c [45]. Using an HP EliteBook 8560w as the workstation, 12 images were taken per second with all the cameras. The data were processed by the workstation that was equipped with an Intel Core i7 processor, Intel Core booster technology, a data speed of 3.40 GHz, and a DDR3 video memory of 2 GB. The workstation used a 64-bit operating system. Figure 2e shows the power supply device for the 12 cameras, POE, and the computer. To provide the required power in a stable fashion, a supply system with 12 V DC input voltage and a continuous output power of 1000 W. As shown in Figure 2f, an USB type GPS receiver that used L1 frequency was used to obtain data and recording location values at 3 m intervals [46]. Figure 2g shows the Cessna Caravan-208B airplane used, registered as N821LM, with an UltraCam-Xp optical aerial camera installed on it. The camera sensor produces a pixel resolution of 6 cm, and the aerial images were acquired at an altitude of 1000 m. The positional accuracy of the aerial images was quantitatively assessed using national reference points and virtual reference stations, as determined by the static GPS and TS surveying standards (Figure 2i,j).
This study used 3D geometric shapes that were from oblique aerial images and developed by Dr. Jungil Lee, a contributor to this study. This study focused on developing a new MMS system; therefore, listing the procedure for creating 3D geometric shapes from aerial photos was not a priority. Furthermore, a high-resolution digital elevation model (DEM) produced from multiple LiDAR return points was used. The average LiDAR point density used in this research was five points per m2 with a minimum of two points per m2.

4. Results

4.1. Developing a Mobile Vehicle for 3D Mapping System

Figure 3 shows the mobile vehicle used in the 3D mapping system.
The vehicle was equipped a system including POE, which was connected to 12 cameras, with the vehicle providing the power. The cameras weighed only 15 kg; therefore, no tools or devices were used to secure the cameras to the roof of the vehicle. A cable was used to connect the power supply to the laptop, held within the car. All IP cameras used were capable of being connected in multiples to one POE to transfer images, and the IP camera used has an advantage to develop and adjust various functions. As shown in Figure 3b, 360° shooting was conducted using 12 IP cameras. Multiple camera angles (40°, 90°, and 120°) were used to capture images of high-rise buildings, and small-sized cameras with a wide-angle view were mounted on the vehicle as a platform.
Note that to measure location information of road facilities a commercial MMS is expensive with the complete setup costing around $US1 billion, including the cost of two GPS receivers, an inertial measurement Unit (IMU), laser scanners, and digital cameras. However, this research project cost only $46,167, in its development of a new MMS, with all elements put together.
As shown in Table 1, $23,280 was spent on materials, which accounted for ~49.55% of the total cost. The labor costs were ~$22,887, including paying two individuals for developing the equipment and one for programming for a period of three months. The labor costs were calculated to reach $2542 per month per person.

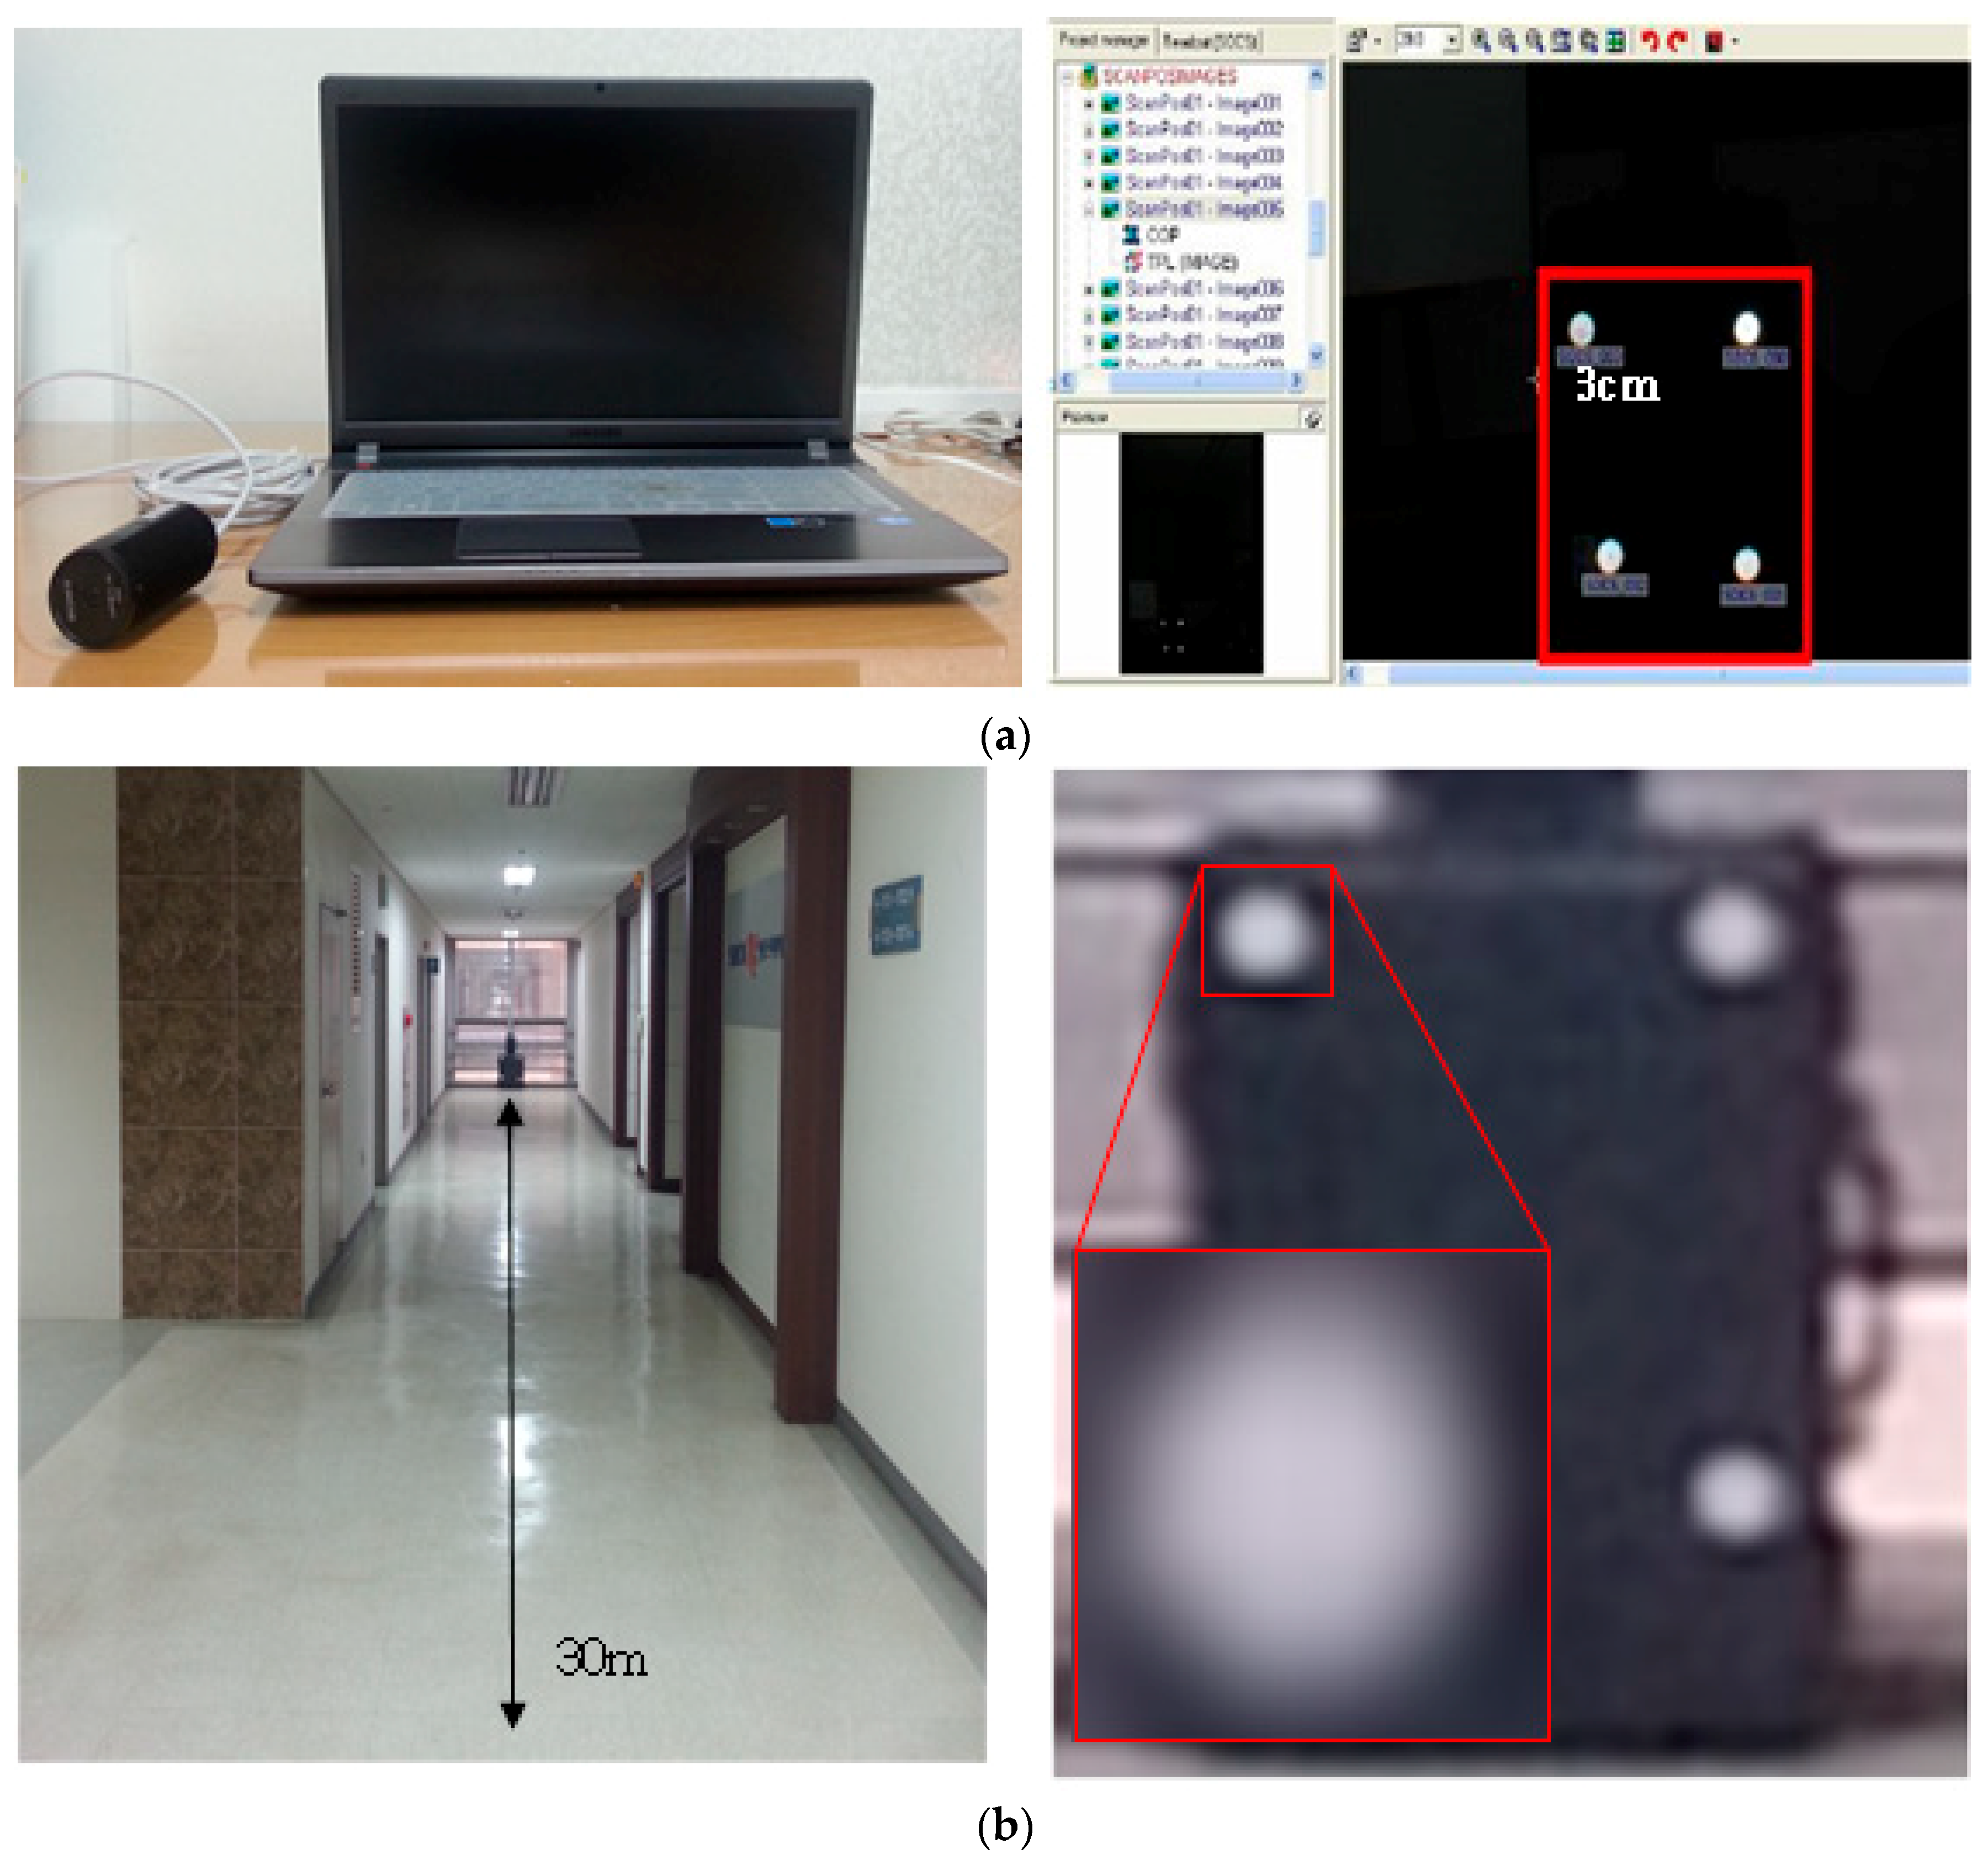
4.2. Assessing the GSD of the IP Camera

This experiment was performed to determine a proper distance for maintaining the spatial resolution (i.e., pixel size) of the texture information. To investigate its spatial resolution, ground-sampling distance (GSD) measured. GSD is distance between two successive pixel centers measured on the ground. This step is to improve the quality of low-rise building textures by adjusting the distances between the MMS and buildings.
To evaluate GSD, methods provided by the National Geographic Information Institute were used [47]. Article 15, Section 2 of the Implementation Regulations for Road Traffic Act of South Korea, lanes should have a width of ~3 m. Therefore, it was decided to use 30 m as the distance from the camera to the building in this study after considering the number of maximum traffic lanes (Figure 4b). An IP camera was connected to a laptop, and an object was photographed from 30 m away to confirm the resolution of the MMS. This process was implemented using RiscanPro [48], a commercial software that is calibrated for the digital camera. This module analyzes the resolution of images by identifying the reflection intensity of the reflector (Figure 4a). As illustrated in Figure 4b, the target (white dot) was represented without large-scale distortion, despite its small (3 cm) size and distance from the camera. In general, lens distortion depended on the object location; however, this assessment was necessary to assess the capabilities of the camera and determine proper distances to take pictures from a car.

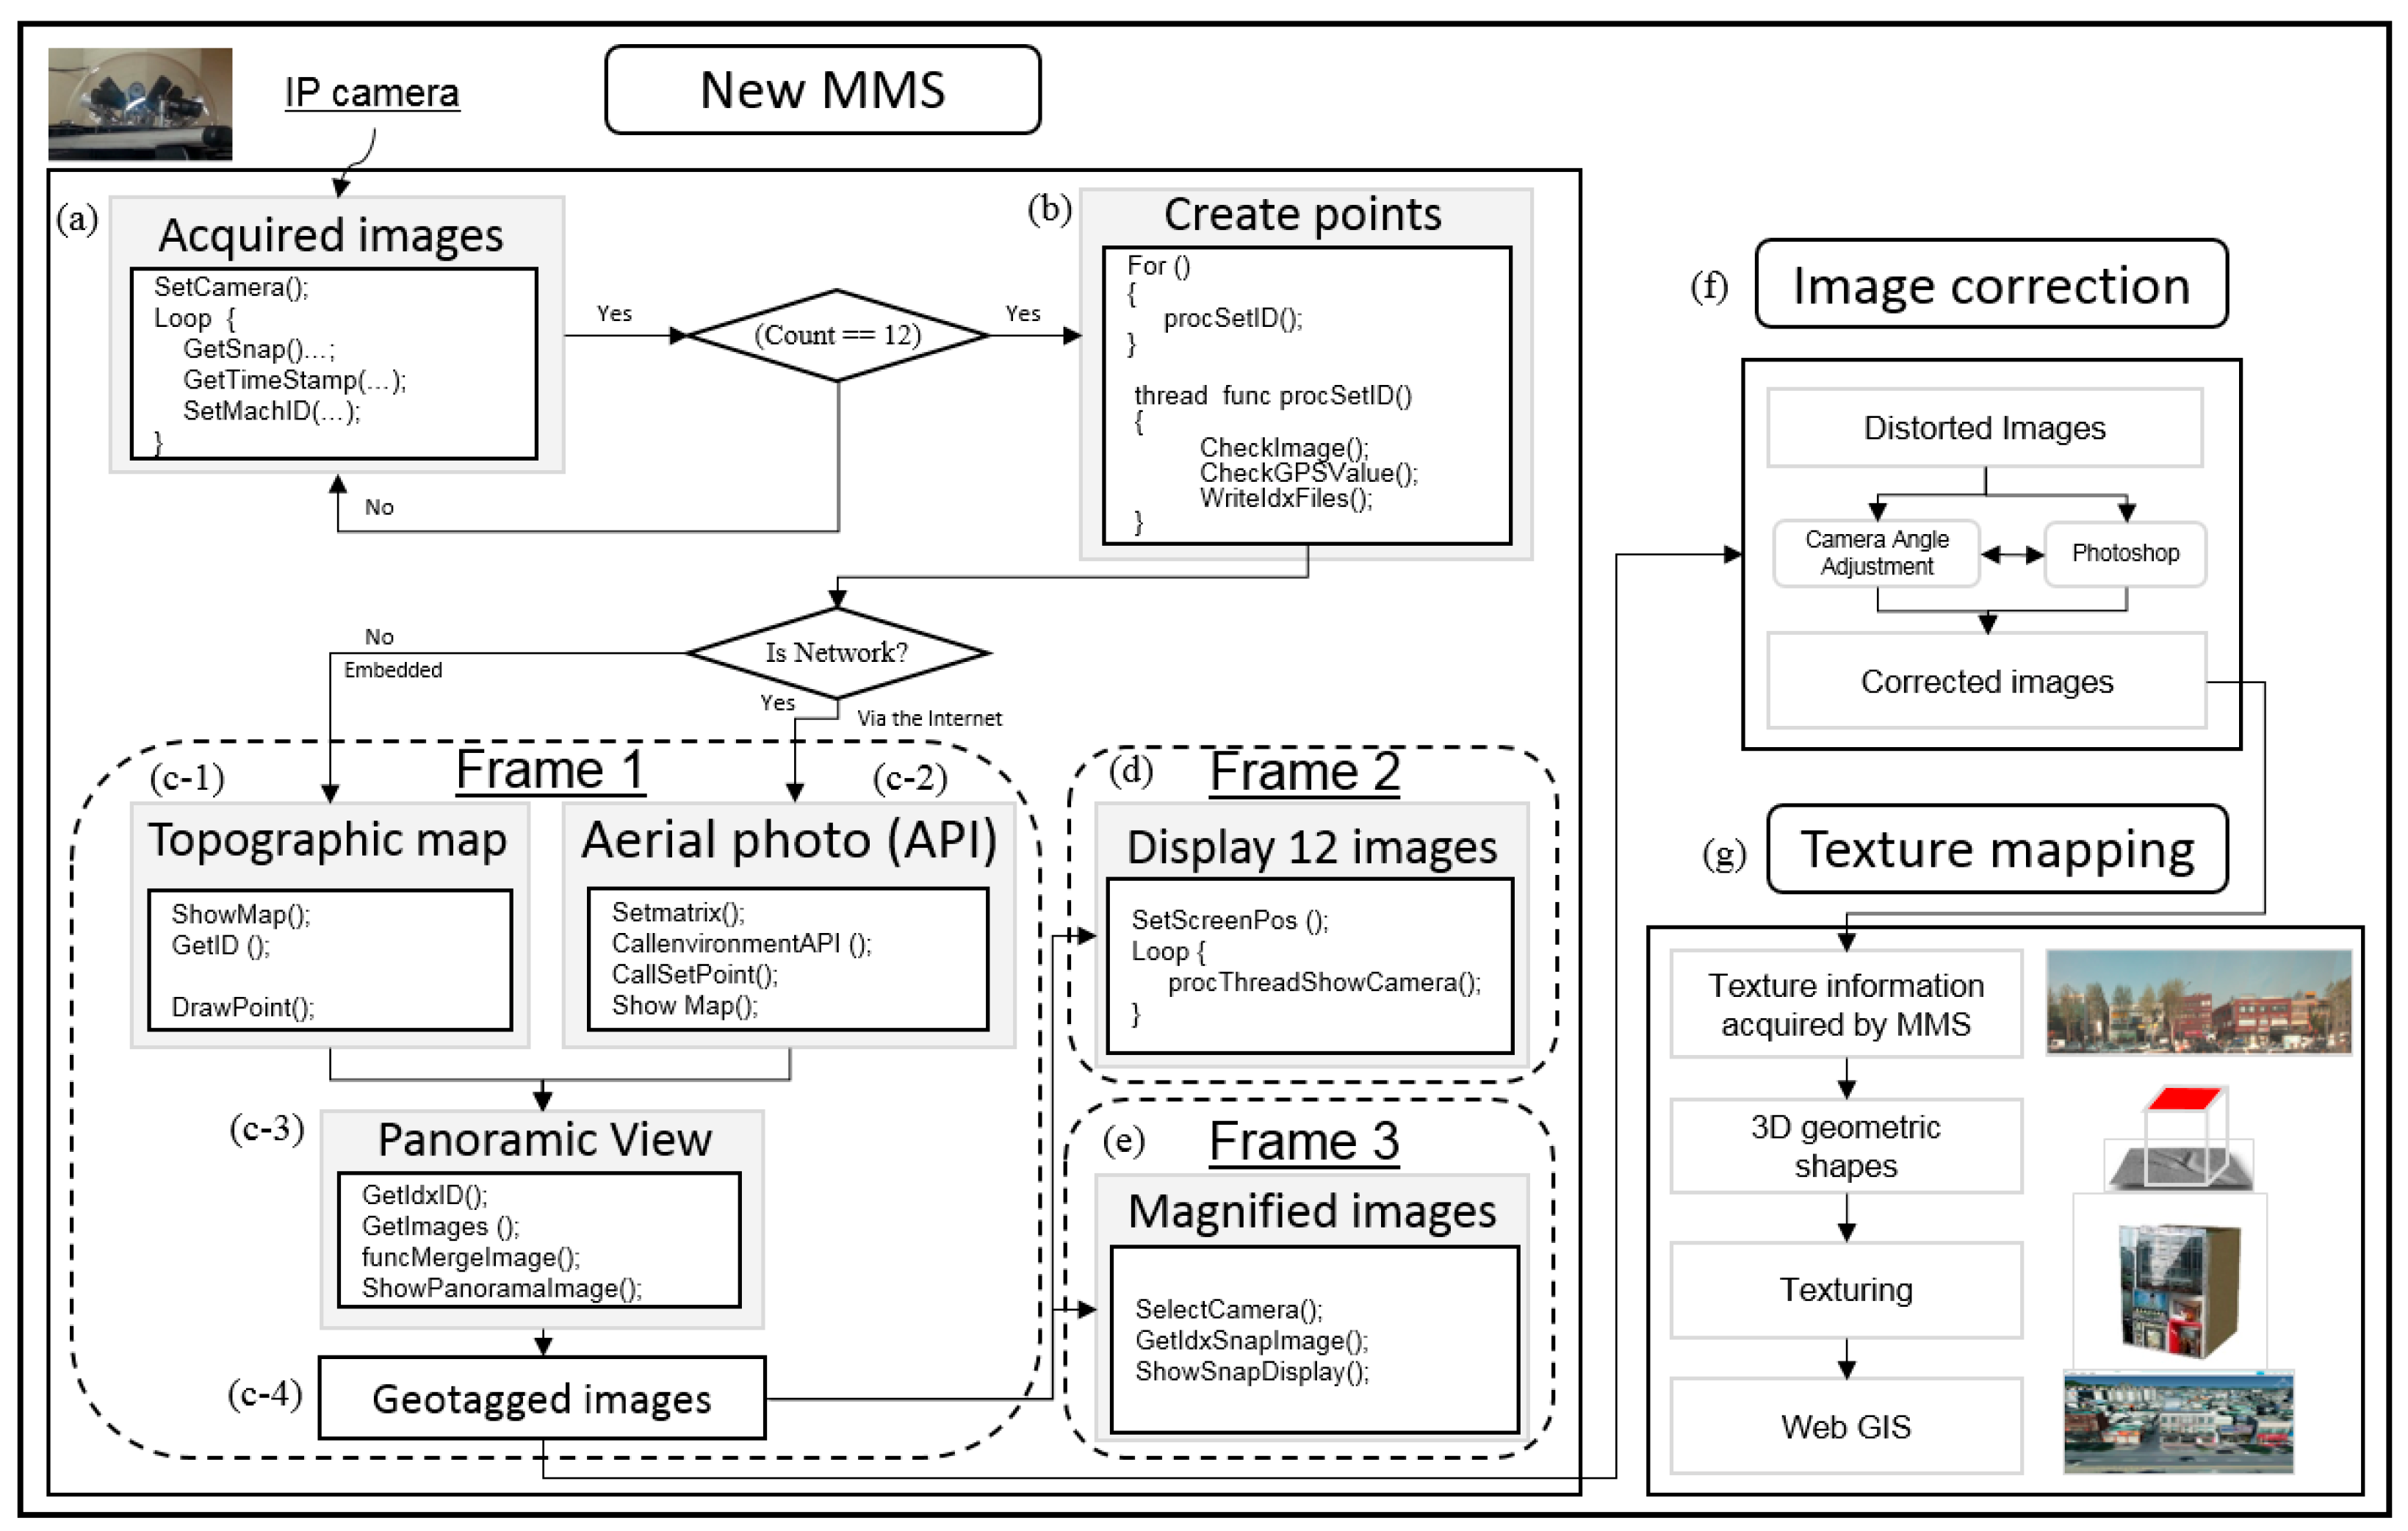
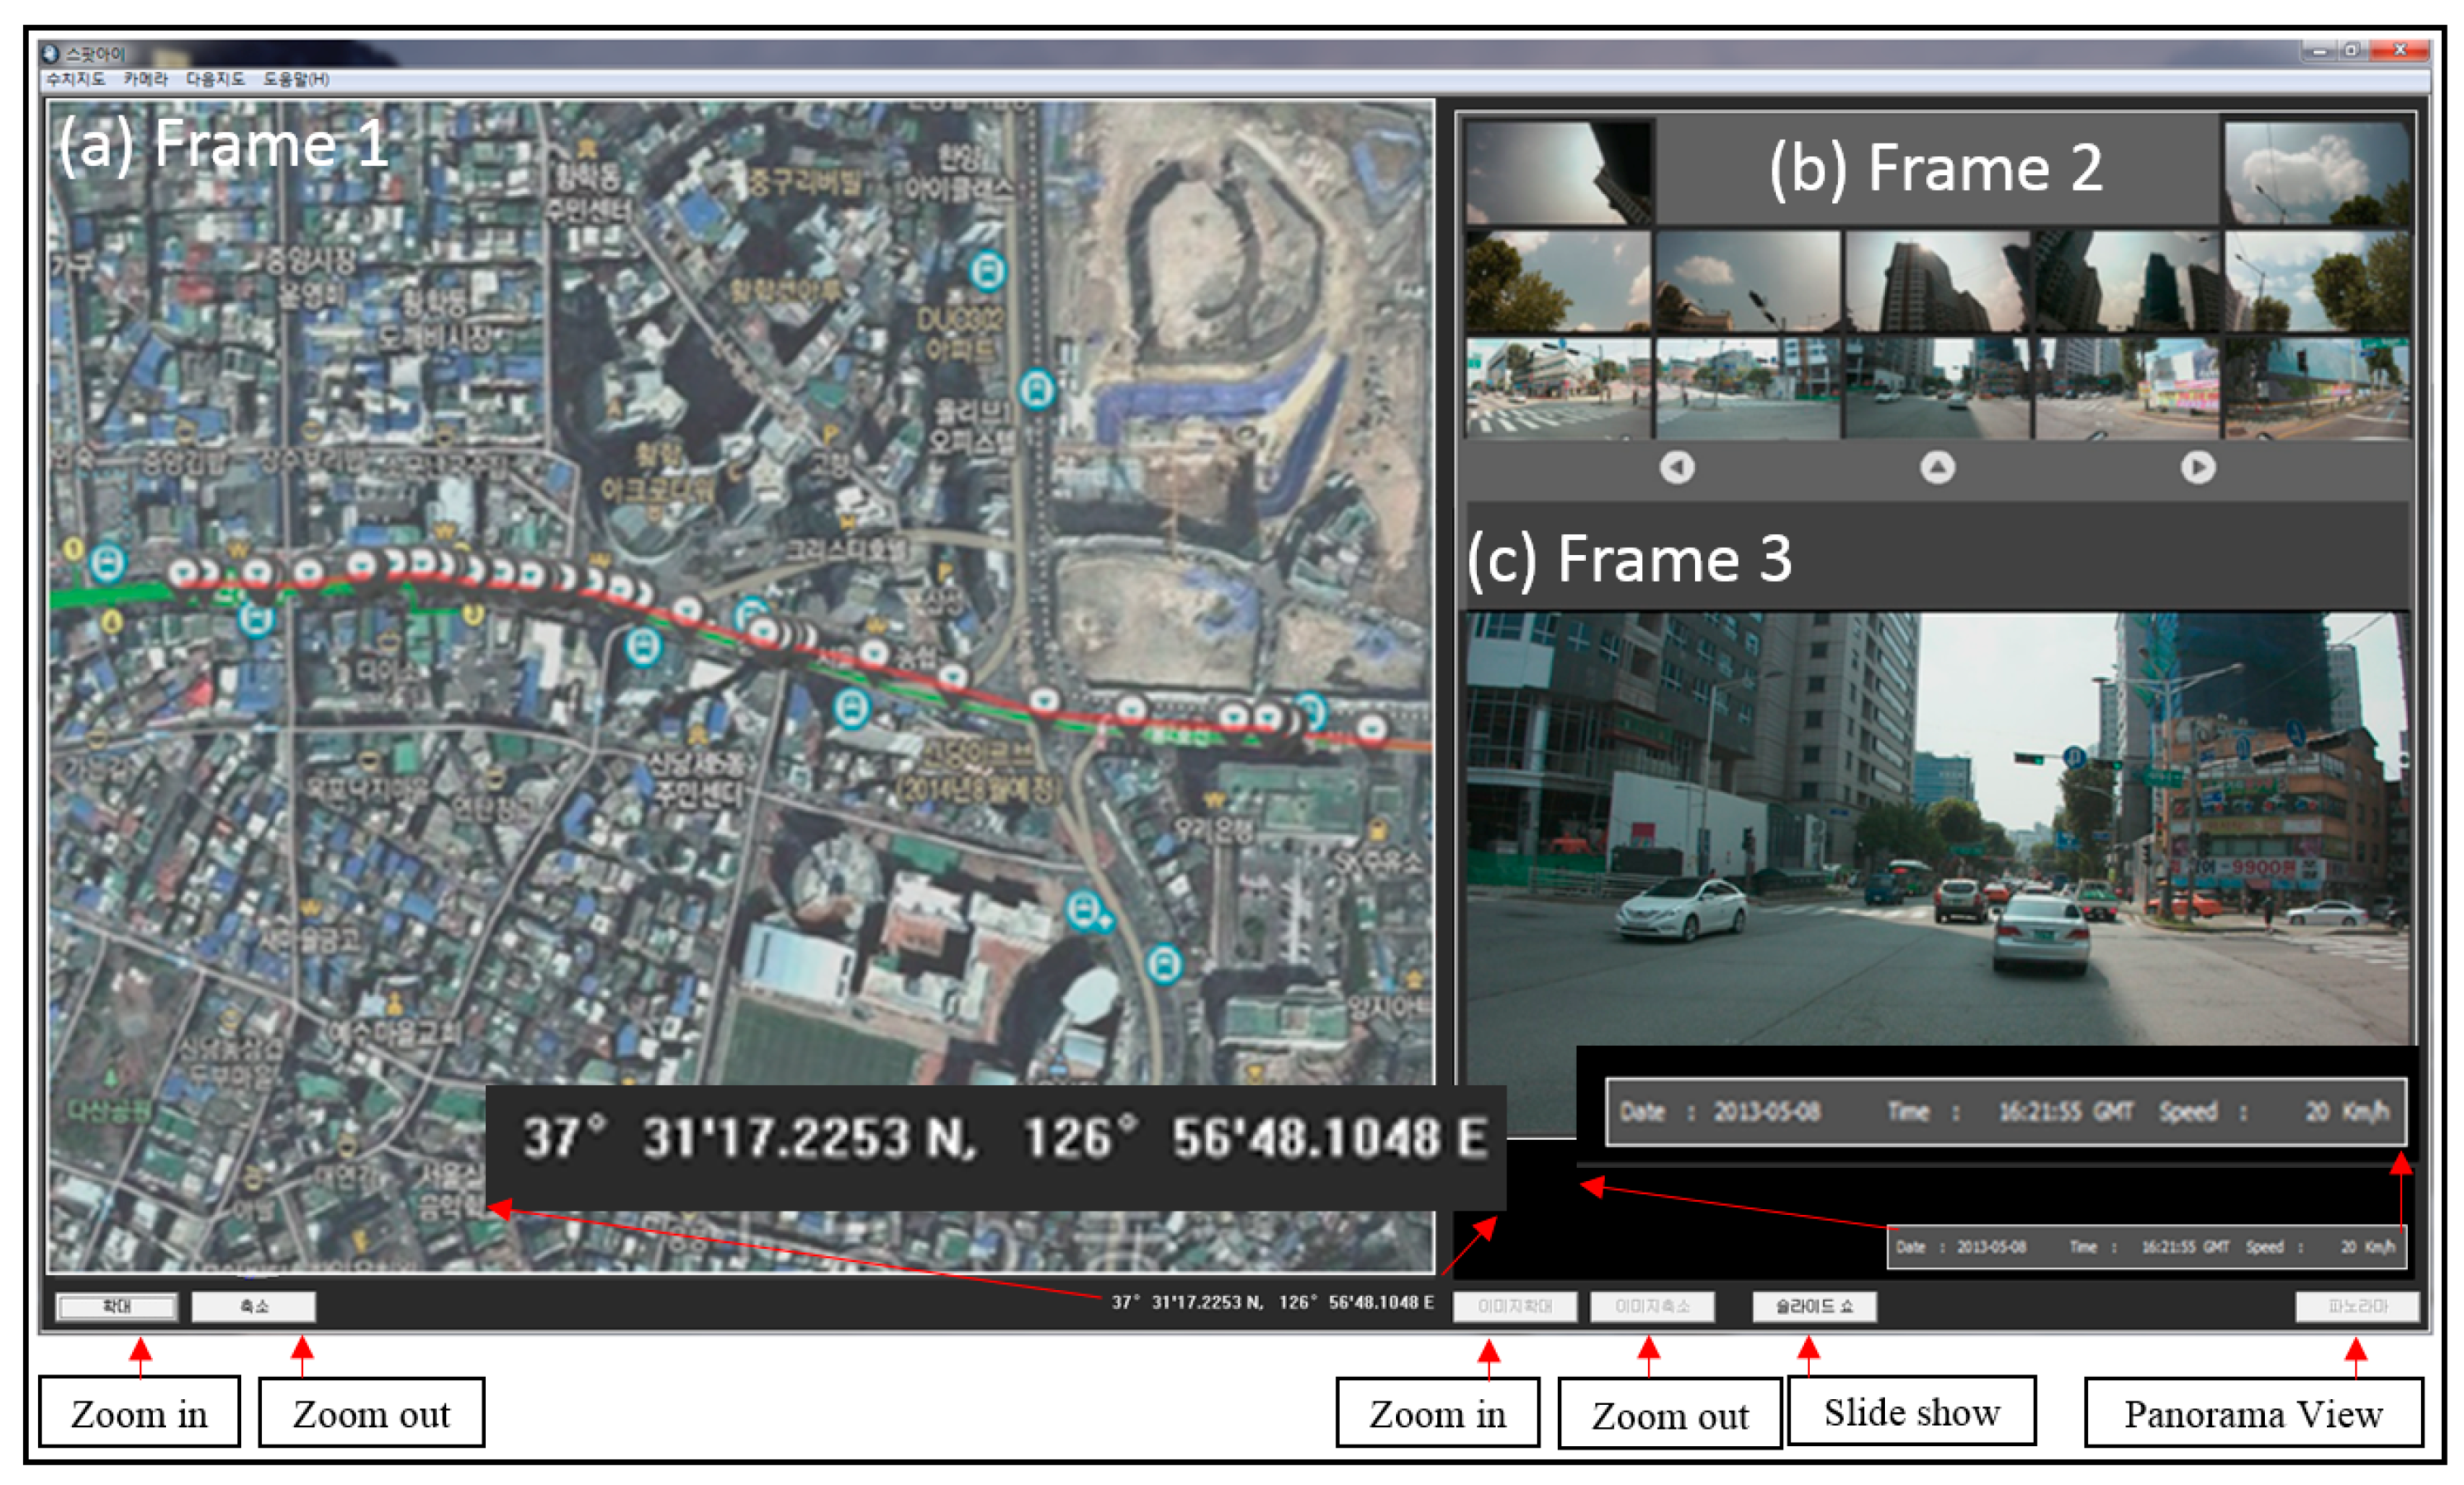
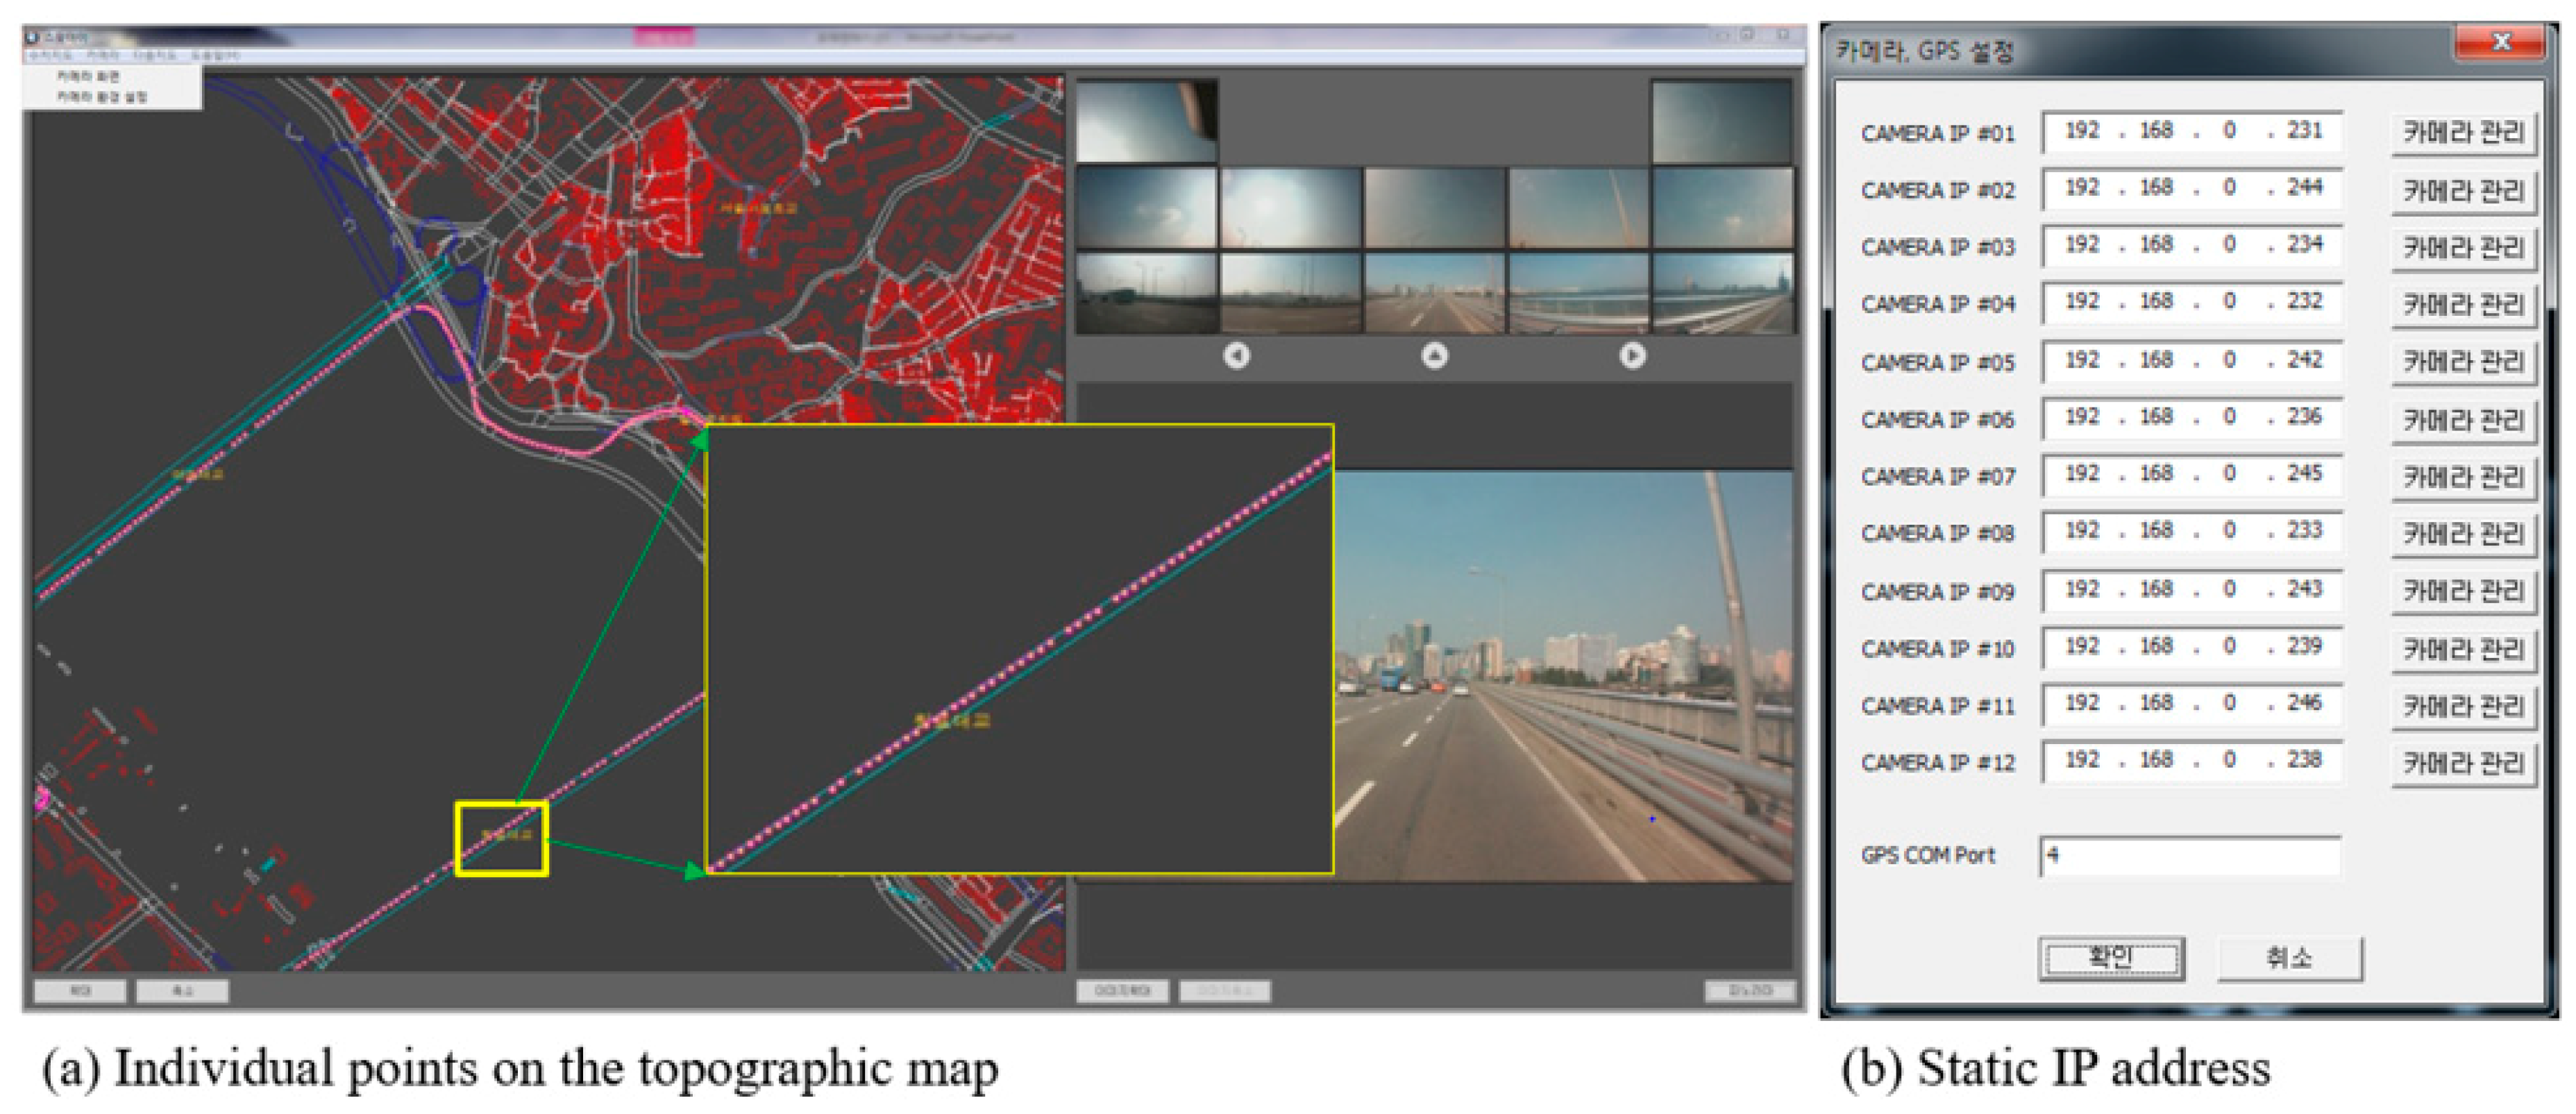
4.3. Programming Application for Automatic 3D Mapping: System Development

This research developed a new MMS to provide high-quality texture images and the system was programmed in C++. Figure 5 shows the programming algorithms for the new MMS system.
First, 12 sets of images were acquired from the IP cameras. These images incorporated into the system using the function, Getsnap, which allowed the images to be saved in the computer’s memory. The timestamps for the images were recorded using the function GetTimeStamp, and a photo ID# was given to each image until one image was acquired through each of the 12 IP cameras. This was repeated with the function Count==, defined as a parameter to computer 12 images (Figure 5a). The images were then matched with the geographical x, y, and z coordinates, which were acquired via the GPS receiver. The GPS antenna is located in the car and it is considered as the same locations of the 12 IP cameras. During this step, the function CheckImage for investigating errors of the images and CheckgpsValue, set to confirm the GPS values, were programmed. The function Writeidxfiles was used to enable the 12 images to match the GPS locations. In this process, the 12 images show the same x, y, and z with the same shooting time; moreover, the point features that represent the MMS trajectory were created (Figure 5b). The point features were then displayed on the two base maps (Figure 5(c-1) and Figure 2). If the MMS car had access to Wi-Fi, high-resolution aerial photos were transferred to the MMS. The point features were displayed on the aerial photos (Figure 6) with a spatial resolution of 50 cm. If the system is driving into areas where the Wi-Fi is not available, the point features are displayed on the digital topographic maps, referenced at a scale of 1/5000 (Figure 7). In this process, the functions Showmap and DrawPoint act to load the digital topographic maps and draw the point features in the base map (Figure 5c and Figure 1). The functions CallenvironmentAPI and CallSetPoint allow the aerial photos to be brought forward and the point features on the aerial photos to be displaced (Figure 5c and Figure 2). The next step is to create consecutive images, and the consecutive images are created using the function Funcmergeimage. It is then displayed with the function Showpanoramaimage on the base map (Figure 5c and Figure 3). In this stage, the 12 cameras can acquire geotagged images (Figure 5c and Figure 5) with GPS locations. Because the cameras are not concentric, panoramic images are not used for measuring tasks and require additional steps to correct distortion of the images. The images are displayed in the two frames as individuals (Figure 5d) or as a magnified image (Figure 5e). For these two frames, the functions Setscreenpos (used to display 12 images in the second frame), Selectcamera (which magnifies an image by the end user), and Gtidxsnaping (which can display the selected image) were relevant.
Figure 6 shows the new application interface programmed in C++, and the steps taken to correct the geotagged images and to texture the 3D geometric objects are introduced in Section 4.3.
Figure 6a shows a map of the vehicle traveling between 30 and 60 km/h from 1 PM to 2 PM on Toegye road in Sindang-dong, Seoul, South Korea. The red line denotes the route of vehicle movement, and the circles on the line indicate points where the images were taken. Images were taken every second, and the image points were recorded on high-resolution aerial photographs. The high-resolution aerial photographs are used as a base map in this study, and the spatial resolution was 50 cm. Furthermore, the aerial photographs are embedded into the Daum mapping service, a web portal in South Korea. In the software, 12 images from every point where images were taken were shown and enlarged to compare and analyze the image quality. A module was developed to create 12 geotagged images with GPS information, and aerial photographs that were available in the software package using Wi-Fi and a 1/5000-scale topographic map were used in areas with no Wi-Fi while the vehicle was moving.
The topographic map can be found in the application software using the menu bar. Figure 6a shows the individual points on the topographic map to indicate the trajectory of the vehicle as a whole, whereas Figure 6b shows the camera menu and has the static IP address and GPS port for each camera. The POE was used as a communication channel (incorporating internet technology) with a virtual internal IP assigned to each port of the POE. The signals were transmitted to the cameras through the POE.

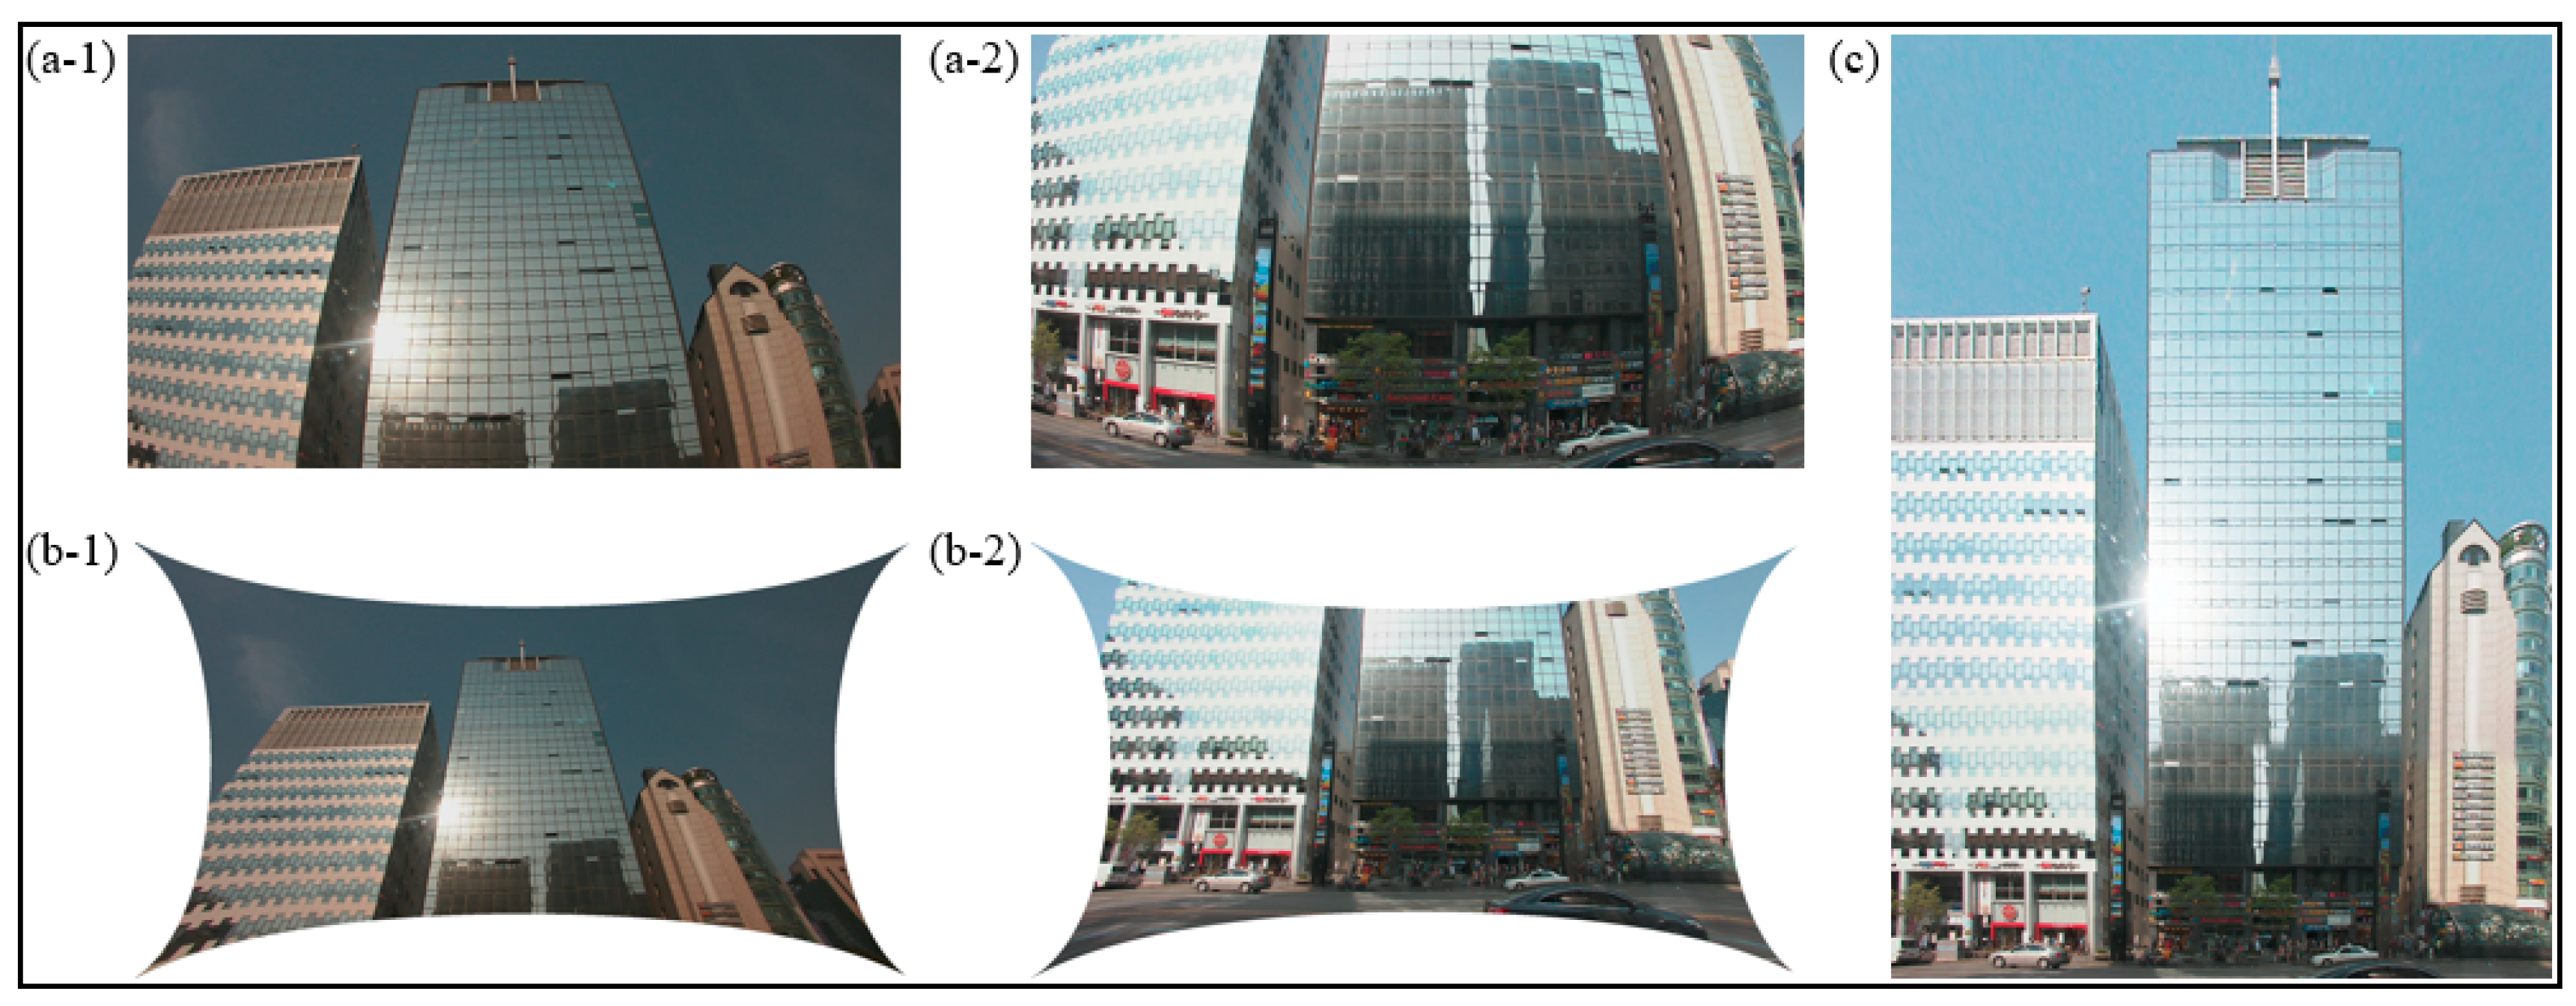
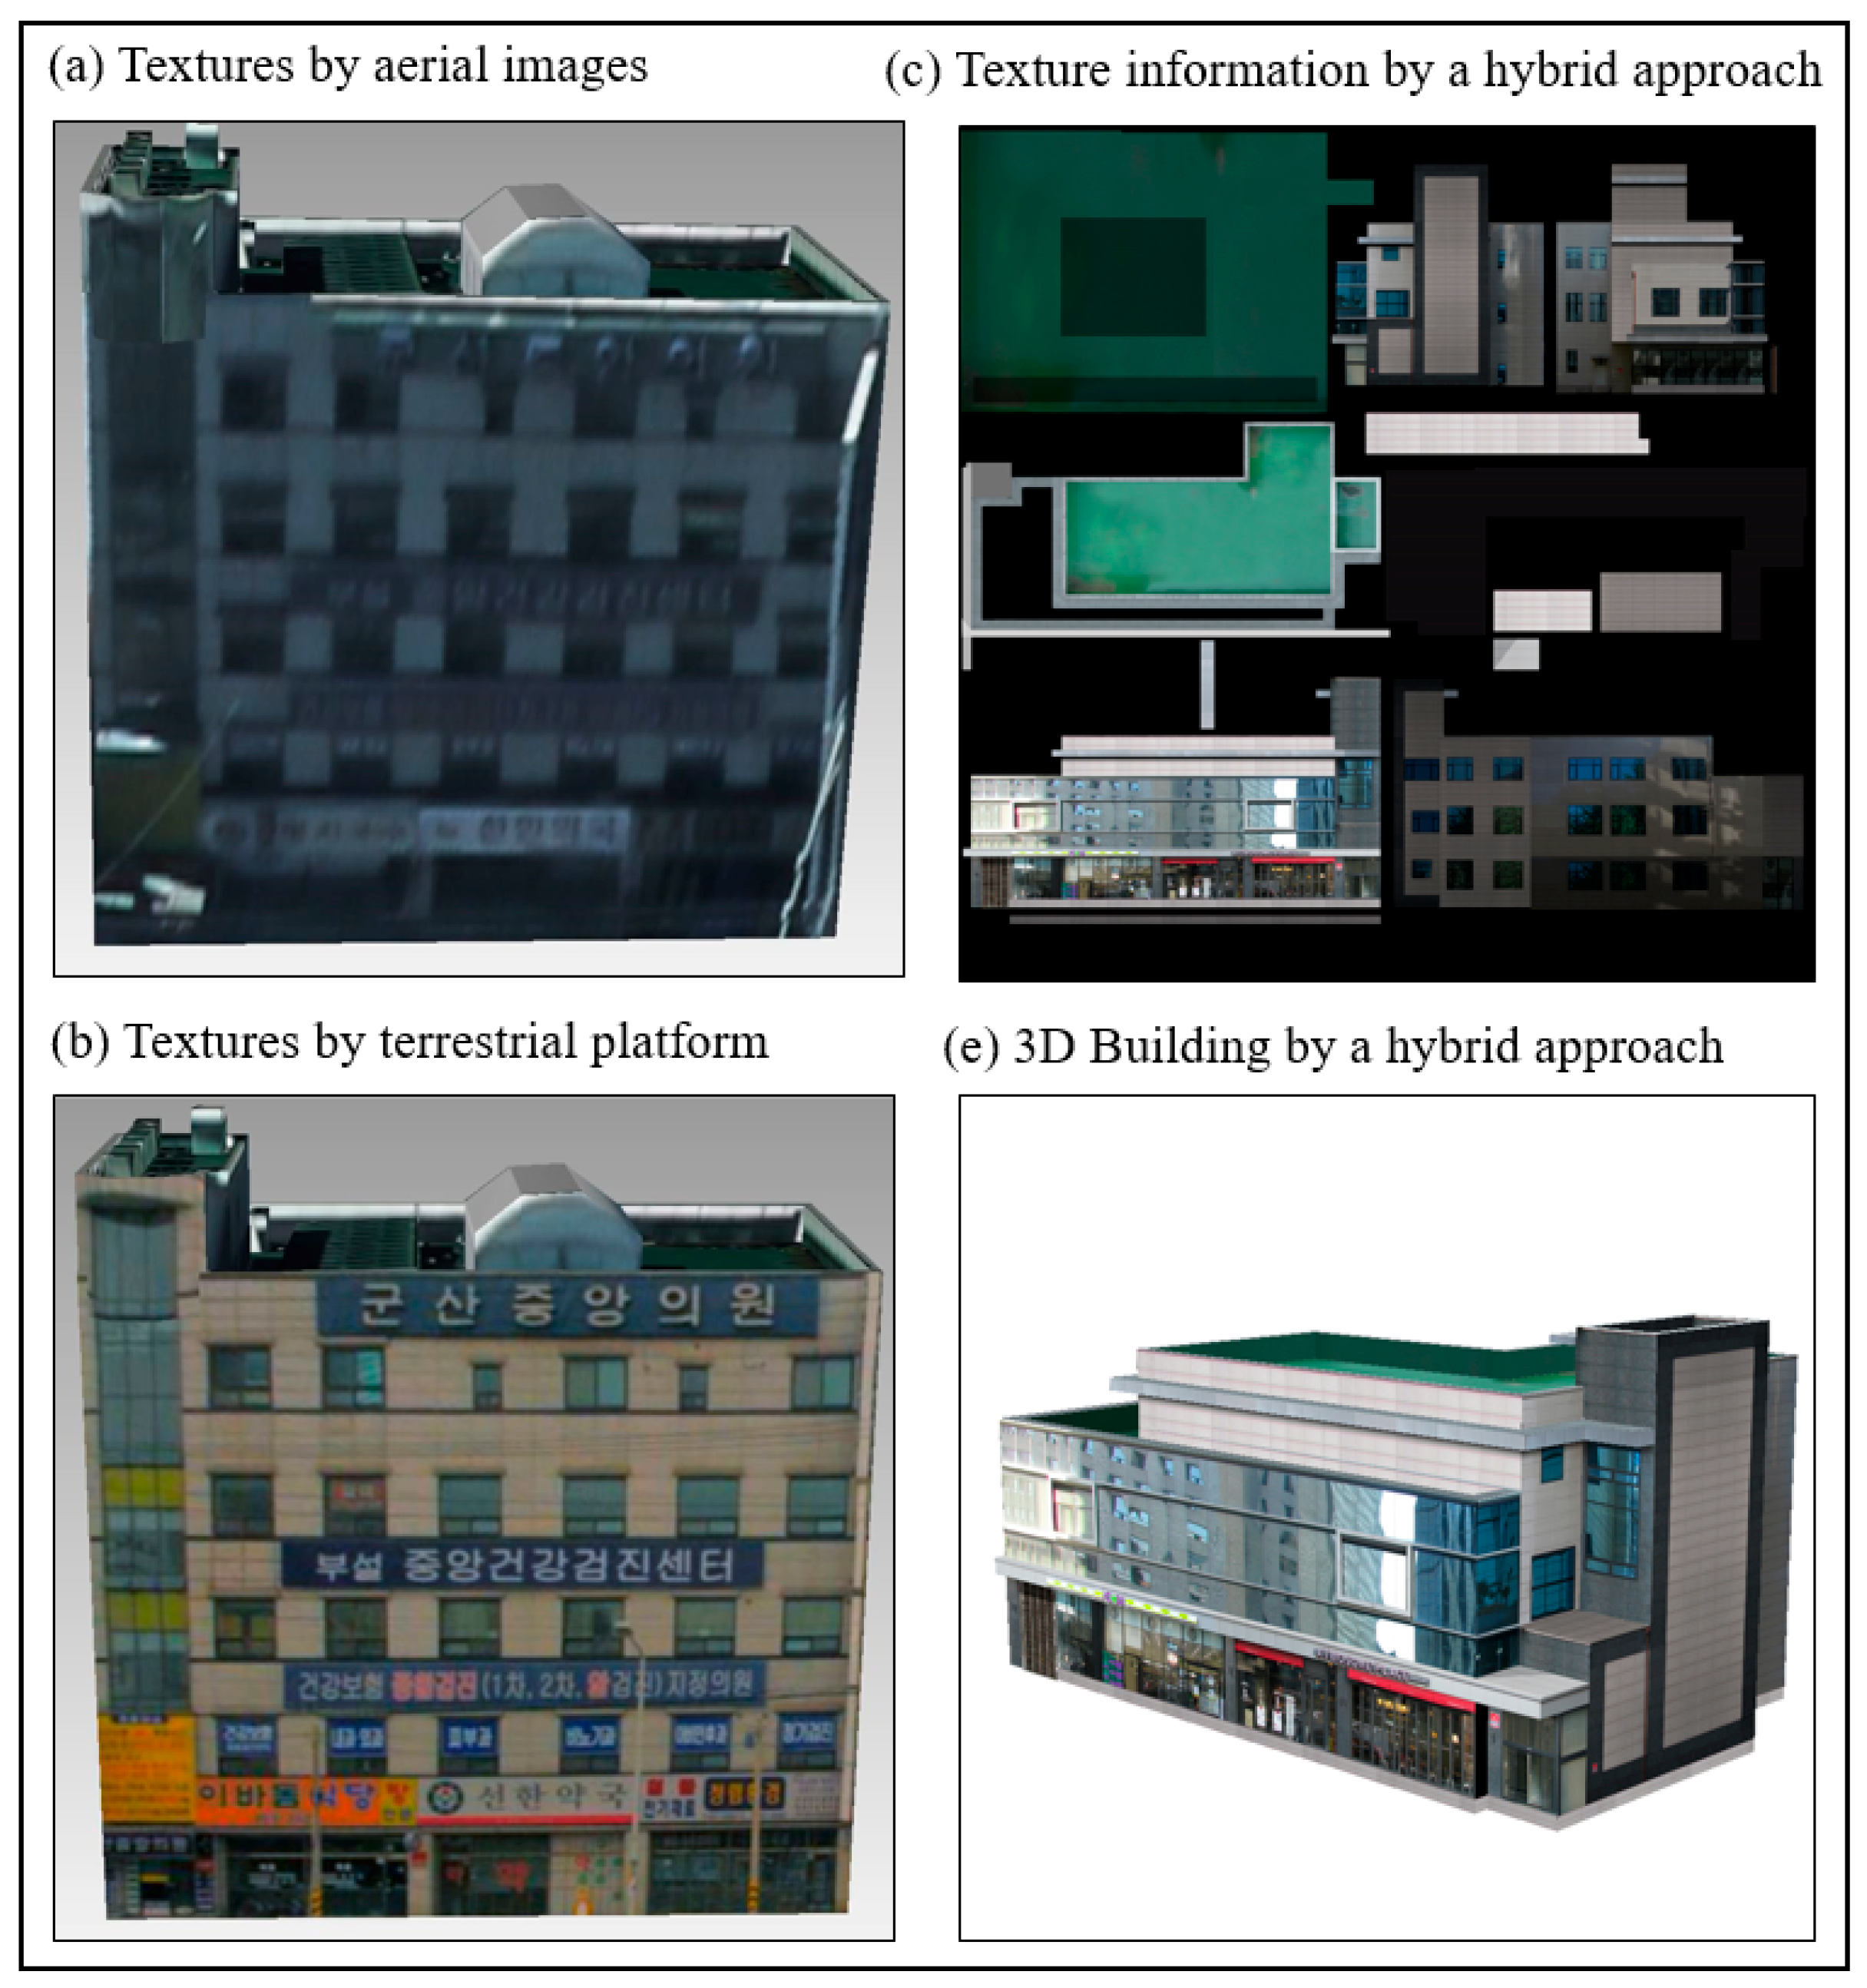
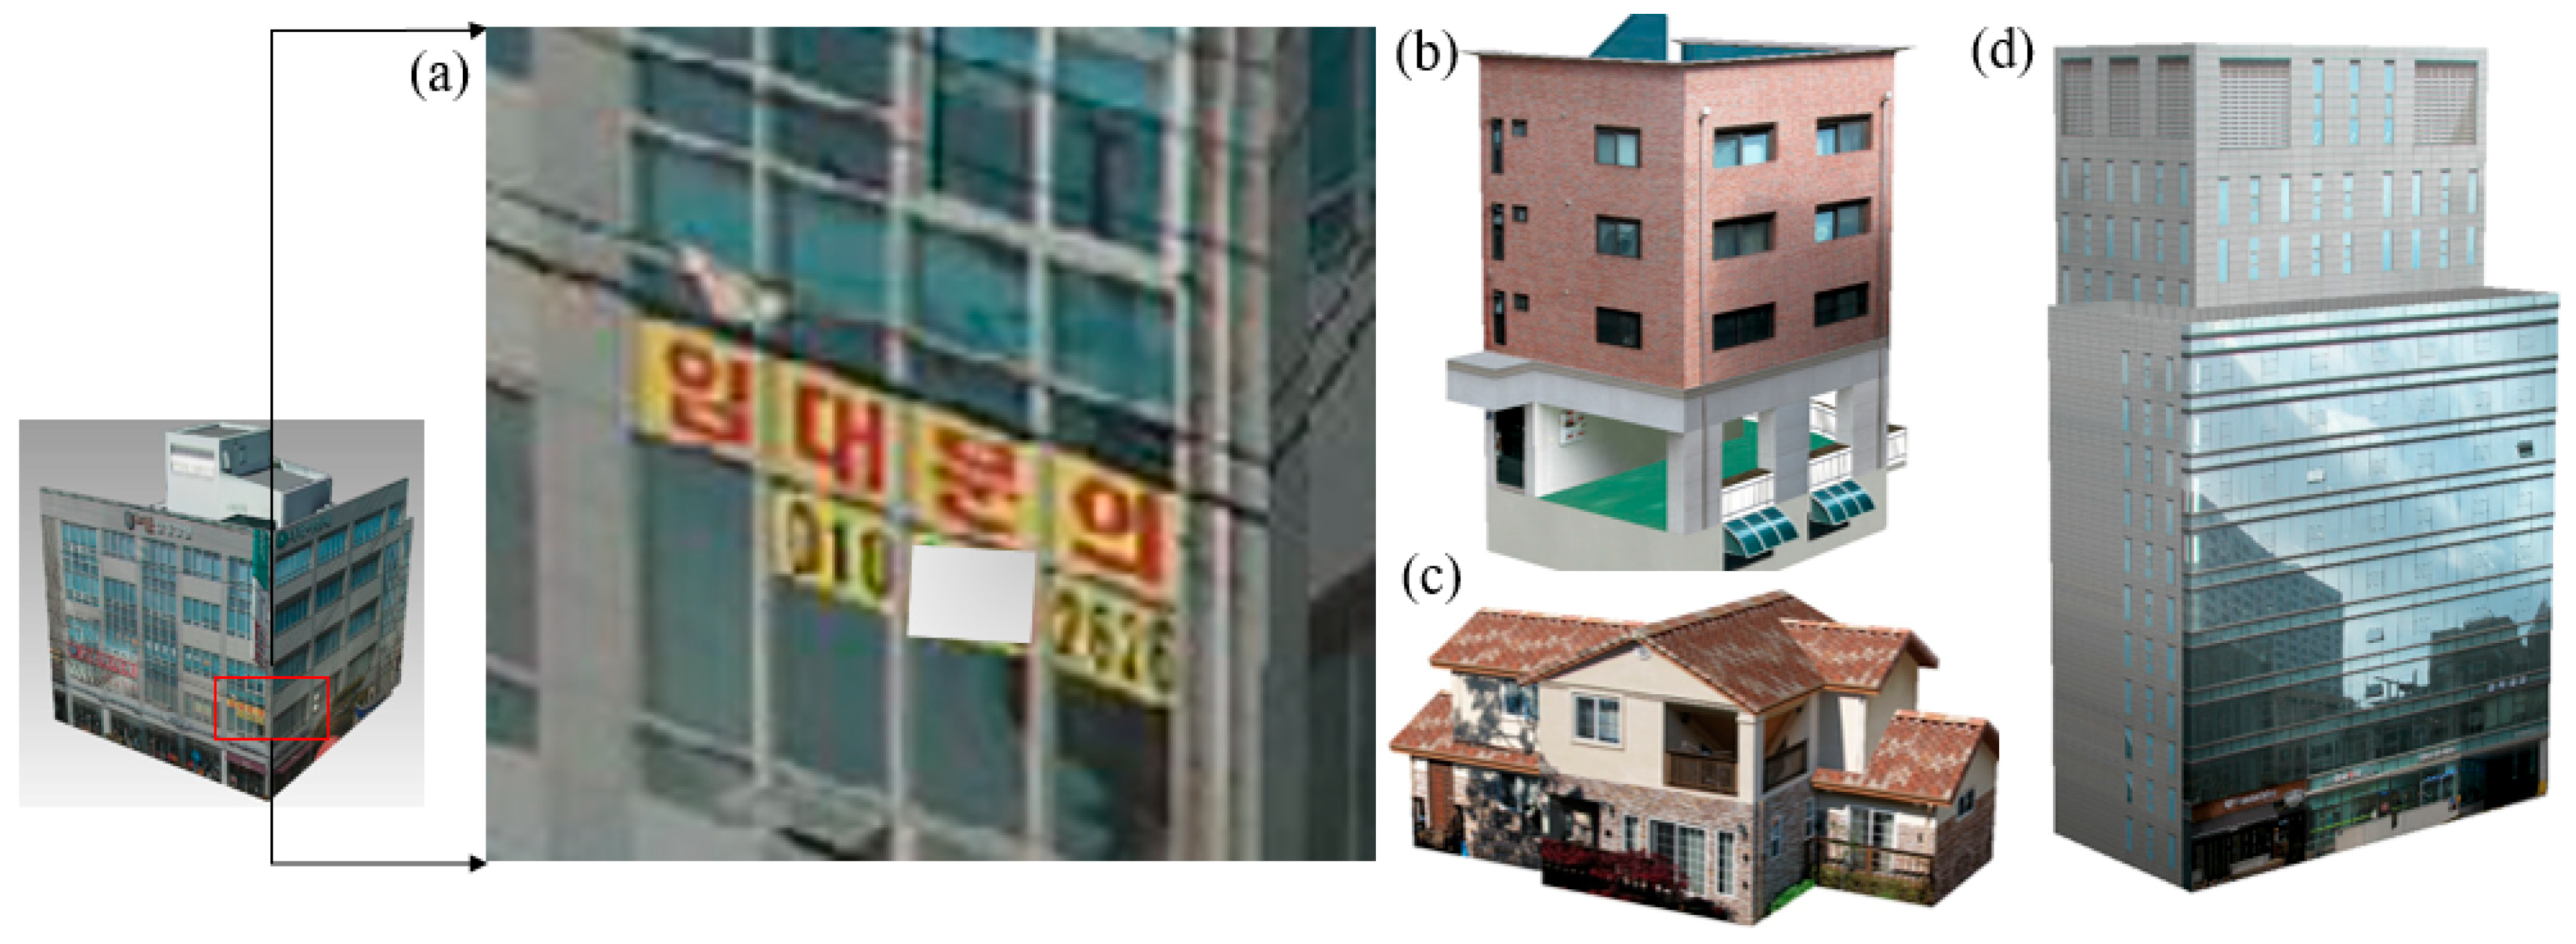
4.4. Processing Distorted Images from MMS and Comparison with 3D Textures from Aerial Photos

Figure 8 shows the process used to correct distorted texture images acquired from the new MMS.
Figure 8a indicates the original images and Figure 8b shows the distortion of acquired images from MMS. The distortion of the images appeared because of the properties of the lens, which is known as lens distortion. Distortion was increased at the edges of the images, and the empirical experiments performed in this study indicate that buildings taller than 10 stories or that were farther than a certain distance from the MMS device exhibited more serious distortion.
In general, aerial images exhibit a fisheye effect at their edges, which distorts the location of pixels. The distortion can be calibrated and adjusted to match the specifications of the particular camera. Note that the MMS cameras used in this study should be calibrated by the calibration parameters; however, this study manually corrects distortions of the images. Figure 8c shows an image of distortion correction. This image correction was conducted to adjust the image correction module in commercial software. The distorted images were analyzed with the naked eye and the specifications of the camera. To calibrate the fisheye effect in images, a grid was created based on the central point of the image. The fisheye effect in images was eliminated by moving the grid line up and down from side-to-side to set the line on the distorted point.

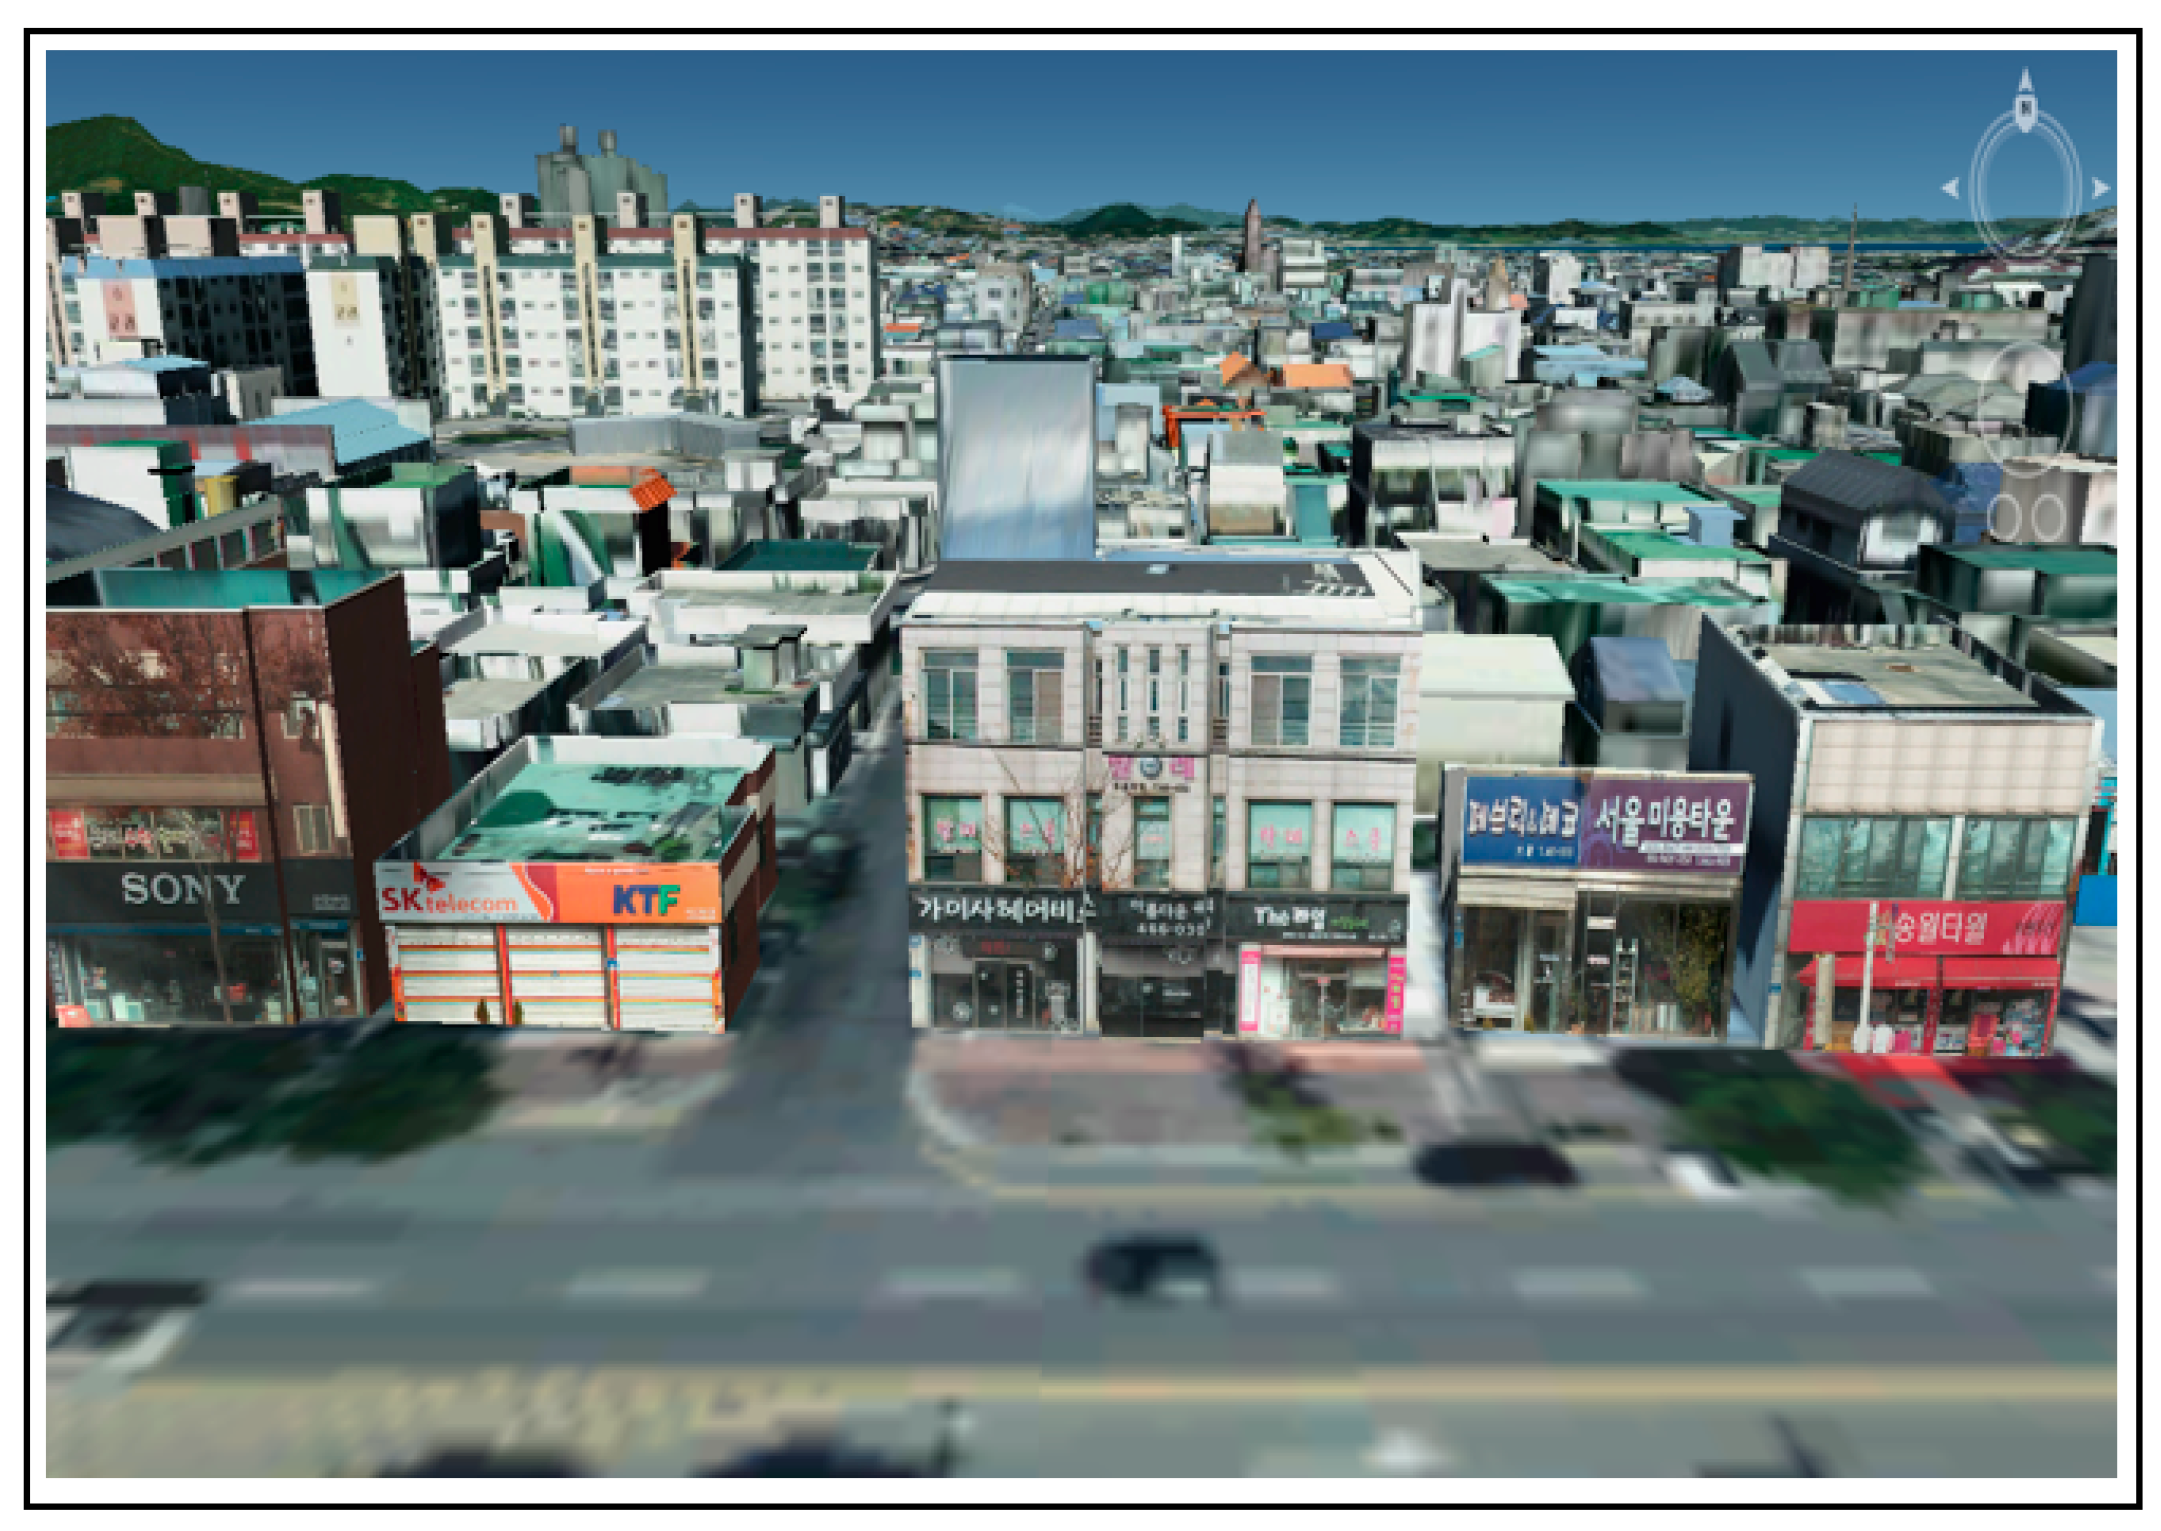
4.5. 3D Urban Models by Hybrid Approaches

High-resolution texture information was used to make 3D building models. However, the tops of the buildings and 3D geometric shapes could not be reconstructed using the MMS device, although high-resolution texture information of the buildings was acquired. Thus, ground-based MMS cannot detect building tops and produce 3D stereoscopic images of the terrain that are used to construct 3D geometric objects. Therefore, this project used a hybrid method, including aerial photographs, to reconstruct a 3D building model.
Figure 9 shows geometric shapes with textured images. To texture 3D objects, this study used an application developed by Dr. Lee, which automatically produced multiple aerial images for texture mapping and allowed a user to manually select the best-quality texture image [39]. Figure 9a shows the textured 3D building; however, the texture images for most low-level buildings have poor-quality textures and are blurry [39]. Thus, texture information on low-rise buildings (below the fifth floor) from the developed MMS was used to ensure high-quality results. This working process uses the same procedures as those developed by Dr. Lee. Note that on the 3D geometric objects, the texture information acquired from MMS is manually attached to the 3D buildings.
The development of 3D building models from the aerial images and the new MMS are shown in Figure 9a,b, respectively. The pixel size on the ground (GSD) of the camera is 2.9 cm at a height of 500 m and 6 cm at a height of 1000 m. The GSD of the aerial camera used in this study gives results that are more than twice as good as in a general 1/1000 digital map. In this study, the texture information for low-rise buildings is still hard to identify (Figure 9a) using the aerial approach adopted. However, the brand name and phone number on a sign was identified through the MMS system (Figure 9c). For the results of the 3D building models, aerial images were used because MMS is not appropriate for obtaining the texture information of building tops. Figure 9e shows much improved output after polishing the image and the 3D object in the lab.

5. Discussion

As demand on GIS-based 3D city model applications grow, a number of studies investigating 3D city models have been conducted. The process for a 3D city model is expensive, labor-intensive, and tedious; moreover, it requires a hybrid approach to ensure the quality of 3D texture mapping. In this study, a new MMS system and application software are developed for automated 3D texture mapping. In particular, this study developed a new MMS to acquire high-quality texture information for 3D building modeling and to create a hybrid approach for producing an automated 3D building model to improve the spatial perceptions of the urban area among the public. Thus, it is important that a mapping car that can be made available at a low price point, which was used to collect high-quality texture information on 3D buildings, and the application was developed for the MMS. Finally, high-quality 3D building models were temporally published on the web (Figure 11). An MMS, involving containing a vehicle and the application software, helped extrapolate the results of the work.
As shown in Figure 10, high-quality 3D textures of low-, middle-, and high-rise buildings were produced by the MMS developed in this study. As shown in Figure 10a, a phone number printed on a sign on the front of a building can be in a camera image. Other examples in Figure 10b–d show excellent results of high-quality texture information for 3D building models.
Despite recent advances, this study determined certain limitations of the new MMS. First, much distortion occurs in the textured images of high-rise buildings. In particular, the buildings of over 10 stories exhibited several problems, although buildings that were <10 stories tall showed little distortion on their edges. Furthermore, the MMS could not create textured images for the tops of building. Thus, airborne remote sensing techniques are necessary and should be used together, although the cost for the 3D city models is high. Second, in this study, steps were taken to correct distorted images and build 3D geometric objects. In a 3D city model that covers a sufficiently wide area, this study concluded that an automated system, including terrestrial and airborne sensors, should be developed to save processing and working times as well as cost. Thus, subsequent research should focus on developing an integrated and automated 3D city model. Furthermore, future study will need to use an unmanned aerial vehicle that can generate higher image quality of 3D building models with 3D geometric objects.
Figure 11 shows a 3D city model for Kunsan-si, Chollabuk-do, South Korea, developed during the course of this study. The information for this 3D city model was placed at the top of DEMs and was temporally released on the web to serve the public. The textural information has high-quality resolution, sufficient to identify brand names on signs. Moreover, phone numbers are easily readable in the enlarged images, which means urban planners and consumers can easily estimate the size and depth of geometric objects. Eventually, the special perception of geographic objects will become enhanced.

6. Conclusions

This study developed an MMS program that extracts textured images of a 3D building. It was found that high-quality textured 3D building models can be produced at low cost. This study can support urban planners and consumers to improve their spatial perception and awareness of urban areas. In the long term, it is hoped that this work will help the public or increase community-engaged participation for additional urban planning. In the future, studies will need to develop a hybrid 3D mapping system with unmanned aerial vehicles bearing 3D mapping systems.

Funding

This research received no external funding.

Acknowledgments

Jungil Lee, who is a director of the Center for Geospatial Research and Development, has provided images and helped evaluate and test outputs of this research; although he has contributed a lot to this project, he decided not to be a coauthor. Moreover, Doori Oh, a PhD candidate at the University of Georgia, helped in reviewing the project-related work. I would like to acknowledge with gratitude those individuals who successfully helped complete this project.

Conflicts of Interest

No potential conflict of interest are declared by the authors.

References

  1. Yang, B. GIS based 3-D landscape visualization for promoting citizen’s awareness of coastal hazard scenarios in flood prone tourism towns. Appl. Geogr. 2016, 76, 85–97. [Google Scholar] [CrossRef]
  2. Yang, B.; Lee, J. Improving accuracy of automated 3-D building models for smart cities. Int. J. Digit. Earth 2017, 12, 209–227. [Google Scholar] [CrossRef]
  3. Grün, A.; Baltsavias, E.; Henricsson, O. Automatic Extraction of Man-Made Objects from Aerial and Space Images (II); Birkhäuser Verlag: Basel, Switzerland, 1997. [Google Scholar]
  4. Grün, A.; Kuebler, O.; Agouris, P. Automatic Extraction of Man-Made Object from Aerial and Space Images; Birkhäuser Verlag: Basel, Switzerland, 1995. [Google Scholar]
  5. De la Losa, A.; Cervelle, B. 3D topological modeling and visualization for 3D GIS. Comput. Graph. 1999, 23, 469–478. [Google Scholar] [CrossRef]
  6. Gamba, P.; Houshmand, B.; Saccani, M. Detection and extraction of buildings from interferometric SAR data. IEEE Trans. Geosci. Remote Sens. 2000, 38, 611–617. [Google Scholar] [CrossRef] [Green Version]
  7. Xiao, J.; Gerke, M.; Vosselman, G. Building extraction from oblique airborne imagery based on robust façade detection. ISPRS J. Photogramm. Remote Sens. 2012, 68, 56–68. [Google Scholar] [CrossRef]
  8. Wang, R. 3D building modeling using images and LiDAR: A review. Int. J. Image Data Fusion 2013, 4, 273–292. [Google Scholar] [CrossRef]
  9. Lafarge, F.; Mallet, C. Creating large-scale city models from 3D-point clouds: A robust approach with hybrid representation. Int. J. Comput. Vis. 2012, 99, 69–85. [Google Scholar] [CrossRef]
  10. Turlapaty, A.; Gokaraju, B.; Du, Q.; Younan, N.H.; Aanstoos, J.V. A hybrid approach for building extraction from spaceborne multi-angular optical imagery. IEEE J. Sel. Top. Appl. Earth Obs. Remote Sens. 2012, 5, 89–100. [Google Scholar] [CrossRef]
  11. Sun, S.; Salvaggio, C. Aerial 3D building detection and modeling from airborne LiDAR point clouds. IEEE J. Sel. Top. Appl. Earth Obs. Remote Sens. 2013, 6, 1440–1449. [Google Scholar] [CrossRef]
  12. Haala, N.; Martin, K. An update on automatic 3D building reconstruction. ISPRS J. Photogramm. Remote Sens. 2010, 65, 570–580. [Google Scholar] [CrossRef]
  13. Nebiker, S.; Susanne, B.; Martin, C. Rich point clouds in virtual globes—A new paradigm in city modeling? Comput. Environ. Urban Syst. 2010, 34, 508–517. [Google Scholar] [CrossRef]
  14. Barber, D.; Jon, M.; Sarah, S.V. Geometric validation of a ground-based mobile laser scanning system. ISPRS J. Photogramm. Remote Sens. 2008, 63, 128–141. [Google Scholar] [CrossRef]
  15. Frueh, C.; Avideh, Z. Constructing 3d city models by merging ground-based and airborne views. In Proceedings of the 2003 IEEE Computer Society Conference on Computer Vision and Pattern Recognition, Madison, WI, USA, 16–22 June 2003; p. II-562. [Google Scholar]
  16. Hammoudi, K.; Fadi, D.; Nicolas, P. Extracting building footprints from 3D point clouds using terrestrial laser scanning at street level. In Proceedings of the 2009 Workshop on ISPRS/CMRT09, Paris, France, 3–4 September 2009; Volume 38, pp. 65–70. [Google Scholar]
  17. Yang, B.; Song, H.; Kim, J. Developing a Reinforced Heritagescape using GIScience: A Case Study of Gyeongju. South Korea. Int. J. Tour. Sci. 2010, 10, 1–34. [Google Scholar] [CrossRef]
  18. Cornelis, N.; Bastian, L.; Kurt, C.; Luc, V.G. 3d urban scene modeling integrating recognition and reconstruction. Int. J. Comput. Vis. 2008, 78, 121–141. [Google Scholar] [CrossRef]
  19. Tao, C.V. Mobile mapping technology for road network data acquisition. J. Geospat. Eng. 2000, 2, 1–14. [Google Scholar]
  20. Kumar, P.; Conor, P.; McElhinney, P.L.; Timothy, M. Automated road markings extraction from mobile laser scanning data. Int. J. Appl. Earth Obs. Geoinf. 2014, 32, 125–137. [Google Scholar] [CrossRef] [Green Version]
  21. Jaakkola, A.; Juha, H.; Antero, K.; Yu, X.W.; Harri, K.; Matti, L.; Yi, L. A low-cost multi-sensoral mobile mapping system and its feasibility for tree measurements. ISPRS J. Photogramm. Remote Sens. 2010, 65, 514–522. [Google Scholar] [CrossRef]
  22. Mustafa, A.; Zhang, X.W.; Aliaga, D.G.; Bruwier, M.; Nishida, G.; Dewals, B.; Erpicum, S.; Archambeau, P.; Pirotton, M.; Teller, J. Procedural generation of flood-sensitive urban layouts. Environ. Plan. B 2018. [Google Scholar] [CrossRef]
  23. El-Halawany, S.I.; Derek, D.L. Detecting road poles from mobile terrestrial laser scanning data. GISci. Remote Sens. 2013, 50, 704–722. [Google Scholar] [CrossRef]
  24. Kremer, J.; Hunter, G. Performance of the StreetMapper mobile LiDAR mapping system in “real world” projects. Photogramm. Week 2007, 7, 215–225. [Google Scholar]
  25. Novak, K. Mobile mapping technology for GIS data collection. Photogramm. Eng. Remote Sens. 1995, 61, 493–501. [Google Scholar]
  26. Li, R.; Chapman, A.; Qian, L.; Xin, Y.; Tao, C. Mobile mapping for 3D GIS data acquisition. Int. Arch. Photogramm. Remote Sens. 1996, 31, 232–237. [Google Scholar]
  27. El-Sheimy, N.A.S.E.R.; Klaus, P.S. Navigating urban areas by VISAT—A mobile mapping system integrating GPS/INS/digital cameras for GIS applications. Navigation 1998, 45, 275–285. [Google Scholar] [CrossRef]
  28. Novak, K.; Bossler, J.D. Development and application of the highway mapping system of Ohio State University. Photogramm. Rec. 1995, 15, 123–134. [Google Scholar] [CrossRef]
  29. Karimi, H.A.; Grejner-Brzezinska, D.A. GQMAP: Improving performance and productivity of mobile mapping systems through GPS quality of service. Cartogr. Geogr. Inf. Sci. 2004, 31, 167–177. [Google Scholar] [CrossRef]
  30. Hunter, G.; Cox, C.; Kremer, J. Development of a commercial laser scanning mobile mapping system–StreetMapper. Int. Arch. Photogramm. Remote Sens. Spat. Inf. Sci. 2006, 36, 17–18. [Google Scholar]
  31. Anguelov, D.; Carole, D.; Daniel, F.; Christian, F.; Stéphane, L.; Richard, L.; Abhijit, O.; Vincent, L.; Josh, W. Google Street View: Capturing the World at Street Level. Computer 2010, 43, 32–38. [Google Scholar] [CrossRef]
  32. Vincent, L. Taking online maps down to street level. Computer 2007, 40, 118–120. [Google Scholar] [CrossRef]
  33. Noah, S.; Seitz, S.M.; Szeliski, R. Photo tourism: Exploring photo collections in 3D. ACM Trans. Graph. 2006, 25, 835–846. [Google Scholar]
  34. Frome, A.; German, C.; Ahmad, A.; Marco, Z.; Bo, W.; Alessandro, B.; Hartwig, A.; Hartmut, N.; Vincent, L. Large-scale privacy protection in google street view. In Proceedings of the 2009 IEEE 12th International Conference on Computer Vision, Kyoto, Japan, 29 September–2 October 2009; pp. 2373–2380. [Google Scholar] [CrossRef]
  35. Carrino, F.; Tscherrig, J.; Mugellini, E.; Khaled, A.O.; Ingold, R. Head-computer interface: A multimodal approach to navigate through real and virtual worlds. In Human-Computer Interaction. Interaction Techniques and Environments; Springer: Berlin/Heidelberg, Germany, 2011; pp. 222–230. [Google Scholar]
  36. Haala, N.; Michael, P.; Jens, K.; Graham, H. Mobile LiDAR mapping for 3D point cloud collection in urban areas—A performance test. Int. Arch. Photogramm. Remote Sens. Spat. Inf. Sci. 2008, 37, 1119–1127. [Google Scholar]
  37. Christian, F.; Sammon, R.; Zakhor, A. Automated texture mapping of 3D city models with oblique aerial imagery. In Proceedings of the 2nd International Symposium on 3D Data Processing, Visualization and Transmission, Thessaloniki, Greece, 6–9 September 2004; Volume 31, pp. 396–403. [Google Scholar]
  38. Kada, M. The 3D Berlin project. Photogramm. Week 2009, 31, 331–340. [Google Scholar]
  39. Lee, J.; Yang, B. Developing an optimized texture mapping for photorealistic 3D buildings. Trans. GIS 2019, 23, 1–21. [Google Scholar] [CrossRef]
  40. Hakim, B.; Landes, T.; Grussenmeyer, P.; Tarsha-Kurdi, F. Automatic segmentation of building facades using terrestrial laser data. In Proceedings of the ISPRS Workshop on Laser Scanning 2007 and SilviLaser 2007, Espoo, Finland, 12–14 September 2007. [Google Scholar]
  41. Pu, S. Generating Building Outlines from Terrestrial Laser Scanning; International Society for Photogrammetry and Remote Sensing (ISPRS): Enschede, The Netherlands, 2008. [Google Scholar]
  42. CycloMedia Technology, Inc., CycloMedia, CA. 2018. Available online: https://www.cyclomedia.com/us/ (accessed on 1 July 2019).
  43. Pu, S.; George, V. Knowledge based reconstruction of building models from terrestrial laser scanning data. ISPRS J. Photogramm. Remote Sens. 2009, 64, 575–584. [Google Scholar] [CrossRef]
  44. Chevrolet. 2013 Spark Manual, Chevrolet; Chevrolet: Incheon, South Korea, 2013. [Google Scholar]
  45. Woorithech. POE-804S User’s Guide; Woorithech Corporation: Seoul, South Korea, 2012. [Google Scholar]
  46. AscenKorea. GPS641 User’s Guide; AscenKorea Corporation: Seoul, South Korea, 2013. [Google Scholar]
  47. NGI. Study on Improving Vehicle-Borne Multi-Sensor; National Geographic Information Institute: Suwon, South Korea, 2010.
  48. RIEGL. DataSheet_VMX-450, Riscan Pro Technical Documentation; RIEGL: Orlando, FL, USA, 2015. [Google Scholar]
Figure 1. Schematic of workflow: A hybrid three-dimensional (3D) mapping. MMS: mobile mapping systems.
Sustainability 11 03713 g001
Figure 2. Components of mobile equipment and materials (The above images were provided by Dr. Jungil Lee): VHR stands for very high resolution, IP (Internet Protocol), and POE (Power over Ethernet).
Sustainability 11 03713 g002
Figure 3. Mobile terrestrial 3D mapping system mounted on a vehicle (The above images were provided by Dr. Jungil Lee): Figure 3a shows camera angle design; Figure 3b shows assembled multiple cameras; Figure 3c shows the assembled camera at the top of the car.
Sustainability 11 03713 g003
Figure 4. Testing recognition of an object through the camera (The above images were provided by Dr. Jungil Lee): Figure 4a shows a white dot in a laptop; Figure 4b represents the white dot captured 30 m away from the camera.
Sustainability 11 03713 g004
Figure 5. Developing application software programmed by programming language C++.
Sustainability 11 03713 g005
Figure 6. Software of the MMS developed: Assigning photo numbers with geographic coordinate system (The above images were provided by Dr. Jungil Lee).
Sustainability 11 03713 g006
Figure 7. Customizing camera information: (a) shows individual points on the topographic map, and (b) shows the static IP address.
Sustainability 11 03713 g007
Figure 8. Figure 8(a-1,a-2): upper faces; Figure 8(b-1,b-2): distorted images; Figure 8c: Corrected image.
Sustainability 11 03713 g008
Figure 9. Comparing images of aerial photos with the images taken by the new development.
Sustainability 11 03713 g009
Figure 10. Texture mapping for building facades: Figure 10a,b: Middle-rise buildings; Figure 10c: Low-rise building; Figure 10d: High-rise building.
Sustainability 11 03713 g010
Figure 11. Web-enabled 3D web map.
Sustainability 11 03713 g011
Table 1. Purchase specifications.
ItemsPricesItemsPrices
Compact Car$8500Carrier$1100
Cameras (SONY)$848 × 12 = $10,176Brackets$854 = $340
GPS receiver$854Roof rail$340
POE $135 × 2 = $270Other expenses$1700
Total$23,280

