Abstract
The construction industry is often ranked top in producing the largest amount of waste during a project, be it the waste of material resources or the waste of manpower. This has elevated the need for an improved and more structured management technique. This study will look into the principles and practices of lean management pertinent to highway construction projects to analyze whether lean management practices can improve the management efficiency for complex projects. This study adopted a quantitative approach, and a linear regression model has been used to investigate correlations between the lean test factors and the efficiency-dependent variables. It was found that lean management tools that are used repeatedly and the ones that require a high level of detailing are positively associated with efficiency improvement in highway construction projects. In particular, LPS, JIT, and VM were found to be more commonly used in highway construction projects. The research results will aid in the initial decision-making process of the project managers, as they will be able to map different lean tools with their benefits and limitations and then select the one that best suits the project needs and deliverables. Future studies can adopt the interpretivism paradigm to explore new theories and concepts related to highway construction management.
1. Introduction
1.1. Background of the Research
Construction projects cannot be completely isolated from cost and time issues, often jeopardizing the completion of projects [1]. Infrastructure projects have complicated and multi-layered supply chains, which results in many tasks and procedures to be shadowed in the planning and implementation phase [2]. This then results in unaccounted delays, budget overrun, and uncoordinated work [2,3,4]. More than 76.3% of the construction projects face the problem of going beyond the initial estimated cost [5]. When the cost pressure builds, stakeholders often get suspicious about the progress and Return on Investment (ROI) of projects, resulting in further delays, unpaid due, and a growing likelihood of shutting down the entire construction plan. With highway projects, the government cannot simply terminate the project, and have to keep spending government funds and resources to bring the project to an end [6]. It states that a highway project in itself can be considered a complex management project, involving long-distance and distributed logistics plans and strict time deadlines [4]. With a delay of every single day, the overall cost of resources, manpower, and utilities increases dramatically.
The conventional management technique of total quality management often fails to produce satisfactory results in the presence of a multi-tiered third-party system [7]. For this reason, the “Lean Management” approach has been proposed as a more suitable approach in projects involving construction work and infrastructure design [8,9]. The basic principle of lean management is to reduce the waste of resources by asking whether the task in hand or process adds any value to the project. Supply chain related tasks and procedures are viewed from a project-centric perspective rather than a general or standardized perspective, making it easier for project managers to focus on the particular project deliverables and unique customer requirements [8,10]. With this being established, the study will try to analyze how lean management can help improve the management efficiency of highway construction projects.
1.2. Why Lean in Construction
With a number of management techniques available for construction projects, it is important to ask why lean management techniques are preferable to other techniques. Jamil and Fathi argue that in terms of construction projects, the goal is more on sustainable construction rather than complying with economic standards [11]. Recent development in the field of lean management has proved that lean construction and sustainable construction are interdependent [12]. When a project follows all lean principles for quality efficiency and reduction of wastes, the overall sustainability of the construction project improves considerably. Moreover, it would be incorrect to assume that construction projects are completely different from manufacturing and other projects with time and resource constraints. Thus, lean principles for time and resource efficiency are equally, if not more, valid for the construction projects.
The present research uses the term ‘efficiency’, which combines time, budget, and resource efficiencies, all of which are targeted in the lean process. The concept of innovative thinking has been termed as ‘lean thinking’ in the manufacturing and construction projects, which directs the continuous improvement process for a specific project. So, rather than producing a general template for all projects, the use of lean principles can help identify techniques that are suited for a particular project, based on its goals and constraints. Based on the lean way of governance, the aim of the study is also to focus primarily on highway construction projects and present management solutions based on the needs, challenges, and constraints in the highway projects.
1.3. Problem Statement
There have been abundant claims of construction project management being inefficient with a high probability of surpassing the estimated project time and budget [6,13]. This inefficiency can be associated with the nature of the construction industry having fragmented supply chains, sensitiveness to political and economic conditions, complex critical path, and lack of clarity between different stakeholders and third-parties [14,15,16,17,18]. All these incongruities intricate the domain of construction the project management. With highway projects, some of these issues are even magnified as the margin of error is almost zero and the road will be put to test with a complete load force right after it has been finished [19,20]. Thus, managing such projects demands a more vigilant and need-based strategy to ensure that focus has been put on the right places of the construction work.
1.4. Research Objectives
The proposed study will try achieving the following objectives:
- (i)
- To shed light on the key principles of lean management pertinent to highway construction projects.
- (ii)
- To analyze the major challenges damping the efficiency of road construction projects.
- (iii)
- To present lean tools for improving project management efficiency in the highway construction projects.
- (iv)
- To investigate if there are trade-offs and limitations when implementing lean management tools for complex highway projects.
2. Literature Review
2.1. Concepts of Lean Management in Construction
The problems of waste and redundancy of processes have been duly noted in the literature. The lean management concept identifies waste as any kind of process or resource which is redundant or adds in cost or time overheads [12,21]. The lean approach identifies seven kinds of waste include all forms of overproduction, overprocessing, delay, excess inventory and motions, failure, and defects [22]. So, when talking about waste management in construction projects, the lean approach does not label waste as material waste alone, but any waste of time, resources, and motion.
The studies try to accumulate the major principles of lean management and how they can be implemented for construction projects [8]. The lean approach sees the construction project as a production process, involving different units that contribute in the production. So, unlike other approaches, the lean approach advocates the idea of multi-functional and multi-layered teams, with visual communication [8]. It explains that visual communication means that contractors and sub-contractors not only know each other but are in regular communication and collaboration with the other [23]. To maintain functionality, the focus is shifted from micro-level management to macro-level management. Shewchuk and Guo add the lean attribute of continuous improvement [24]. When a delay occurs, the lean management not only tries to resolve the direct issue but works on the indirect associations as well and taking periodic feedback to analyze if the same problem occurred twice [24].
It conducted a systematic review of 102 papers pertinent to lean management in the construction sector [25]. The review identified the Last Planner System (LPS) and Just-in-Time (JIT) as the two most commonly used lean tools in the construction sector [25]. Standardization and detailed briefing were some of the least used strategies in lean management. LPS is a five-stage planning model (as shown in Figure 1), which moves from the milestone planning at the top-layer to daily reports and PPC (i.e., the periodic report) at the bottom-layer. The JIT approach is primarily based on waste-reduction and improving the response time [7]. While, the traditional approach is based on a cost-push strategy, the JIT approach is based on the demand-pull approach, where the intermediate stages are governed and timed as per the market need and demand.
Figure 1.
Last Planner System (LPS) [26].
However, Tezel, et al. criticize the use of LPS systems stating that its implementation is often isolated from market requirements and supply chain drivers [6]. Though LPS makes the overall logistics process more transparent and robust, it is important to understand the supply chain cycles and complex transportation network to better design a work planner system [26].
Another concept in lean management is the discretion of the entire process into smaller chunks of events or completion points, making it easier to analyze the actual problem. The Discrete Event Simulation (DES) tool is one of the popular tools, which is used to represent the system or project in a chronological sequence of events [27]. Each task, such as water channel/pipeline mapping, is treated as an event with a start point, an end point, and specific variables and parameters related to it. Stroboscope modelling can be used to present a symbolic representation of the process, including the flow of resources, logical flow of information, and decision-making feedback [28]. The problem with large-scale projects is that the system layout becomes very complicated and it is hard to manage the quality of all tasks. Thus, continuous quality improvement could only be achieved if focus is been put to each event in the system, ensuring a detailed level layout plan.
2.2. Lean Management Tools and Delay Minimization in Construction Projects
About 57% of productive time delays can be found in the construction industry and many of these delays are attributed to the inadequacies of the current projects management tools [29]. The construction industry is facing new challenges, and therefore, advanced and more efficient tools will be needed to counter those challenges [30]. Issa used the Percent Expected Time-overrun (PET) tool to estimate the time over-run and how much work has been done in correspondence to the time consumed, as measured by Percent Plan Completed (PPC) tool [31]. Quantifying PET and PPC gives a good idea to project managers of the present scenario and how much more time will be needed for the following tasks. Other researches have also seconded the argument of using lean tools to improve the overall project speed and reduce delays [32,33]. Similar arguments were presented in other studies using lean tools of Visual Management (VM) and Process Improvement Cycle (PIC) [34,35]. Visualization is use to facilitate the lean process by transforming numbers and concepts into visual representations, such as graphs and flowcharts. For example, the use of scatter-plot is preferred over numerical representations when dealing with 2D and 3D variable problems [36]. Stroboscope is also a type of visualization tool, which transforms the entire system process and information flow in the form of a symbolic process-flow diagram. The PIC tool is based on the Plan-Do-Check-Act (PDCA) approach, in which goals and performance matrices are set for each phase and the aim is to keep on perfecting the process with higher performance matric after each run.
Issa also provided a validation risk-time model, estimating the likelihood of risks and their impact on the time index [31]. Risks include all activities that could result in a time delay, for example, change in material prices leading to budget re-estimation, inexperienced contractors leading to briefing delays and redoes, and design errors [37]. When planning the construction project, all these risks are estimated in terms of their probability of occurrence and then mapped against the project timeline, as to how much of this will extend the estimated timeline [38]. Using these tools, project managers would be able to identify potential sources of delays and then estimate the overall project time and resources accordingly.
2.3. Lean Management in Post-Disaster Reconstruction
One of the attributes that makes road construction projects different and more challenging from the other projects is their susceptibility to natural disasters and other calamities. In the aftermath of such an event is the need to re-plan the post-disaster construction and rehabilitation process [39]. When a road is destroyed, authorities not only need to reconstruct the road, but also to relocate people into shelter homes, provide emergency relief, take measures to save the government’s and public assets, and make strategies for withstanding future calamities. It is obvious that without a structured plan and governance, it would be nearly impossible to manage all these activities efficiently.
It introduced an integrated approach to natural disaster risk management, which has been followed by a number of studies involving post-disaster reconstruction [40]. Using the integrated framework, Mojtahedi and Oo note that during the post-disaster reconstruction phase, greater degree of communication and collaboration is required with the legislation, communities, NGO’s, and other pertinent sectors to provide the maximum relief with the limited resources and time [39]. ‘Simplean’ is one of the popular lean tools that enhances the information flow between different contractors and sub-contractors. Rather than simple emailing and note-keeping, Simplean should be used, as it automatically schedules tasks based on their urgency and highlights pending tasks and the person responsible [41]. In this way, communication and information flow between different stakeholders become simpler.
Mojtahedi and Oo noted the two lean strategies of Disaster Risk Reduction (DRR) and (ii) Disaster Management (DM) [42]. DRR includes mitigation activities and a plan for reconstruction, while DM includes preparedness, response, and recovery activities. The lean concept dictates the best or fastest approach to recovery, with adding parameters of how people needs to be prepared for the disaster and what process shall be taken in transitioning from the disaster phase to the reconstruction phase.
2.4. Quality Management Challenges in Road Construction Projects
When it comes to road construction, the management has to deal with extra challenges in terms of maintainability, transportation of resources, and sufficient legal permissions [43,44]. When a road needs to be constructed, particularly a highway, the project manager not only needs the design engineers on-board, but the road authorities, who have the final call on material, budget, and how the maintenance process will follow. The report noted that the authorities often have a fixed budget in mind, which may not justify the design plan [45]. With the conventional management techniques, project managers try to compensate for the design quality, rather than addressing logistics and other areas, where the operational cost can be reduced.
It provided a flow graph explaining the problem of regulation without maintainability consideration, as depicted in Figure 2 [46]. Roads, though, are construction projects, have a very different outlook and design flow as several other construction projects [47]. Several times roads need to be rebuilt due to climatic and other calamities, and these considerations should be taken into account when finalizing the design flow and requirements [48,49,50,51]. This, however, can risk in putting more money during the maintenance phase of the project.
Figure 2.
Problem graph for regulation without maintainability consideration [46].
As seen from the Figure 2, if long-term maintenance and reconstruction are not taken into account, then the overall sustainability of roads is compromised. Managers will favor a design plan, which is within the budget, takes less time, involves lower transportation cost, and with a simpler logistics network.
2.5. Research Gap
By reviewing the literature review, it has been observed that the majority of the researches either provide a theoretical explanation of lean principles or present a one-sides overview of the use of the lean tools. The problem statement clearly identifies the inconsistencies and failures in applying lean tools and overall management principles, in general, when dealing with construction projects [19,52]. Thus, there is a need to of a more critical and two-sided discussion of lean implementation and lean tool selection, informing decision-makers about what needs a lean tool fulfils and what challenges it introduces to the overall construction project management.
3. Methodology
3.1. Research Approach
For the current study, a quantitative research approach has been applied. The aim of the study approach is to analyze a correlation, if there exists any, between lean factors and project efficiency improvement. As a statistical correlation needs to be established, a quantitative method of data collection and evaluation is the most suited for building this correlation [53]. Quantitative data is driven by statistical results, where data can be compared and analyzed using statistical procedures and algorithms [54,55]. As the method is deductive in nature, we move from a more general perspective to a more narrowed and specific one. Test variables need to be established, onto which the data is measured for correlation. For the present study, both test variables and control variables are set up, which are then tested using a statistical model [56].
3.2. Data Collection
For the primary data collection, two different mediums were used; the online medium and the offline or personal handover medium. The initial survey was designed on a Word format, which was then distributed among the employees of five construction firms in a hardcopy format. Four of the five construction firms consist of 30–50 employees, while one consists of less than 20 employees. The questionnaire was emailed and provided in hardcopy to the HR manager/staff of the selected firms and were asked to distribute it to their employees.
Apart from this, the questionnaire was also designed using the free online platform of ‘Survey Monkey’. The survey link was then distributed through emails and LinkedIn. LinkedIn served as the primary search engine to find out relevant participants for the study, who are currently or in the past have served in the construction sector.
3.3. Sample Size
A total of 165 hardcopy questionnaire were distributed in the firms out of which 124 (75.2%) were completed and returned. Another 28 filled questionnaire were collected online. Since a purposive sampling method was used, a large quantity of questionnaire samples could not be collected [57,58]. In the initial stage, a total of 152 filled questionnaire were collected; however, only 120 were selected after filtering for incompleteness, random answers, and other inconsistency issues with the sample [59,60]. The demographic information for a number of participants could not be received. However, from the collected information, 19 workers, 12 were construction expeditors, 7 finance officers, 4 team supervisors, and 2 project managers.
3.4. Questionnaire Design
The designed questionnaire comprises of four parts (refer to Appendix A). In the first part, participants were asked to respond on the common and most critical challenges involved in highway construction projects. The next part asked the participants to select one of the lean management tools, selected from the literature review [31]. The idea was to better guide the correlation with a particular lean tool rather than taking a very general approach. The third part inquired about the characteristics (test factors) of the chosen lean tool; while the last part inquired about efficiency improvement. A Likert-scale was used to add to the overall generalizability of the data results [61].
3.5. Ethical Consideration
The ethical guidelines of American Educational Research Association were used to ensure that the primary research does not violate any human rights or ethics [62]. Complying with the framework of ‘Informed Consent’, all participants were prior informed about the nature and aim of the stud and they were asked for their voluntary participation. Moreover, confidentiality of participant was maintained by not collecting any personal data of name, email addresses, or phone number of the participant. Though email addresses and social media accounts of individuals were used to reach participants, the responses could not be in any way associated with the participants. Moreover, all participants were informed that they are free to refuse their participation or withdraw from the survey at any point, without need for explanation.
3.6. Validity and Reliability
The validity of the questionnaire can be checked by the constructs of criterion validity and coherency [63]. These constructs assess whether the questionnaire predicts what it is supposed to predict and are the results coherent with the study objectives. The designed questionnaire includes questions on problems with highway construction projects and then links it with the lean tool to see if there exists any correlation between the two.
For reliability, it is important to produce stable and consistent results [64]. Choosing a random sample could have compromised the reliability of the study results. For this reason, a purposive sampling technique was used, including only the ones who already have some experience working with one or more of the lean tools. Another strategy to produce more stable results is by using a Likert-scale rather than a yes/no template, as the Likert-scale allows a greater degree of freedom, and thus, reduces the chances of high variations [61]. The internal consistency check for the questionnaire was done through the Cronbach’s coefficient alpha test, which resulted in an internal consistency of 0.65, which means that the results explains 65% of the overall variance in the data (Table 1). Normally, the reliability in an acceptable range when Cronbach’s alpha between 0.5 and 0.7.
Table 1.
Cronbach’s coefficient alpha test.
This was calculated using the four variables of first-choice of selection (consistency = 0.67), everyone understands the chosen tool (0.29), special training required (0.07), and project-detailing (0.68). The overall internal consistency could be improved by removing the variable special training, as it contributes the highest standard deviation in the overall results. Complete results are presented in Appendix B.
3.7. Data Analysis
The data analysis has been carried out using the software tool of SAS, which guided the procedures of data coding, frequency generation, and model development [65]. First, a dataset was developed from the questionnaire responses and it was fed into the SAS database. The functions of mean, cross-tabulation, and linear regression analysis (LRA) were used for the present study. As the data generated from the first question of the questionnaire could not be correlated, the method of descriptive frequencies was used to understand the data-challenges involved in the highway construction projects [65].
The reason for using LRA method was used to test correlations between the study test variables and the dependent variables [66]. The test variables comprise of lean management tool characteristics; (i) first choice of selection, (ii) genera understanding among the team, (iii) special training requirement, and (iv) high-level of project detailing. The regression model produces a linear model, with probability estimate, giving an idea about the strength or accuracy of the linear estimation. On the other hand, the efficiency variables of project management form as the dependent variable of the current study. For the present study, independency between the test variables was assumed, and therefore, a linear regression was preferred over the multiple regression method.
The Analysis Of Variance (ANOVA) test was also used to analyze the difference in variance in test groups. With multiple lean tools to compare and correlate, ANOVA test gives an idea of whether there is a significant difference in the mean and variance of the different groups or test factors or all groups have a similar effect on the dependent variable [54].
4. Results
4.1. Challenges in Highway Construction Projects
In order to get a better understanding of the need for lean management practices in highway construction projects management, the researcher asked participants about the common challenges they face when dealing with highway construction projects. The mean of the responses is presented in Table 2. It can be seen that traffic management and high-level training required scored the highest mean values of 4.01 and 4.05 respectively. The construction projects have a complex critical path, resulting in many tasks either wrongly classified or ignored in the formation of the critical path [16]. Though, the mean of 2.95 for crucial path tilts towards the higher end, it is still the lowest of all obtained mean values. Communication barrier with the mean of 3.82 ranks third in critical challenges in managing highway construction projects.
Table 2.
Mean values for highway construction project challenges.
One of the objectives of the study is analyze the major challenges and one way of doing it is by fragmenting the results into individual codes of the Likert-scale (Table 3). By doing this, it can be seen that there was not a single participant, who strongly disagreed to the claim that traffic management and re-routing are some of the main challenges when dealing with highway projects. On the contrary, a total of 84 (69.2%) out of the 120 participants agreed that the project managers had to take care of all traffic related issues, including re-routing, placing construction signs, and moving heavy machineries onto the construction site.
Table 3.
Descriptive frequency for traffic management.
4.2. Lean Management Tools
A total of five lean management tools were identified for research in the present study, and participants had to select from one of the tools or practices. The reason for asking about the lean management tool preference was to get an idea of industry norm when it comes to highway construction projects and later to correlate these tools with the performance efficiency in highway projects.
As it can be seen from Figure 3, a total of 34 participants (28.3%) selected the last planner system (LPS), when asked to choose the tool they are most familiar with or the one that is generally used when managing highway construction projects. This finding seconds the finding by Babalola, Ibem, and Ezema, who noted LPS as an essential and most widely accepted lean management tool in construction practices [25]. LPS was followed by JIT and PIC with a population rate of 24.1% and 20.0%. VM (15%) and PPC (12.5%) were identified as the least commonly used practices when managing highway construction projects.
Figure 3.
Lean management tools and practices.
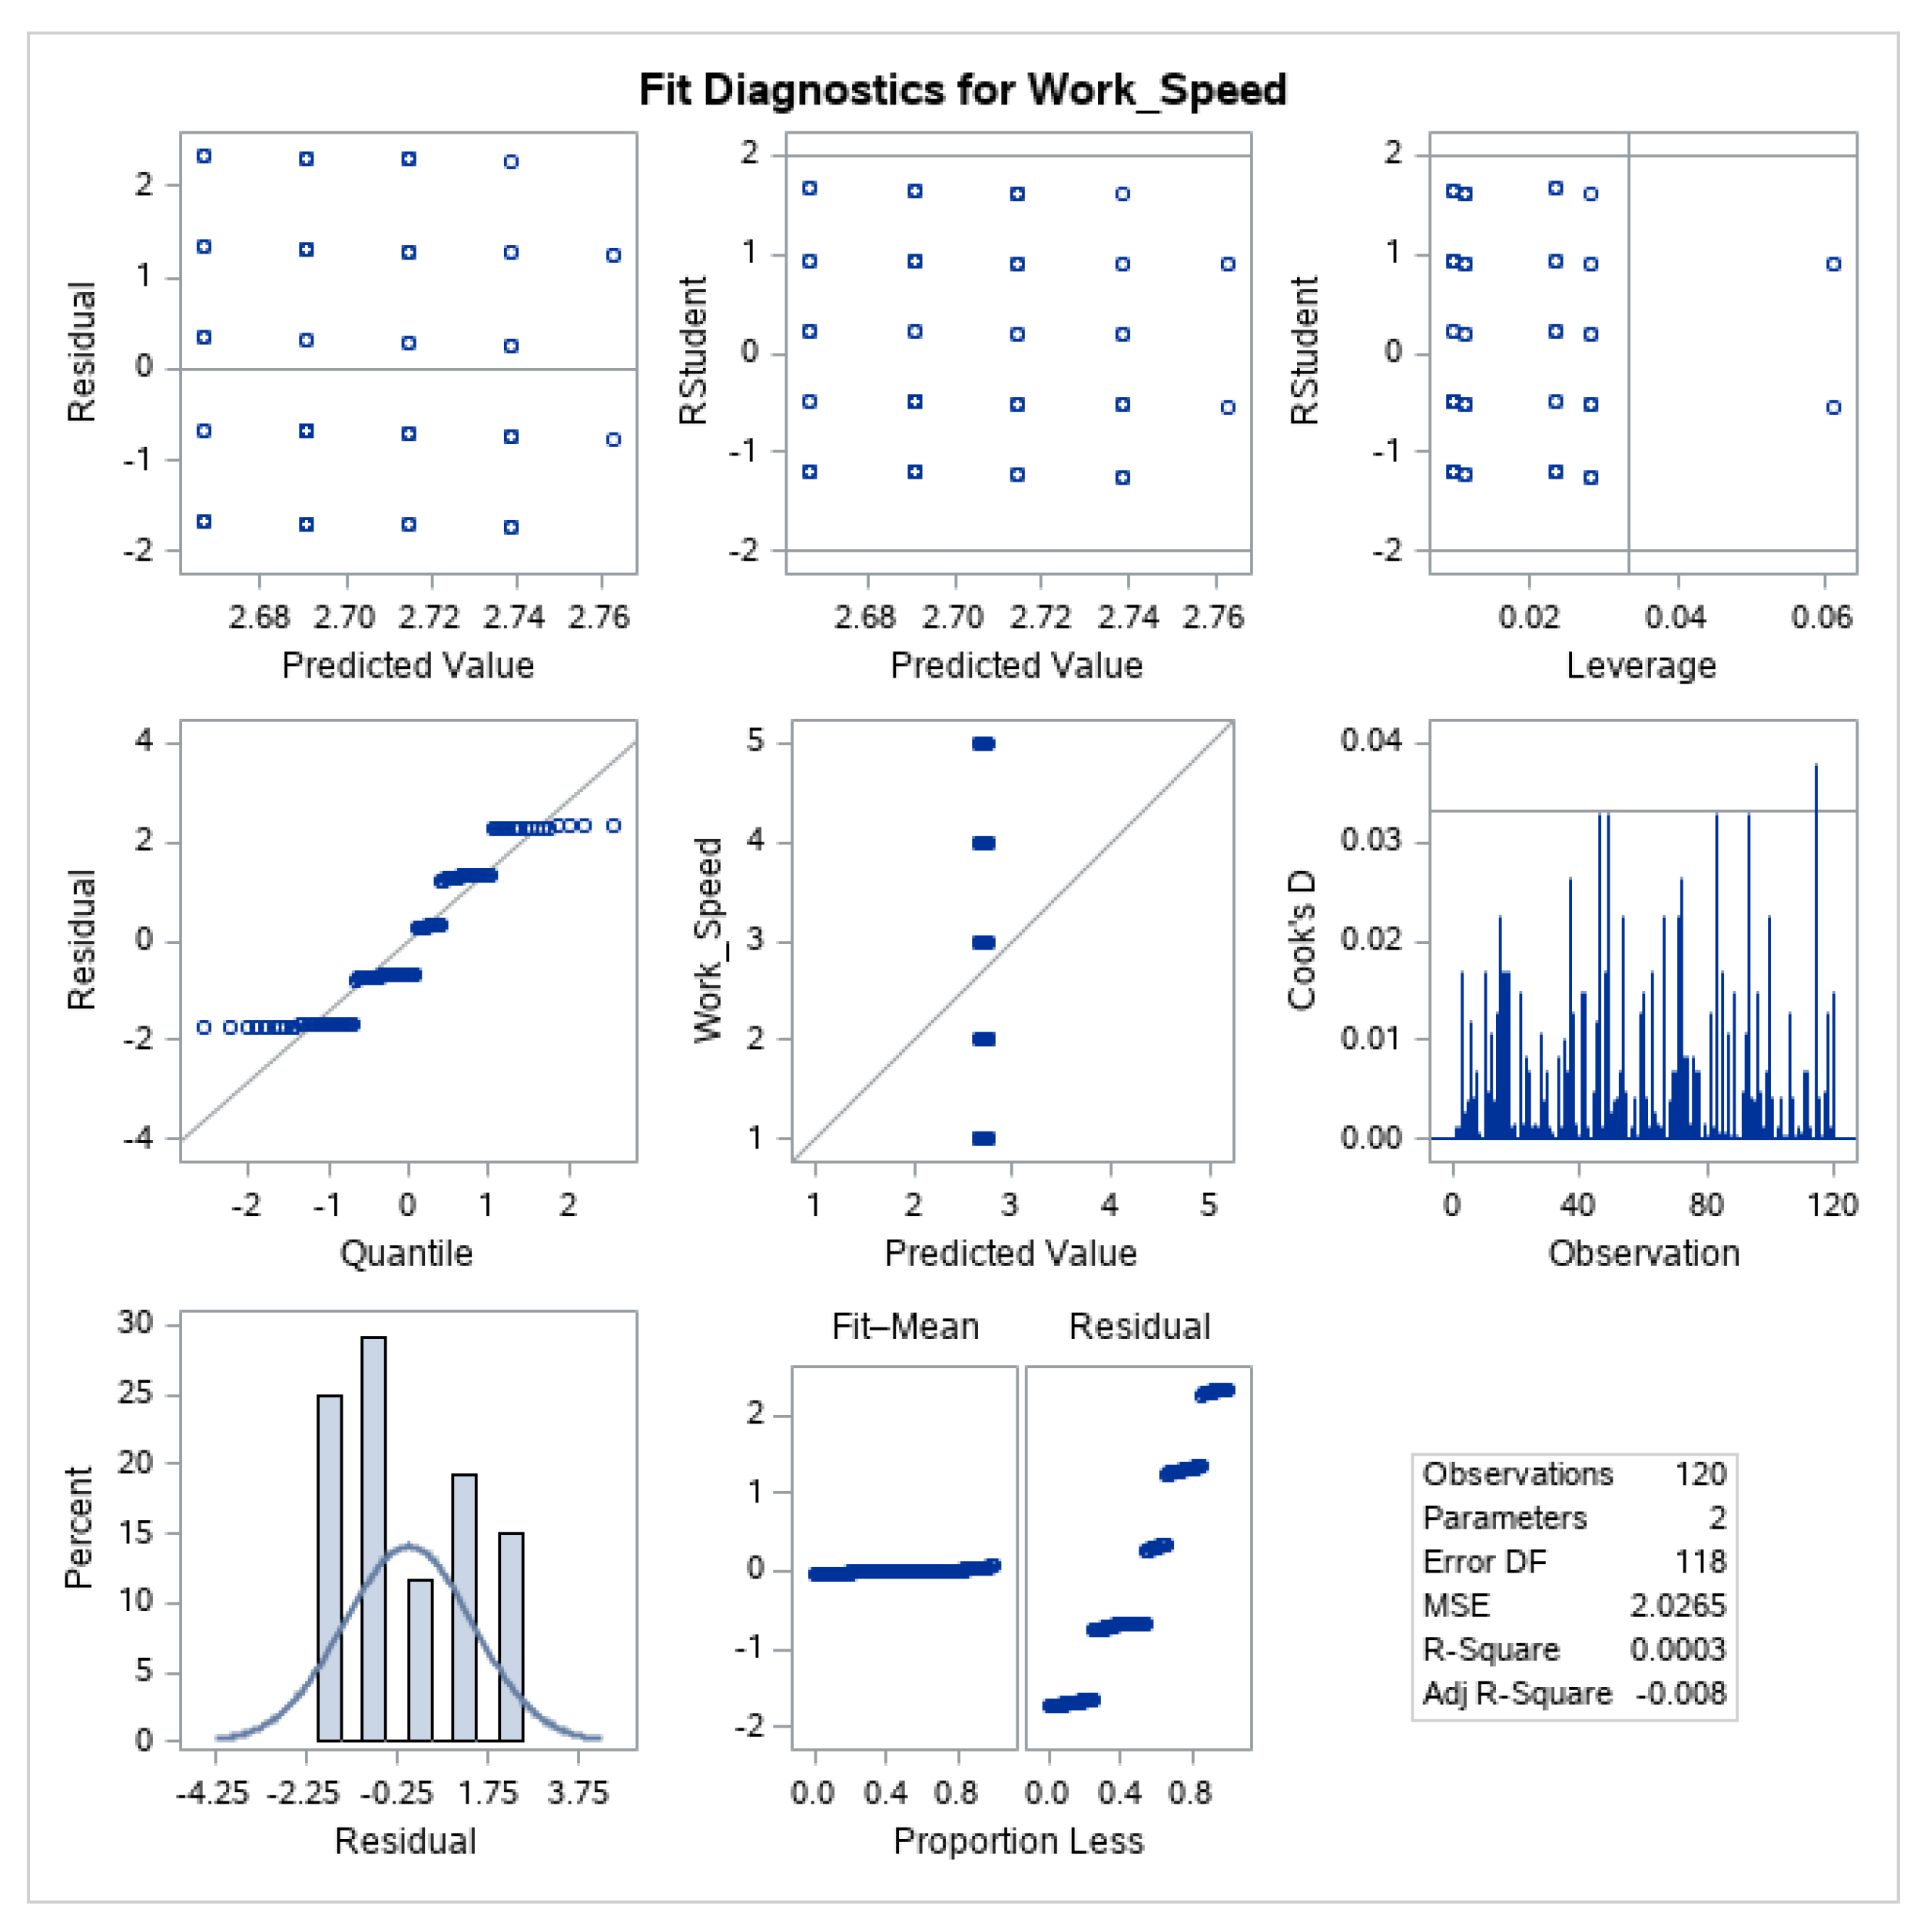
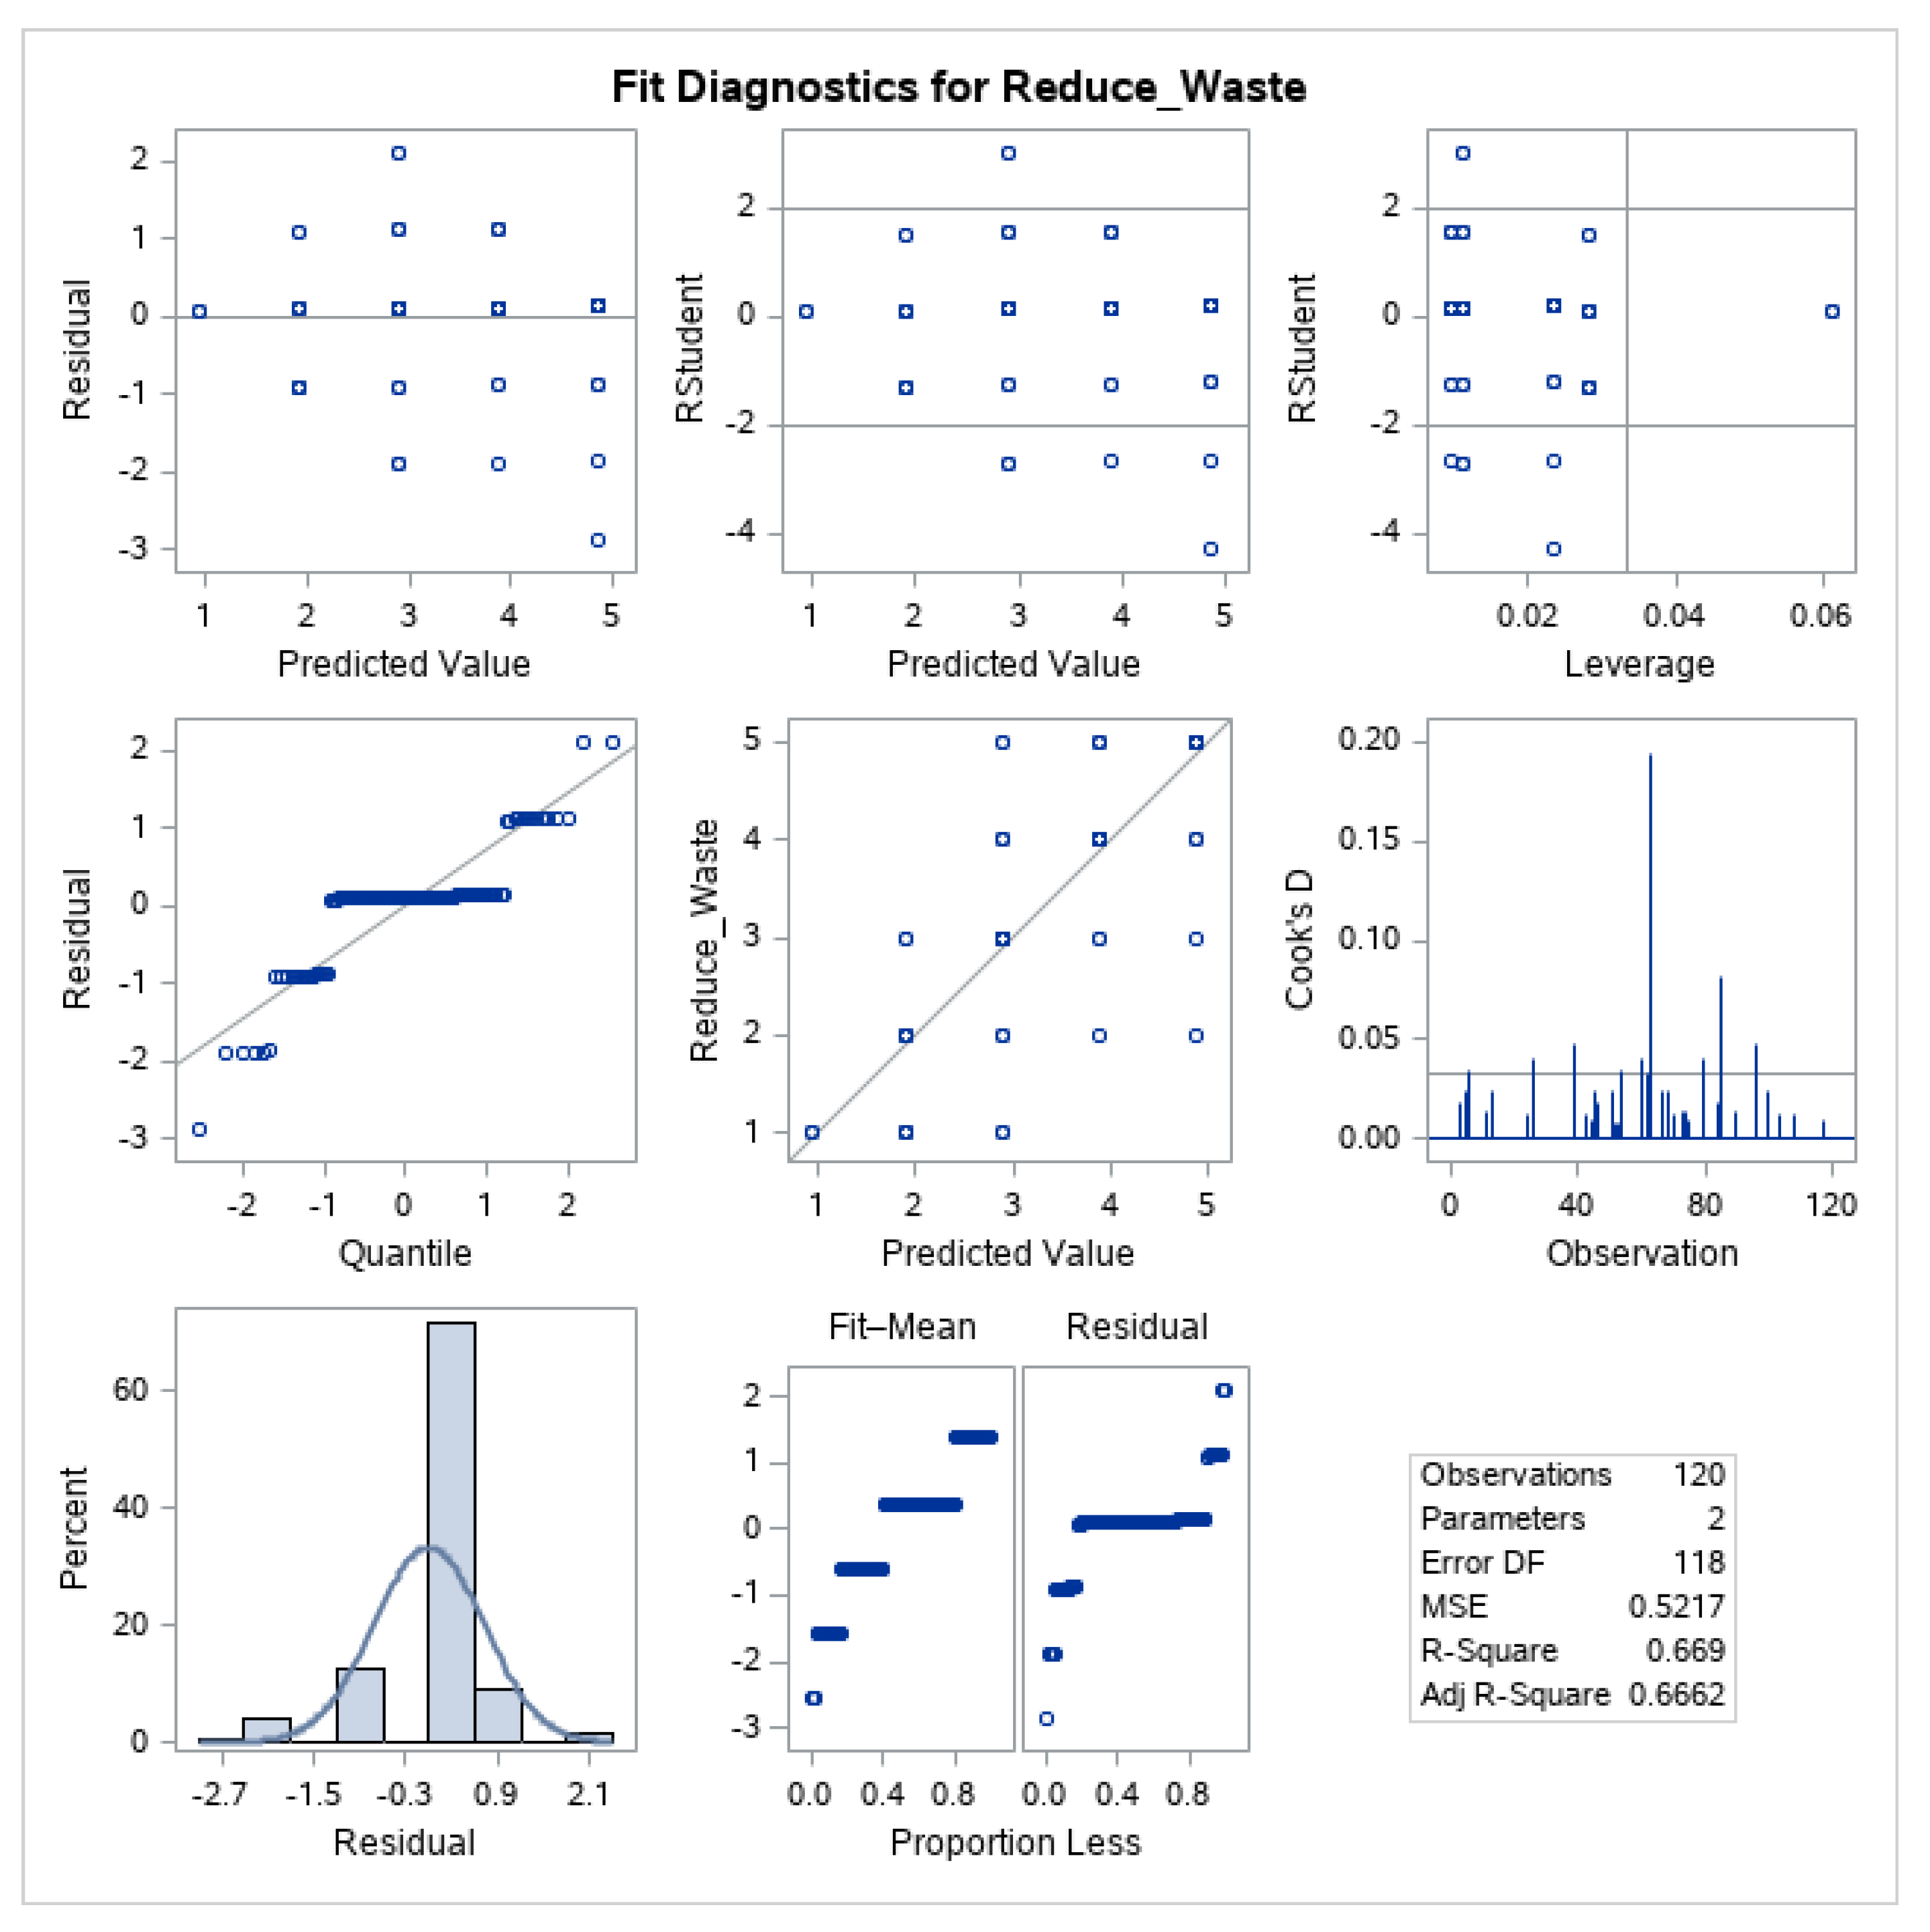
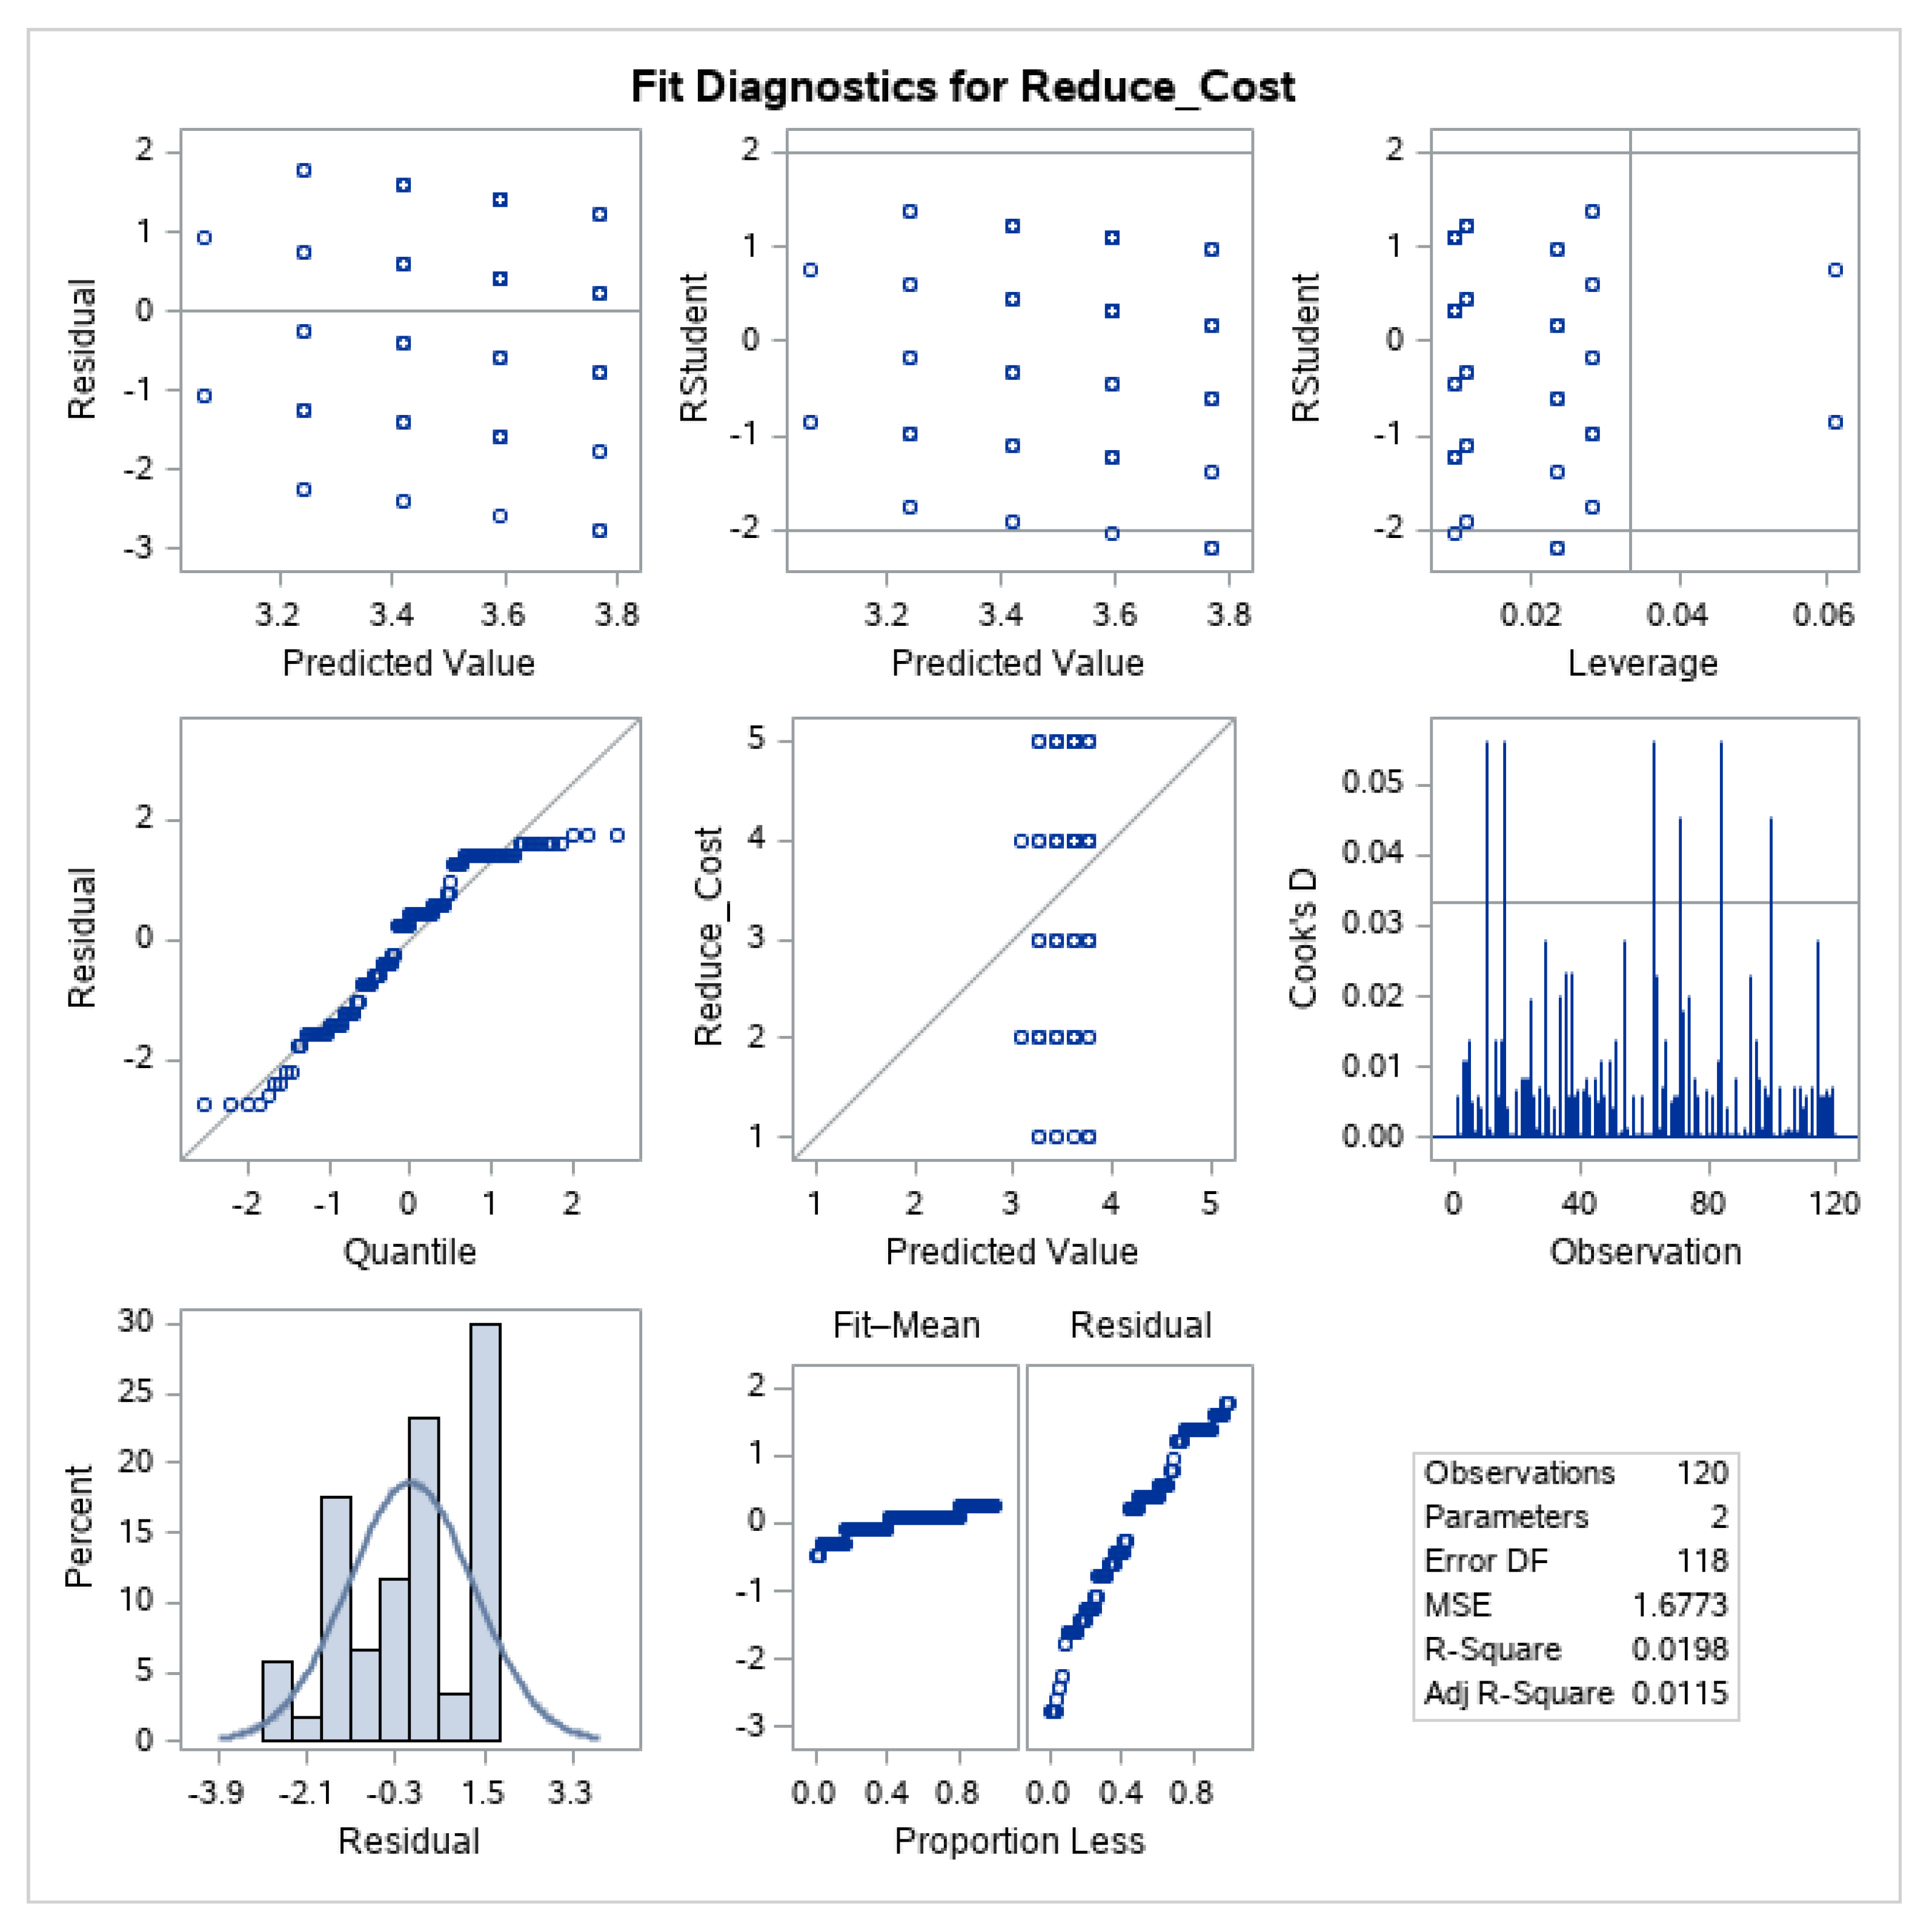
4.3. Linear Regression Analysis
In order to find if any statistical correlation exists between the use of lean management tools and performance efficiency improvement in the highway construction projects, a linear regression analysis (LRA) was conducted.
One of the lean management tool attributes was whether it is the ‘first choice’ when managing a highway construction or similar project. This variable was then compared with the dependent variables of improving work speed and transparency etc. From the results, a statistically significant correlation was found between first choice of selection and the dependence variables of work speed, transparency, reduced cost, client communication, and understanding of the project deliverables.
The LRA tries to fit data points by a straight line, which is defined by the intercept and the slope (first choice) value. Keeping work speed as ‘y’ and first choice as ‘x’, we can get a mathematical relation from Table 4 as:
y = β0 + β1 ∗ x
→y= 2.56 + 0.039 x
→y= 2.56 + 0.039 x
Table 4.
Linear regression analysis—first choice of selection.
Bases on these results, it can be said that one of the methods of improving management efficiency using lean management is by making the tool the first choice. This can occur when the tool or method is used repeatedly, gaining confidence of the project managers to choose it as a first priority for complex construction projects.
The same strategy was used to find relationships between other independent variables. For the variable of special training required for adopting the tool, it was negatively correlated with work speed of the project, with β0 = 3.9853, β1 = −0.39652, and sig < 0.001. This gives an idea that lean management tools that require special training and implementation efforts increases the overall timeline of the project as some time also needs to be dedicated to training and supervision of employees. On the other hand, the dependent variable of ‘reduced project cost’ was found to be positively correlated with special training, β0 = 2.44264, β1 = 0.33389, and sig = 0.002. This indicates a conventional trade-off between time and cost, when tools requiring special training are used in managing highway construction projects. No significant relationship was established between the dependent variables and the intendent variable of ‘everyone understands the implementation’.
For the variable of project detailing, we could determine a significant correlation with project transparency (model = 15.0, sig = 0.0017), waste reduction (model = 124.4, sig < 0.001), client communication (model = 18.7, sig = 0.0003), and understanding of the deliverables (model = 17.6, sig = 0.009). Results showing a significant correlation are presented from Table 5, Table 6, Table 7, Table 8, Table 9, Table 10, Table 11 and Table 12 (see Appendix C for complete results). The significance values of less than 0.05 indicates a strong correlation, and the model value gives an estimate of sum of squares of all the data points on the regression line. Though, all these correlations are statically significant, it is evident from the model value that the correlation between project detailing and reduction of waste is the strongest, as shown in Table 7.
Table 5.
ANOVA for transparency.
Table 6.
Regression estimate for transparency.
Table 7.
ANOVA for waste reduction.
Table 8.
Regression estimates for waste reduction.
Table 9.
For client communication.
Table 10.
Regression estimates for client communication.
Table 11.
ANOVA for understanding of deliverables.
Table 12.
Regression estimates for understanding of deliverables.
One inference that can be made from these results is that the lean management tools involves high-level of project detailing, ensuring the elimination of loose-ends and unclear information from the design and planning report. For projects where there is a high risk of miscommunication or lack of detailed information, lean management tools can offer great benefits. This is further discussed critically in the next chapter along with other test variables that define the selection of lean management tools.
5. Discussion and Analysis
5.1. The Need for Lean Management Implementation
In order to convince someone to implement lean management tools, it is important to establish a need for it first. For this purpose, it is important to get first-hand data on the major challenges pertinent to highway construction project management. Highway projects are different from other construction projects as they involve the management of several other factors, including traffic management and re-routing [20]. This argument was confirmed in the current study, where the majority of the study participants noted traffic management as one of the core challenges that require advanced management techniques.
A number of conventional management procedures still rely on manual reporting, which is insufficient for projects involving multiple-level reporting hierarchy and the presence of third-party contractors [23]. Communication barrier (µ = 3.81) was also indicated as a critical issue in highway construction projects, requiring proper briefing and reporting to internal departments, upper-level management, contractors, clients, and the legal authorities. For managing a project with such a complex reporting and communication structure, the probability of miscommunication or lack of information flow is quite high. Thus, requiring an improved lean management practice.
5.2. Performance Efficiency Improvement
Several aspects of the chosen lean management tools were tested with the dependence variables of the study. Combining all these results will give a multi-dimensional view of the most critical aspects that are related to efficiency improvement in highway construction projects. The factor of first choice or norm defines that the lean management tool is commonly used in such projects and its use has become a norm and it is no more unusual or high-risk to select the tool for highway construction project management. From the crosstabulation, as shown in Table 13, it can be seen that LPS has the highest mean value, with 17 participants agreeing LPS to be the first choice of selection and another 11 strongly agreeing to it, making it a total of 82.4% agreement rate. The is followed by the tool of Visual Management (VM), with a total percent of 55.6 agreement rate.
Table 13.
Crosstabulation lean tool vs first choice. Process Improvement Cycle (PIC); Percent Plan Completed (PPC); Visual Management (VM).
The practice of VM deals with the problems of lack of communication and lack of objective clarity within the teams. One of the fundamental principles of lean management is transparency, so that the project deliverables, deadlines, and individual roles are clearly understood by everyone [26]. The VM tool includes a clear display of all this information on a white board or notice board, or at a place in clear sight to all members [35]. Apart from this, the progress report is also published and displayed on board rather than just being discussed in the board meetings.
The factor of ‘project detailing’ also showed correlation with a number of test variables, including project transparency, waste reduction, client communication, and the better understanding of project deliverables (Appendix C). An initial argument made in this study highlighted the highway construction project as a one with high probability of resource waste due to improper management techniques for maintaining transparency and client communication. Again, using the SAS crosstabulation, it was found that LPS and JIT requires high-level of project detailing. Though, Tezel, et al. argued that LPS tools often neglect the market conditions, it still plays an important role in defining project deliverables and communication network for each phase of the project.
5.3. The Role of Lean Tools in Construction
After establishing the relationship between lean implementation and performance improvement, it is crucial to analyze how and in what areas the discussed tools can facilitate construction projects. Using an integrated approach, the JIT tool can be combined with the second-layer or planning phase of the LPS. This will help categorize constraints and needs based on factors of waste reduction and resource optimization [7]. For example, traffic management and re-routing are identified as some of the major problems in road construction or reconstruction process. Using the JIT tool in the planning phase of LPS, the project manager can assign the task of putting construction site boards to less experienced people, and a few people with expertise in area routing can be given the task of outlining an alternate route plan. Thus, not all workers are required to receive high-level training for the project completion.
Due to multi-layered logistics network and high dependency on suppliers, it is easy to lose the track of project progress information, and whether or not important milestone have been accomplished or not. Communication barriers and contractor dependency have been identified as some of the non-trivial issues in the construction projects. IT-supported VM tools not only links activities, but also different internal and externa departments working in a project. When an on-paper Stroboscope outline is transferred to an IT-based platform, the project manager can add notification, private messages for workers, make orders to the suppliers, or track the progress of a shipment or assigned task [34]. Transforming a written report of who needs to do what and when into a visual representation, with indicators of risks, deadlines, and PPC, the project manager will be in better position to oversee and control the project pace. The function of PPC would come in labelling tasks or departments that failed to achieve the set milestones.
5.4. Limitations and Trade-Offs
A few limitations and trade-offs were also observed from the LRA. First, no significant correlation could be established with the variable of risk management, and the variable of project speed also showed a meager correlation with only one of four factors of the research. The literature is consistent on the role of lean management strategies and tools to enhance work speed and reduce the overall risks involved [32]. Previous studies have found a positive impact on project appeared when lean tools are applied, however, the current study could not confirm this correlation. Some of the reasons can be the lack of adequate lean awareness and understanding among the target participants or gaps in standards and approaches [8,41].
In addition to this, a negative correlation with the factor of special training and the variable of project speed shows that lean tools that demand special education and training workshops for employees to get equipped with its knowledge, increases the overall project time. This also helps understand the claims that project managers are often reluctant to apply lean tools as they require time and budget for special training efforts, before they can be put to test [50,51]. Thus, the overall project management cost is also bound to increase, keeping the variable of implementation cost as constant.
6. Conclusions and Recommendations
6.1. Conclusions
Lean management has gained getting great popularity in the construction industry, and this study aimed to narrow down the scope to highway construction. The study findings show that lean management practices and tools can improve the overall project management efficiency for highway construction projects. Some strong correlations were found with project speed, reduction of delays, improved communication, and project transparency. However, implementing an integrated lean management framework can also increase the overall project time and cost. So, this is one of the trade-offs for lean management implementation, and it could create an implementation barrier in projects with strict deadlines and budget constraints.
One of the crucial findings of the study was that when lean management tools that become the industry norm and employees and managers are aware of their implementation, it improves the overall project efficiency. One inference that can be made from this finding is that in the initial adoption of lean practice, it might take more training time and implementation costs, but once the entire team working on the project has become familiar with its operation, it could greatly help in reducing project waste, cost overheads, and communication problems. Future researchers can study the criteria for selecting a lean tool in such complex projects.
A significant aspect of the present study is the mapping of popular lean management tools with the desired deliverables. As noted by earlier researchers, often managers are reluctant to implement lean procedures, as they do not know what to expect from it or what project deliverable will be achieved by a particular tool. A large set of lean tools were narrowed down to the top five, out of which LPS, JIT, and VM were found to be more commonly used in highway construction projects. In addition to this, tools that require special training that involve project-detailing in a phase-wise manner better aid efficiency improvement. Thus, lean management tools help the project manager to have all project options, deliverables, deadlines, and alternatives on the table, and make a calculated decision based on the project progress.
Moreover, an integrated approach for implementing lean tools was also discussed in the research. For example, the LPS tool could dictate the weekly or monthly planning of tasks, constraints, and changing tasks priorities. Integrating this phase with JIT would provide a more functioning model or direction as to which constraints to target first and how priorities need to be set, based on the principles of waste reduction and resource optimization. Another important conceptual learning from the research was to treat a construction project into smaller discrete events. So, rather than just planning the budget, cost, and milestones for the entire project, the same has to be done for each independent event in the project. In this way, it will be easier to monitor and improve events that failed to meet the required time, budget, and other constraints rather than signaling a delay of months and a loss of millions at the end of the project.
The study also discussed limitations and trade-offs when selecting a particular lean tool. This could aid in the initial decision-making process of the project managers, as they would be able to map different lean tools with their benefits and limitations and then select the one that best suits the project needs and deliverables. The present study is consistent with the previous findings of lean management tools to improve the overall highway construction efficiency; however, it takes a more pragmatic approach so that project managers do not overlook the real-world limitations and challenges attached to lean process adoption.
6.2. Limitations of the Study
One of the limitations of the study is that the applicability factor could not have been tested. The need and application of lean tool changes with the nature of the project, governance structure, and organizational dynamics. So, there is a probability that the proposed results might not be valid under some scenarios or system dynamics, which could not be tested in the present study. An experimentation approach could be used in future studies, analyzing organizational and other factors that facilitate or oppose the adoption and successful implementation of lean management tools in the road construction projects.
6.3. Recommendations
The present study bears a few limitations, which can be catered in the future studies. First, the data for the study was collected from only large construction corporations, as the requirement was to see whether the lean management tools improves highway construction efficiency or not. However, a number of firms still rely on conventional or other management tools, and it can be argued that those tools might be as effective, if not more, than the chosen lean tools. Thus, a comparative study can help better reason the use of lean tools. Second, future studies can adopt the interpretivism paradigm to explore new theories and concepts related to highway construction management, which have not been addressed in the current study.
Author Contributions
X.W. designed this study, collected and organized the relevant data, drafted the manuscript; W.Z. designed the research framework and made some suggestions for the first manuscript; T.M. made some suggestions for the first manuscript; Z.Y. reviewed the manuscript. All authors read and approved the final manuscript.
Funding
This research was funded by Hainan Provincial Transportation Science and Technology Project, grant number JT20170898006 and also funded by Innovation Capability Support Program of Shaanxi, program number 2019KRM130.
Conflicts of Interest
The authors declare no conflict of interest.
Abbreviations
| DES | Discrete Event Simulation |
| DM | Disaster Management |
| DRR | Disaster Risk Reduction‘ |
| JIT | Just-in-Time |
| LPS | Last Planner System |
| PDCA | Plan-Do-Check-Act |
| PIC | Process Improvement Cycle |
| PPC | Percent Plan Completed |
| VM | Visual Management |
Appendix A. Questionnaire
Q1. To what extent do you agree/disagree with the following challenges with Highway Construction Projects?
| Highway project attributes and challenges | 5 = strongly agree 4 = agree 3 = maybe/not sure 2 = disagree 1 = strongly disagree | ||||
| 5 | 4 | 3 | 2 | 1 | |
| It involves traffic management and re-routing | |||||
| Have tight deadlines to meet | |||||
| Have strict budget constraints | |||||
| High probability of financial and safety risks involved | |||||
| High dependency on third-party contractors | |||||
| Communication and information sharing barriers | |||||
| Complex critical path and many task-entries | |||||
| Requires high-level of training and skillfulness | |||||
Q2. Select one the lean management tools, which you are most familiar with or is the most commonly used by your firm in road construction projects.
☐ Last Planner System (LPS) ☐ Visualization Management (VM)
☐ Process Improvement Cycle (PIC) ☐ Just-in-Time (JIT)
☐ Percent Plan Completed (PPC)
Q3. How would you rate the characteristics of the chosen lean management tool?
| Lean management tool characteristics | 5 = strongly agree 4 = agree 3 = maybe/not sure 2 = disagree 1 = strongly disagree | ||||
| 5 | 4 | 3 | 2 | 1 | |
| It is the first choice or norm when handling a complex construction project. | |||||
| Everyone on the project team understands its implementation. | |||||
| It requires special training and implementation efforts | |||||
| It incorporates high-level of project detailing | |||||
Q4. To what extent do you agree/disagree with the implementation of the chosen lean management tool for highway construction management efficiency.
| Lean Management Efficiency | 5 = strongly agree 4 = agree 3 = maybe/not sure 2 = disagree 1 = strongly disagree | ||||
| 5 | 4 | 3 | 2 | 1 | |
| Improves the speed of working | |||||
| Improves project transparency | |||||
| Reduces resource and time waste | |||||
| Reduces the overall project cost | |||||
| Improves the communication between contractors and clients. | |||||
| Essential for choosing routing options and traffic management | |||||
| Helps plan for risk contingency and prevention | |||||
| Helps in employee training and understanding of the project deliverables. | |||||
Appendix B
Table A1.
Cronbach’s coefficient alpha test.
Table A1.
Cronbach’s coefficient alpha test.
| Cronbach Coefficient Alpha with Deleted Variable | |||||
|---|---|---|---|---|---|
| Deleted Variable | Raw Variables | Standardized Variables | Label | ||
| Correlation withh Total | Alphha | Correlation withh Total | Alphha | ||
| First_Choice | 0.602894 | 0.666069 | 0.668308 | 0.663931 | First_Choice |
| Everyone_Understands | 0.202973 | 0.535725 | 0.29877 | 0.586641 | Everyone_Understands |
| Special_Training | 0.084642 | 0.639089 | 0.076339 | 0.674728 | Special_Training |
| Project_Detailing | 0.629774 | 0.252552 | 0.682763 | 0.649426 | Project_Detailing |
Appendix C. Regression Model for Dependent Efficiency Variables with Project Detailing
Table A2.
Total observations made.
Table A2.
Total observations made.
| Number of Observations Read | 136 |
| Number of Observations Used | 120 |
| Number of Observations with Missing Values | 16 |
Table A3.
Analysis of variance.
Table A3.
Analysis of variance.
| Analysis of Variance | |||||
|---|---|---|---|---|---|
| Source | DF | Sum of Squares | Mean Square | F Value | Pr > F |
| Model | 1 | 0.07473 | 0.07473 | 0.04 | 0.848 |
| Error | 118 | 239.12527 | 2.02649 | ||
| Corrected Total | 119 | 239.2 | |||
Table A4.
Root mean square error.
Table A4.
Root mean square error.
| Root MSE | 1.424 | R-Square | 0.0003 |
| Dependent Mean | 2.7 | Adj R-Sq | −0.0082 |
| Coeff Var | 52.72 |
Table A5.
Parameter estimates.
Table A5.
Parameter estimates.
| Parameter Estimates | ||||||
|---|---|---|---|---|---|---|
| Variable | Label | DF | Parameter Estimate | Standard Error | t Value | Pr > |t| |
| Intercept | Intercept | 1 | 2.78699 | 0.47124 | 5.91 | <0.0001 |
| Project_Detailing | Project_Detailing | 1 | −0.02411 | 0.12554 | −0.19 | 0.848 |
Figure A1.
The regression procedure of work speed.
Table A6.
Total observations made.
Table A6.
Total observations made.
| Number of Observations Read | 136 |
| Number of Observations Used | 120 |
| Number of Observations with Missing Values | 16 |
Table A7.
Analysis of variance.
Table A7.
Analysis of variance.
| Analysis of Variance | |||||
|---|---|---|---|---|---|
| Source | DF | Sum of Squares | Mean Square | F Value | Pr > F |
| Model | 1 | 15.00413 | 15.00413 | 10.36 | 0.0017 |
| Error | 118 | 170.92087 | 1.44848 | ||
| Corrected Total | 119 | 185.925 | |||
Table A8.
Root mean square error.
Table A8.
Root mean square error.
| Root MSE | 1.20353 | R-Square | 0.0807 |
| Dependent Mean | 3.275 | Adj R-Sq | 0.0729 |
| Coeff Var | 36.74898 |
Table A9.
Parameter estimates.
Table A9.
Parameter estimates.
| Parameter Estimates | ||||||
|---|---|---|---|---|---|---|
| Variable | Label | DF | Parameter Estimate | Standard Error | t Value | Pr > |t| |
| Intercept | Intercept | 1 | 2.04245 | 0.39841 | 5.13 | <0.0001 |
| Project_Detailing | Project_Detailing | 1 | 0.34159 | 0.10613 | 3.22 | 0.0017 |
Figure A2.
The regression procedure of transparency.
Table A10.
Total observations made.
Table A10.
Total observations made.
| Number of Observations Read | 136 |
| Number of Observations Used | 120 |
| Number of Observations with Missing Values | 16 |
Table A11.
Analysis of variance.
Table A11.
Analysis of variance.
| Analysis of Variance | |||||
|---|---|---|---|---|---|
| Source | DF | Sum of Squares | Mean Square | F Value | Pr > F |
| Model | 1 | 124.44236 | 124.44236 | 238.54 | <0.0001 |
| Error | 118 | 61.55764 | 0.52167 | ||
| Corrected Total | 119 | 186.00000 | |||
Table A12.
Root mean square error.
Table A12.
Root mean square error.
| Root MSE | 0.72227 | R-Square | 0.669 |
| Dependent Mean | 3.5 | Adj R-Sq | 0.6662 |
| Coeff Var | 20.63631 |
Table A13.
Parameter estimates.
Table A13.
Parameter estimates.
| Parameter Estimates | ||||||
|---|---|---|---|---|---|---|
| Variable | Label | DF | Parameter Estimate | Standard Error | t Value | Pr > |t| |
| Intercept | Intercept | 1 | −0.04964 | 0.2391 | −0.21 | 0.8359 |
| Project_Detailing | Project_Detailing | 1 | 0.98373 | 0.06369 | 15.44 | <0.0001 |
Figure A3.
The regression procedure of reducing waste.
Table A14.
Total observations made.
Table A14.
Total observations made.
| Number of Observations Read | 136 |
| Number of Observations Used | 120 |
| Number of Observations with Missing Values | 16 |
Table A15.
Analysis of variance.
Table A15.
Analysis of variance.
| Analysis of Variance | |||||
|---|---|---|---|---|---|
| Source | DF | Sum of Squares | Mean Square | F Value | Pr > F |
| Model | 1 | 3.99836 | 3.99836 | 2.38 | 0.1253 |
| Error | 118 | 197.92664 | 1.67734 | ||
| Corrected Total | 119 | 201.92500 | |||
Table A16.
Root mean square error.
Table A16.
Root mean square error.
| Root MSE | 1.29512 | R-Square | 0.0198 |
| Dependent Mean | 3.52500 | Adj R-Sq | 0.0115 |
| Coeff Var | 36.74109 |
Table A17.
Parameter estimates.
Table A17.
Parameter estimates.
| Parameter Estimates | ||||||
|---|---|---|---|---|---|---|
| Variable | Label | DF | Parameter Estimate | Standard Error | t Value | Pr > |t| |
| Intercept | Intercept | 1 | 2.88873 | 0.42873 | 6.74 | <0.0001 |
| Project_Detailing | Project_Detailing | 1 | 0.17633 | 0.11421 | 1.54 | 0.1253 |
Figure A4.
The regression procedure of reducing cost.
Table A18.
Total observations made.
Table A18.
Total observations made.
| Number of Observations Read | 136 |
| Number of Observations Used | 120 |
| Number of Observations with Missing Values | 16 |
Table A19.
Analysis of variance.
Table A19.
Analysis of variance.
| Analysis of Variance | |||||
|---|---|---|---|---|---|
| Source | DF | Sum of Squares | Mean Square | F Value | Pr > F |
| Model | 1 | 0.31770 | 0.31770 | 0.31 | 0.5783 |
| Error | 118 | 120.67397 | 1.02266 | ||
| Corrected Total | 119 | 120.99167 | |||
Table A20.
Root mean square error.
Table A20.
Root mean square error.
| Root MSE | 1.01127 | R-Square | 0.0026 |
| Dependent Mean | 4.00833 | Adj R-Sq | −0.0058 |
| Coeff Var | 25.22911 |
Table A21.
Parameter estimates.
Table A21.
Parameter estimates.
| Parameter Estimates | ||||||
|---|---|---|---|---|---|---|
| Variable | Label | DF | Parameter Estimate | Standard Error | t Value | Pr > |t| |
| Intercept | Intercept | 1 | 3.82898 | 0.33477 | 11.44 | <0.0001 |
| Project_Detailing | Project_Detailing | 1 | 0.04971 | 0.08918 | 0.56 | 0.5783 |
Figure A5.
The regression procedure of traffic management.
Table A22.
Total observations made.
Table A22.
Total observations made.
| Number of Observations Read | 136 |
| Number of Observations Used | 120 |
| Number of Observations with Missing Values | 16 |
Table A23.
Analysis of variance.
Table A23.
Analysis of variance.
| Analysis of Variance | |||||
|---|---|---|---|---|---|
| Source | DF | Sum of Squares | Mean Square | F Value | Pr > F |
| Model | 1 | 18.78600 | 18.78600 | 13.78 | 0.0003 |
| Error | 118 | 160.91400 | 1.36368 | ||
| Corrected Total | 119 | 179.70000 | |||
Table A24.
Root mean square error.
Table A24.
Root mean square error.
| Root MSE | 1.16777 | R-Square | 0.1045 |
| Dependent Mean | 3.45000 | Adj R-Sq | 0.0970 |
| Coeff Var | 33.84830 |
Table A25.
Parameter estimates.
Table A25.
Parameter estimates.
| Parameter Estimates | ||||||
|---|---|---|---|---|---|---|
| Variable | Label | DF | Parameter Estimate | Standard Error | t Value | Pr > |t| |
| Intercept | Intercept | 1 | 2.07083 | 0.38657 | 5.38 | <0.0001 |
| Project_Detailing | Project_Detailing | 1 | 0.38222 | 0.10298 | 3.71 | 0.0003 |
Figure A6.
The regression Procedure of Client Communication.
Table A26.
Total observations made.
Table A26.
Total observations made.
| Number of Observations Read | 136 |
| Number of Observations Used | 120 |
| Number of Observations with Missing Values | 16 |
Table A27.
Analysis of variance.
Table A27.
Analysis of variance.
| Analysis of Variance | |||||
|---|---|---|---|---|---|
| Source | DF | Sum of Squares | Mean Square | F Value | Pr > F |
| Model | 1 | 17.63832 | 17.63832 | 11.66 | 0.0009 |
| Error | 118 | 178.48668 | 1.51260 | ||
| Corrected Total | 119 | 196.12500 | |||
Table A28.
Root mean square error.
Table A28.
Root mean square error.
| Root MSE | 1.22988 | R-Square | 0.0899 |
| Dependent Mean | 3.37500 | Adj R-Sq | 0.0822 |
| Coeff Var | 36.44082 |
Table A29.
Parameter estimates.
Table A29.
Parameter estimates.
| Parameter Estimates | ||||||
|---|---|---|---|---|---|---|
| Variable | Label | DF | Parameter Estimate | Standard Error | t Value | Pr > |t| |
| Intercept | Intercept | 1 | 2.03862 | 0.40713 | −5.01 | <0.0001 |
| Project_Detailing | Project_Detailing | 1 | 0.37036 | 0.10846 | 3.41 | 0.0009 |
Figure A7.
The regression procedure of deliverable understanding.
References
- Al-Hazim, N.; Abu-Salem, Z.; Ahmad, H. Delay and cost overrun in infrastructure projects in Jordan. Procedia Eng. 2017, 182, 18–24. [Google Scholar] [CrossRef]
- Assaf, S.; Al-Heijji, S. Causes of delays in large coonstruction projects. Int. Jour. Proj. Manag. 2006, 24, 349–357. [Google Scholar] [CrossRef]
- Olawale, Y.; Sun, M. Construction project control in the UK: Current practice, existing problems and recommendations for future improvement. Int. J. Proj. Manag. 2015, 33, 623–637. [Google Scholar] [CrossRef]
- Arashpour, M.; Abbasi, B.; Arashpour, M.; Hosserni, M.; Yang, R. Integrated management of on-site coordination and off-site uncertinity: Theorizing risk analysis with a hybrid project setting. Int. J. Proj. Manag. 2017, 35, 647–655. [Google Scholar] [CrossRef]
- Mahamid, I.; Bruland, A. Cost Overrun Causes in Infrastructure Projects, Consultants Perspective. In Proceedings of the 2nd International Conference on Construction and Project Management, Singapore, 16–18 December 2011; pp. 6–10. [Google Scholar]
- Tezel, A.; Koskela, L.; Aziz, Z. Current condition and future directions for lean construction in highways projects: A small and medium-sized enterprises (SMEs) perspective. Int. J. Proj. Manag. 2018, 36, 267–286. [Google Scholar] [CrossRef]
- Hagan, G.; Bower, D.; Smith, N. Managing Complex Projects in Multi-Project Environments; School of Civil Engineering: Bristol, UK, 2011. [Google Scholar]
- Aziz, R.; Hafez, S. Applying lean thinking in construction and performance improvement. Alex. Eng. J. 2013, 52, 679–695. [Google Scholar] [CrossRef]
- Issa, U. Implementation of lean construction techniques for minimizing the risks effect on project construction time. Alex. Eng. J. 2013, 52, 697–704. [Google Scholar] [CrossRef]
- Mesaa, H.; Molenaar, K.; Alarconc, L. Comparative analysis between integrated project delivery and lean project delivery. Int. J. Proj. Manag. 2019, 27, 395–409. [Google Scholar] [CrossRef]
- Jamil, A.; Fathi, M. The integration of lean construction and sustainable construction: A stakeholder perspectivein analyzing sustainable lean construction strategies in Malaysia. Procedia Comput. Sci. 2016, 100, 634–643. [Google Scholar] [CrossRef]
- Koranda, C.; Chong, W.; Kim, C.; Chou, J.; Kim, C. An investigation of the applicability and sustainability of lean concepts to small construction projects. J. Civ. Eng. 2012, 16, 699–707. [Google Scholar] [CrossRef]
- Smyth, H. Construction industry performance improvement programs: The UK case of demonstration projects in the ‘Continuous Improvement’ program. Constr. Manag. Econ. 2010, 28, 255–270. [Google Scholar] [CrossRef]
- Baiden, B.; Price, A.; Dainty, A. The extent of team integration within construction projects. Int. J. Proj. Manag. 2006, 24, 13–23. [Google Scholar] [CrossRef]
- Regan, M.; Smith, P.; Love, E. Impact of the capital market collapse on public-private partnership infrastructure projects. J. Constr. Eng. Manag. 2010, 137, 6–16. [Google Scholar] [CrossRef]
- Hegazy, T.; Menesi, W. Critical path segments scheduling technique. J. Constr. Eng. Manag. 2010, 136, 1078–1085. [Google Scholar] [CrossRef]
- Pauget, B.; Wald, A. Relational competence in complex temporary organizations: The case of a French hospital construction project network. Int. J. Proj. Manag. 2013, 31, 200–211. [Google Scholar] [CrossRef]
- Soni, S.; Pandey, M.; Agrawal, S. Conflicts and disputes in construction projects: An overview. Int. J. Eng. Res. Appl. 2017, 40–42. [Google Scholar] [CrossRef]
- Muir, R. Application of Lean Construction Principles to Highway Projects: Analysis of Barriers to Timely Delivery of Service. Ph.D. Thesis, Drexel University, Philadelphia, PA, USA, 2012. [Google Scholar]
- Elkherbawy, A.; Lozano, J.; Ramos, G.; Turmo, J. Lean Construction in Road Projects; Universitat Politècnica de Catalunya, Barcelona TECH: Barcelona, Spain, 2018. [Google Scholar]
- Al-Aomar, R. Handling multi-lean measures with simulation and simulated annealing. J. Frankl. Inst. 2011, 348, 1506–1522. [Google Scholar] [CrossRef]
- Akanbi, O.; Oyedolapo, O.; Steven, G. Lean Principles in Construction. In Sustainable Construction Technologies; Elsvier: Amsterdam, The Netherlands, 2019; pp. 317–348. [Google Scholar]
- Miller, C.; Packham, G.; Thomas, B. Harmonization between main contractors and subcontractors: A prerequisite for lean construction? J. Constr. Res. 2002, 3, 67–82. [Google Scholar] [CrossRef]
- Shewchuk, J.; Guo, C. Panel stacking, panel sequencing, and stack locating in residential construction: Lean approach. J. Constr. Eng. Manag. 2012, 138, 1006–1016. [Google Scholar] [CrossRef]
- Babalola, O.; Ibem, E.; Ezema, I. Implementation of lean practices in the construction industry: A systematic review. Build. Environ. 2018, 148, 34–43. [Google Scholar] [CrossRef]
- McGraw-Hill. Lean Construction: Leveraging Collaboration and Advanced Practices to Increase Project Efficiency; McGraw-Hill Construction: Bedford, MA, USA, 2013; Available online: https://www.leanconstruction.org/media/docs/Lean_Construction_SMR_2013.pdf (accessed on 10 May 2019).
- El-Gafy, M.; Abdelhamid, T. Using System Dynamics Modeling as a Lean Construction Work Structuring Tool. In Proceedings of the 16th Annual Conference of the International Group for Lean Construction, Manchester, UK, 16–18 July 2008; pp. 121–130. [Google Scholar]
- Tommelein, I. Discrete-Event Simulation of Lean Construction Processes. In Proceedings of the 5th Annual Conference of the International Group for Lean Construction, Gold Coast, Australia, 16–17 July 1997; pp. 121–136. [Google Scholar]
- Ansah, R.; Sorooshian, S. Effect of lean tools to control external environment risks of construction projects. Sustain. Cities Soc. 2017, 32, 48–356. [Google Scholar] [CrossRef]
- Zahidy, A.; Azlinna, A.; Sorooshian, S. Predictors for the success and survival of entrepreneurs in the construction industry. Int. J. Eng. Bus. Manag. 2015, 7. [Google Scholar]
- Issa, U. A model for time overrun quantification in construction of industrial projects based on risk evaluation. J. Am. Sci. 2012, 8, 523–529. [Google Scholar]
- Jayaram, A. Lean Six Sigma Approach for Global Supply Chain Management Using Industry 4.0 and IIoT. In Proceedings of the 2nd International Conference on Contemporary Computing and Informatics, Greater Noida, India, 14–17 December 2016; pp. 89–94. [Google Scholar]
- Seth, D.; Gupta, V. Application of value stream mapping for lean operations and cycle time reduction: An Indian case study. Prod. Plan. Control 2007, 16, 44–59. [Google Scholar] [CrossRef]
- Tezela, A.; Koskela, L.; Aziz, Z. Lean thinking in the highways construction sector: Motivation, implementation and barriers. Prod. Plan. Control 2018, 29, 247–269. [Google Scholar] [CrossRef]
- Tezel, A.; Aziz, Z. Visual management in highways construction and maintenance in England. Eng. Constr. Arch. Manag. 2017, 24, 486–513. [Google Scholar] [CrossRef]
- Eppler, M.; Bresciani, S. Visualization in management: From communicationto collaboration. A response to Zhang. J. Vis. Lang. Comput. 2013, 24, 146–149. [Google Scholar] [CrossRef]
- Nikakhtar, A.; Hosseini, A.; Wong, Y.; Zavichi, A. Application of lean construction principles to reduce construction process waste using computer simulation: A case study. Int. J. Serv. Oper. Manag. 2015, 20, 461–480. [Google Scholar] [CrossRef]
- Mojtahedi, S.; Mousavi, S.; Aminian, A. A non-parametric statistical approach for analyzing risk factor data in risk management process. J. Appl. Sci. 2009, 9, 113–120. [Google Scholar]
- Mojtahedi, S.M.H.; Oo, B.L. Possibility of Applying Lean in Post-Disaster Reconstruction: An Evaluation Study. In Proceedings of the 20th annual conference of the international group for lean construction (IGLC 20), San Diego, CA, USA, 18–20 July 2012. [Google Scholar]
- Moe, T.; Pathranarakul, P. An integrated approach to natural disaster management success factors. Disaster Prev. Manag. 2006, 15, 396–413. [Google Scholar]
- Faloughi, M.; Bechare, W.; Chamoun, J.; Hamzeh, F. Simplean: An Effective Tool for Optimizing Construction Workflow’. In Proceedings of the 22nd Annual Conference of the International Group for Lean Construction, Oslo, Norway, 25–27 June 2014; pp. 281–292. [Google Scholar]
- Mojtahedi, S.M.H.; Oo, B.L. Critical attributes for proactive engagement of stakeholders in disaster risk management. Int. J. Disaster Risk Reduct. 2017, 21, 35–43. [Google Scholar] [CrossRef]
- Rashid, M.; Bhat, S.; Bahsir, I. Road construction, maintenance challenges and their solutions in Kashmir. Irrig. Drain. Syst. Eng. 2017, 6, 1–5. [Google Scholar]
- Zidane, Y.; Johansen, A.; Ekambaram, A. Megaprojects challenges and lessons learned. Procedia Soc. Behav. Sci. 2013, 74, 349–357. [Google Scholar] [CrossRef]
- Akanni, P.; Oke, A.; Akpomiemie, O. Impact of environmental factors on building project performance in Delta State Nigeria. HBRC J. 2015, 11, 91–97. [Google Scholar] [CrossRef]
- Karim, H.; Magnusson, R. Road design for future maintenance problems and possibilities. J. Transp. Eng. 2008, 12, 523–531. [Google Scholar] [CrossRef]
- Rubina, I.; Baiocchi, A.; Sunyotoa, Y.; Turcanubc, I. Traffic management and networking for autonomous vehicular highway systems. Ad Hoc Netw. 2019, 83, 125–148. [Google Scholar] [CrossRef]
- Herrmann, C. Adaption of the Road Infrastructure to Climate Change. 2013. Available online: https://www.ectri.org/static/YRS13/Documents/Papers/Session5b_6a/YRS13_Session5b-6a_Herrmann_BASt-Paper.pdf (accessed on 2 May 2019).
- Chinowsky, P.; Schweikert, A.; Strzepek, N.; Strzepek, K. Infrastructure and climate change: A study of impacts and adaptations in Malawi, Mozambique, and Zambia. Clim. Chang. 2015, 130, 49–62. [Google Scholar] [CrossRef]
- Mishra, P.; Mishra, P.; Purohit, R. Material delivery problems in construction projects: A possible solution. Mater. Today Proc. 2018, 5, 6497–6501. [Google Scholar] [CrossRef]
- Bashir, A.; Suresh, S.; Oloke, D.; Proverbs, D.; Gameson, R. Overcoming the challenges facing lean construction practice in the UK contracting organizations. Int. J. Archit. Eng. Constr. 2015, 4, 10–18. [Google Scholar] [CrossRef]
- Sarhan, J.; Xia, B.; Fawzia, S.; Karim, A.; Olanipekun, A. Barriers to implementing lean construction practices in the Kingdom of Saudi Arabia (KSA) construction industry. Constr. Innov. 2018, 18. [Google Scholar] [CrossRef]
- Neuman, W.; Robson, K. Basics of Social Research: Qualitative and Quantitative Approaches; Pearson Education: London, UK, 2012. [Google Scholar]
- Creswell, J.; Clark, V. Designing and Conducting Mixed Methods Research; Sage Publications: London, UK, 2011. [Google Scholar]
- Bryman, A. Social Research Methods; Oxford University Press: Oxford, UK, 2008. [Google Scholar]
- Saunders, M.; Lewis, P.; Thornhill, A. Research Methods for Business Studies; Pearson Education: London, UK, 2007. [Google Scholar]
- Tongco, M. Purposive sampling as a tool for informant selection. Ethnobot. Res. Appl. 2007, 5, 147–158. [Google Scholar] [CrossRef]
- Ray, A. The Methodoloy of Sampling and Purposive Sampling; GRIN Verlag: Munich, Germany, 2012. [Google Scholar]
- Kihn, L.; Ihantola, E. Approaches to validation and evaluation in qualitative studies of management accounting. Qual. Res. Account. Manag. 2015, 12, 230–255. [Google Scholar] [CrossRef]
- Heale, R.; Twycross, A. Validity and reliability in quantitative studies. Evid. Based Nurs. 2015, 18, 66–67. [Google Scholar] [CrossRef] [PubMed]
- Nemoto, T.; Beglar, D. Developing Likert-scale questionnaires. JALT2013 Conf. Proc. 2014, 2013, 1–8. [Google Scholar]
- AERA. Code of Ethics. 2011. Available online: https://cdn.ymaws.com/wera.site-ym.com/resource/resmgr/a_general/aera.pdf (accessed on 15 April 2019).
- Mohajan, H. Two criteria for good measurements in research: Validity and reliability. Ann. Spiru Haret Univ. 2017, 17, 58–82. [Google Scholar] [CrossRef]
- Taherdoost, H. Validity and Reliability of the Research Instrument; How to Test the Validation of a Questionnaire/Survey in a Research. SSRN Electron. J. 2016, 5, 28–36. [Google Scholar] [CrossRef]
- Marasinghe, M.; Kennedy, W. SAS for Data Analysis: Intermediate Statistical Methods; Springer: Standford, CA, USA, 2008. [Google Scholar]
- Montgomery, D.; Peck, E.; Vining, G. Introduction to Linear Regression Analysis; John Wiley & Sons: Hoboken, NJ, USA, 2012. [Google Scholar]
© 2019 by the authors. Licensee MDPI, Basel, Switzerland. This article is an open access article distributed under the terms and conditions of the Creative Commons Attribution (CC BY) license (http://creativecommons.org/licenses/by/4.0/).