Abstract
Chinese online shopping industry has grown dramatically in recent decades. The purpose of this study is to investigate the key factors that affect the operating performance of online shopping companies in China. In particular, the study examines the three features of Chinese online shopping companies: (i) Multi-complex products/a single-special product, (ii) online store only/online and offline stores, (iii) US-listed/China-listed. The tests are leveraged by applying DuPont analysis which is widely used for identifying the sources of operating performance. DuPont analysis decomposes ROA (return on assets) into ATO (asset turnover) and PM (profit margin). A higher ATO represents efficient use of assets while a higher PM indicates efficient cost structure. By using seven Chinese online shopping companies, we find that companies selling multi-complex products have a higher ATO than companies selling a single-special product. However, multi-complex companies’ PM is lower than that of single-special companies, with no difference in ROA between those two groups. Second, online shopping companies with offline stores have a lower PM and ROA than online store only companies. Lastly, we document that US-listed online shopping companies have a higher ATO, PM, and ROA than China-listed companies. The results of this study provide important implications for the future development of the Chinese shopping industry. The findings may present the current situation and shortcomings of the companies, thereby playing a guiding role in the management and development of online shopping companies in China.
1. Introduction
With the popularization of computers and the rapid development of the Internet, the Chinese online shopping industry has grown dramatically in recent decades. This rapid growth of the online shopping industry brought many business opportunities. The expansion of the online shopping industry basically stems from its convenience. Online stores are an extension of the offline stores, which provides customers with more flexible shopping hours. To be more specific, first, for consumers, convenience and cheapness is the benefit of using online shopping companies [1]. Second, for merchants, because there is no inventory pressure on online sales and the operating costs are low, there are fewer business limitations compared to offline sales companies. It can be seen that online shopping has broken through the barriers of traditional business through shopping websites and it has a great appeal and influence on consumers.
In light of this rapid growth of the online shopping industry, one of the unknown black boxes is which features of online shopping companies lead to a successful operation in this industry. The purpose of this paper is to address this unanswered question by investigating the operating performance of Chinese online shopping companies. Consumers of online shopping companies may typically screen several alternatives of websites and compare quality of products and appropriateness of the prices without spending much time and effort. This is a common feature of online shopping that maximize consumers’ convenience. In addition, online shopping companies also have unique characteristics that affect their performance. For instance, the authors of [2] explore the factors that influence customers’ repurchase intentions in online shopping. By using survey data from online shopping customers of PCHome, which is the most widely used online store in Taiwan, the paper find that among several dimensions, trust, perceived ease of use, perceived usefulness, and enjoyment are the main factors that affect customers’ repurchase intentions.
Expanding on prior research, the current paper examines the three features of Chinese online shopping companies: (i) Multi-complex products/a single-special product, (ii) online store only/online and offline stores, (iii) US-listed/China-listed. Then, it explores the effect of these three features of online shopping companies on their operating performance.
The tests are leveraged by applying DuPont analysis. DuPont analysis is a widely used method for examining the sources of operating performance [3,4]. It breaks down the operating performance (ROA, net income divided by average assets) into two subcomponents which are asset turnover (ATO, sales divided by average assets) and profit margin (PM, net income divided by sales). The former one indicates how a company efficiently operates its assets to generate sales. The latter one represents the efficiency in cost structure. Using these components, the current paper explores how Chinese online shopping companies generate their profits.
By using seven Chinese companies from 2012 to 2017 (42 company-years), we find that the number of products that a company treats, whether it is an online store only or has both an online and offline store, and the location of the listed stock market affect the operating performance of the online shipping company. Specifically, we first find that companies selling multi-complex products have a higher ATO than companies selling a single-special product. However, multi-complex companies’ PM is lower than that of single-special companies, with no difference in ROA between those two groups. Second, online shopping companies with offline stores have a lower PM and ROA than online store only companies. Lastly, we document that US-listed online shopping companies have a higher ATO, PM, and ROA than China-listed companies.
From the results, our study makes suggestions to Chinese online companies. First, as multi-complex products have a lower PM and a similar ROA to single-special product companies, we suggest that companies with multi-complex products develop products that can differentiate prices. Selling products with a price premium can mitigate their inefficient cost structure. Second, in order to seek breakthroughs, it is recommended that online shopping companies with offline stores should enhance the efficiency of the cost structure, increase the sales revenue, or both. Third, China-listed companies have to find a way to attract overseas markets.
Our paper contributes to the practice and literature in the following ways. First, we track the sources of higher operating performance of the Chinese online shopping industry. As their trading volumes have increased rapidly in the past 20 years, we identify factors that have been contributed to their rapid growth. Second, we have also contributed to the DuPont analysis literature. The literature generally focuses on the usage of DuPont components with respect to their predictability on future profits. By providing empirical evidence that DuPont components are influenced by companies’ different types of stores or listing regions, we suggest practical usage of DuPont analysis. Lastly, a large set of prior studies have generally been conducted on the online shopping industry using survey data or experimental settings [2,5]. Thus, our empirical design and findings shed light on prior literature.
Our study also has a limitation. There is a chance that our result was influenced by different types of consumers. For instance, the authors of [6] make a distinction among different types of customers; the types are convenience shoppers, variety seekers, balanced buyers, and store-oriented shoppers. Convenience shoppers and variety seekers exhibit the highest purchase frequency which makes these consumer types important to online retailers. As we do not have an adequate method of controlling for different types of consumers, we are cautious about interpreting and generalizing our results to other cases.
The remainder of the paper proceeds as follows. Section 2 describes the growing trend in the Chinese online shopping industry. Section 3 presents prior research and develops our hypotheses. Section 4 shows the research design, and Section 5 presents empirical findings. Lastly, Section 6 concludes the paper.
2. The Growing Trend in the Chinese Online Shopping Industry
2.1. User Size of Online Shopping Companies
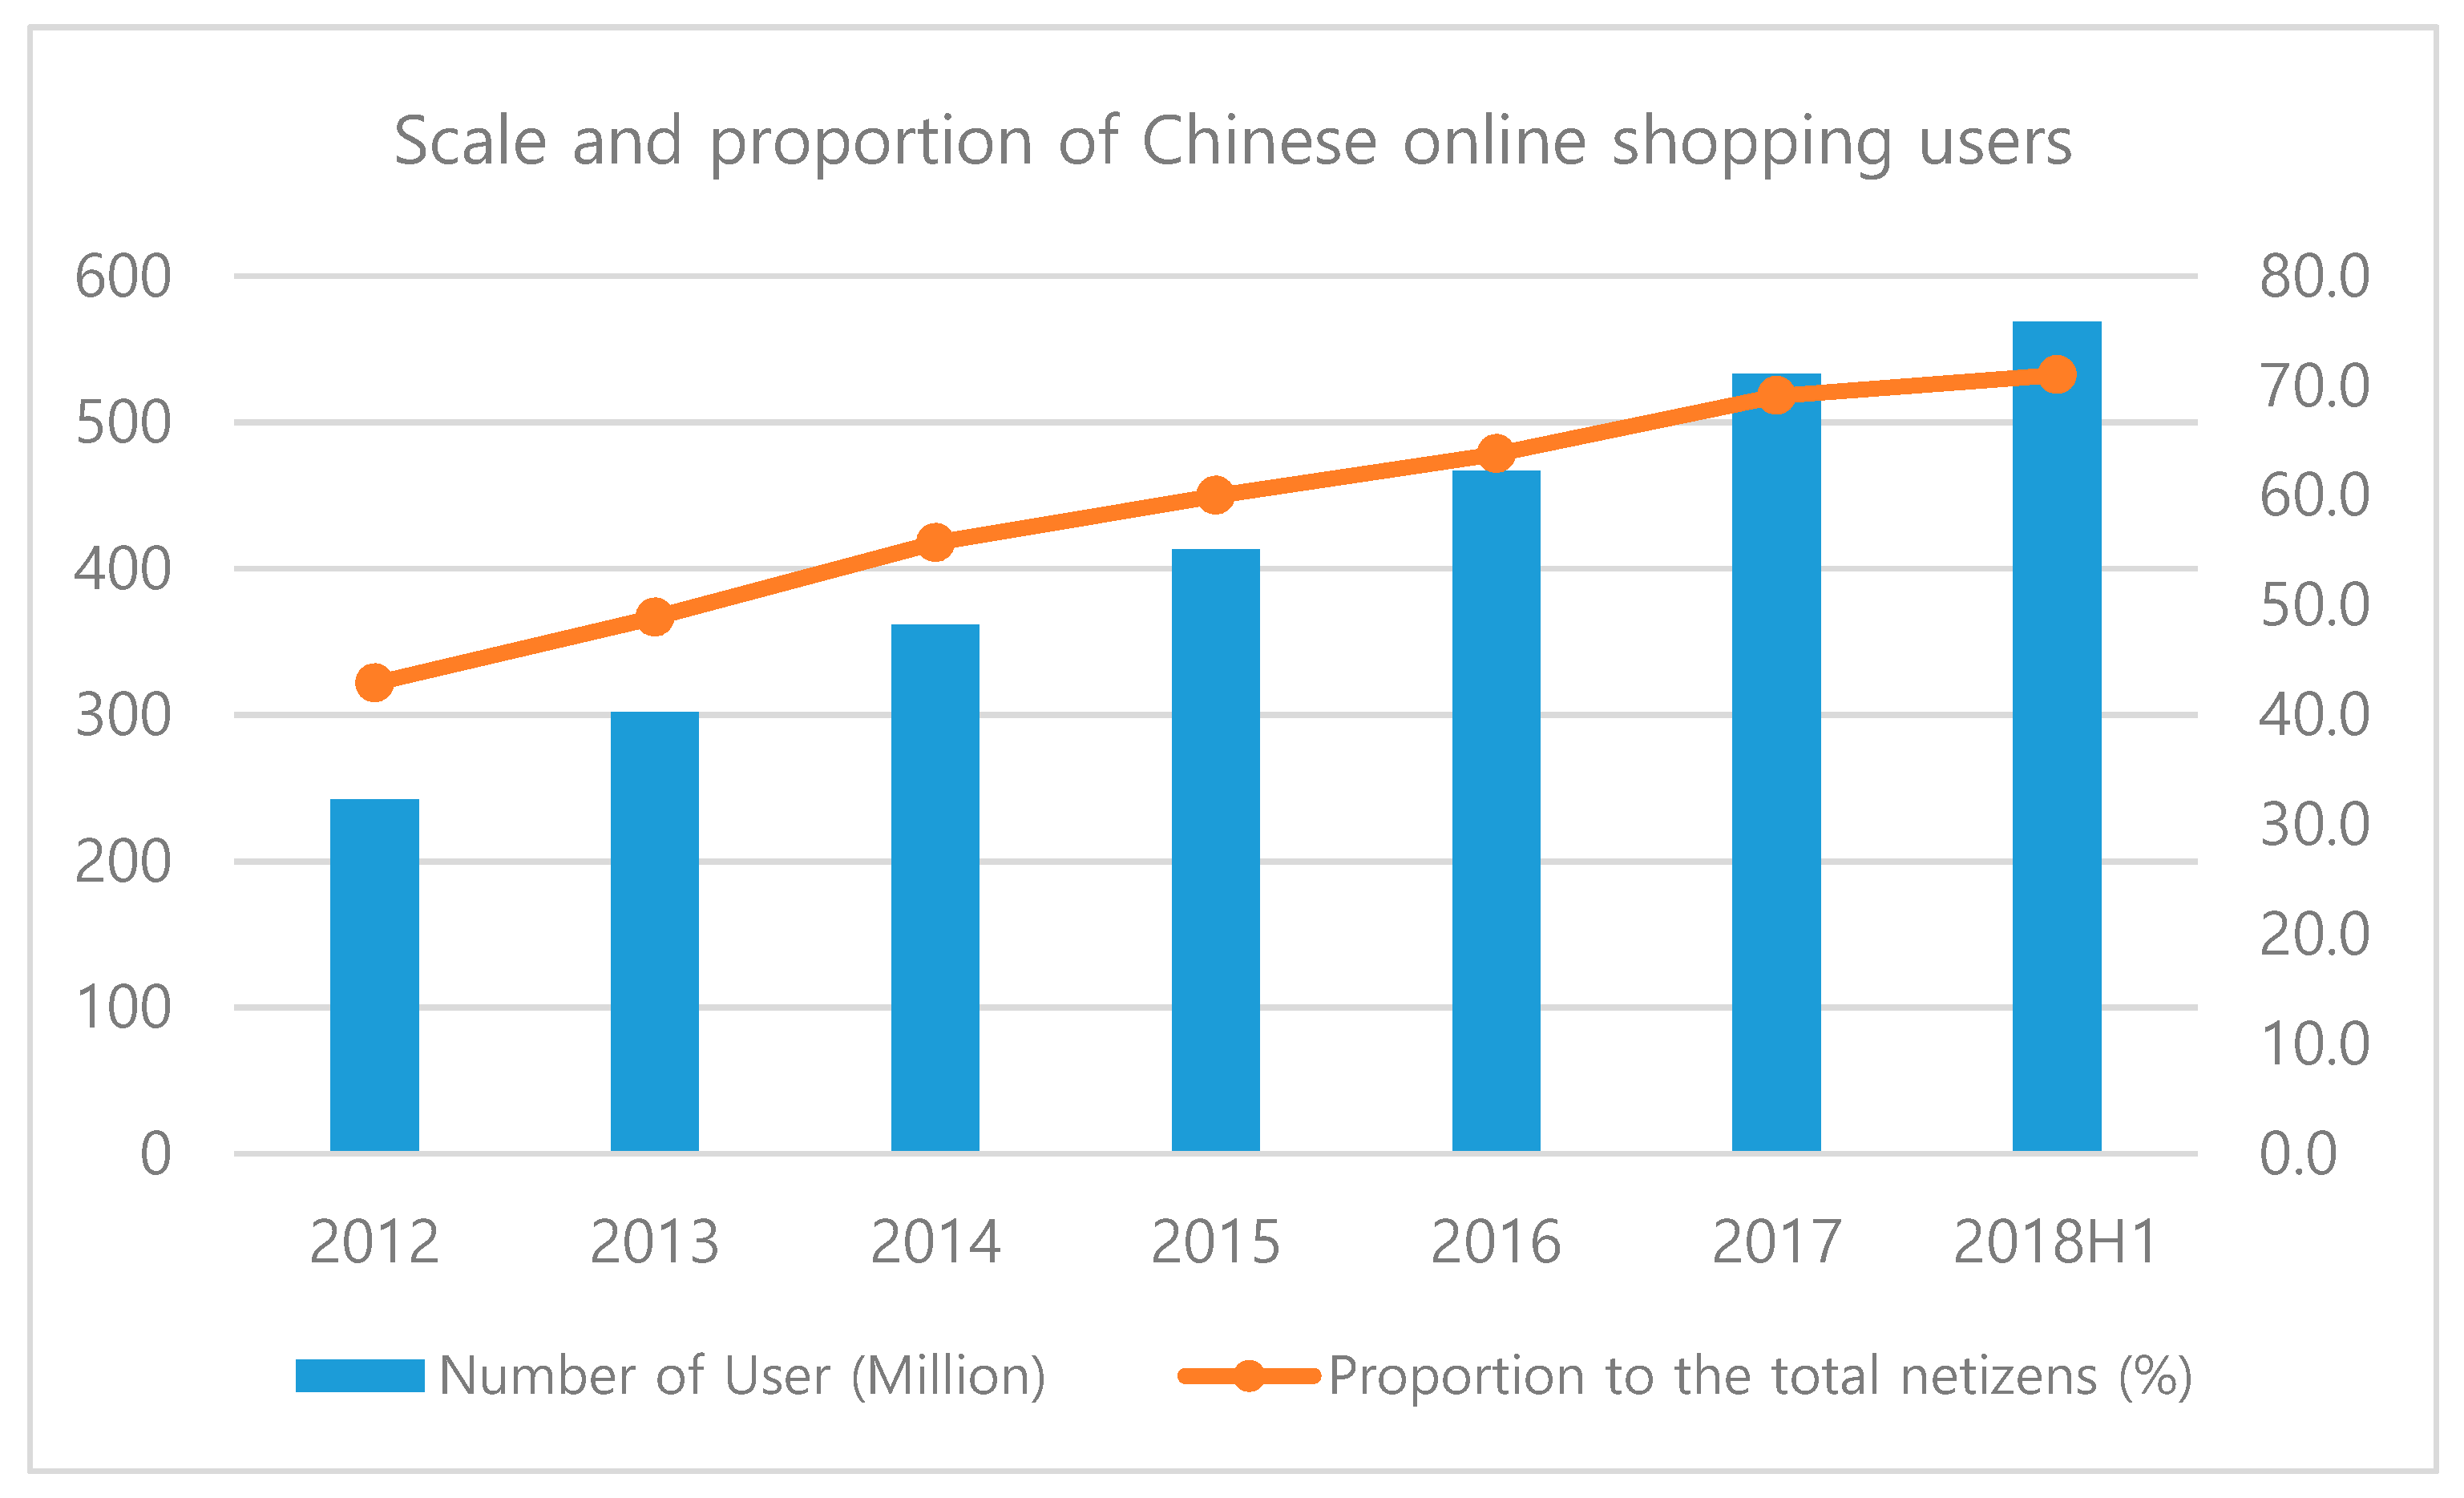
The popularity of online retailing has brought huge opportunities and challenges to retailers. By June 2018, the number of Chinese netizens reached 802 million, and the number of new Internet users in the first half of 2018 was 29.68 million, an increase of 3.8% compared with 2017 (Zhiyan Consulting Group). The Internet penetration rate was 57.7%. As shown in Figure 1, in the first half of 2018, the size and proportion of online shopping users in China showed that the number of users was 568.92 million, an increase of 35.6 million compared with the end of 2017, accounting for 71% of total netizens. This rapid growth in both Internet and online shopping users in China provides business opportunities to Chinese online shopping companies.

Figure 1.
This is a figure that shows an increasing trend in Chinese online shopping users (Source: Zhiyan Consulting Group, www.chyxx.com).
2.2. Trading Volume of Online Shopping Companies
In contrast to the rapid growth of the online shopping industry, the growth rate of Internet retail sales has started to decline since 2013. The growth rate in 2017 was 21.28%, and the growth rate in the previous four years was reduced by more than half. Nevertheless, by splitting the retail sales from the total Internet sales, that is, by placing the focus on Internet online shopping, online shopping malls showed an increase or at least remained stable in terms of their trading volume. For instance, Alibaba Group’s trading volume ratio has been stable at around 80% for a long time. The proportion of JD shopping malls increased from 4.09% in 2011 to 12.18% in 2015. In 2015, the turnover of Alibaba, JD, and Vipshop accounted for more than 90%, which can roughly represent the development of the online retail industry.
3. Literature Review and Hypothesis Development
3.1. Prior Research on DuPont Analysis
The traditional financial analysis indicators mostly analyze corporate finance from a certain angle, and it is difficult to make a very comprehensive evaluation. Being a comprehensive, simple, and practical financial analysis and evaluation system, the DuPont analysis system takes the key indicator of ROA as the core and uses the links between assets, profits, and other indicators to analyze at different levels and gradually progress to form a complete financial analysis system. It is a comprehensive financial analysis method that was invented and used by the DuPont Company in the United States in 1910. At first, the DuPont Company developed a comprehensive evaluation system for financial evaluation analysis in order to assess the performance of its group companies. The essence is based on the net asset return rate and the net profit of assets. The equation is as follows:
In Equation (1), ATO represents efficient use of assets. Higher sales to given assets indicate that a company uses its assets efficiently and generates greater revenues. PM represents a company’s cost structure. If a company reports a higher net income relative to sales, it means that it has a lower cost due to efficient cost structure.
Prior research on DuPont analysis shows usage of DuPont components in various aspects. For instance, the authors of [7] show that information technology-enabled competitive advantage comes from a combination of increased PM and ATO. The paper shows the positive correlation between successful investment in IT and financial performance. DuPont analysis is also used as a diagnostic for earnings management. The authors of [8] document that the changes in ATO and PM in opposite directions are the signals of earnings management. The paper indicates that, for instance, the increase in net income relative to sales (which indicates an increase in PM) and the increase in net accounts receivable relative to sales (which indicates a decrease in ATO) causes upward earnings management.
Another stream of research on DuPont components find that the change in ATO is positively related to future changes in earnings [9]. Reference [10] extends these findings by reporting results based on in-sample parameter estimates. The study documents a significant relationship between the future RNOA and the change in PM. Overall, prior research find that DuPont components are useful in predicting future earnings.
Chinese academics also introduce DuPont analysis in various ways. The authors of [11] investigate the information content of core indexes and component indexes of DuPont analysis. The paper insists that investors of China A-share markets should pay more attention to the core indexes instead of the component indexes when evaluating companies. By comparing Chinese firms with US firms, the authors of [12] show that Chinese firms have higher profitability than their U.S. counterparts, specifically, 15.1 percent versus 8.1 percent. The paper also finds that this result is driven by the higher growth opportunities in China; thus, after controlling for growth rates, US firms exhibit greater efficiency in generating their free cash flows. However, to this day, no papers have directly focused on Chinese online shopping companies; therefore, our paper explores their operating performance in the application of DuPont analysis.
3.2. Hypotheses Development
This paper introduces three dimensions of online shopping companies. First, the study expects that the types of products sold might affect the operating performance of online shopping companies. Online shopping companies can choose different business strategies as they can focus on single product or multi-products.
Since online stores have non-limited space, by selling multiple products, a company can maximize the efficiency of asset management. However, handling multiple products with different cost structures can reduce the efficiency of cost management. For instance, the authors of [13] find evidence that inventory cost and delivery cost affect the distribution strategy and customer service. In ex-ante, these discussions lead us to expect a higher ATO and lower PM for multi-complex products companies compared to single-special product companies. We develop our first hypothesis as follows.
Hypothesis 1:
ATO, PM, and ROA of multi-complex products companies are systematically different from those of single-special product companies.
Second, companies that only operate an online store may be systematically different in their operating performance from those that also operate an offline store. Some online shopping companies have dual stores which are an online website and offline shopping mall. Prior literature shows mixed evidence of having traditional offline stores for online shopping companies. For instance, the authors of [5] find that both online and offline stores have positive effects on the usefulness, attitude, and intention to use than online only companies. Their finding suggests that the managers of online shopping companies should not only emphasize the presence of an internet based online shopping mall but also care about the operation of offline stores if they seek to increase their visitors. In contrast, the authors of [1] find that customers are less price sensitive when shopping at an online store than they are when shopping at offline stores. These less price sensitive customers allow companies to charge a price premium for the product in the online market.
Moreover, managing the leased building or land to operate the offline store will make asset management more difficult. Thus, it leads us to predict a higher (lower) ATO for online only (online and offline) companies. Similarly, online only companies may also have efficient cost structures as there are fewer costs associated with store management. In contrast, the complexity of the costs involved in employees’ salaries and store management can reduce the efficiency of the cost structure of companies carrying an offline store. These discussions lead to a higher (lower) expectation of PM for online only (online and offline) companies. Based on these discussions, we propose the following hypothesis.
Hypothesis 2:
ATO, PM, and ROA of online store only companies are systematically different from those of online and offline store shopping companies.
Third, companies that are listed in the US stock market may be systematically different in their operating performance from those that are listed in the Chinese stock market. The authors of [14] document that non-US companies listed in the US face consistent non-normal yields before and after listing, increased investor recognition, and increased stock liquidity. Using 153 non-US companies from Canada, Europe, and the Asia-Pacific Basin region that were listed in the US stock market, the paper find that US-listed non-US companies earn cumulative abnormal returns of 19 percent during the year before listing, and an additional 1.20 percent during the listing week. Although China-listed companies may benefit from greater growth opportunities [13], companies listed in the US may have a chance to further develop with respect to internationalization and diversification. This means that US-listed online shopping companies have the opportunity to sell goods to a wider range of consumers. In addition, the authors of [15] have pointed out that political ties in Chinese companies are inefficient at improving their performance when technology changes rapidly. Thus, we form our third hypothesis as follows.
Hypothesis 3:
ATO, PM, and ROA of US-listed online shopping companies are systematically different from those of China-listed online shopping companies.
4. Research Design
4.1. The Sample
Our sample is constructed by using China’s most famous online shopping companies. In particular, we use seven online shopping companies: Alibaba Group, JD, Vipshop, Jumei Youpin, Suning Tesco, GOME, and COFCO. Since we use these seven Chinese companies from 2012 to 2017, our sample consisted of 42 company-years.
Table 1 depicts a brief description of seven online shopping companies. Since we divide each group based on product categories (multi or single product), having an offline store or not, and listed market (US or China), the table summarizes these classifications. Jumei Youpin and COFCO sell one single product and the others sell at least two or more products. Suning Tesco and GOME have offline stores while others do not. Alibaba Group, JD, Vipshop, and Jumei Youpin are listed in the US stock market while Suning Tesco, GOME, and COFCO are listed in the Chinese stock market. The financial data used in the paper are available publicly through the annual reports of each company. In the following paragraphs, we provide detailed descriptions of these companies.

Table 1.
Description of online shopping companies in China.
First, Alibaba Group was founded in 1999 by 18 people led by Jack Ma (www.alibabagroup.com). It now operates a number of business segments, including Taobao.com, Tmall, Alibaba.com, and others. The online shopping website of Alibaba Group, which is the internationally leading platform (www.alibaba.com), was also launched in 1999. In September 2014, Alibaba Group listed its stock on the New York Stock Exchange. In the fiscal year ending on March 31, 2019, Alibaba Group’s Chinese e-commerce corporation recorded revenues of 247.615 and 27.725 billion yuan for Chinese and international online sales, respectively. These translate to approximately 35.8 billion and 4.0 billion US dollars.
Second, JD is China’s self-operated e-commerce company. JD.com is China’s largest online retailer and its biggest overall retailer (https://corporate.jd.com/home). It is a member of the Fortune Global 500. On June 18, 1998, Mr. Liu Qiangdong started his business in Zhongguancun and established the JD Company. They officially obtained a virtual carrier license in 2013. It has been listed in the National Association of Securities Dealers Automated Quotations (NASDAQ) Stock Exchange since May 2014. In the year ending on December 31, 2018, JD reported a net revenue of 67,198 million US dollars.
Next, Vipshop was established in August 2008. The main business of Vipshop is the online sale of discounted goods (www.vip.com). On March 23, 2012, Vipshop went public in the New York Stock Exchange. At present, Vipshop has become the third largest e-commerce company in China. Vipshop Holdings reported an annual revenue of 12,294 million US dollars in 2018.
Jumei Youpin is a cosmetics limited-time sale mall, founded in March 2010 (bj.jumei.com). On May 16 of 2014, Jumei Premium was officially listed on the New York Stock Exchange. Jumei Youpin reported 648.16 million US dollars of sales revenue in 2018.
Our fifth company was Suning Tesco. It is a new generation B2C online shopping platform that strengthens the simultaneous development of virtual networks and physical stores (www.suning.com). Suning is one of the largest non-government retailers in China. The headquarters is located at Nanjing. It has been listed on the Shenzhen Stock Exchange since 2004. Suning.com reported 244.06 billion yuan of sales revenue in 2018.
Next, GOME was founded on January 1, 1987 and is a retail chain of home appliances in mainland China (www.gome.com.cn). In April 2011, GOME’s e-commerce website was launched. It takes the lead in innovating the e-commerce operation model of "B2C+ physical store" integration. It has been listed on the Hong Kong Stock Exchange since July 2004. Gome.com has reported 65,884 million yuan of sales revenue as of 31 March 2019.
Lastly, COFCO is a food B2C e-commerce company. It was founded in 1949 and its shopping website was launched in 2009 (www.womai.com). COFCO has nine business segments including COFCO Grain and Oil, China Grain and Oil, China Food, Real Estate Hotels, China Soil Animals, COFCO Tunhe, COFCO Packaging, COFCO Development, and Finance. Its website-based shopping mall is China’s first large-scale consumer-oriented online food retailer. Womai.com reported 524.9 million US dollars of sales revenue in 2018.
4.2. Research Model
ROA is used to test financial performance [16]. We propose the following model to test our hypotheses.
In Equation (2), the dependent variable is ROA or its decomposed DuPont index, ATO and PM. ROA equals the net income divided by total assets; ATO is calculated as sales divided by total assets; PM is measured as the net income divided by sales. Our variables of interests are Multi-complex, Offline, and US-listed. These variables equal to one if a company sells multi-products, operates online and offline stores, and listed in US stock markets, respectively. The positive (or negative) coefficient of α1 supports our hypotheses.
We included several control variables that might affect operating performance to address the omitted variable problem. SIZE is a natural logarithm of total assets; LEV is total liabilities divided by total assets; CurRatio is current assets divided by current liabilities; INVREC is the sum of inventories and accounts receivable divided by total assets; Loss equals one if a company reports net losses and zero otherwise. Lastly, we controlled for year fixed effect (Year FE).
Company size is included in the model to control for size effect on operating performance [17]. Prior research generally documents a positive association between company size and performance as large companies have sufficient resources to support their profits. We next control for leverage to mitigate the effect of financial structure on performance [18,19]. The current ratio represents the slack resources of a company. Previous studies document that a company’s performance increases as slack resources increase [20]. Thus, we include current ratio into the model. Lastly, we control for the sum of inventories and accounts receivable to total assets which indicates operating complexity of the company. All the reported t-statistics are adjusted to be heteroscedasticity consistent.
5. Empirical Findings
5.1. Descriptive Statistics
Table 2 presents descriptive statistics of the variables. Of the sample, 71 percent, 29 percent, and 57 percent of companies were classified as multi-complex product (Multi-complex), online and offline (Offline), and US-listed (US-listed) groups, respectively. In comparison with these groups, 29 percent, 71 percent, and 43 percent are then automatically classified as the counterparts which are the single product, online store only, and China-listed groups. The variables are generally calculated using ratio values and were based on one million Yuan (CNY). The mean values of ROA, ATO, and PM were 0.071, 1.936, and 0.061, respectively. On average, the size (SIZE) of the companies was 5.543. The mean values of the leverage ratio (LEV) and current ratio (CurRatio) were 0.577 and 1.609. The sum of inventories and accounts receivable to total assets (INVREC) was 0.206 and 31 percent of company-years report net losses (Loss) throughout the sample period.
Table 2.
Descriptive statistics.
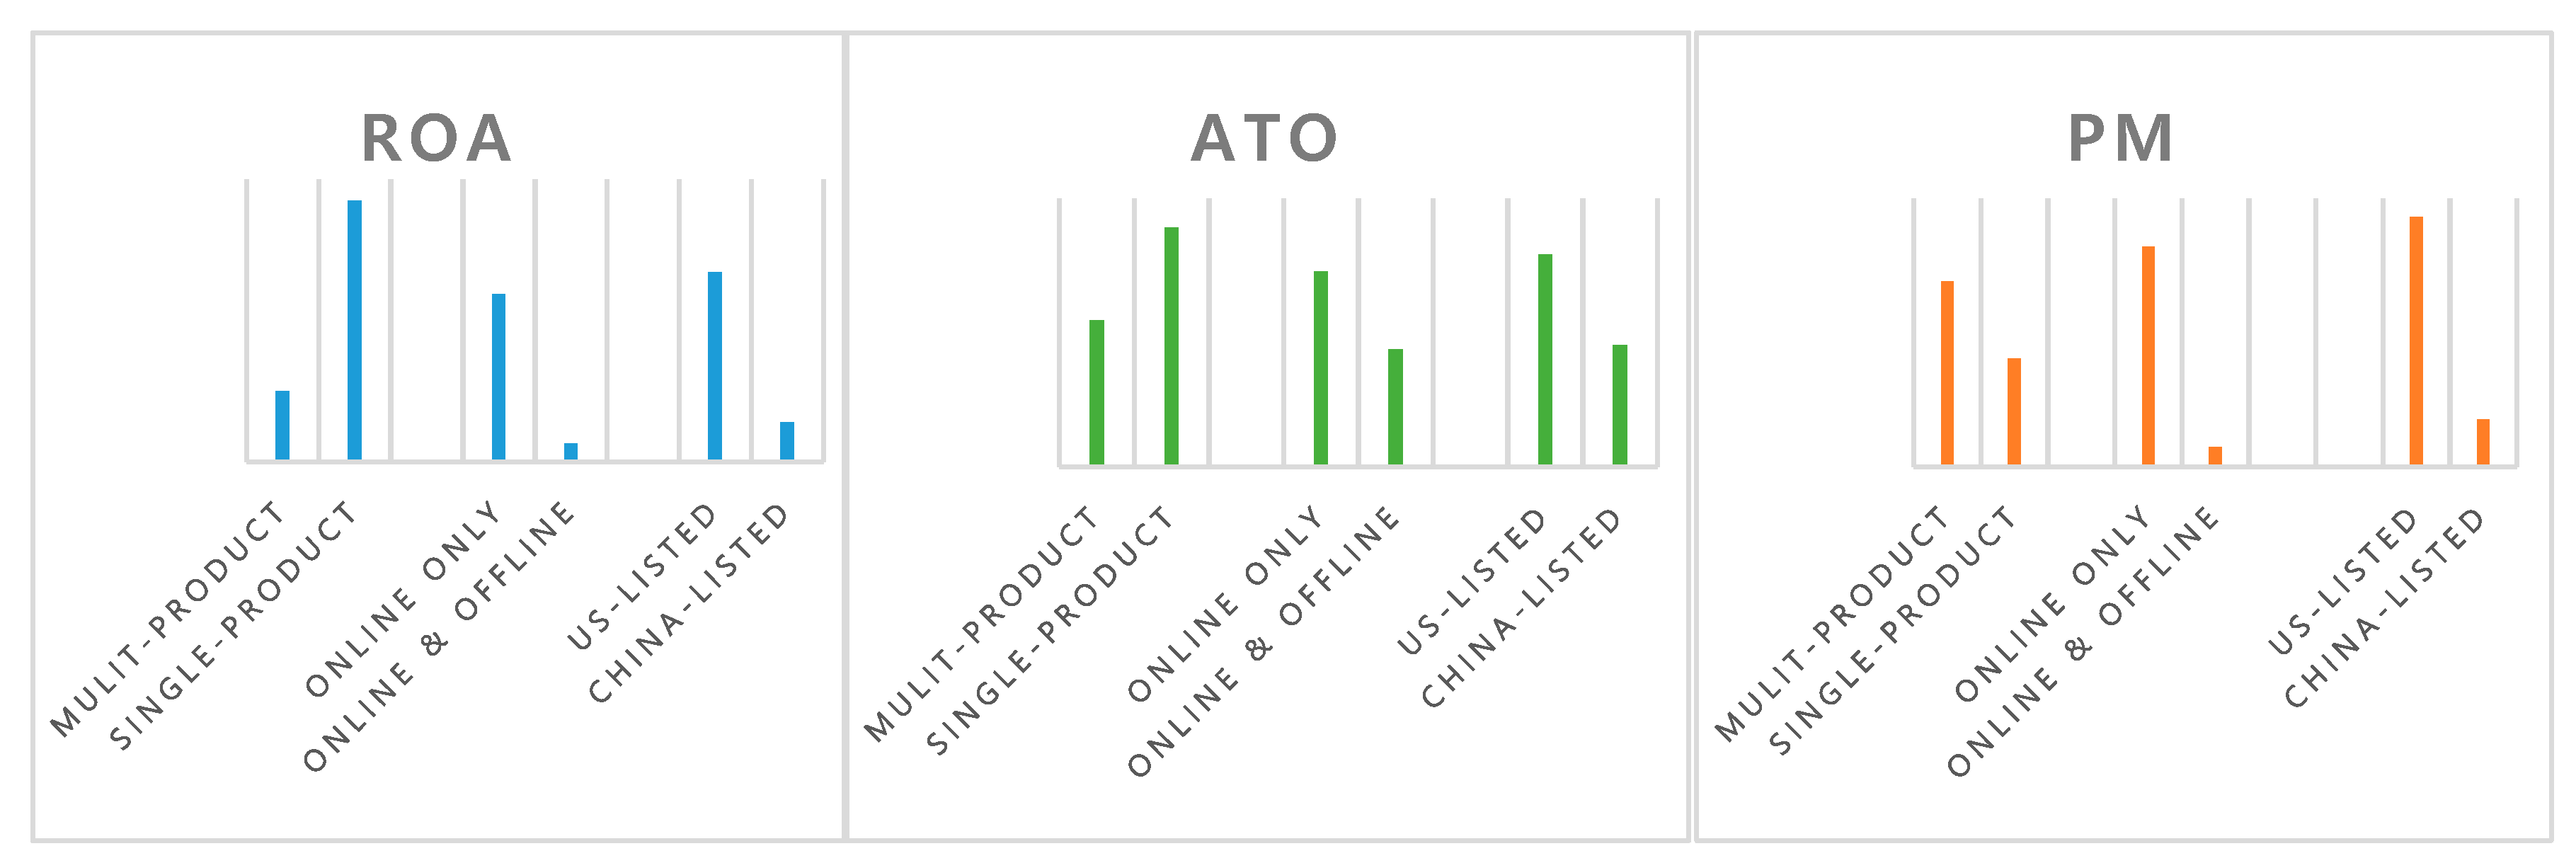
Figure 2 describes the univariate comparisons between Multi/Single product, Online/Offline store, and US/China listed groups, respectively, with respect to ROA, ATO, and PM. Three figures are based on the mean values of each category. In every three performance measures, online only and US-listed groups are superior to offline and China-listed groups. However, multi-complex product groups have a higher PM and lower ROA and ATO compared to single product groups. Since these comparisons do not control for other company characteristics, we are cautious about interpreting and generalizing the results.

Figure 2.
Univariate mean comparisons between Multi/Single product, Online/Offline store, and US/China listed groups.
Table 3 is the result of the Pearson correlation analysis among the relevant variables. As can be seen from the table, Multi-complex is positively correlated with Offline but has an insignificant relationship with US-listed. This means that online shopping companies selling multi-products operate offline stores along with online stores. However, there is no systematic relationship between selling multi-products and the listed market. Offline and US-listed are negatively correlated. Thus, online companies with offline stores are generally listed in the China market. It is also presented previously in Table 1 that the two companies, Suning Tesco and GOME, which operate offline stores, are listed in the China stock market.
Table 3.
Correlation Matrix.
ROA and ATO have no significant correlation with three performance measures. In contrast, PM is negatively (positively) correlated with Offline (US-listed). Nevertheless, we are again cautious about making interpretations from these correlations in advance because company characteristics are not controlled for in these univariate tests. Obviously, ATO and PM are positively correlated with ROA.
Turning to the control variables, ROA is negatively associated with SIZE and Loss. ATO is negatively related with SIZE. In contrast, PM is positively related with SIZE and CurRatio and negatively related with INVREC and Loss.
5.2. Regression Results
Hereafter, the following tables are the test results of the regression analysis. Table 4 examines the results of Hypothesis 1. There is no significant relationship between Multi-complex and ROA. The coefficient of Multi-complex was 1.776 and positive at the 10% level when the dependent variable is ATO. In terms of economic significance, Multi-complex companies reported a 178% higher ATO than Single-specialty companies. From the results, the coefficient of Multi-complex is -0.080 when the dependent variable is PM and significant at a 5% level. Thus, Multi-complex companies reported an 8% lower PM than Single-specialty companies. Given that an online company has no physical limitation on its space, by selling multiple products, an online company can maximize the efficiency of operating assets. In contrast, handling multiple products with different cost structures can reduce the efficiency of cost management. Overall, the positive and negative effects from ATO and PM, respectively, offset each other leading to no difference in ROA.
Table 4.
The effect of being Multi-complex on operating performance (testing H1).
Other control variables show plausible results. For instance, large companies proxied by the natural logarithm of total assets (SIZE) are positively correlated with PM but are negatively correlated with ROA and ATO. ROA and PM decreased as INVREC increased. Reporting losses (Loss) is negatively correlated with ROA and PM.
Table 5 shows the results of testing Hypothesis 2. The coefficient of Offline is negative and significant at a 10% level when the dependent variable was ROA (coefficient = −0.055). In terms of economic significance, companies having offline stores had a 5.5% lower ROA than that of online-only companies. This negative operating performance is derived by PM. The coefficient of Offline is −0.116 and significant at a 1% level when the dependent variable is PM, but it is not significant when the dependent variable is ATO.
Table 5.
The effect of offline stores on operating performance (testing H2).
Overall, offline business activities are reported to have a lower performance than online only business activities. It can be argued that the performance of offline businesses is hindered more by lower profit margins than asset management. It may have been caused by higher product prices due to employees’ salaries and store rental fees. In order to seek breakthroughs, it is recommended that online shopping companies with offline stores should enhance the efficiency of the cost structure, increase the sales revenue, or both.
Lastly, Table 6 examines the results of Hypothesis 3. From the results, the coefficients of US-listed are all positive and significant at a 5% or higher level. It can be seen that there is a clear difference between China-listed and US-listed companies. In terms of economic significance, companies listed in US markets had a 9.4% higher ROA than companies listed in China markets. This is because the economic environment and market policies of the United States can reduce the economic risks of enterprises, attract financing, and increase profits. It is an interesting result that both ATO and PM are higher for US-listed companies, thereby leading to a higher ROA. The results suggest that China-listed companies need to find a way to develop overseas markets.
Table 6.
The effect of listed countries on operating performance (testing H3).
6. Conclusions
This study uses China’s seven largest online stores and tests the operating performance of these companies using DuPont analysis. The study first constructs the theoretical framework of the DuPont analysis system. Next, it uses DuPont analysis to analyze the performance of the companies. Third, the study examines the effect of the three features of Chinese online shopping companies: (i) Multi-complex products/a single-specialty product, (ii) online store only/online and offline stores, (iii) US-listed/China-listed on operating performance.
We make the following predictions for each feature. First, since online stores have non-limited space, by selling multiple products, a company can efficiently use the assets. However, companies handling multiple products with different cost structures may report a lower PM than single-specialty product companies. Next, companies that only operate online stores may be systematically different in their operating performance from those that also operates offline stores. For instance, managing fixed assets to operate the offline store will make their asset management more difficult. Similarly, the complexity of the costs involved in employees’ salaries and store management can reduce the efficiency of the cost structure and lead to a lower expectation of PM. Lastly, companies that are listed in the US stock market may be systematically different in their operating performance from those that are listed in the Chinese stock market. Since US-listed companies have more opportunities to sell their products to a wider range of consumers, we expect a higher financial performance for US-listed companies than China-listed companies.
By using seven Chinese companies from 2012 to 2017 (42 company-years), we find that multi-complex companies have a higher ATO than single-specialty companies. However, multi-complex companies’ PM is lower than that of single-specialty companies, with no difference in ROA between those two groups. Second, online shopping companies with offline stores have a lower PM and ROA than online only companies. Lastly, we document that US-listed online shopping companies have a higher ATO, PM, and ROA than that of Chine-listed companies.
The findings of the study may present the current situation and shortcomings of the companies. It can play a guiding role in the management and development of online shopping companies in China. In particular, we suggest practical recommendations for decision and policy makers as well as practitioners. Companies handling multiple products should improve cost structure in order to report higher profit margins. For companies with offline stores, to seek breakthroughs, we recommend that they should enhance the efficiency of the cost structure and increase the sales revenue. Finally, China-listed companies need to find a way to develop overseas markets. Policy makers in China also have to relax regulations for China-listed companies to open new channels for foreign customers.
Author Contributions
This paper is based on the master’s thesis of the first author and the corresponding author is her research advisor.
Funding
This research received no external funding.
Conflicts of Interest
The authors declare no conflict of interest.
References
- Chu, J.; Arce-Urriza, M.; Cebollada-Calvo, J.J.; Chintagunta, P.K. An empirical analysis of shopping behavior across online and offline channels for grocery products: The moderating effects of household and product characteristics. J. Interact. Mark. 2010, 24, 251–268. [Google Scholar] [CrossRef]
- Chiu, C.M.; Chang, C.C.; Cheng, H.L.; Fang, Y.H. Determinants of customer repurchase intention in online shopping. Online Inf. Rev. 2009, 33, 761–784. [Google Scholar] [CrossRef]
- Fairfield, P.M.; Yohn, T.L. Using asset turnover and profit margin to forecast changes in profitability. Rev. Account. Stud. 2001, 6, 371–385. [Google Scholar] [CrossRef]
- Nissim, D.; Penman, S.H. Ratio analysis and equity valuation: From research to practice. Rev. Account. Stud. 2001, 6, 109–154. [Google Scholar] [CrossRef]
- Ahn, T.; Ryu, S.; Han, I. The impact of the online and offline features on the user acceptance of Internet shopping malls. Electron. Commer. Res. Appl. 2004, 3, 405–420. [Google Scholar] [CrossRef]
- Rohm, A.J.; Swaminathan, V. A typology of online shoppers based on shopping motivations. J. Bus. Res. 2004, 57, 748–757. [Google Scholar] [CrossRef]
- Dehning, B.; Stratopoulos, T. DuPont analysis of an IT-enabled competitive advantage. Int. J. Account. Inf. Syst. 2002, 3, 165–176. [Google Scholar] [CrossRef]
- Jansen, I.P.; Ramnath, S.; Yohn, T.L. A diagnostic for earnings management using changes in asset turnover and profit margin. Contemp. Account. Res. 2012, 29, 221–251. [Google Scholar] [CrossRef]
- Soliman, M.T. The use of DuPont analysis by market participants. Account. Rev. 2008, 83, 823–853. [Google Scholar] [CrossRef]
- Bauman, M.P. Forecasting operating profitability with DuPont analysis: Further evidence. Rev. Account. Financ. 2014, 13, 191–205. [Google Scholar] [CrossRef]
- Hongquan, Z.; Lan, S.; Hong, W.; Luping, F. DuPont Analysis and Value Evaluation—An Empirical Analysis Based on China’s A Share Market. Manag. Rev. 2011, 10, 152–161. [Google Scholar]
- Liu, J.; Ohlson, J.A.; Zhang, W. An evaluation of Chinese firms’ profitability: 2005–2013. Account. Horiz. 2015, 29, 799–828. [Google Scholar] [CrossRef]
- Li, Z.; Lu, Q.; Talebian, M. Online versus bricks-and-mortar retailing: A comparison of price, assortment and delivery time. Int. J. Prod. Res. 2015, 53, 3823–3835. [Google Scholar] [CrossRef]
- Foerster, S.R.; Karolyi, G.A. The effects of market segmentation and investor recognition on asset prices: Evidence from foreign stocks listing in the United States. J. Financ. 1999, 54, 981–1013. [Google Scholar] [CrossRef]
- Sheng, S.; Zhou, K.Z.; Li, J.J. The effects of business and political ties on firm performance: Evidence from China. J. Mark. 2011, 75, 1–15. [Google Scholar] [CrossRef]
- Pinto, F.S.; Simões, P.; Marques, R.C. Raising the bar: The role of governance in performance assessments. Util. Policy 2017, 49, 38–47. [Google Scholar] [CrossRef]
- Lee, J. Does size matter in firm performance? Evidence from US public firms. Int. J. Econ. Bus. 2009, 16, 189–203. [Google Scholar] [CrossRef]
- Nissim, D.; Penman, S.H. Financial statement analysis of leverage and how it informs about profitability and price-to-book ratios. Rev. Account. Stud. 2003, 8, 531–560. [Google Scholar] [CrossRef]
- Weill, L. Leverage and corporate performance: Does institutional environment matter? Small Bus. Econ. 2008, 30, 251–265. [Google Scholar] [CrossRef]
- Daniel, F.; Lohrke, F.T.; Fornaciari, C.J.; Turner, R.A., Jr. Slack resources and firm performance: A meta-analysis. J. Bus. Res. 2004, 57, 565–574. [Google Scholar] [CrossRef]
© 2019 by the authors. Licensee MDPI, Basel, Switzerland. This article is an open access article distributed under the terms and conditions of the Creative Commons Attribution (CC BY) license (http://creativecommons.org/licenses/by/4.0/).