Article

Costs and Benefits of Implementing Green Building Economic Incentives: Case Study of a Gross Floor Area Concession Scheme in Hong Kong

1
Department of Urban Planning, South China University of Technology, Guangzhou 51000, China
2
Center for Agency Policy Studies, Guangdong Urban and Rural Planning and Design Institute, Guangzhou 51000, China
3
Department of Building and Real Estate, The Hong Kong Polytechnic University, Hong Kong, China
4
Department of Building Services Engineering, The Hong Kong Polytechnic University, Hong Kong, China
*
Author to whom correspondence should be addressed.
Sustainability 2018, 10(8), 2814; https://doi.org/10.3390/su10082814
Submission received: 21 July 2018 / Revised: 2 August 2018 / Accepted: 3 August 2018 / Published: 8 August 2018

Abstract

:
Economic incentives are widely used to promote green buildings (GB) and consume social resources. However, few studies evaluate the costs and benefits of implementing economic incentives, including hidden costs and benefits. This paper applies cost–benefits analysis (CBA) and transaction cost (TC) theory to systematically evaluate the costs and benefits of implementing the green building economic incentives, with focused study on the Gross Floor Area (GFA) Concession Scheme in Hong Kong. The data of costs and benefits indicate how the GFA Concession Scheme motivates stakeholders and how much it benefits the built environment, which provides a solid foundation for the improvement of the GFA Concession Scheme. Expert interviews were conducted to verify and compliment the new CBA framework and provide empirical evidence for policy-makers and researchers to better understand the allocation of costs and benefits. The results show that the effectiveness of the GFA Concession Scheme is readily justified even if it has caused a lot of extra transaction costs and actual costs. A 10% GFA concession attracts developers to enter the GB market but discourages them to go for a higher level of GB. It is the right time to differentiate the GFA concession to promote a higher level of GB.

1. Introduction

The affordability of green construction is a significant challenge, and economic incentives that can increase affordability are important drivers of green construction [1,2]. Economic incentives are implemented mainly in the form of subsidies, tax reduction, rebate system, low-cost loans, gross floor area (GFA) concession (i.e., density bonus), expedited permitting, and cash incentives [3,4]. Economic incentives have been implemented in many countries and regions and consume social resources. For example, Singapore rewards cash incentives to developers and project consultants of new developments with a gross area of at least 2000 m2 that achieves a green mark gold rating or higher [5]. The UK and US provide subsidies to developers [6,7]. These economic incentives have also received criticism. For example, Johnston [8] questioned the impacts of income and land price on the participation rate of a density bonus scheme and impacts of incentive level on project profits in the USA. Fletcher [9] and Retzlaff [10] claimed that the mechanism for determining the optimal level of incentives is lacking. Insufficient incentives barely motivate developers to construct GB, whereas excessive incentives result in much social cost [10,11].
Many studies analyzed the cost–benefit analysis (CBA) of GB, but few studies have focused on the costs and benefits of implementing GB economic incentives. The key difference is implementing economic incentives consumes social resources and the cost is eventually borne by taxpayers and government. How to effectively allocate the incentive is a critical issue of implementing GB economic incentives. This suggests a need to thoroughly understand the relevant costs and benefits. In this research, one aspect to be evaluated by CBA is hidden costs and benefits, which has not yet been reflected in traditional CBA. The hidden cost of GB development, such as the cost of dealing with inflexible building code regulators and the cost of integrating sustainable design elements, are relatively small but still exert noticeable impacts on the overall cost [12,13]. Fan, Chan, and Qian [14] analyzed TCs of participating GB economic incentives borne by the private sector stakeholders and proved that TCs make some developers do as little as they can for sustainability. It is definitely a waste of social resources. Therefore, CBA of implementing the GB economic incentives should include TC.
This study aims to evaluate the costs and benefits of implementing economic incentives of GB, including TC and hidden benefits. The results contribute to exploring the appropriate amount of incentives and how to allocate incentives so that social resources could be effectively used to promote GB. The GFA Concession Scheme implemented in Hong Kong was adopted as a case study. It is a popular incentive implemented in many countries and regions to promote GBs, such as the US, Singapore, and Hong Kong [15]. This incentive is to grant developers extra floor area in exchange for their investment in public facilities, and has been applied to many government programs, such as affordable housing incentive scheme in the US, Australia, and the UK [16], and renewable energy in New Zealand, Japan, France, and the US [17]. Therefore, this paper is also a good reference for the international community where the GFA Concession Scheme is applied.
The structure of this paper is as follows. Section 2 presents a literature review on the economic incentives of GB, cost-benefit analysis, and transaction costs. Section 3 introduces the GFA Concession Scheme in Hong Kong. Section 4 presents the research methods. Data analysis and results are shown in Section 5. Section 6 and Section 7 discuss results, conclude this study and provide implications.

2. Literature Review

2.1. Economic Incentives of GB

Economic incentives and innovative fiscal arrangements are made available to compensate for additional costs and thus overcome economic barriers [18,19,20]. They attract private sectors in joining the development of GBs by reducing costs and increasing demands [3]. This type of incentive mainly targets developers and property owners. Professionals, such as engineers, consultants, and designers, in Singapore can enjoy the same incentives as those of contractors in US. Compensating developers or property owners directly can overcome the market barrier that only occupants can enjoy the benefits of GB and improve investment priority. Such schemes can reduce the financial risk, especially when the payback period is longer than the standard [21].

2.1.1. Categorization of the Economic Incentives

From the literature review, all the economic incentives implemented in the world, including tax reduction, subsidies, rebates, cash incentive, and GFA concession, are collected. These economic incentives are categorized into two types, namely, those with and without restrictions of government fiscal situation (Figure 1).
  • Economic incentive schemes with restrictions related to the government fiscal situation
This type of incentive relies on the financial income of the government for compensating private sectors. As some economic incentives, such as subsidies, grants, and capital allowance, come from government revenue, the degree of benefits of stakeholders depends on government fiscal conditions. Therefore, the incentive supplied by the government may be insufficiently large to overcome high construction costs [23]. This economic incentive scheme needs a consistent level of funding and provision for additional funding sources [4,24,25].
  • Economic incentive schemes without restrictions related to the government fiscal situation
This type of incentive is implemented without the restriction of fiscal situation. Stakeholders can obtain extra benefits by saving time or making extra money, such as GFA concession incentives and expedited review and permitting. The GFA concession incentive rewards developers with extra floor area, and expedited review and permitting saves considerable time of developers by simply shifting in permitting priority. This incentive scheme attracts developers and reduces the fiscal pressure from the government.

2.1.2. Comparison of Economic Incentives

Table 1 illustrates the aforementioned popular economic incentives, the benefits of stakeholders from the incentives, and the effects of the policies. From the data in the table, the possible improvements for the economic incentives can be established. The features of the economic incentives in Table 1 are summarized as follows:
  • Most beneficiaries are developers and owners, and few countries reward professionals, such as architects and engineers;
  • Most of incentives have positive effects on GB development, but few studies further study how effective they are and whether the costs of implementing incentives justify the positive effects.
  • Some incentives are not effective nor efficient, such as tax reduction and loan incentives implemented in Malaysia, and loan incentives and fee reduction implemented in the US.

2.2. Cost–Benefit Analysis

The fact that government resources are limited requires the use of economic analysis tools for rationalizing government policies. CBA is a useful tool for evaluating policies and projects throughout the world [42]. CBA can help policy-makers and businesspeople justify their decisions in a systematic, rigorous, and unambiguous way, and thus ensure effective and efficient policy enforcement [43]. Furthermore, the environmental impacts of policies or projects should be incorporated into the CBA framework to improve the quality of government decision making.

Initial Framework of Costs and Benefits

The framework of costs and benefits in this study expands the ones in previous research from Qian et al. [44] and Fan et al. [14] by adding more data through an extra 10–20 expert interviews. The initial framework of costs and hidden benefits were built using a literature review, same as the ones in Qian et al. [44], shown in Table 2. The framework of TC adopts the results of Fan et al. [14]. According to it, the list of TC includes information searching cost, research/learning cost, coordination/negotiation cost, approval cost, monitoring cost, and verification cost.

2.3. Transaction Cost (TC) Theory

Transaction cost is the cost of running economic system [54]. Cheung [55] supported Arrow’s view and believed that TC was essentially an institutional cost. The TC of running a mechanism or implementing government policy has been proved and justified in previous research studies, such as Buitelaar [56]; Garrick, Whitten, and Coggan [57]; and Huang [58]. Various types of TC are incurred in the process of running a mechanism or implementing government policy. Fan et al. [14] studied the TCs of implementing the GFA Concession Scheme and found that the Sustainable Building Design Guidelines (SBDGs) caused a lot of TCs to participants of the scheme.

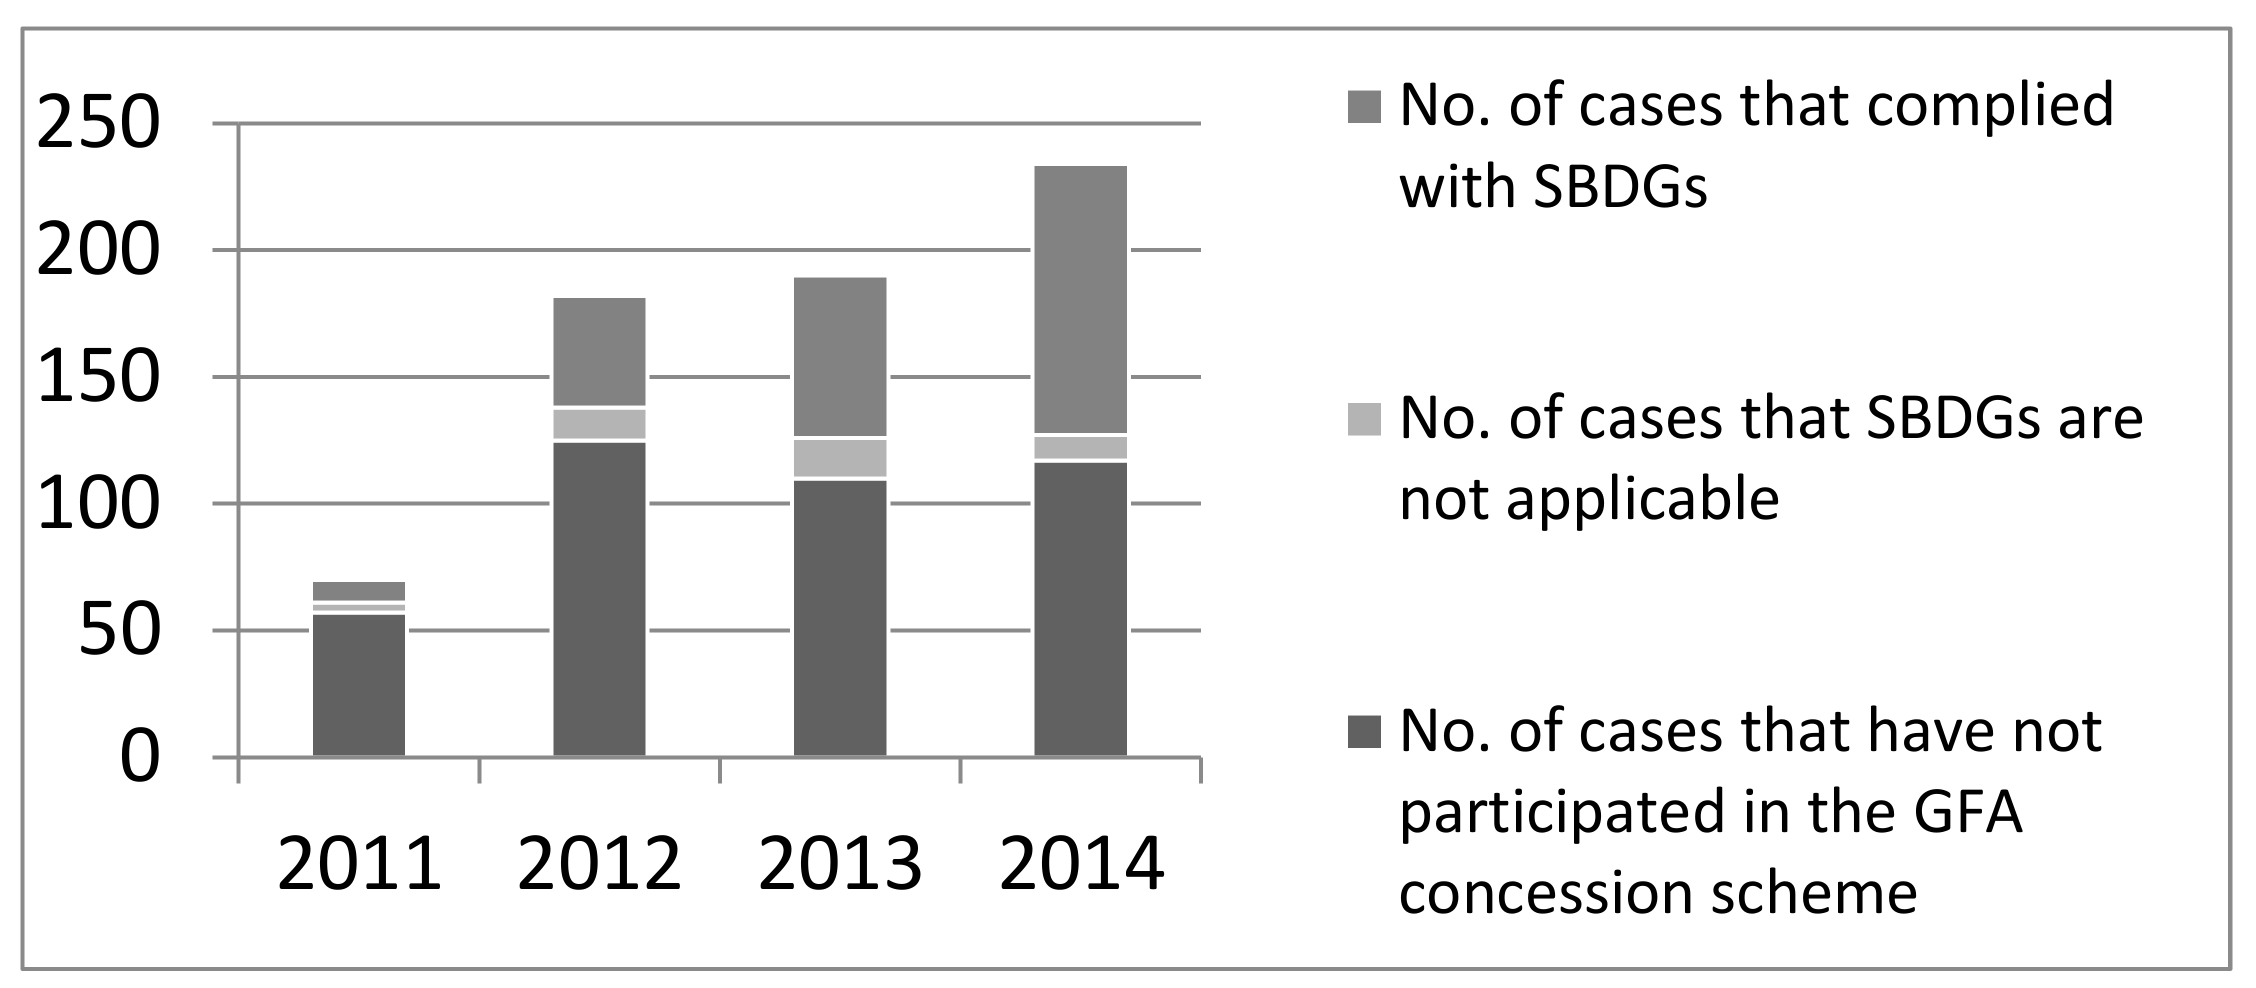
3. GFA Concession Scheme in Hong Kong

Hong Kong has implemented the GFA Concession Scheme since 2011. It grants developers a 10% GFA concession if buildings register for the Building Environmental Assessment Methods (BEAM) Plus or reach any level of BEAM Plus (i.e., Unclassified, Bronze, Silver, Gold, or Platinum), fulfil the Sustainable Building Design Guidelines (SBDGs), and provide the prescribed building features. The prescribed building features are tailored for the specific built environment in Hong Kong to address the urgent city problems [59]. To some extent, it is mandatory to integrate the features in order to apply for the GFA concession [44]. For the Hong Kong government, few construction costs of these building features could improve the built environment. However, for the developers and architects, designing the building features and getting approval from government takes time and involves approval risks, especially at the beginning of implementing the GFA Concession Scheme [60]. With the practice of participating the scheme, industry is becoming more and more familiar with the SBDGs. Figure 2 illustrates the statistics of applications for the GFA concession from 2011 to 2014. It is obvious that there are more and more applications and the approval rate is becoming high. This reflects the market transformation that developers could benefit from the participating the GFA Concession Scheme, and the knowledge and market demand for GBs have increased.
SBDGs aim to enhance built environmental quality and sustainability in Hong Kong, especially outdoor air ventilation to reduce the canyon effect that reduces the effectiveness of air ventilation and strengthens the concentration of pollutants at a pedestrian level [62,63]. SBDGs consist of three aspects, namely building separation, building setback, and site coverage of greenery. Building separation aims to alleviate the heat island effect resulting from the screening effect of long buildings at various levels, and to improve air ventilation and environmental quality at pedestrian level. For site areas larger than two hectares or with continuous building width larger than 60 m, a separation of 20% to 33.3% of total frontage area of buildings is required. Building setback is to alleviate the street canyon effect and improve air ventilation. Buildings in front of a street less than a width of 15 m are required to be setback, providing a space with not less than 7.5 m wide measured from the street centerline. Site coverage of greenery is to improve the quality of the built environment and mitigate the heat island effect, especially at the pedestrian level; here, 20–30% of site coverage of greenery is required for the sites whose areas are larger than 1000 sq.m. Although the SBDGs are designed to benefit the built environment, it also caused a lot of TCs from implementing the GFA Concession Scheme due to its complexity [14]. Therefore, this paper would measure how much the SBDGs benefit the built environment.

4. Research Methods

4.1. Expert Interviews

Participating in the GFA Concession Scheme needs a lot of specific knowledge and experience. Industry experts have a good overview of costs and benefits and conducting interview can yield more insightful views than doing a massive survey. Particularly, expert interviews are commonly used to measure TCs in previous research, such as Weber [64] and McCann and Easter [65]. Therefore, this study conducted expert interviews to validate the identified list of costs and benefits (refer to Table 2) and measure them.
Studying actual building specifications could measure the extra costs and benefits in detail. However, every building has its own features and has different green solutions affecting the costs and benefits. It is difficult to calculate the extra costs and benefits of actual cases one by one. Therefore, this study selected a hypothetical case that is a typical model in the SBDGs and highly representative for the GFA Concession Scheme. Even though the data was not as accurate as a particular actual case, it still provided important indications for the market lack of information and provided general perceptions for policy-makers. Interviewees were asked to estimate the extra costs and benefits according to the hypothetical scale of the project and levels of green building. Previous studies measured the extra costs based on the average cost of green buildings [66]. This study would use the same method to deal with the data. These data of costs and benefits showed how the GFA Concession Scheme motivated stakeholders and how much it benefitted the built environment. To measure the benefits of the built environment, the computational fluid dynamics (CFD) models were formulated that are presented in the following section.
Invitation letters were sent out to all the members of Professional Green Building Council (PGBC) in Hong Kong for voluntary participation in our interview. The PGBC comprises the Hong Kong Institute of Surveyors, the Hong Kong Institute of Landscape Architects, the Hong Kong Institute of Planners, the Hong Kong Institution of Engineers, and the Hong Kong Institute of Architects. Members of the PGBC interested in our interview responded to us to line up for individual interviews. The profile of interviewees is shown in Table 3. Hence, all the interviewees were highly experienced in GB development and knew the BEAM Plus and SBDGs very well. They were at management level and had a good overview of the costs and benefits. Interviews with 30 experienced experts who have been actively involved in implementing GFA Concession Scheme in Hong Kong yield insightful, highly relevant and more convincing views than a massive survey of people without necessary expertise and hands-on experience. After doing interviews with 30 experts with backgrounds of government officer, developer, professional, and contractor, there were no new insights appearing. Therefore, the sample size of 30 experts was considered to be enough and they were informationally representative. The views from the full range of stakeholders’ perspectives were triangulated.

4.2. Computational Simulations

The SBDGs were linked to the GFA concession to improve the quality of the built environment, particularly air ventilation in a high-density city. Computational fluid dynamics (CFD) models were formulated to predict the airflow patterns and air pollutant concentrations. A hypothetical case was adopted that was a baseline model of the SBDGs. All the parameters on building configurations were set according to the requirements of the SBDGs. The meteorological and site characteristics of the constructed models were defined according to a typical street canyon in Hong Kong, which had a high population and road traffic density. The input parameter values of the street configurations, traffic data and meteorological data were based on Ng and Chau’s [63] research, which would be further shown in the Section 5.3.1.
The CFD models were conducted by the software ANSYS. The predicted air pollutant concentration profiles were subsequently used to estimate the personal exposures of various population subgroups staying in the street owing to ambient air pollutants. In turn, the estimated personal exposures were used to estimate the number of different types of avoided health outcomes. The economic benefits of avoided health outcomes and losses in development floor areas and the dynamic investment payback period were evaluated by comparing the modified building configurations with the baseline ones.

5. Data Analysis and Results

5.1. Refined Framework of Costs and Benefits

By collecting more data on costs and benefits and taking stakeholders into considerations, interview results of this study refines the framework proposed by Qian, et al. [44]. The refined framework is shown in Figure 3.

5.1.1. Actual Costs

The certification cost comprises the registration fee and assessment cost, increasing with the project scale. The extra construction cost and consultancy fee change positively with the level of GB. Besides, according to interviewees, the extra construction cost depends on the original provision of the project. Specifically, if the original provision of the project has no green features, then the extra construction cost could reach 8–10%. However, 10% GFA concession can cover all the actual costs no matter which level of GB developers goes for. After offsetting the actual costs, the rest of benefits from GFA concession goes to land cost under the land bidding mechanism in Hong Kong. All these extra actual costs are borne by developers.

5.1.2. Actual Benefits

The extra energy savings and water savings change with level of GB positively. However, these benefits are owned by residents, not developers. In this sense, developers who the pay extra actual cost of GBs, but cannot obtain energy and water savings, definitely need compensation for GFA concession from government, especially when there is no price premium of GB in the property market in Hong Kong. Interviewees acknowledged that GB should have enhanced value but currently there is no price difference between GB and traditional buildings. Green features were not the main consideration of consumers.

5.1.3. Transaction Cost

The amount of TC is positively related to the level of GB and TCs that are borne by developers, professionals, and contractors. The GFA concession scheme linking GB to SBDGs was complained about a lot by the participants in that SBDGs themselves bring them many troubles. Take the unclassified buildings for example. To achieve the unclassified level of BEAM Plus does not cost participants too much time, but they have to spend a lot of extra time to deal with additional work, mainly on fulfilling SBDGs.

5.1.4. Hidden Benefits

Developers, professionals, and contractors can enjoy the benefits of reputation and competitiveness, but GFA concession was still the major reason that they go for GB. Health/productivity was related to BEAM Plus certification, and environmental benefits were determined by SBDGs.

5.2. Measuring Costs and Benefits by a Hypothetical Case

Actual costs and benefits were measured and presented in this section. As costs and benefits change largely with the scale of a project, this study adopted a hypothetical case to measure costs and benefits. The hypothetical case is the baseline model of the SBDGs (Figure 4). The model was selected to extract relevant data on monetary costs and benefits in the interview. These data were used to analyze the effect of the changes in the incentive scheme on the costs and benefits of stakeholders.
The actual costs and benefits, and hidden costs of the hypothetical case are shown in Table 4, Table 5, Table 6 and Table 7.

5.3. Measuring Key Hidden Benefits: Computational Fluid Dynamics (CFD) Simulation Models

To illustrate the one most significant benefit relating to health resulted from GBs, we estimated the benefits associated with the implementation of the SBDGs, and the baseline model case was used (Figure 4). The configuration of the baseline building was taken from the configuration of a typical residential building in the SBDGs. The key building design parameters were set according to the requirements of SBDGs. The changes in outdoor environmental benefits due to the variation in key parameter values were considered as the benefits within the CBA framework. The economic benefits of avoided health outcomes and losses in development floor areas as well as the dynamic investment payback period were evaluated by comparing the modified building configurations with the baseline ones.
The baseline building configuration is a sample case shown in the SBDGs. Building separation was placed at the podium with a permeability value of 23%. Building setback recessed the lower part of the building located in a street with a width of 5.52 m to maintain the same permeability value with the separation case. Figure 5 shows the building configurations.

5.3.1. Numerical Parameters

To estimate realistic health benefits of the proposed building configurations, the meteorological and site characteristics of the constructed models were defined according to a specific street canyon in the heart of Mongkok, which is an urban district in Hong Kong having a high population and road traffic density and could represent a typical built environment of Hong Kong. Table 8 shows a summary of the input parameter values together with the relevant street configuration parameters, and meteorological and traffic data.

5.3.2. Simulation Results

Predicted CO concentrations at the pedestrian level are shown in Figure 6. It can be seen that pollutant concentrations in the baseline model were the highest among all configurations. Modified configurations were effective in lowering the pollutant concentrations at the pedestrian level (z = 1.5 m) and building setback was more effective than building separation. A significant reduction in pollutants’ concentrations was achieved when the wind was blowing from the perpendicular direction (90°).

5.3.3. Estimating the Changes in Health Outcomes

The estimation of a change in mortality, morbidity, and restricted activity days outcomes due to a change in CO concentration levels are based on the widely accepted Ostro’s model [67]:
dHi = bi × POPi × ΔCi
where dHi is the change in health outcome i; bi is the concentration-response coefficient (or more correctly the slope of the concentration-response curve); POPi is the population who are suffering from the health outcome i; ΔCa,eqv is the change in ambient CO concentration; and i is the specific category of health outcome, such as mortality, morbidity, and restricted activity days.
In this study, it was assumed that there were 3864 pedestrians to across a meter-wide outdoor pedestrian sidewalk each hour [68] and they spend 2 h in the streets every day [69]. The concentration–response coefficient values (bi) for different health outcomes are listed in Table 9.

5.3.4. Economic Costs and Benefits

The total economic benefit gains due to the avoided health outcomes after modifying the building configuration were estimated by
Vi = dHi × uVi
where Vi and uVi are the total benefits and the unit benefits resulting from the reduced impact of a particular health outcome i, respectively; and dHi is the change in population who are suffering from the health outcome i. Table 10 shows the estimated monetary values of benefits for different health outcomes (uVi).
Figure 7 shows the estimated annualized monetary benefits for the proposed building configurations. Generally, building separations and setbacks were effective in removing the pollutants and reducing pedestrians’ health risks. The amount of benefits gained varied with the building configurations. Building setbacks could provide monetary benefit gains that were twice as much as the building separations.
However, building setbacks could induce more development floor area reduction than building separations. To identify the type of building configuration that could yield the highest health benefits, the ratio of total benefits (50 years, HK$) divided by floor area reduction (m2) is shown in Figure 8. All the monetary costs and benefits were discounted at 5%.
Generally, building separations and setbacks were effective in removing the pollutants and reducing pedestrians’ health risks. The amount of benefits gained varied with the building configurations. Building setbacks could provide monetary benefit gains that were twice as much as building separations. However, building setbacks could induce more development floor area reduction than building separations. To identify the type of building configuration that could yield the highest health benefits, the ratio of total benefits (50 years, HK$) divided by floor area reduction (m2) was used as shown in Figure 8. Building setbacks could still provide better monetary benefit gains than building separations but the effectiveness is only about 1.5 times as much.

6. Discussion and Conclusions

6.1. Justification of the GFA Concession Scheme

The GFA concession scheme indeed improved GB market penetration, even if it caused a lot of transaction costs. Practitioners in industry complained a lot about the SBDGs in that it caused a lot of extra work. However, the urgent and necessary issue of Hong Kong is to improve air ventilation around buildings, where the SBDGs contribute very well. The CFD model demonstrated that building separations and setbacks were effective in removing pollutants and reducing the health risks of pedestrians. The rate of environmental benefit gained varied with building configurations. Building setbacks could provide monetary benefit gains that were twice as much as building separations. Therefore, SBDGs should stay and GFA concession are needed to facilitate the private sector to apply SBDGs.
Besides, research results show that GBs have no price premium in the property market. If the market is not willing to pay for green design or green features, developers will not have to provide these design/features. Therefore, government policy is needed to provide an incentive to kick-start the market and educate the consumers. When the market is mature enough, it is time to consider removing the incentive or making use of the incentive to push for higher performance requirements.

6.2. Discouraging Developers to Go for a Higher Level of GB

Implementing the GFA Concession Scheme indeed incurs extra costs and benefits, including TCs and hidden benefits. Actual costs could be covered by a 10% GFA concession no matter which level of GB developers would go for. All the actual costs and benefit of the 10% GFA concession are directly borne by developers. Since actual costs were positively related to GB levels, developers who go for the lowest level of GB could make maximum profits. The low threshold to acquire 10% GFA concession attracts developers to enter the GB market but discourages them to go for a higher level of GB.

6.3. Parameters to Estimate the Appropriate GFA Concession for Each Level of GB

This paper demonstrated using CBA and transaction cost theory to analyze all the costs and benefits of the economic incentives of GB. It is worth mentioning that transaction costs are large but are often ignored by policy-makers. This paper identified and measured actual costs, transaction costs, actual benefits, and hidden benefits of each level of GB. It used a hypothetical model to prove that actual costs, transaction costs, and actual benefits increased with the level of GB, but all the levels of GB enjoyed the same amount of GFA concession, which wasted social resources from promoting GB.
If the current GFA Concession Scheme was to be improved, these costs and benefits are the ground for adjusting the GFA concession to promote a higher level of GBs. They indicate how the costs and benefits would change with the GB ratings. The data of the costs and benefits are valid references for policy-makers to adjust the GFA concession and promote higher levels of GB.

7. Implications and Recommendations

The GFA Concession Scheme has been applied to many government programs in the world, such as affordable housing, GBs, and renewable energy of buildings, which is attractive to developers. The framework of costs and benefits of this scheme has not only provided a whole picture to look at how the incentive works, but the findings from our study also helps policy-makers use the instrument more effectively and efficiently. Based on the results, we recommend that:
  • The GFA Concession Scheme is useful and can be extended to other sectors, like building conservation, low-carbon city, etc.
  • After several years of implementing the scheme, the information searching cost and research/learning cost account for relatively little, which indicates that the industry is becoming more and more familiar with the GFA Concession Scheme. It is the right time to use the incentive to push for a higher threshold for requirements to enjoy the concession.
  • The new CBA approach provides policy-makers with significant and valid data to estimate the appropriate GFA concession to promote higher levels of GB.

Author Contributions

The main text of the manuscript was drafted by the K.F. and revised by E.H.W.C. and C.K.C. C.K.C. conducted the CFD analysis. All the authors designed the research and read and approved the final manuscript.

Funding

This research was supported by the RGC research grant of The Hong Kong Polytechnic University. The first author thanks Guangdong Urban and Rural Planning and Design Institute for its generous funding support.

Conflicts of Interest

The authors declare no conflict of interest.

References

  1. Pitt, M.; Tucker, M.; Riley, M.; Longden, J. Towards sustainable construction: Promotion and best practices. Constr. Innov. Inf. Process. Manag. 2009, 9, 201–224. [Google Scholar] [CrossRef]
  2. Salvalai, G.; Masera, G.; Sesana, M.M. Italian local codes for energy efficiency of buildings: Theoretical definition and experimental application to a residential case study. Renew. Sustain. Energy Rev. 2015, 42, 1245–1259. [Google Scholar] [CrossRef]
  3. Qian, Q.K.; Chan, E.H.W. Policies for Promoting Building Energy Efficiency (BEE): A Comparative Study between Mainland China and Some Developed Countries. J. Interdiscip. Soc. Sci. 2009, 4, 45–64. [Google Scholar] [CrossRef]
  4. Chan, E.H.W.; Qian, Q.K.; Lam, P.T.I. The market for green building in developed Asian cities—The perspectives of building designers. Energy Policy 2009, 37, 3061–3070. [Google Scholar] [CrossRef]
  5. Building and Construction Authority. Green Mark Gross Floor Area Incentive Scheme. Available online: https://www.bca.gov.sg/greenmark/gmgfa.html (accessed on 1 January 2018).
  6. He, B.; Jiao, L.; Song, X.; Shen, L.; Xiong, B. Country review on the main building energy-efficiency policy instrument. In Proceedings of the 19th International Symposium on Advancement of Construction Management and Real Estate; Springer: Berlin, Germany, 2015; pp. 379–396. [Google Scholar]
  7. Sangster, W. Benchmark study on green buildings: Current policies and practices in leading green building nations. Retrieved January 2006, 15, 2008. [Google Scholar]
  8. Johnston, R.A.; Schwartz, S.I.; Wandesforde-Smith, G.A.; Caplan, M. Selling Zoning: Do Density Bonus Incentives for Moderate-Cost Housing Work. Wash. Univ. J. Urban Contemp. Law 1989, 36, 45. [Google Scholar] [CrossRef]
  9. Fletcher, L.K. Green construction costs and benefits: Is national regulation warranted. Nat. Resour. Environ. 2009, 24, 18–24. [Google Scholar]
  10. Retzlaff, R.C. Green buildings and building assessment systems: A new area of interest for planners. CPL Bibliogr. 2009, 24, 3–21. [Google Scholar] [CrossRef]
  11. Feiock, R.C.; Tavares, A.F.; Lubell, M. Policy instrument choices for growth management and land use regulation. Policy Stud. J. 2008, 36, 461–480. [Google Scholar] [CrossRef]
  12. Morris, P. What does green really cost. PREA Q. 2007, 55–60. [Google Scholar]
  13. Miller, N.; Spivey, J.; Florance, A. Does green pay off? J. Real Estate Portf. Manag. 2008, 14, 385–400. [Google Scholar]
  14. Fan, K.; Chan, E.H.W.; Qian, Q.K. Transaction costs (TCs) in green building (GB) incentive schemes: Gross Floor Area (GFA) Concession Scheme in Hong Kong. Energy Policy 2018, 119, 563–573. [Google Scholar] [CrossRef]
  15. Fan, K.; Qian, Q.K.; Chan, E.H.W. Floor area concession incentives as planning instruments to promote green building: A critical review of International practices. In Proceedings of the Smart and Sustainable Built Environments (SASBE) Conference, Pretoria, South Africa, 9–11 December 2015. [Google Scholar]
  16. Fox, G.M.; Davis, B.R. Density bonus zoning to provide low and moderate cost housing. Hastings Const. Law Q. 1975, 3, 1015. [Google Scholar]
  17. Paetz, M.M.D.; Pinto-Delas, K. From Red Lights to Green Lights: Town planning incentives for green building. In Proceedings of the Talking and Walking Sustainability International Conference, Auckland, New Zealand, 20–23 February 2007. [Google Scholar]
  18. Lam, P.; Chan, E.H.; Chau, C.; Poon, C.; Chun, K. Integrating green specifications in construction and overcoming barriers in their use. J. Prof. Issues Eng. Educ. Prac. 2009, 135, 142–152. [Google Scholar] [CrossRef]
  19. Sayce, S.; Ellison, L.; Parnell, P. Understanding investment drivers for UK sustainable property. Build. Res. Inf. 2007, 35, 629–643. [Google Scholar] [CrossRef]
  20. Sodagar, B.; Fieldson, R. Towards a low carbon construction practice. Constr. Inf. Q. 2008, 10, 101–108. [Google Scholar]
  21. Tanaka, K. Review of policies and measures for energy efficiency in industry sector. Energy Policy 2011, 39, 6532–6550. [Google Scholar] [CrossRef]
  22. Gillingham, K.; Palmer, K. Bridging the Energy Efficiency Gap: Insights for Policy from Economic Theory and Empirical Analysis; Resources for the Future: Washington, DC, USA, 2013. [Google Scholar]
  23. Wade, J.; Pett, J.; Ramsay, L. Energy Efficiency in Offices: Motivating Action; Association for the Conservation of Energy: London, UK, 2003. [Google Scholar]
  24. Balachandra, P.; Ravindranath, D.; Ravindranath, N. Energy efficiency in India: Assessing the policy regimes and their impacts. Energy Policy 2010, 38, 6428–6438. [Google Scholar] [CrossRef]
  25. Shen, L.; He, B.; Jiao, L.; Song, X.; Zhang, X. Research on the development of main policy instruments for improving building energy-efficiency. J. Clean. Prod. 2016, 112, 1789–1803. [Google Scholar] [CrossRef]
  26. Pablo-Romero, M.; Sánchez-Braza, A.; Pérez, M. Incentives to promote solar thermal energy in Spain. Renew. Sustain. Energy Rev. 2013, 22, 198–208. [Google Scholar] [CrossRef]
  27. Shazmin, S.; Sipan, I.; Sapri, M. Property tax assessment incentives for green building: A review. Renew. Sustain. Energy Rev. 2016, 60, 536–548. [Google Scholar] [CrossRef]
  28. Aliagha, G.U.; Hashim, M.; Sanni, A.O.; Ali, K.N. Review of green building demand factors for Malaysia. J. Energy Technol. Policy 2013, 3, 471–478. [Google Scholar]
  29. De Blaauw, J.; McGregor, D. Assessing the Viability of Financial Incentives for Sustainable Housing Initiatives; Unpublished Research for Beacon Pathway; 2008. [Google Scholar]
  30. Building and Construction Authority. Green Mark Incentive Scheme. Available online: https://www.bca.gov.sg/GreenMark/others/GMIS_guide.pdf (accessed on 1 January 2018).
  31. Hwang, B.-G.; Ng, W.J. Project management knowledge and skills for green construction: Overcoming challenges. Int. J. Proj. Manag. 2013, 31, 272–284. [Google Scholar] [CrossRef]
  32. Ghodrati, N.; Samari, M.; Shafiei, M. Investigation on government financial incentives to simulate green homes purchase. World Appl. Sci. J. 2012, 20, 832–841. [Google Scholar]
  33. Zhao, T.; Bell, L.; Horner, M.W.; Sulik, J.; Zhang, J. Consumer responses towards home energy financial incentives: A survey-based study. Energy Policy 2012, 47, 291–297. [Google Scholar] [CrossRef]
  34. Sauer, M.; Siddiqi, K. Incentives for green residential construction. In Proceedings of the Construction Research Congress 2009, Seattle, DC, USA, 5–7 April 2009; pp. 578–587. [Google Scholar]
  35. Bond, S.A.; Devine, A. Incentivizing green single-family construction: Identifying effective government policies and their features. J. Real Estate Financ. Econ. 2016, 52, 383–407. [Google Scholar] [CrossRef]
  36. HKGBC. Statistics of Beam Plus Projects. Available online: https://www.hkgbc.org.hk/eng/BEAMPlusStatistics.aspx (accessed on 6 June 2017).
  37. Building and Construction Authority. Leading the Way for Green Buildings in the Tropics. Available online: https://www.bca.gov.sg/greenmark/others/sg_green_buildings_tropics.pdf (accessed on 25 August 2017).
  38. USGBC. Good to Know: Green Building Incentive Strategies. Available online: https://www.usgbc.org/articles/good-know-green-building-incentive-strategies-0 (accessed on 27 September 2017).
  39. Yudelson, J. Green Building Incentives That Work: A Closer Look at How Local Governments Are Incentivizing Green Development; NAIOP Research Foundation: Herndon, VA, USA, 2007. [Google Scholar]
  40. Alberini, A.; Towe, C. Information v. energy efficiency incentives: Evidence from residential electricity consumption in Maryland. Energy Econ. 2015, 52, S30–S40. [Google Scholar] [CrossRef] [Green Version]
  41. USGBC. LEED Incentives in Counties, Cities, and Towns. Available online: https://www.usgbc.org/Docs/Archive/General/Docs2021.pdf (accessed on 25 August 2017).
  42. Hanley, N. Cost—Benefit Analysis and Environmental Policymaking. Environ. Plan. C Gov. Policy 2001, 19, 103–118. [Google Scholar] [CrossRef]
  43. Gramlich, E.M. Benefit-Cost Analysis of Government Programs; Prentice Hall: Upper New Jersey River, NJ, USA, 1981. [Google Scholar]
  44. Qian, Q.K.; Fan, K.; Chan, E.H.W. Regulatory incentives for green buildings: Gross floor area concessions. Build. Res. Inf. 2016, 44, 675–693. [Google Scholar] [CrossRef]
  45. Häkkinen, T.; Belloni, K. Barriers and drivers for sustainable building. Build. Res. Inf. 2011, 39, 239–255. [Google Scholar] [CrossRef]
  46. Kats, G.; Capital, E. Green Building Costs and Financial Benefits; Massachusetts Technology Collaborative: Boston, MA, USA, 2003. [Google Scholar]
  47. Hebb, T.; Hamilton, A.; Hachigian, H. Responsible Property Investing in Canada: Factoring Both Environmental and Social Impacts in the Canadian Real Estate Market. J. Bus. Ethics 2010, 92, 99–115. [Google Scholar] [CrossRef]
  48. Isa, M.; Rahman, M.M.G.M.A.; Sipan, I.; Hwa, T.K. Factors Affecting Green Office Building Investment in Malaysia. Procedia Soc. Behav. Sci. 2013, 105, 138–148. [Google Scholar] [CrossRef]
  49. Tan, Y.; Shen, L.; Yao, H. Sustainable construction practice and contractors’ competitiveness: A preliminary study. Habitat Int. 2011, 35, 225–230. [Google Scholar] [CrossRef]
  50. Pearce, A.R.; DuBose, J.R.; Bosch, S.J. Green building policy options for the public sector. J. Green Build. 2007, 2, 156–174. [Google Scholar] [CrossRef]
  51. Pivo, G.; McNamara, P. Responsible property investing. Int. Real Estate Rev. 2005, 8, 128–143. [Google Scholar]
  52. Ahn, Y.H.; Pearce, A.R. Green construction: Contractor experiences, expectations, and perceptions. J. Green Build. 2007, 2, 106–122. [Google Scholar] [CrossRef]
  53. Qian, Q.K.; Chan, E.H.W.; Khalid, A.G. Challenges in Delivering Green Building Projects: Unearthing the Transaction Costs (TCs). Sustainability 2015, 7, 3615–3636. [Google Scholar] [CrossRef] [Green Version]
  54. Arrow, K.J. The organization of economic activity: Issues pertinent to the choice of market versus nonmarket allocation. Anal. Eval. Public Expend. PPB Syst. 1969, 1, 59–73. [Google Scholar]
  55. Cheung, S. Economic organization and transaction costs. New Palgrave Dict. Econ. 1987, 2, 55–58. [Google Scholar]
  56. Buitelaar, E. A transaction-cost analysis of the land development process. Urban Stud. 2004, 41, 2539–2553. [Google Scholar] [CrossRef]
  57. Garrick, D.; Whitten, S.M.; Coggan, A. Understanding the evolution and performance of water markets and allocation policy: A transaction costs analysis framework. Ecol. Econ. 2013, 88, 195–205. [Google Scholar] [CrossRef]
  58. Huang, D. Land Banking Mechanism and its Effects on Urban Development: A Case Study of Guangzhou, China. Postgraduate Thesis, The University of Hong Kong, Hong Kong, China, 2012. [Google Scholar]
  59. Legislative Council. Measures to Forster a Quality and Sustainable Built Environment; Legislative Council: Hong Kong, China, 2010. [Google Scholar]
  60. Fan, K.; Qian, Q.K.; Chan, E.H. Transaction Costs (TCs) in Building Regulations and Control for Green Buildings: Case Study of Hong Kong. In Proceedings of the CIB World Building Congress 2016, Tampere, Finland, 30 May–3 June 2016; p. 818. [Google Scholar]
  61. Buildings Department. Building Department Environmental Report 2014. Available online: http://www.bd.gov.hk/english/documents/COER2014_eng.pdf (accessed on 5 June 2017).
  62. Council for Sustainable Development. Building Design to Foster a Quality and Sustainable Built Environment; Council for Sustainable Development: Hong Kong, China, 2009. [Google Scholar]
  63. Ng, W.-Y.; Chau, C.-K. A modeling investigation of the impact of street and building configurations on personal air pollutant exposure in isolated deep urban canyons. Sci. Total. Environ. 2014, 468, 429–448. [Google Scholar] [CrossRef] [PubMed]
  64. Weber, A. Implementing EU co-financed agri-environmental schemes: Effects on administrative transaction costs in a regional grassland extensification scheme. Land Use Policy 2015, 42, 183–193. [Google Scholar] [CrossRef]
  65. McCann, L.; Easter, K. Evaluating transaction costs of nonpoint source pollution policies. Land Econ. 1999, 32, 402–414. [Google Scholar] [CrossRef]
  66. Gabay, H.; Meir, I.A.; Schwartz, M.; Werzberger, E. Cost-benefit analysis of green buildings: An Israeli office buildings case study. Energy Build. 2014, 76, 558–564. [Google Scholar] [CrossRef]
  67. Ostro, B.D. Estimating the Health Effects of Air Pollutants: A Method with an Application to Jakarta; World Bank: Washington, DC, USA, 1994; Volume 1301. [Google Scholar]
  68. Lam, W.H.; Cheung, C.-Y. Pedestrian speed/flow relationships for walking facilities in Hong Kong. J. Transp. Eng. 2000, 126, 343–349. [Google Scholar] [CrossRef]
  69. Chau, C.K.; Tu, E.Y.; Chan, D.; Burnett, J. Estimating the total exposure to air pollutants for different population age groups in Hong Kong. Environ. Int. 2002, 27, 617–630. [Google Scholar] [CrossRef]
  70. Chau, C.; Hui, W.; Tse, M. Evaluation of health benefits for improving indoor air quality in workplace. Environ. Int. 2007, 33, 186–198. [Google Scholar] [CrossRef] [PubMed]
  71. Chau, C.; Hui, W.; Tse, M. Valuing the health benefits of improving indoor air quality in residences. Sci. Total Environ. 2008, 394, 25–38. [Google Scholar] [CrossRef] [PubMed]
Figure 1. The existing economic incentive schemes. Sources: adopted from Gillingham and Palmer [22] and Yudelson Associates [22].
Sustainability 10 02814 g001
Figure 2. Statistics on development proposal from 2011 to 2014 [61].
Sustainability 10 02814 g002
Figure 3. Refined frameworks of costs and benefits. Source: interview.
Sustainability 10 02814 g003
Figure 4. Hypothetical case (Source: The Sustainable Building Design Guidelines).
Sustainability 10 02814 g004
Figure 5. Sketches of the studied configurations.
Sustainability 10 02814 g005aSustainability 10 02814 g005b
Figure 6. CO concentrations for different building configurations at the pedestrian level.
Sustainability 10 02814 g006
Figure 7. Annual benefit gains for different building configurations.
Sustainability 10 02814 g007
Figure 8. Total benefit gains per floor area reduction. 1e + 5 is equal to 1 × 10⁵ + 5.
Sustainability 10 02814 g008
Table 1. Comparison of economic incentives.
Economic IncentivesCountryTo WhomEffectsCriticismReference
Tax reduction/
exemption/rebates
SpainBuilding owners
  • Positive effect on the GB development
  • Highly visible
  • Significant cost reduction for GB development
NAPablo-Romero et al. [26];
Shazmin et al. [27]
MalaysiaCompaniesNA
  • Significant for green building development, but not outstanding
Aliagha et al. [28]
USBuilding owners
  • Positive effect on the GB development
NAPablo-Romero et al. [26];
Shazmin et al. [27]
SubsidiesChinaDevelopers
  • From 2011 to 2013, the total GFA of two-star GB and three-star GB have increased 84% and 70% respectively.
NAde Blaauw and McGregor [29]
SingaporePrivate developers, and architects and M&E engineers in both public and private developments with GFA at least 2000 square meters.
  • The fund is fully committed for 102 building projects, with 62 Green Mark Gold projects, 14 Green Mark Gold Plus projects and 26 Green Mark Platinum projects.
  • 64.5% of experts think it is effective
NABuilding and Construction Authority [30]
Hwang and Ng [31]
Loan incentivesMalaysiaGB buyersNA
  • The existing incentive is not efficient and effective enough to make GB affordable
Ghodrati et al. [32]
USHomeowners
  • Effective in terms of attracting consumers
  • Less effective than tax incentives
Ghodrati et al. [32]
Zhao et al. [33]
GFA concession/density bonusUSDevelopers
  • Main causes for the higher production of Leadership in Energy and Environmental Design (LEED) certified residential buildings
NASauer and Siddiqi [34]
Bond and Devine [35]
Hong KongDevelopers
  • Since it started in 2011, the number of registered Hong Kong Building Environmental Assessment Method (HKBEAM) projects has increased by 416 up until 2015, while before 2011, only 225 projects were registered within 14 years.
NAHKGBC [36]
Building and Construction Authority [37]
SingaporeDevelopers
  • During the 4 years after this scheme started (2009–2013), the total GFA of GM buildings increased 34.2 million m2, while before that, the increased total GFA of GM buildings only increased 14.2 million m2 within 4 years from 2005 to 2009.
NABuilding and Construction Authority [37]
Expedited permittingUSDevelopers
  • It is more attractive than monetary incentives
NAUSGBC (The U.S. Green Building Council) [38],
Yudelson [39]
RebateUS, MarylandHomeowner
  • Reducing 5.3% of electricity usage
NAAlberini and Towe [40]
Fee reductionUSDevelopers and contractorsNA
  • Effective, but less effective than business-related incentives, like tax reduction and subsidies.
Bond and Devine [35]
GrantsKing County, USDevelopers/building owners
  • Very popular,
  • 52% local governments implemented.
NAYudelson [39]
USGBC [41]
Table 2. Review of actual costs, actual benefits, and hidden benefits. Source: Qian et al. (2016).
CategoriesCost and Benefit Items
Actual costsConstruction cost
Costs of certification
Additional or increased consultant fee [45]
Increased architectural and engineering design time [46]
Actual benefitsGFA Concession bonus
Higher market selling price [47]
Costs saving from efficient use of materials
Cash incentive [30]
Hidden benefitsGood company reputation/profile, status, market power, job satisfaction, rewards, personal development [48]
Future business competitiveness over the long-term [49]
Reduction in construction pollution (Building Environmental Assessment Methods (BEAM) Plus)
Reduced demands on infrastructure [50]
Savings of health care [51]
More job opportunities
Improved working efficiency and social productivity
Get new professional skills in [52]
Better living quality
Knowledge and skills about green construction [53]
Table 3. Interviewees’ profile.
ProfessionQualification and Position
14 ArchitectsAuthorized person; more than 20 years working experience; Director of Architectural firm
Registered architects; Chairman of architectural firm
Authorized person; Hong Kong Institute of Architects Fellow Member
Senior architect; Working in leading architecture firm for 5 years in Hong Kong; All the projects the architect has worked on are green buildings.
Doctor; Adjunct professor; Chairman of an architect and development consultants firm
Registered architect; associate architect working in a leading design firm
Principle of an international architectural design firm
Registered architect; senior associate working in a leading architectural design firm
Registered architect; member of Hong Kong Institute of Architects
Manager, working in leading architectural firm that all the projects it did are green buildings.
CEO in one of the leading real estate development firms in Hong Kong
Specialist in green building design; over 20 years’ working experience in a leading architecture firm
Specialist in sustainable design; senior associate working in a leading architectural firm
BEAM Pro; Director of an architectural firm
4 Building services engineersDirector in one of leading real estate development firms in Hong Kong; BEAM Pro; Authorized Person; over 25 years development experience
Manager of a leading real estate development firm; BEAM Pro
BEAM Pro; manager of a construction firm
Manager of a construction firm
2 Civil engineersDoctor; LEED AP; associate director of a development consultancy firm
Senior manager of a construction firm
9 SurveyorsMember of Green Building Council; Director of consultancy firm
BEAM Pro, working in leading contractor company in Hong Kong
Authorized person; Project director of a consultancy firm
Director of consultancy firm
Chief Executive Officer (Asia) of design and consultancy firm
Authorized person, project manager of a real estate development firm
Government officer, building surveying specialist; over 30 years working experience
General manager of a leading real estate development firm
Authorized person, deputy project manager of a development firm
1 ProfessorFull professor; Over 10 years working experience in project management and building control
Table 4. Actual costs (Source: interview).
GB LevelsExtra Construction CostExtra Consultancy FeeCertification Cost (Including Registration Fee and Assessment Fee)
Unclassified1%Nil307,400 HK$
(Credit interpretation request: 2000 HK$/credit)
Bronze1–3%2–4%
Silver1–3%2–4%
Gold5–10%5–8%
Platinum5–10%5–8%
Note: Original cost of baseline model: 300 million; Unclassified buildings refer to those fulfilling prerequisite of BEAM Plus but did not reach credits of any level of BEAM Plus. Unclassified buildings could be granted GFA concession as well; The project scale of hypothetical model was small. Certification cost was estimated according to Table 8.
Table 5. Certification fee in Hong Kong.
Project ScaleConstruction Floor Area (sq.m.)Registration Fee (HK$)Assessment Fee (HK$)
Extra Small≤249955,000104,000
Small2500–24,999110,000197,400
Medium25,000–49,999150,000275,800
Large50,000–99,999220,000577,500
Extra Large100,000–199,999300,000841,000
Mega200,000–400,000400,0001,237,300
Exceptional Scale/Complexity600,000TBC
Credit Interpretation RequestNA2000 per credit
First/Final AppealNA15,000 base charge + 4500 per credit
Table 6. Actual benefits (Source: interview).
GB LevelsExtra Energy SavingsExtra Water Savings
Unclassified0–6%10%
Bronze<10%10%
Silver10%12%
Gold13–15%20%
Platinum15%20%
Table 7. Transaction costs (Source: interview).
GB LevelsTransaction CostThe General Breakdown of the Extra Time
Information Searching CostResearch/
Learning Cost
Negotiation/
Coordination Cost
Approval CostMonitoring CostVerification Cost
Unclassified4%6%7%20%45%12%10%
Bronze6%
Silver8%
Gold12%
Platinum15%
Note: Transaction costs were measured by how much extra time participants would have to spend compared with doing traditional building.
Table 8. A summary of input parameter values, Source: Ng, W.-Y. and Chau [63].
CategoryParametersValues
Street configurationsMajor canyon axis orientation (°)337.5
Canyon length (m)192
Building height (m)78
Canyon width (m)15
Pedestrian height (m)1.5
Pedestrian walkway width (m)1
Meteorological dataPerpendicular wind probability (%)40
Parallel wind probability (%)32
Oblique wind probability (%)28
Average wind velocity (m/s)4.01
Reference height (m)25
Traffic dataTotal number of cars per hour1467
Total CO source generated (g/h)6503.6
Table 9. Concentration-response coefficients (bi) for different health outcomes. Source: Chau, C. et al. [70]; Chau, C. et al. [71].
Health OutcomesDisease Codes (ICD-10)C-R Coefficients (bi)95% CI
Hospital admissions
Respiratory diseasesJ00-J9811.045.36–22.72
Cardiovascular diseasesI00-I9922.515.73–32.93
Mortality
Respiratory and cardiovascular diseasesI00-I99, J00-J9822.512.92–39.20
Restricted activity dayI00-I99, J00-J980.303-
Note: bi refers to the increase in the incidence of the respective health outcomes (%) corresponding to a 10 mg/m3 increase in CO.
Table 10. Values of monetary benefits for different types of health outcomes, Source: estimated by authors.
Health OutcomeEstimate Per Case (HK Dollars in 2014)
UpperLowerCentral
Premature mortality$72,592,000$2,503,000$37,547,500
Respiratory diseases$54,000$27,000$40,500
Cardiovascular diseases$54,000$27,000$40,500
Restricted activity day$1687$843$1265

