Abstract
This paper proposes visualization based on augmented reality (AR) for aerodynamics simulation in a sustainable cloud computing environment that allows the Son of Grid Engine different types of computers to perform concurrent job requests. A simulation of an indoor air-purification system is performed using OpenFOAM computational fluid dynamics solver in the cloud computing environment. Post-processing converts the results to a form that is suitable for AR visualization. Simulation results can be displayed on devices, such as smart phones, tablets, and Microsoft HoloLens. This AR visualization allows for users to monitor purification of indoor air in real time.
1. Introduction
Computational fluid dynamics (CFD) uses applied mathematics and physics to calculate the flows of a fluid, and how it affects objects as it flows past them. CFD is based on the Navier-Stokes equations, which describe the relationships among velocity, pressure, temperature, and density of a moving fluid. Many studies have used CFD to assess the accuracy of numerical analysis methods, but relatively few studies have attempted to visualize the simulation results. CFD simulation results have often been visualized using supercomputers, whereas the use of cutting-edge visualization technology, such as augmented reality (AR), remains at the beginning stage.
AR was first used [1,2] to explain the airplane assembly process by applying additional information that overlapped with an actual environment. AR is usually derived from virtual environments or virtual reality (VR), and it refers to a mixture of computer-generated video and real video to induce a feeling of reality for users by combining images, motion, animation, audio, and information about a virtual entity in a real environment. Sometimes this technology is called “mixed reality”, to emphasize the connection between the real and virtual worlds. Recent advances in technology of cameras, computers and other hardware, and decrease in their costs, have enable rapid increase in the amount of available AR content. In addition, smartphone-based mobile AR systems are evolving to augment services, such as location information, angle determination, and to combine them with various Internet services.
However, existing AR content technology is restricted to entertainment, games, simple images, and video. AR technology runs in spaces that include both physical objects and virtual objects. The content of the environment can range from entirely real to entirely virtual, so AR technology can combine technology that is based on actual environments, and technology based on VR. VR has been applied in industry to design and to evaluate products. However, devices like mobile phones and smart glasses do not have the computational power to process data of diverse types or in large volumes, so AR technology is not widely used in complex simulations. To overcome this limitation, a service that is uses equipment efficiently but uses little energy should be developed [3,4].
Cloud computing is considered as a key feature of green IT that can be defined as the technologies that directly or indirectly promote environmental sustainability [5]. Cloud computing technology addresses two critical elements of a green IT approach: energy efficiency and scalability. This research establishes a heterogeneous cloud computing environment and uses it to perform CFD simulation and AR tracking, which usually require significant computing resources. This environment consists of calculation nodes that can be added or deleted easily by diverse hardware and operating systems. This system allows for the use of different nodes in hardware or operating systems, and as a result, secures system scalability. We use Son of Grid Engine (SGE) [6] open-source job scheduler to manage concurrent user requests and resources effectively. That is, sustainable cloud computing system’s scalability and efficiency can help to reduce energy usage and electronic waste.
Specifically, this paper presents a method that uses AR technology to visualize simulations of air movement within buildings. As people’s interest in the quality of life increases, air pollution is becoming a major health issue. Detrimental to health, it leads to air quality issues inside buildings, and purifying this inside air has become a focus of research. We use CFD simulation to analyze the density of pollutants in the air of an indoor structure, and then we use OpenFOAM solver to analyze indoor air flow and pollutant convection-diffusion. Cloud computing is used to visualize findings in real time, and AR is used to present this visualization on a mobile device.
The rest of this paper is organized as follows. Section 2 examines studies using AR technology in the field of engineering analysis and simulation, while Section 3 describes the design of an AR-based visualization system for aerodynamics simulation. Section 4 explains implementation of this visualization, and findings that were obtained using a cloud-computing system. Section 5 presents conclusions.
2. Related Work
AR is an effective tool to improve the quality of engineering analysis and to overcome the limitations of VR. AR-based visualization can be displayed in an actual environment, and therefore aids in user recognition and understanding of numerical analysis results [7]. Users can update these results in real time and in an actual environment, so the effects of parameters on product and technology can be analyzed immediately and effectively. Thus, AR is considered to be an excellent user interface for engineering analysis and simulation environments embedded within physical reality [7]. These traits have enabled its wide use in various applications, such as the medical and manufacturing fields, and in human interaction.
Trends in engineering analysis and simulation environments have emerged in three main areas: (1) surgery, (2) manufacturing, and (3) CFD. In the field of biomedical engineering and surgery, the use of VR in visualization of computed tomography (CT) and magnetic resonance imaging (MRI) data are the main research topics. Tawara et al. [8] proposed a two-handed direct manipulation system to achieve complex volume segmentation of CT/MRI data in augmented reality with a remote control attached to a motion-tracking cube. Kaladji et al. [9] proposed the feasibility of finite element simulation to predict arterial deformations. Sutherland et al. [10] proposed a prototype for an augmented reality haptic simulation system with potential for training on spinal needle insertion. However, accuracy issues in current findings and difficulty in building up the related system environment are issues that limit its use to an educational tool.
In the field of mechanical engineering and manufacturing, studies have been addressed AR visualization of three-dimensional (3D) models and structure analysis to enable users to intuitively analyze and discuss CAD and other 3D design data. Weidlich et al. [11] proposed new visualization methods for studying the results of finite elements analysis in immersive environments. Paulus et al. [12] proposed physics-based non-rigid augmented reality. Buchau et al. [13] proposed an application of augmented reality (AR) in the context of teaching electrodynamics. Silva et al. [14] proposed AR visualization using graphical representations that were created from numerical datasets. However, AR utilization research in the field focuses on restricted aspects, like structure analysis and mechanical equipment, and is limited due to the difficulty in precisely matching with physical models.
Several studies (Table 1) have addressed the visualization of analysis results in mechanical, civil, and urban engineering. AR visualization results that are based on these studies enable the civil engineer and the urban designer to analyze and improve indoor and outdoor environments. However, these AR visualization studies based on CFD simulation mainly concentrate on entire city design or architectural engineering, which do not apply to the various other fields of CFD simulation. Individual studies have visualized CFD simulation data with AR technology and diverse visualization methods such as Java3D, OpenGL, Paraview, and VR Markup Language.

Table 1.
Studies on augmented reality (AR)-based Visualization of computational fluid dynamics (CFD) Simulation.
For AR visualization of complicated and precise CFD simulation data, stable AR tracking technology is required, but most studies use a particular scenario of a restricted model, and for that reason are relatively unsuitable for general-purpose use. In addition, to create and process the data for AR visualization in real time, powerful computers are required, but most of the studies were conducted on a desktop computer, so they cannot be used in practical CFD simulations that cover the wide range of activities in each industry.
3. Design of AR-Based Visualization for Aerodynamics Simulation
To provide an effective AR-based method to visualize aerodynamics simulation, which is a sustainable cloud computing environment (Figure 1) is implemented based on the functional combination of a cluster group (CFD simulation, AR post-processing, AR visualization).
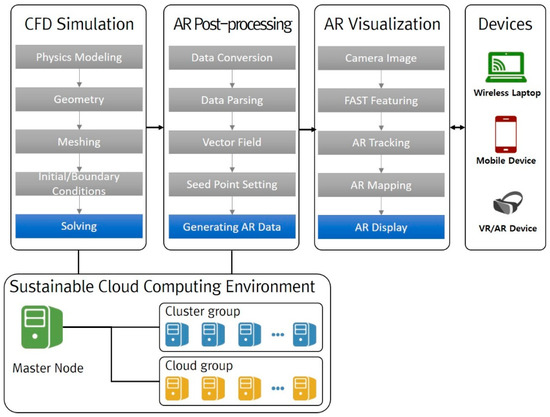
Figure 1.
Conceptual diagram of AR-based visualization for aerodynamics simulation Components and processes are described in the text.
A usual CFD simulation process involves three stages. (1) Pre-processing involves modeling geometry, generating a mesh representation of the geometry, setting initial and boundary conditions, and choosing the solver scheme. (2) Solving entails numerical analysis of information that is passed from the pre-processing stage. (3) Post-processing visualizes the results graphically.
In aerodynamics simulation, pre-processing and solving are performed using the CFD simulation on OpenFOAM, and post-processing is performed in AR to convert the data to a form that is suitable for display on a mobile device that has relatively little computing power. CFD simulation and AR post-processing need significant computation, so they are performed on a sustainable cloud computing system, whereas AR visualization needs relatively little computation, and is therefore run on the mobile device.
3.1. Sustainable Cloud Computing Environment
A sustainable cloud computing system should meet two requirements for AR visualization.
(1) The system should be a combination of computing nodes with various operating systems and hardware types. Usually, the initial system has nodes with identical operating systems and hardware types. However, when a computing node is added to supplement computing power, the new node may have a different operating system and hardware than the established nodes. Therefore, one goal of this paper is to establish a heterogeneous cloud computing environment to allow for the addition or deletion of various computing nodes, and thereby to achieve a flexible and scalable system. As a result, it is possible to reduce electronic waste by ensuring system scalability.
(2) The system should allow for real-time processing that responds to concurrent user requests. AR visualization technology requires real-time features. Job scheduling should guarantee concurrent user executions. The cloud-computing system in this study consists of heterogeneous nodes that use SGE, and is designed to allow for efficient scheduling that responds to concurrent tasks. By making of effective use of computing resources, it is possible to reduce energy usage.
The cloud computing system (Figure 2) for AR visualization consists of a master that manages slave nodes that executes job requests. The master node manages the database to execute the tasks, and manages user information and job scheduling to execute concurrent tasks. The user operates various mobile devices to convey job requests to the master node, which then assigns the jobs to the execution nodes. The execution nodes then perform CFD simulation and AR post-processing, and deliver the output to the user. Execution nodes are mostly divided into cluster and cloud systems. The cloud system is designed to permit linking with private clouds, as well as with public cloud systems, such as Rescale, Amazon Web Service, and AZURE.
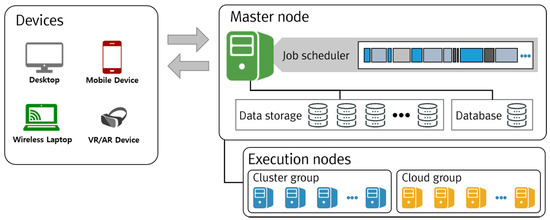
Figure 2.
Sustainable cloud computing environment using Son of Grid Engine (SGE).
3.2. Aerodynamics Simulation Using OpenFOAM
To conduct the aerodynamics simulation, the user selects one of 14 usual plate-type room structures. Then, a grid of the indoor structure is created using ‘blockMesh’ in OpenFOAM in accordance with the ‘blockMeshDict’ file, which has the geometric information and meshing methods. After the structured grid is generated, several items of furniture, such as a refrigerator, sofa, and TV, and the air purifier of the .stl CAD file type are placed in the room as desired (Figure 3). ‘snappyHexMesh’ generates an unstructured grid according to the settings in ‘snappyHexMeshDict’ and draws hybrid boundary-layer meshes near the furniture and the air purifier [22].
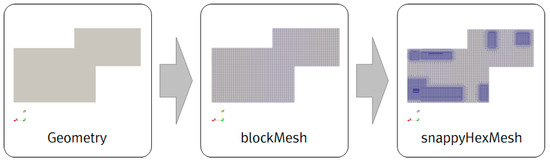
Figure 3.
Mesh generation inside housing unit and air cleaner.
In the state of setting initial/boundary conditions (Figure 4), the end faces of the room are set to a no-slip wall condition, as are the wall sides of the air cleaner and furniture. The air purifier inlet has a velocity as set to the specifications of the air purifier (2.87 m/s in this case). The air purifier outlet is set to 0 Pa, which is the standard gauge reading of atmospheric pressure. As the initial conditions, all of the velocity fields besides the boundary conditions are set to 0 m/s, and all of the pressure fields besides the boundary conditions are set to 0 Pa. The initial mass fraction of a pollutant is set at 1.0, which represents 100%. Air viscosity is set to 1 × 10⁻⁵ m2/s and pollutant diffusivity is set to 1.9 × 10⁻⁵ m2/s. For turbulence, we use the k-epsilon model [22]. As the final step before solving, the OpenFOAM ‘fvSolution’ and ‘fvScheme’ files are written to define several solvers and schemes about the governing equations. The Euler implicit method is used for time discretization. The first-order upwind scheme is used to calculate velocity, mass fraction, and turbulence variables. A convection-diffusion equation [22] is used to calculate the mass fraction of the pollutant, concurrently with calculation of N-S equation [23]; three equations, one for pressure, one for velocity, and one for mass fraction are calculated simultaneously using an iterative equation solver. OpenFOAM solves the convection-diffusion equation in scalarTransportFoam or reactingFoam, but in this paper, the species transport equation is solved by pimpleFoam, a solver for incompressible transients, using a brand-new solver called “speciesPimpleFoam” [24]. The time step is 0.1 s, so to calculate 15,000 steps, the study examines the effect of air purification over 25 min. When the governing equation is solved, the convergence and accuracy of the results vary depending on the numerical scheme [25].
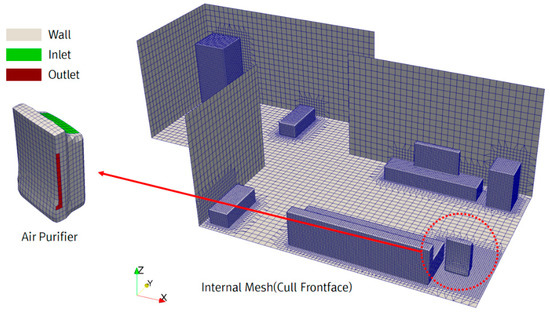
Figure 4.
Boundary condition setting.
3.3. AR Post-Processing for Lightweight Data
The cloud-based post-processing approach (Figure 5) supports quick calculation and analysis of large, complex aerodynamics simulation data. Particularly, this paper presents an approach to reduce the volume of data so that optimal AR visualization can run on a mobile device.
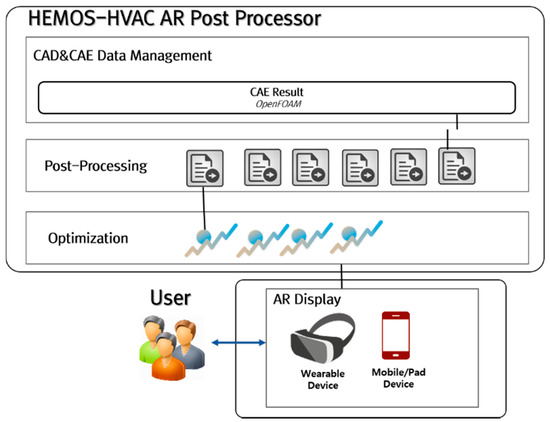
Figure 5.
Conceptual diagram of AR post-processing for AR visualization.
Post-processing (Figure 6) extracts elements, such as vertices, edges, curves, surfaces, vectors, and scalars from CFD analysis data, and then converts them to VTK format (ASCII); then, to reduce data size and analysis time, the ASCII data are converted to binary form. The converted binary 3D fluid space mesh data are parsed to find components, such as vertices, edges, and curves, then fluid analysis data such as vectors and scalars are extracted and data are created for visualization. Next, the vector field is calculated from the 3D fluid space mesh and CFD analysis data to generate the data from the results analysis. To support the automatic calculation of seed point, its initial position is generated to represent the attention zone of the CFD analysis data in the calculated vector field. The starting position of fluid flow is stored using seed point and mesh data, then post-processor data, such as Streamline and Particle, are created. Finally, AR visualization data are created by shading and mapping the 3D fluid space mesh, vector, and scalar data.
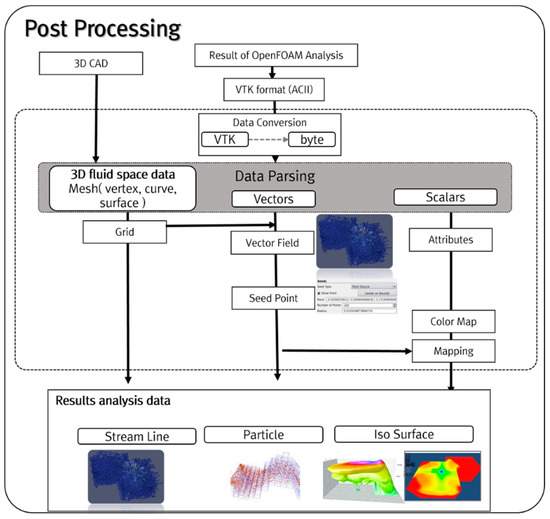
Figure 6.
AR post-processing procedure.
We present a simple but effect optimization method to visualize results analysis data in the mobile AR environment. Visualization of 3D fluid space mesh data in the form of voxels is very intensive in computation and memory. Results analysis data (streamline, particle) are calculated using vertices of 3D fluid space data. The optimization step (Figure 7) simplifies the 3D fluid space mesh data. In the simplification step, these data must be reduced; for this process, we adopt the MeshLab library [26]. Then, we generate voxels out of the data (vertex, curve, or surface objects). We use Collision Detection to delete duplicated voxel elements. We can generate light-weight results analysis data (streamline, particle) from the reduced voxels. Finally, the lightweight results analysis data are created and are sent to the user’s mobile AR device for smooth visualization.
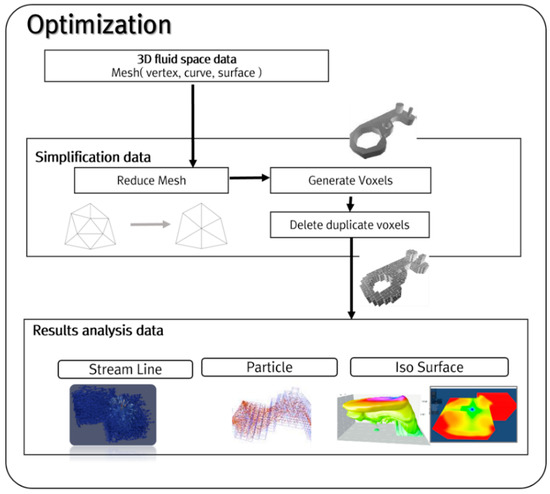
Figure 7.
Reducing size of results analysis data.
3.4. AR Tracking & Visualization
We used environment-based tracking technology with a mobile device camera to conduct AR visualization and show the air flow inside the house. Environment-based tracking technology has the advantage that it enables the user to review CFD results accurately and in immersive fashion, even in a large and complex space. Additionally, the cloud system is designed to effectively perform real-time tracking, which requires significant computation. Therefore, the cloud system performs the computationally-demanding target tracking process, then the user device performs environment registration.
Cloud-based real-time AR tracking is comprised of an AR display, an AR mapper, and an AR tracker (Figure 8). The AR display receives real-time image data from the user’s mobile device camera, and then transmits the image RGB data to the AR tracker across a wireless network. The AR tracker then uses the FAST feature technique [27] to extract features from RGB data, and in this way, it creates a 3D space in which the simulation results are displayed between the camera and the real environment space. The AR mapper matches the simulation results with the 3D space data created by the AR tracker. Quick movements of the camera that are caused by the user may end up “shaking” an augmented object, but this artifact can be corrected using the Gauss-Newton technique [28]. The AR display displays the simulation results on a screen using 3D space information (Figure 9). The AR display converts data structure to reference structure by using the reference function, and then applies the Draw Call minimization method by component batching, thereby minimizing the garbage collector call and as a result, effectively using the memory that is needed for rendering. In this way, tracking of the physical space can be done quickly, and AR visualization of the aerodynamics simulation results can be implemented naturally.
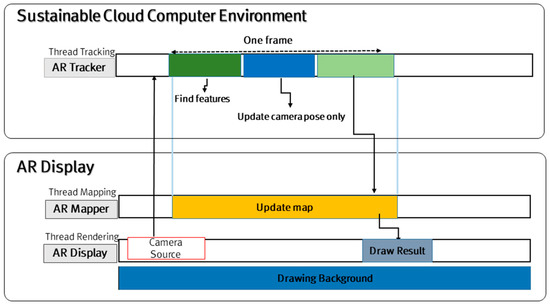
Figure 8.
Cloud-based AR tracking.
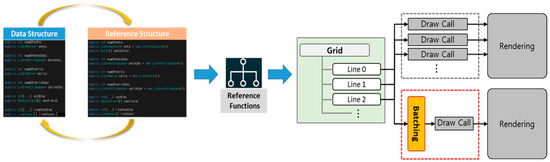
Figure 9.
AR display process.
4. Implementation Results
This study applies AR visualization technology to help users intuitively understand the results of aerodynamics simulation. The researcher puts an air purifier inside a housing unit, conducts an aerodynamics simulation, and then implements AR visualization of the results with a smart phone/pad or wearable device. We have implemented the augmented model to examine in detail the housing structure model, the indoor physical space, and the mapped specific zone. The AR visualization uses a mobile device or a wearable device (Table 2).
Table 2.
AR Display Devices & Functions.
4.1. Sustainable Cloud Computing Environment
We established a cloud-computing environment by constructing a cloud test bed. The environment consists of a master node unit, a 2-unit cluster group node, and 4-unit cloud group node (Table 3). Resource management of the node is performed by the SGE. The master node uses SGE to manage all resources and user tasks. The execution node calculates the real tasks and is divided into cluster type and cloud type. The sustainable cloud computing environment is expandable, and it can use different operating systems and hardware at each node.
Table 3.
Node Specifications for Sustainable Cloud Computing.
The SGE directory of the master node is the default and is set as a Network File System (NFS) share file system to be accessed from all cloud environment nodes. If the NFS is a large cluster or has high throughput, considerable traffic occurs in the NFS itself, but if it is <100 nodes, or if it has low throughput, this problem does not occur [29]. In addition, traffic can be resolved by changing the whole grid engine share file setting. The cloud environment in our study consists of reliable nodes. Thus, default spool directories, executable files, and configuration files can be used, rather than local ones. The advantages of NFS in SGE are easy setting and convenience of upgrading and debugging.
4.2. Aerodynamics Simulation
The results of an indoor air purification simulation were visualized (Figure 10) using Paraview, an open-source post-processor tool. Paraview supports the visualization of OpenFOAM’s analysis result format, and in our study, performs this visualization with its volume rendering and streamline functions [30]. The mass fraction of the pollutant decreased over time (Figure 10a–c). At the beginning, almost 100% of the volume was red (saturated with pollutants), but most gradually became blue (clear of pollutants) as the air purification reduced the air pollution. The fluid flow changed depending on the amount of time lapse. The streamline also changed over time (Figure 10d–f). Flow initiates at the air purifier inlet and outlet, and then spreads through the room. Meanwhile, mass fraction of pollutant in the air changed over time in the entire inside space (Figure 11). The effect of the air purifier occurred throughout the room and the amount of pollutant decreased.
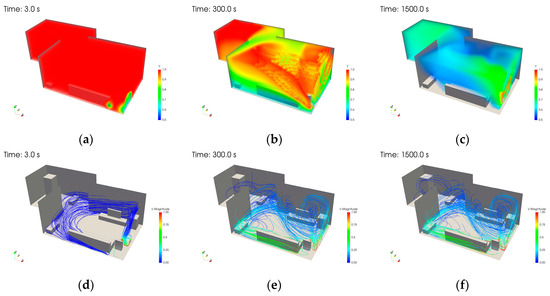
Figure 10.
Mass fraction of pollutant and streamlines; (a) Mass fraction of pollutant at 3 s; (b) Mass fraction of pollutant at 300 s; (c) Mass fraction of pollutant at 1500 s; (d) Streamlines at 3 s; (e) Streamlines at 300 s; (f) Streamlines at 1500 s.
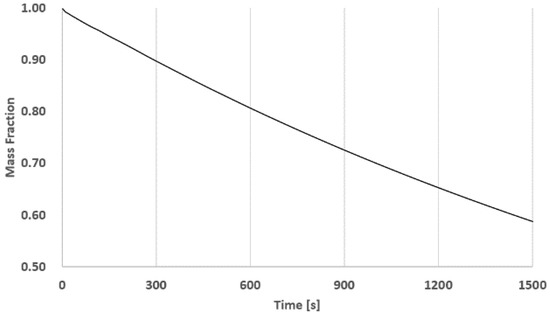
Figure 11.
Change of mass fraction of pollutant as time lapses.
4.3. AR Visualization
This study used the Unity engine to render the simulation results and an AR display device; the intention was to offer an accurate and immersive environment for the user. The display composition for AR visualization (Figure 12) allows for the user to review the aerodynamics simulation results in an AR environment by using an Android mobile device that runs the App that the Unity engine exports, or by means of HoloLens smart glasses. AR visualization displays results for the whole interior space and for local spaces that were obtained by mapping of the real and virtual air purifiers in simulation. The results for the whole space (Figure 13) first recognize the rapid prototype (RP), and then match the simulation results with the RP model and visualize it. Visualized simulation results (Figure 14) from the air purifier zone were obtained by putting the virtual air cleaner model on the position of the actual air purifier. As a final analysis result, the AR display runs at 15 frame/per second. Due to the intuitive and automated workflow, and to seamless process iterations, the use of the application does not require expert knowledge of simulations.
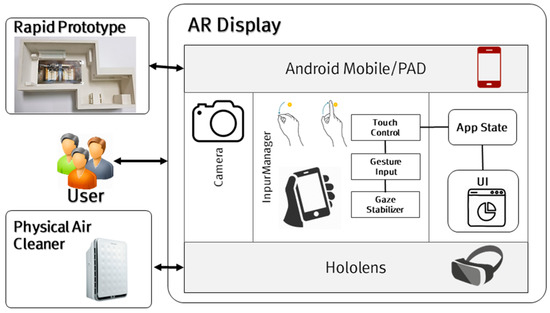
Figure 12.
AR display implementation.
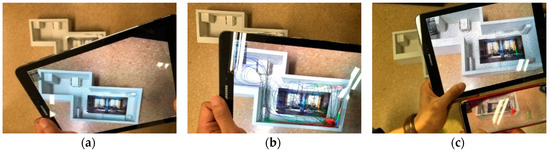
Figure 13.
Whole layout of smartphone/smart device-based post-processing; (a) RP Visualization; (b) Streamline Visualization; (c) Particle Visualization.
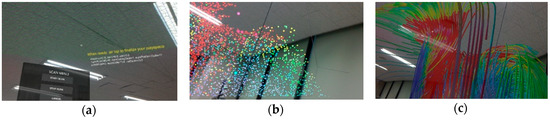
Figure 14.
Wearable AR-based post-processing result of air purifier and environment ; (a) Menu; (b) Particle Visualization; (c) Streamline Visualization.
5. Conclusions and Future Work
We have designed and implemented a system that uses using AR technology to review CFD simulation results. Our system is largely made up of CFD simulation, AR post-processing, and AR visualization so that the significant amount of computation needed is done in a cloud-computing environment with a view to ensuring real-time visualization. The cloud environment consists of a master node, cluster nodes, and cloud nodes, and can effectively use SGE to link heterogeneous nodes, and can process concurrent tasks from the user. The aerodynamics simulation of the air purification inside a house used OpenFOAM for CFD analysis. The simulation results were reprocessed to reduce the volume of data by AR post-processing to allow for the simulation results to be visualized on a mobile device that has relatively low computational capability. Then AR tracking, which uses an environment-based tracking technology, is conducted so the user can review CFD analysis results in accurately and in an immersive fashion even in large, complex spaces. Finally, the simulation results of the indoor air purification are displayed on a mobile device, tablet, or HoloLens by means of Unity-based AR visualization. We plan to conduct further studies to implement AR visualization of CFD simulation in a variety of fields, validate its accuracy, and improve the real-time features. We have demonstrate that an efficient service that uses little energy can be assembled using the cloud, based on heterogeneous nodes. In the future, we will implement real-time AR visualization for CFD simulations in a variety of fields, and verify its usefulness and the performance of the proposed method through collaboration with CFD experts and a usability evaluation.
Author Contributions
All authors contributed extensively to the work presented in this paper. Myungil Kim devised the idea and developed the approach. Dongwoo Seo and Sangjin Park implemented the AR post-processing and AR visualization. Daeyoung Jung built the sustainable cloud computing environment. Sukkeun Yi performed the aerodynamics simulation and implemented the CFD simulator using OpenFOAM. All authors have participated in writing this paper.
Acknowledgments
This work was supported by the Institute for Information & Communications Technology Promotion (IITP) through a grant funded by the Korean government (Ministry of Science & ICT) (No. 2017-0-00350, Shape Pattern Modeling Method based on 3D CAD and Integration Analysis Platform Development for Manufacturing Engineering) and the Korea Institute of Science and Technology Information (KISTI).
Conflicts of Interest
The authors have no conflict of interest.
References
- Sinclair, P. Integrating Hypermedia Techniques in Augmented Reality Environments. Ph.D. Thesis, University of Southampton, Southampton, UK, 28 May 2007. [Google Scholar]
- Azuma, R. Overview of Augmented Reality. In Proceedings of the SIGGRAPH International Conference on Computer Graphics and Interactive Techniques, Los Angeles, CA, USA, 8–12 August 2004. [Google Scholar]
- Ahmad, R.W.; Gani, A.; Hamid, S.H.A.; Shojafar, M.; Ahmed, A.I.A.; Madani, S.A.; Saleem, K.; Rodrigues, J.J. A survey on energy estimation and power modeling schemes for smartphone applications. Int. J. Commun. Syst. 2017, 30, 1–22. [Google Scholar] [CrossRef]
- Naranjo, P.G.; Pooranian, Z.; Shojafar, M.; Conti, M.; Buyya, R. FOCAN: A Fog-supported Smart City Network Architecture for Management of Applications in the Internet of Everything Environments. Available online: https://arxiv.org/pdf/1710.01801.pdf (accessed on 30 March 2018).
- Dastbaz, M.; Pattinson, C.; Akhgar, B. A Green Information Technology: A Sustainable Approach; Elsevier: New York, NY, USA, 2014; pp. 95–110. ISBN 978-0-12-801379-3. [Google Scholar]
- Son of Grid Engine. Available online: https://arc.liv.ac.uk/trac/SGE (accessed on 30 March 2018).
- Li, W.; Nee, A.Y.C.; Ong, S.K. A State-of-the-Art Review of Augmented Reality in Engineering Analysis and Simulation. Multimodal Technol. Interact. 2017, 1, 17. [Google Scholar] [CrossRef]
- Tawara, T.; Ono, K. A framework for volume segmentation and visualization using augmented reality. In Proceedings of the 2010 IEEE Symposium on 3D User Interface (3DUI), Westin Waltham-Boston Waltham, MA, USA, 20–21 March 2010; pp. 20–21. [Google Scholar]
- Kaladji, A.; Dumenil, A.; Castro, M.; Cardon, A.; Becquemin, J.P.; Bou-Saïd, B.; Haigron, P. Prediction of deformations during endovascular aortic aneurysm repair using finite element simulation. Comput. Med. Imaging Graph. 2013, 37, 142–149. [Google Scholar] [CrossRef] [PubMed]
- Sutherland, C.; Hashtrudi-Zaad, K.; Sellens, R.; Abolmaesumi, P.; Mousavi, P. An augmented reality haptic training simulator for spinal needle procedures. IEEE Trans. Biomed. Eng. 2013, 60, 3009–3018. [Google Scholar] [CrossRef] [PubMed]
- Weidlich, D.; Scherer, S.; Wabner, M. Analyses using VR/AR visualization. IEEE Comput. Graph. Appl. 2008, 28, 84–86. [Google Scholar] [CrossRef] [PubMed]
- Paulus, C.J.; Haouchine, N.; Cazier, D.; Cotin, S. Augmented reality during cutting and tearing of deformable objects. In Proceedings of the 2015 IEEE International Symposium on Mixed and Augmented Reality (ISMAR), Fukuoka, Japan, 29 September–3 October 2015. [Google Scholar]
- Buchau, A.; Rucker, W.M.; Wössner, U.; Becker, M. Augmented reality in teaching of electrodynamics. Int. J. Comput. Math. Electr. Electron. Eng. 2009, 28, 948–963. [Google Scholar] [CrossRef]
- Silva, R.L.; Rodrigues, P.S.; Oliveira, J.C.; Giraldi, G. Augmented Reality for Scientific Visualization: Bringing Datasets inside the Real World. In Proceedings of the Summer Computer Simulation Conference (SCSC 2004), Montreal, CA, USA, 20–24 July 2004. [Google Scholar]
- Lakaemper, R.; Malkawi, A.M. Integrating robot mapping and augmented building simulation. J. Comput. Civ. Eng. 2009, 23, 384–390. [Google Scholar] [CrossRef]
- Malkawi, A.M.; Srinivasan, R.S. A new paradigm for Human-Building Interaction: The use of CFD and Augmented Reality. Autom. Constr. 2005, 14, 71–84. [Google Scholar] [CrossRef]
- Fukuda, T.; Mori, K.; Imaizumi, J. Integration of CFD, VR, AR and BIM for design feedback in a design process-an experimental study. In Proceedings of the 33rd International Conference on Education and Research in Computer Aided Architectural Design Europe (eCAADe33), Oulu, Finland, 22–26 August 2015. [Google Scholar]
- Yabuki, N.; Furubayashi, S.; Hamada, Y.; Fukuda, T. Collaborative visualization of environmental simulation result and sensing data using augmented reality. In Proceedings of the International Conference on Cooperative Design, Visualization and Engineering, Osaka, Japan, 2–5 September 2012. [Google Scholar]
- Moreland, J.; Wang, J.; Liu, Y.; Li, F.; Shen, L.; Wu, B.; Zhou, C. Integration of Augmented Reality with Computational Fluid Dynamics for Power Plant Training. In Proceedings of the International Conference on Modeling, Simulation and Visualization Methods, Las Vegas, NE, USA, 22–25 July 2013. [Google Scholar]
- Regenbrecht, H.; Baratoff, G.; Wilke, W. Augmented reality projects in the automotive and aerospace industries. IEEE Comput. Graph. Appl. 2005, 25, 48–56. [Google Scholar] [CrossRef] [PubMed]
- Niebling, F.; Griesser, R.; Woessner, U. Using Augmented Reality and Interactive Simulations to Realize Hybrid Prototypes. Available online: https://www.researchgate.net/profile/Uwe_Woessner/publication/ 220844660_Using_Augmented_Reality_and_Interactive_Simulations_to_Realize_Hybrid_Prototypes/ links/0c96052a9c0905da4e000000.pdf (accessed on 30 March 2018).
- Jasak, H.; Jemcov, A.; Tukovic, Z. OpenFOAM: A C++ library for complex physics simulations. In Proceedings of the International Workshop on Coupled Methods in Numerical Dynamics, Dubrovnik, Croatia, 19–21 September 2007. [Google Scholar]
- Kays, W.M.; Michael, E.C. Convective Heat and Mass Transfer, 3rd ed.; Jenson Books: Logan, UT, USA, 2005; pp. 50–210. ISBN 0070337217. [Google Scholar]
- Jang, D.S.; Jetli, R.; Acharya, S. Comparison of the PISO, SIMPLER, and SIMPLEC algorithms for the treatment of pressure-velocity coupling in steady flow problems. Numer. Heat Transf. Part A Appl. 1986, 10, 209–228. [Google Scholar]
- Versteeg, H.K.; Malalasekera, W. An Introduction to Computational Fluid Dynamics: The Finite Volume Method; Pearson Education: New York, NY, USA, 1995; pp. 40–130. ISBN 0131274988. [Google Scholar]
- MeshLab Library. Available online: http://www.meshlab.net/ (accessed on 30 March 2018).
- Rosten, E.; Drummond, T. Machine learning for high-speed corner detection. In Proceedings of the European conference on Computer Vision—ECCV, Graz, Austria, 7–13 May 2006. [Google Scholar]
- Sarkis, M.; Diepold, K. Camera Pose Estimation via Projective Newton Optimization on the Manifold. IEEE Trans. Image Process. 2012, 21, 1729–1741. [Google Scholar] [CrossRef] [PubMed]
- Reducing and Eliminating NFS Usage by Grid Engine. Available online: http://arc.liv.ac.uk/SGE/howto/nfsreduce.html (accessed on 30 March 2018).
- Ayachit, U. The Paraview Guide: A Parallel Visualization Application; Kitware: New York, NY, USA, 2015; pp. 20–150. ISBN 1930934300 9781930934306. [Google Scholar]
© 2018 by the authors. Licensee MDPI, Basel, Switzerland. This article is an open access article distributed under the terms and conditions of the Creative Commons Attribution (CC BY) license (http://creativecommons.org/licenses/by/4.0/).