Abstract
Although the risk management of agricultural firms is important, studies on the extreme risk dependence among agribusiness firms are minimal due to the diversity and complexity of the risks faced by agricultural firms. In this study, we developed a hybrid approach to analyse and uncover the potential risk dependence among agricultural firms. We examined thirty-two agricultural companies to study their dependence structure for risk losses. Three primary findings emerged. First, risk dependence is strong with an average value of 0.96. Second, the dependence structure is hierarchical and includes two network communities. Third, some key agricultural firms were identified in the dependence structure. These key firms are critical for the transmission of negative impacts across agricultural firms. Correspondingly, we suggest measures and strategies (such as improving the level of technological innovation and joint risk resistance capability) to reduce the impact of risk dependence.
1. Introduction
Agriculture is a vital sector in China since it is the foundation for supporting the national economy and peoples’ livelihoods. The agricultural sector is in a period of major change and transition called the industrialization of agriculture, and this transition is an important strategy for China’s future development. Agricultural firms play a very important role in adjusting China’s agricultural structure and speeding up agricultural industrialization [1]. Since the external and internal risks faced by agricultural firms are complex and varied, agricultural firms have greater exposure to risks than firms in other industries [2,3]. Although agricultural firms are important, the study of risk management of agricultural firms has been minimal due to the diversity and complexity of risks faced by agricultural firms, especially the risk dependence relationship among agribusiness firms [4,5,6]. As a decision maker or policy maker, avoiding the transmission of negative impacts across agricultural firms and ensuring the stability of the agricultural economy have identical importance for increasing the profits of firms [7].
Due to the complexity and difficulty of coping with risks faced by agricultural firms, current research has mainly focused on firm performance, equity financing, competitiveness, agricultural subsidies, social responsibility, and green agriculture [8,9,10,11,12,13]. Regarding risk analysis, some methods and approaches have been proposed and applied to agricultural firms [2,3,4,14,15]. Furthermore, several particular types of risks faced by agricultural firms have been studied [14,16,17]. It is obvious that the operational activities of agricultural firms are affected by natural factors and influenced by technological, economic, political, and marketing factors [2]. Since risks might be interconnected and difficult to isolate, isolated risk evaluation and analysis methods are ineffective, and the methods themselves cause new risks [2,3,14]. Moreover, whether there is a dependent relationship between the risk losses of two agricultural firms is rarely considered and is unknown. Therefore, a comprehensive and systematic method is needed to examine the dependent relationships among agricultural firms and the stability of the agricultural economic system from the perspective of the dependence of losses.
To accomplish this, two critical issues must be addressed. The first is to measure the dependence between the risk losses of two agricultural firms. Since the distributions of risk losses vary from risks, traditional methods such as Pearson correlation coefficients are not sufficient to address the nonlinear dependence of losses. Hence, modelling with nonlinear and non-Gaussian dependence structures is of great interest to many researchers. Particularly, Copula-based models have recently attracted a fair amount of attention due to their applicability and flexibility [18,19]. Therefore, we utilized the copula method to capture the nonlinear and asymmetrical relationship among agricultural firms. In fact, agricultural firms can handle most risks within their risk management frameworks. However, they can do little regarding the extreme risk in which the probability of a risky event is very low, but the consequences are huge and exceed their coping ability. As a result, the negative impact is more likely to spread among agricultural firms. In this extreme situation, the acquisition of a risk dependence structure is more important and urgent. Therefore, we adopted the Extreme Value theory (EVT) to address huge losses in extreme situations. In this paper, we used the Peaks-Over-Threshold (POT) model, which is more useful and popular in EVT. Furthermore, over the past years, an increasing number of domestic and foreign scholars have adopted the Copula function and EVT for researching the problem of risk spread [20]. Hence, it is useful to study the Copula theory and EVT together to evaluate the extreme risk dependence among agricultural firms. More precisely, we characterized the dependence of risk losses using the POT model of EVT and the Frank Copula function of Copula theory.
Once the dependence coefficient of risk losses is obtained, we can understand any two firms’ dependent relationship. However, the dependence coefficient is insufficient to reveal the stability of an agricultural economic system by considering only the risk dependence of two firms. We stress that understanding the stability of the agricultural economic system is more important than only focusing on two firms. It is important to obtain a general understanding and a visual representation of the dependency structure of risk losses of all firms in the agricultural economic system. Therefore, we constructed a network based on the dependency structure of risk losses, and captured the topological features of the agricultural system. Furthermore, since the network we obtained is fully connected, Minimum Spanning Trees [21] were used in this paper to mine the most likely dependent path of risk losses among agricultural firms and supporting managers with detection, prediction and prevention of the potential influence on each other.
Agricultural listed companies are the most representative and competitive agricultural firms. The stock price is considered a comprehensive reflection of a listed company and is able to explain the aggregate impact of various risks (such as terrorism risk and natural disaster risk) on firms [22,23,24]. Therefore, we took the thirty-two agricultural listed companies as examples to study the dependency structure of risk losses by utilizing stock return data. The contribution of this study lies in the fact that we developed a hybrid approach to explore the risk dependency structure among agribusiness firms. More specifically, we calculated the dependency coefficient by utilizing the Copula theory and EVT. Then, we analysed the characteristics of the dependency structure by utilizing the Minimum Spanning Trees and community structures of the network theory. Finally, the experimental results are presented in both macroeconomic and microeconomic views, providing evidence of the risk relationship between agricultural firms in China. The rest of this paper is organized as follows. Section 2 provides a literature review of research work on the risk management of agricultural firms and dependency modelling methods. Section 3 elaborates on our method, details the implementation and obtains the dependency coefficient and the potential dependency path of risk losses. Section 4 presents the analysis and results from thirty-two agricultural companies in China. Theoretical and managerial implications are analysed in Section 5. Conclusions and limitations are given in Section 6.
2. Literature Review
2.1. Risk Management of Agricultural Firms
Generally, agribusiness firms (or agricultural firms) refer to those companies whose operations and activities are related to agricultural supply (e.g., seed, fertilizer, and agricultural machinery), production (e.g., farming and fishing), processing (e.g., agri-products and food manufacturing), marketing and consumption. While the risk of agricultural firms encompasses a variety of deviations from expected results and targets, risk is caused by uncertainties from many aspects [5,6]. The external and internal risks faced by agricultural firms are complex and varied and need to be identified and analysed. We can measure and assess risks only after a comprehensive and accurate identification of risks. Then, we can choose the proper approaches to respond to the risks. Some risks faced by agricultural firms have been identified by some scholars. For instance, according to the United States Department of Agriculture’s Risk Management Agency, five primary categories of risk are defined, including production, marketing, finance, legal, and human risks [25]. Girdžiūtė [2] states that the main risk types in agriculture include production, credit, personal, political, and economic risks. Note that the specific definitions and measurement models of risks are different due to the various types of risk factors. For instance, drought disaster risk might refer to the probability and severity of reduced production or profits induced by a drought disaster. Zhang et al. [3] distinguished some concepts of risks for agricultural firms, such as strategic risk, market competition risk, price risk, and natural risk.
Once we identify the risk, we can conduct risk measurement and evaluation. Some methods of risk evaluation can be used in agriculture, such as the Event Tree analysis (ETA), Fault Tree analysis (FTA), Delphi Technique, Value at Risk (VaR), and Variation–covariation method [2]. In addition, some frameworks and methods are also proposed for individual risk assessment [4,26]. The majority of methods focus on natural risks since, compared with other non-agricultural firms, agricultural firms suffer more natural risks (e.g., drought, frost, hail, abnormal coldness, excess rain, etc.). However, it is difficult to isolate different types of risks since risks influence and interact with each other. This makes isolated risk management methods ineffective, and even the methods themselves might cause new risks. To better conduct agricultural risk management, some risk management frameworks have been employed and proposed, especially integrated risk assessment methods [2,27]. Some scholars [2,3,14] have realized that individual risk assessment is widely analysed while integrated risk assessment is limited. These authors also stated that integrated risk assessment can identify more than one risk and lead to a greater decision-making efficiency. For instance, Zhang et al. [3] employed factor analysis to optimize the evaluation index system of agricultural firms’ risks. Wang et al. [14] developed an evaluation index system for the investment risk of agricultural firms by utilizing a Fuzzy comprehensive evaluation method. Girdžiūtė [2] presented a logical framework of integrated risk evaluation in agriculture. However, the main concerns of these aforementioned studies lack the dependency analysis of risks to reveal how these risks are related to each other. Meanwhile, whether there is a dependent relationship between the risk losses of agricultural firms is rarely considered, especially in the extreme situation.
2.2. Proposed Methods
A dependent relationship between the losses of agricultural firms is rarely considered. Mu et al. [28] calculated the tail dependency of agricultural companies in Shanghai and Shenzhen using the non-parametric estimation method. You and Ando [29] proposed a statistical modelling methodology for the analysis of the term structure of credit risk and its dependency. They apply a dimension-reduction technique and use a dependency matrix to model the correlation structure. However, their main concern was the dependency of two markets without considering the dependency structure of the agricultural economic system from a standpoint of associated systems. Regarding the measurement of the dependency between risks, traditional methods include correlation coefficients. However, correlation is only a measure of linear dependence and suffers from a number of limitations [30,31]. Some scholars have indicated that failure to properly characterize the relationship and inter-dependence of multiple risk factors can have severe consequences [32]. Therefore, some measures for nonlinear dependence are required.
The Copula theory can exactly capture nonlinear and asymmetrical correlations among variables. In addition, the EVT can directly model the tails of the distribution to avoid the problem of the population distribution hypothesis. An increasing number of domestic and foreign scholars have adopted the Copula theory and EVT for research on the problem of risk spread and dependency. Longin and Solnik [33] examined the correlation between the stock returns of developed countries by tail dependence using the Extreme Value theory. Hartmann et al. [34] utilized the correlation of extreme values to measure the correlation between main industrial countries’ stock market and bond market in times of crises. Aloui et al. [19] used the Copula theory to test the contagion in Brazil, Russia, India, China and the US (BRICs) caused by the sub-prime mortgage crisis in America. Patton [18] reviewed Copula-based models for economic and financial time series. Hu et al. [20] established an EVT-Copula-CoVaR model to examine the dynamic correlation and spillover effect between banking and real estate. Xu and Yu [35] investigate the risk dependence structure between the Shanghai Shenzhen 300 index and the portfolio index of ETFs using a mixed copula approach. Based on the literature, we see that risk dependency is widely studied in the field of financial research, especially for financial risks and credit risks. However, most studies focus on financial sectors or institutions, whereas agricultural sectors and firms have received relatively less attention.
From the network perspective, a risk dependency structure among agricultural firms can be expressed as a network structure where nodes represent different economic agents (firms, industries, sectors, or countries), and links represent their risk dependency [36,37]. The Minimal Spanning Tree method and the threshold method are two main network construction methods. Mantegna [38] defines the distance between nodes based on correlation coefficients between stocks and builds a financial network using Minimum Spanning Trees for the first time . Brida and Risso [39] proposed the use of symbolic time series analysis to construct a minimal spanning tree in which each stock is represented by a binary time series of volumes and closing prices. Junghoo Lee et al. [40] established a stock network by using intra-day volume data from the Korean stock market and studied the relationship between market volatility and network properties, found a strong negative correlation between market volatility and network density. The literature on Minimum Spanning Trees shows that it is a popular way to describe the dependency of risks, especially in financial markets. Many scholars argue that, when affected by various factors, financial risks will spread in financial markets, trigger a large-scale price fluctuation and even destroy the stability of the financial system [41,42]. Therefore, we argue that network-based approaches can provide intuitive representations that describe interdependencies. Furthermore, Minimum Spanning Trees can help us find the most likely and important loss dependency structures among various agricultural firms.
3. Methodology
Agricultural risks, in particular risk dependencies, are characterised by nonlinearities, diversity and other complex features. However, most current research focuses on linear relationships without considering the nonlinear relationships, especially nonlinear relationships in the context of extreme situations [43]. The Copula method can effectively describe and address nonlinear relationships, while Extreme Value theory can depict the characteristics of extreme situations. In addition, network methods can provide an intuitive description of complex systems. Minimum Spanning Trees can further mine the key information in a network. Therefore, to explore the risk dependency structure among agribusiness firms, we developed a hybrid approach that integrates the advantages of these methods. The proposed methodology is implemented through three steps, including defining the extreme risk dependence, estimating the dependency coefficient between two agricultural firms, and constructing the loss dependency structure within the agricultural economic system.
3.1. Definition of Extreme Risk Dependence
In general, risk involves gains and losses. The risk of losses is what we are concerned with in this paper, and it highlights the negative impact of unwanted events (risk accidents) on agricultural firms. We assume that the losses of one agricultural firm are denoted by and are calculated by
where represents the total number of risk types, including operational risks, market risks, credit risks, and others. represents the losses of agricultural firm induced by a risk accident and is expressed by
where is the expected result or target of agricultural firm . represents the contribution of the risk event on the expected result of the agricultural firm . represents the dependency measurement of two risks and . Then, the dependency between the risk losses of two firms and is denoted by , which can be described by their joint distribution function:
Here, notably, the that we considered is the extreme value of losses rather than normal losses. In other words, we consider the dependency of losses in an extreme situation where the occurrence probability of the risky event is very low, but the consequences are huge and exceed the firm’s coping capabilities. From a combination of macroeconomic and microeconomic perspectives, we obtained a matrix for the dependency structure for any two agricultural sectors and . Then, the matrix involving all agricultural firms in the agricultural economic system could be characterized by the classification of agricultural sectors. We assume that the agricultural economic system involves agricultural sectors or industries. Each agricultural sector has agricultural firms, . Then, and are obtained from the integration of firms performing in sectors and . They are expressed as follows:
3.2. Measurement of Loss Dependence Based on Copula and POT Models
Since the dependency of losses is usually nonlinear, instead of using Pearson’s correlation coefficient, we utilized Kendall’s rank coefficient calculated by Copula to measure the dependency of losses between agricultural firms and , where , , and . The coefficient was estimated based on the Copula and POT models. To simplify the deductive process, let be the losses of agricultural firm with the distribution function , . For any two firms and , the joint distribution of extreme values and ( and ) can be defined by using the copula function as follows:
where is the joint distribution function of and and . Differentiating the above equation with respect to all variables, we obtain the probability density function :
where is the probability density function associated with the marginal distribution . c is the copula probability density function given by
Since Kendall’s rank correlation τ is invariant under monotonic nonlinear transformations of the underlying variables, its definition can be written in terms of the copula C associated with . That is,
To obtain the dependence of the extreme values , we need to know the and the formation of the copula function. First, we consider . We denote as the conditional probability distribution of the excess values of over the corresponding threshold , where and . Therefore, given a high threshold , the is defined by , . This equation represents the probability that the value of exceeds the threshold by , given that exceeds the threshold . Then, we can get , and , where and . If we know and , we can get the distribution . is a formula for the probabilities of extreme values.
Now, we recall the copula function. Here, we used a one-parametric Frank copula, which is
where , , and . The density of the Frank copula is:
Then, the based on the Frank copula can be given by
where is the Debye function given by , .
Regarding , some studies [44,45] show that, for a sufficiently high threshold u, the distribution function of the excess may be approximated by the generalized Pareto distribution (GPD). When the threshold gets large, the excess distribution converges to the GPD. Hence, we assumed that, for a sufficiently high threshold u, the distribution function of the excess is approximated by the generalized Pareto distribution (GPD). Let . Then, the excess distribution is defined as
with
Then, we can obtain
In this paper, we assume that the probabilities of the extreme values are
where is the number of observations for firm . is the corresponding number of observations that exceed the threshold. Then, we can get :
We stress that this formula is only valid for . Furthermore, the density distribution of the GPD is
Then, we can get the density function :
The parameters , , and can be estimated by using the Maximum Likelihood Estimation. The log-likelihood function of the joint probability density function takes the form
Here, we follow Patton’s work [46] and use the Multi-Stage Maximum Likelihood (MSML) estimation to separately maximize the parameters for the copula and margins. The MSML estimators are defined as
The determination of a threshold value is the crucial step. In this paper, we use a combination of the Mean Excess Function (MEF) plot and the Hill plot to determine . For a given sample, the Mean Excess Function is defined as follows: , and if . Otherwise, , where represents the number that exceeds the threshold. According to the above equation, we generally construct the mean excess plot ,, where denotes the th order statistic. Let be the order statistics with independent and identical distributions. The Hill estimator is defined by . Then, a Hill plot is obtained that is a plot of the points . Threshold is selected based on the stable portion that has a linear trend. Therefore, the in this paper is obtained by the average of and such that .
After determining a high threshold , we can estimate all the parameters by using the MSML according to Equations (21)-(23). In particular, the natural logarithm of the likelihood function (log-likelihood function) is
3.3. Dependence Structure of Losses Based on Network and Minimum Spanning Trees
After we get and according to Section 3.1 and Section 3.2, we can further analyse the dependency structure by utilizing the network method. Since coefficients cannot be directly applied to a network, we agree with Gower’s and Ross’s point [21] and introduce a concept of distance in which we assume that the distance will be smaller if the dependency coefficient is bigger. Thus, the distance between the two firms is denoted as
The distance between two sectors is denoted as the average of such that . Thus, a distance matrix is extracted. Having transformed these dependency coefficients into distance, we are able to construct a fully connected network. It is obvious that the fully connected network is not sufficient to directly reflect the key information. Therefore, we used Prim’s algorithm proposed by Jarnik in 1930 [47] to obtain a Minimum Spanning Tree. We assume that a smaller distance results in a bigger probability for the transmission of risks. In other words, the probability that firm or sector suffers economic losses given that firm or sector suffers economic losses would be bigger when the distance is smaller. As a result, a more probable dependency structure of risk losses among agricultural firms is obtained.
4. Empirical Study
4.1. Background
As leaders of agricultural firms, listed agricultural companies have the advantages of capital, technology and management that are helpful for adjusting agricultural structures in China and speeding up agricultural industrialization. Thus, listed agricultural companies are more important. Therefore, we selected China’s 32 listed agricultural companies to examine their extreme risk loss dependency structure. According to the Industry Classification of Listed Companies issued by the China Securities Regulatory Commission (The Industry Classification of Listed Companies is issued by the China Securities Regulatory Commission to improve the information quality in the stock market and standardize the industry classification information of the listed companies.), these agricultural companies are categorized into four agricultural industries: the agriculture industry, forestry industry, animal husbandry industry and fishery industry. Table 1 reports the selected agricultural companies.

Table 1.
Agricultural listed companies and corresponding industries.
According to the Center for China Financial Research (CCFR) at the University of Hong Kong, the stock price of a firm is a comprehensive reflection of the company’s future profits. Some studies also have proven that stock prices are able to effectively explain the total impact of various risks on firms [22,23,24,48,49,50]. Therefore, we assume that the stock returns of the listed agricultural companies could be considered an aggregated result of various risks on agricultural firms. We then calculated the risk losses based on stock asset returns. The risk losses of an agricultural firm were calculated by
where is the daily stock return, , and is the adjusted daily closure price on day .
4.2. Data Collection
The data set of daily adjusted closure prices was downloaded from the Yahoo Finance web service, which offers daily historical data for the prices of stocks traded in various markets. The historical data from Yahoo Finance present information about the volume of stocks traded; the highest, lowest, opening, and closing values; and an adjusted closing value that provides the closing price (on the requested day, week, or month for any stock) adjusted for all applicable splits and dividend distributions. The data cover the period from 4 January 2011 to 30 December 2016. The descriptive statistics of daily losses are shown in Table 2. All the series fail to pass the Jarque–Bera normality test, which means that the normality hypothesis can be rejected. The daily stock losses for each firm show a fat tail. Then, we performed the Augmented Dickey–Fuller test. There was no unit root, and all the series were trend stationary.
Table 2.
Descriptive statistics of daily losses.
4.3. Results
According to the method in Section 3.2, the shape and scale parameters and were obtained, as shown in Table 3. The average value of the dependency coefficient was 0.96, which means that the risk dependency regarding the extreme values was strong among these firms. Our contention is that agricultural firms exhibit very high-risk dependency with one another is their small scale of business. As noted above, according to 2015 data from the National Bureau of Statistics of the People’s Republic of China and China Securities Regulatory Commission, there are 1,204,724 firms but only 43 agricultural listed companies in the primary industry of China. There are far too few agricultural listed companies, and their scale of business is also small. As a result, their risk resistance capacity and market competitiveness are weak, as prior studies have demonstrated [51]. Therefore, when they face a substantial risk (especially extreme situations), most are likely to suffer a tremendous loss.
Table 3.
Corresponding parameters.
The dependency structure of losses among these four agricultural industries was obtained as shown in Table 4. Differences in industry characteristics mean that there are also some differences in the dependencies in these industries. Specifically, from an industry-level perspective, risk dependency is strongest for the animal husbandry and fishery industries, which means that both animal husbandry and fishery firms have the closest interaction in terms of extreme risk losses. From the perspective of inter-industry concerning the relationship between different sectors, we see from Table 4 that animal husbandry has the highest risk dependency with fisheries. The result in our study that risk dependency is strong is consistent with that of Mu et al. [28].
Table 4.
The dependency of risk losses among four industries (average value of dependence coefficients).
To obtain the dependency structure, we transferred the dependency coefficient to distance according to the method in Section 3.3. We then obtain Figure 1, in which nodes represent agricultural listed companies, labelled with their ticker symbols, and edges represent a dependent relationship between risk losses of two companies. As we can see from Figure 1, there are general associations between these agricultural listed companies. The figure gives us an intuitive network representation of the dependency structure. To further mine the most important information about the structure, we then used Prim’s algorithm to obtain a Minimum Spanning Tree that covered all the firms without loops, as shown in Figure 2. The structure of Figure 2 is more concise than that of Figure 1. In contrast to Figure 1, in Figure 2, the total distance, which is the sum of edge weights (distance value) is minimized. Then, we used the community structure of the network to analyse the dependency structure of the risk losses we obtained. The community structure (characterized by two colours) is shown in Figure 2. Two communities were identified: the first community includes the following nodes: 000998, 300087, 600108, 600354, 600359, 600371, 600506, 600540, 600598, 601118, 000735, 002234, 002299, 002321, 002458, 002477, 002505, 300106, 600965, 600975, 000798, 002069, 002086, 002447, 300094, 600097, 600257, which are the nodes depicted in pink in Figure 2. The second community contains the following nodes: 002041, 600313, 000592, 002200, 600265, which are the nodes depicted in green in Figure 2. These two communities show that there might exist two mechanisms or functions to describe the risk dependency among agricultural listed companies. In other words, the nodes within same community have relatively consistent risk dependent relationships, such as the magnitude of dependency.
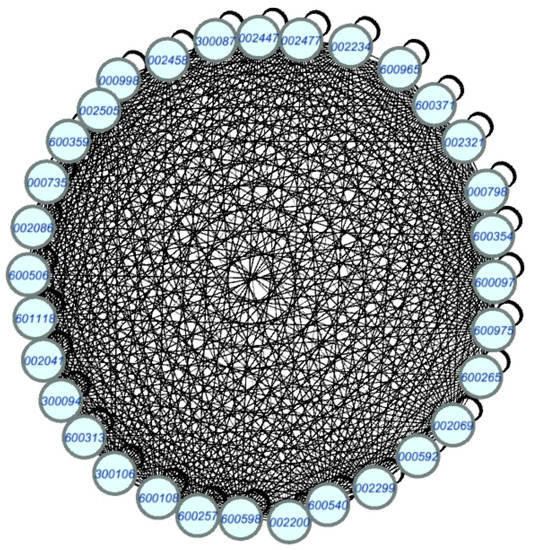
Figure 1.
The dependency structure of risk losses among the 32 agricultural listed companies based on the network.
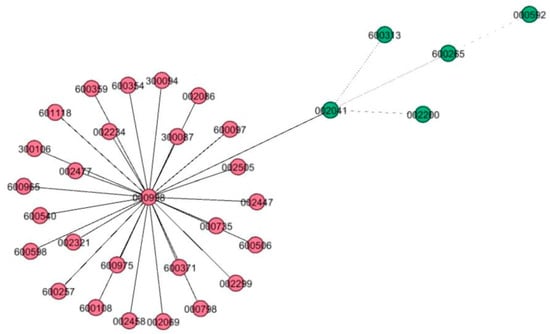
Figure 2.
The dependency structure of risk losses among the 32 agricultural listed companies based on minimum spanning trees.
The results are summarized as follows. First, extreme risk losses of listed agricultural companies are strongly dependent. This means that listed agricultural companies have very close relationships, especially in the extreme situations. In other words, other agricultural firms would be directly and immediately affected if one firm suffers huge losses. Second, the dependency structure of risk losses among listed agricultural companies has hierarchical characteristics. According to the above analysis, two communities were identified. This means that, although the external environment they face is the same, some agricultural firms have closer relationships than other agricultural firms. The fishery industry had stronger relationships with the agricultural industry and animal husbandry industry than with forestry. In addition, the dependency extent of risk losses among some agricultural firms was higher than among other agricultural firms. Third, some key nodes (key agricultural firms) were identified as shown in Figure 2—for example, Yuan Longping High-Tech Agriculture Co., Ltd. (000998) which is located in Changsha, Hunan Province, China and Shan Dong Denghai Seeds Co., Ltd. (002041) which is located in Laizhou, Shangdong Province, China.
5. Theoretical and Managerial Implications
This study has the following theoretical and managerial implications. First, this study developed a hybrid approach to explore the risk dependency of agricultural firms. We focused on modelling the nonlinear dependency of extreme losses. We expanded the application of the Copula theory into the agricultural sector rather than only focusing on the financial sector. Moreover, we extended the modelling of networks by utilizing the dependency coefficient to describe the relationship between any two nodes in the graph, which provided an intuitive way to observe the dependent structure. In addition, the acquisition of the risk dependency structure can provide us with a new method to observe economic relationships between agribusinesses from the perspective of losses in economic indicators.
Second, this study is beneficial for risk managers to grasp the risk dependency between two firms or an entire agricultural economic system. From the perspective of the firm, understanding the risk dependency between two firms can help to understand their resilience to risk. We believe that risk resistance capacity is the main determinant of risk dependency. Those firms with a high level of risk dependency could discuss and compare the similarities and differences in their risk strategies to identify advantageous and disadvantageous approaches to risk management. They could then use these findings to improve weaknesses in their risk management strategy and enhance their joint risk resistance capacity. Our results show that the thirty-two agricultural listed companies have a very high risk dependency; therefore, we suggest that these agricultural listed companies should increase their communication of knowledge on risk management and establish a common mechanism to resist risk.
From the perspective of the government, analysing the risk dependency structure among agricultural listed companies can facilitate the assessment of the overall risk tolerance of agricultural listed companies in China. Our results indicate that the overall risk resilience of the thirty-two agricultural listed companies is weak, meaning that the risk dependency is very high. If they face a substantial risk, most companies will suffer a considerable loss. Therefore, we suggest that the government should help the agricultural listed companies to improve their ability to combat risk, thereby enhancing the firms’ market competitiveness. Certain policies, such as encouraging financing among agricultural firms and expanding their financing channels, should further improve their situation.
In addition, our network model of the risk dependency structure could help risk managers to recognize the key information needed to implement a systemic risk management strategy. According to the network analysis (community structure and centrality analysis), Yuan Longping High-Tech Agriculture Co., Ltd and Shan Dong Denghai Seeds Co., Ltd play very important roles in the risk dependency structure. Therefore, we suggest that risk managers should increase their risk monitoring of these two firms and pay close attention to risk management activities for these firms, since they could be regarded as a proxy for the agricultural sector’s risk resilience capacity. We contend that, if the risk faced by agricultural firms exceeds what these two firms are able to absorb financially, the entire agricultural sector would be subject to substantial turbulence. What makes them play this key role in the dependency structure? We argue that their central role depends on their technological innovations. For example, Yuan Longping High-Tech Agricultural Co., Ltd. is well known for its technological innovations, and its leading role in technological innovations has been acknowledged [52]. Especially in the context of the implementation of the "The Belt and Road Initiative", agricultural technological innovation is critical for the overseas performance of Chinese agricultural firms. We agree that the level of agricultural science and technology is an important factor in determining risk resilience capacity. Therefore, we suggest that improving the competitiveness of firms is a critical way to mitigate risk, and accelerating the technological innovation of agricultural firms is a key factor for improving competitiveness.
6. Conclusions
Dependency studies regarding risk losses among China’s agricultural firms are of great significance for the implementation of national macroeconomic policies and the formulation of firm developmental strategies. In this paper, we developed a hybrid approach to analyse the potential risk dependency among agricultural firms. Listed agricultural companies are the representatives of the current advanced agricultural productivity, and their development is of great significance to China’s transformation of the agricultural economic development mode, agricultural industrialization and the accelerated development of modern agriculture. We studied thirty-two listed agricultural companies as an example and determined their dependency structure of risk losses. We made three conclusions. First, agricultural firms’ risk dependence is strong, and the average value of dependence coefficients was 0.96. Second, the dependency structure was hierarchical and included two network communities. Third, some key agricultural firms were identified in the dependency structure, and they are critical for the transmission of the negative impacts across agricultural firms. Some actions, such as improving the level of technological innovation and enhancing the joint risk resistance capacity, can reduce the impact of risk dependency.
There are several limitations regarding the content of this study, and several future studies are proposed to address these limitations. First, due to the importance of listed companies, we only selected listed agricultural companies for empirical study. Therefore, our next step is to incorporate small- and medium-sized agricultural firms, which will provide a more comprehensive understanding about the risk dependency of China’s agricultural economic system. Meanwhile, the weights of firms and the structure of each agricultural sector will also be considered. In addition, to simplify the measure of losses, we used stock data to conduct the empirical analysis. Therefore, the modelling of losses of agricultural firms is another research direction.
Acknowledgements
This study was supported by the National Natural Science Foundation of China (71701029, 71533001), Fundamental Research Funds for the Central Universities (DUT16RC (3) 038) and (DUT16RC (4) 72), Liaoning Academy of Social Sciences Fund (L17BGL019), and the scholarship from China Scholarship Council (CSC) (201506060084).
Author Contributions
Zhimei Lei developed the hybrid approach and mathematic model. Kuo-Jui Wu discovered the issue and designed this study. Li Cui collected the data and organized the structure of this study. Ming K Lim played an important role for structuring this study with systematic thinking.
Conflicts of Interest
The authors declare no conflict of interest.
References
- Chen, G. Status analysis and development countermeasures of Chinese agricultural listed companies. Guangdong Agric. Sci. 2011, 38, 194–198. [Google Scholar]
- Girdžiūtė, L. Risks in agriculture and opportunities of their integrated evaluation. Procedia Soc. Behav. Sci. 2012, 62, 783–790. [Google Scholar] [CrossRef]
- Zhang, H.; Yang, Y.; Guo, H. Optimization research on evaluation index system of agricultural enterprises risk. In Proceedings of the 3rd International Conference on Computer Research and Development (ICCRD 2011), Shanghai, China, 11–13 March 2011; 4, pp. 192–195. [Google Scholar]
- Pearson, L.J.; Nelsonc, R.; Crimp, S.; Langridge, J. Review: Interpretive review of conceptual frameworks and research models that inform Australia’s agricultural vulnerability to climate change. Environ. Model. Softw. 2011, 26, 113–123. [Google Scholar] [CrossRef]
- Hardaker, J.B.; Huirne, R.B.M.; Anderson, J.R. Coping with Risk in Agriculture, 2nd ed.; CABI Publishing: Wallingford, UK, 2004. [Google Scholar]
- Ladanyi, M. Risk methods and their applications in agriculture. Appl. Ecol. Environ. Res. 2007, 6, 147–164. [Google Scholar] [CrossRef]
- Helbing, D. Globally networked risks and how to respond. Nature 2013, 497, 51–59. [Google Scholar] [CrossRef] [PubMed]
- Soboh, R.; Lansink, A.O.; Giesen, G.W.J.; Van Dijk, G.V. Performance measurement of the agricultural marketing cooperatives: The gap between theory and practice. Appl. Econ. Perspect. Policy 2009, 31, 446–469. [Google Scholar] [CrossRef]
- Luo, H.; Zhang, W. Performance evaluation of China’s agricultural listed companies based on DEA model. Asian Agric. Res. 2012, 4, 1–12. [Google Scholar]
- Varga, J.; Sipiczki, Z. The financing of the agricultural enterprises in Hungary between 2008 and 2011. Procedia Econ. Finance 2015, 30, 923–931. [Google Scholar] [CrossRef]
- Gorb, O.; Yasnolob, I.; Protsiuk, N. Organizational economic mechanism of management of food industry enterprises competitiveness. Ann. Agrar. Sci. 2016, 14, 191–195. [Google Scholar] [CrossRef]
- Cui, L.; Wu, K.; Tseng, M. Exploring a novel agricultural subsidy model with sustainable development: A Chinese agribusiness in Liaoning province. Sustainability 2017, 9, 19. [Google Scholar] [CrossRef]
- Shi, B.; Meng, B.; Yang, H.; Wang, J.; Shi, W. A novel approach for reducing attributes and its application to small enterprise financing ability evaluation. Complexity 2018, 2018, 1–17. [Google Scholar] [CrossRef]
- Wang, B.; Wang, X.; Wang, J. Construction and empirical analysis of agricultural science and technology enterprises investment risk evaluation index system. IERI Procedia 2012, 2, 485–491. [Google Scholar] [CrossRef]
- Kelkar, U.; Narula, K.K.; Sharma, V.P.; Chandna, U. Vulnerability and adaptation to climate variability and water stress in Uttarakhand State, India. Global Environ. Change: Hum. Policy Dimens. 2008, 18, 564–574. [Google Scholar] [CrossRef]
- Huang, Z.; Chen, L. Coping behavior with exchange rate risk of foreign-related enterprises: a survey of 130 agricultural firms. J. Int. Trade 2011, 1, 148–157. [Google Scholar]
- Wang, Z.; Wang, J.; Wang, J. Risk assessment of agricultural drought disaster in southern China. Discrete Dyn. Nat. Soc. 2015, 2015, 1–8. [Google Scholar] [CrossRef]
- Patton, A.J. A review of copula models for economic time series. J. Multivar. Anal. 2012, 110, 4–18. [Google Scholar] [CrossRef]
- Aloui, R.; Aissa, M.S.B.; Nguyen, D.K. Global financial crisis, extreme interdependences, and contagion effects: The role of economic structure? J. Bank. Finance 2011, 35, 130–141. [Google Scholar] [CrossRef]
- Hu, C.; Chen, X.; Hua, Y. Extreme risk spillover effect between banking and real estate in China. J. Residuals Sci. Technol. 2016, 13, 1–9. [Google Scholar]
- Gower, J.C.; Ross, G. Minimum Spanning trees and single linkage cluster analysis. Appl. Stat. 1969, 18, 54–64. [Google Scholar] [CrossRef]
- Hobbs, J.; Schaupp, L.C.; Gingrich, J. Terrorism, militarism, and stock returns. J. Financial Crime 2016, 23, 70–86. [Google Scholar] [CrossRef]
- Bourdeaubrien, M.; Kryzanowski, L. The impact of natural disasters on the stock returns and volatilities of local firms. Quart. Rev. Econom. Finance 2017, 63, 259–270. [Google Scholar] [CrossRef]
- Valizadeh, P.; Karali, B.; Ferreira, S. Ripple effects of the 2011 Japan earthquake on international stock markets. Res. Int. Bus. Finance 2017, 41, 556–576. [Google Scholar] [CrossRef]
- Harwood, J.L.; Heifner, R.G.; Coble, K.H.; Perry, J.E.; Agapi, S. Managing Risk in Farming: Concepts, Research, and Analysis; Agricultural Economic Report No. 774; United States Department of Agriculture, Economic Research Service (AER-774): Washington, DC, USA, 1999; p. 130.
- Lopez-Nicolas, A.; Pulido-Velazquez, M.; Macian-Sorribes, H. Economic risk assessment of drought impacts on irrigated agriculture. J. Hydrol. 2017, 550, 580–589. [Google Scholar] [CrossRef]
- Jacobus, D. New paradigm of managing risks: risk and control self-assessment. Agric. Agric. Sci. Precedia 2015, 3, 32–34. [Google Scholar] [CrossRef]
- Mu, P.; Zheng, X. Research on the tail dependence of agriculture listed companies. J. Agric. Sci. 2010, 2, 111–118. [Google Scholar] [CrossRef]
- You, J.; Ando, T. A statistical modelling methodology for the analysis of term structure of credit risk and its dependency. Expert Syst. Appl. 2013, 40, 4897–4905. [Google Scholar] [CrossRef]
- Embrechts, P.; McNeil, A.; Straumann, D. Correlation and dependence in risk management: properties and pitfalls. In Risk Management: Value at Risk and Beyond; Dempster, D.H.M., Ed.; Cambridge University Press: New York, NY, USA, 2002; Volume 7, pp. 176–223. [Google Scholar]
- Patton, A.J. On the out-of-sample importance of skewness and asymmetric dependence for asset allocation. J. Financial Econom. 2004, 2, 130–168. [Google Scholar] [CrossRef]
- Polanski, A.; Stoja, E.; Zhang, R. Multidimensional risk and risk dependence. J. Bank. Finance 2013, 37, 3286–3294. [Google Scholar] [CrossRef]
- Longin, F.; Solnik, B. Extreme correlation of international equity markets. J. Finance 2001, 56, 649–676. [Google Scholar] [CrossRef]
- Hartmann, P.; Straetmans, S.; De Vries, C.G. Asset market linkages in crisis periods. Rev. Econ. Stat. 2004, 86, 313–326. [Google Scholar] [CrossRef]
- Xu, J.; Yu, F. The risk dependence structure between the futures and spot market-a mixture copula approach. In Proceedings of the Sixth International Conference on Business Intelligence and Financial Engineering, Hangzhou, China, 14–16 November 2013; pp. 254–257. [Google Scholar]
- Schweitzer, F.; Fagiolo, G.; Sornette, D.; Vega-Redondo, F.; Vespignani, A.; White, D.R. Economic networks: The new challenges. Science 2009, 325, 422–425. [Google Scholar] [PubMed]
- Jin, X.; Wu, Y.; Jin, C. Research on stock network modeling and risk propagation based on complex network analysis. In Proceedings of the 49th Hawaii International Conference on IEEE (HICSS 2016), Kauai, HI, USA, 05–08 January 2016; pp. 1188–1194. [Google Scholar]
- Mantegna, R.N. Hierarchical structure in financial markets. Eur. Phys. J B 1999, 11, 193–197. [Google Scholar] [CrossRef]
- Brida, J.G.; Risso, W.A. Multidimensional Minimal Spanning Tree: the Dow Jones case. Physica A-Stat. Mech. Appl. 2008, 387, 5205–5210. [Google Scholar] [CrossRef]
- Lee, J.; Youn, J.; Chang, W. Intraday volatility and network topological properties in the Korean stock market. Physica A-Stat. Mech. Appl. 2012, 391, 1354–1360. [Google Scholar] [CrossRef]
- Pericoli, M.; Sbracia, M. A primer on financial contagion. J. Econ. Surv. 2003, 17, 571–608. [Google Scholar] [CrossRef]
- Seth, N.; Sighania, M. Financial market contagion: selective review of reviews. Qual. Res. Financial Mark. 2017, 9, 391–408. [Google Scholar] [CrossRef]
- Nazlioglu, S. World oil and agricultural commodity prices: evidence from nonlinear causality. Energy Policy 2011, 39, 2935–2943. [Google Scholar] [CrossRef]
- Balkema, A.A.; De Haan, L. Residual life time at great age. Ann. Probab. 1974, 2, 792–804. [Google Scholar] [CrossRef]
- Pickands, J., III. Statistical inference using extreme order statistics. Ann. Stat 1975, 3, 119–131. [Google Scholar]
- Patton, A.J. Estimation of multivariate models for time series of possibly different lengths. J. Appl. Econom. 2006, 21, 147–173. [Google Scholar] [CrossRef]
- Prim, R.C. Shortest connection networks and some generalizations. Bell Labs Tech. J. 1957, 36, 1389–1401. [Google Scholar] [CrossRef]
- Chesney, M.; Reshetar, G.; Karaman, M. The impact of terrorism on financial markets: An empirical study. J. Bank. Finance 2011, 35, 253–267. [Google Scholar] [CrossRef]
- Worthington, A.C.; Valadkhani, A. Measuring the impact of natural disasters on capital markets: An empirical application using intervention analysis. Appl. Econom. 2004, 36, 2177–2186. [Google Scholar] [CrossRef]
- Wang, L.; Kutan, A.M. The impact of natural disasters on stock markets: Evidence from Japan and the US. Comp. Econom. Stud. 2013, 55, 672–686. [Google Scholar] [CrossRef]
- Gao, B.; Chan, W.; Li, H. On the increasing inequality in size distribution of China’s listed companies. China Econom. Rev. 2015, 36, 25–41. [Google Scholar] [CrossRef]
- Xing, M.; Chen, J.; Pan, F.; Tian, L. Strategies for accelerating technological innovation of agricultural enterprises in Hubei Province, taking the successful experiences of technological innovation of Yuan Long-ping High-Tech Agriculture Co.,Ltd as a reference. Hubei Agric. Sci. 2013, 52, 5950–5953. [Google Scholar]


© 2018 by the authors. Licensee MDPI, Basel, Switzerland. This article is an open access article distributed under the terms and conditions of the Creative Commons Attribution (CC BY) license (http://creativecommons.org/licenses/by/4.0/).