Metropolitan Innovation and Sustainability in China—A Double Lens Perspective on Regional Development

Abstract
:1. Introduction
2. Literature Review and Research Background
2.1. The Regional Innovation System
2.2. Cities as Important Elements to Be Studied in Terms of Innovation and Sustainability
2.2.1. City as the Centre of a Regional Innovation System
2.2.2. Regional Based Sustainability Studies
2.2.3. China Related Metropolitan Innovation and Sustainability Overview
2.3. Overall Picture on China’s Innovation in Regions: Which Kinds of Factors Are Important?
- Major concerns on regional innovation (particularly city based) are more focused on uniforms of innovation pattern, or similarities, rather than diversities of innovation, or dissimilarities, together with their development background;
- Major concerns on sustainability study are more focused on overall macro level statues, such as natural resource, social capital, as well as human resource or human capital as rather abstract measures, rather than more detailed micro level investigations toward city level innovation activities in production side;
- More importantly, major concerns on sustainability studies are rather separated from knowledge creation and dynamic innovation movement, although such link does exist and should be highly relevant. Studies including such link (as research by Yu, et al. [51]) are using less direct information on city based economic and innovation.
3. Materials and Methods
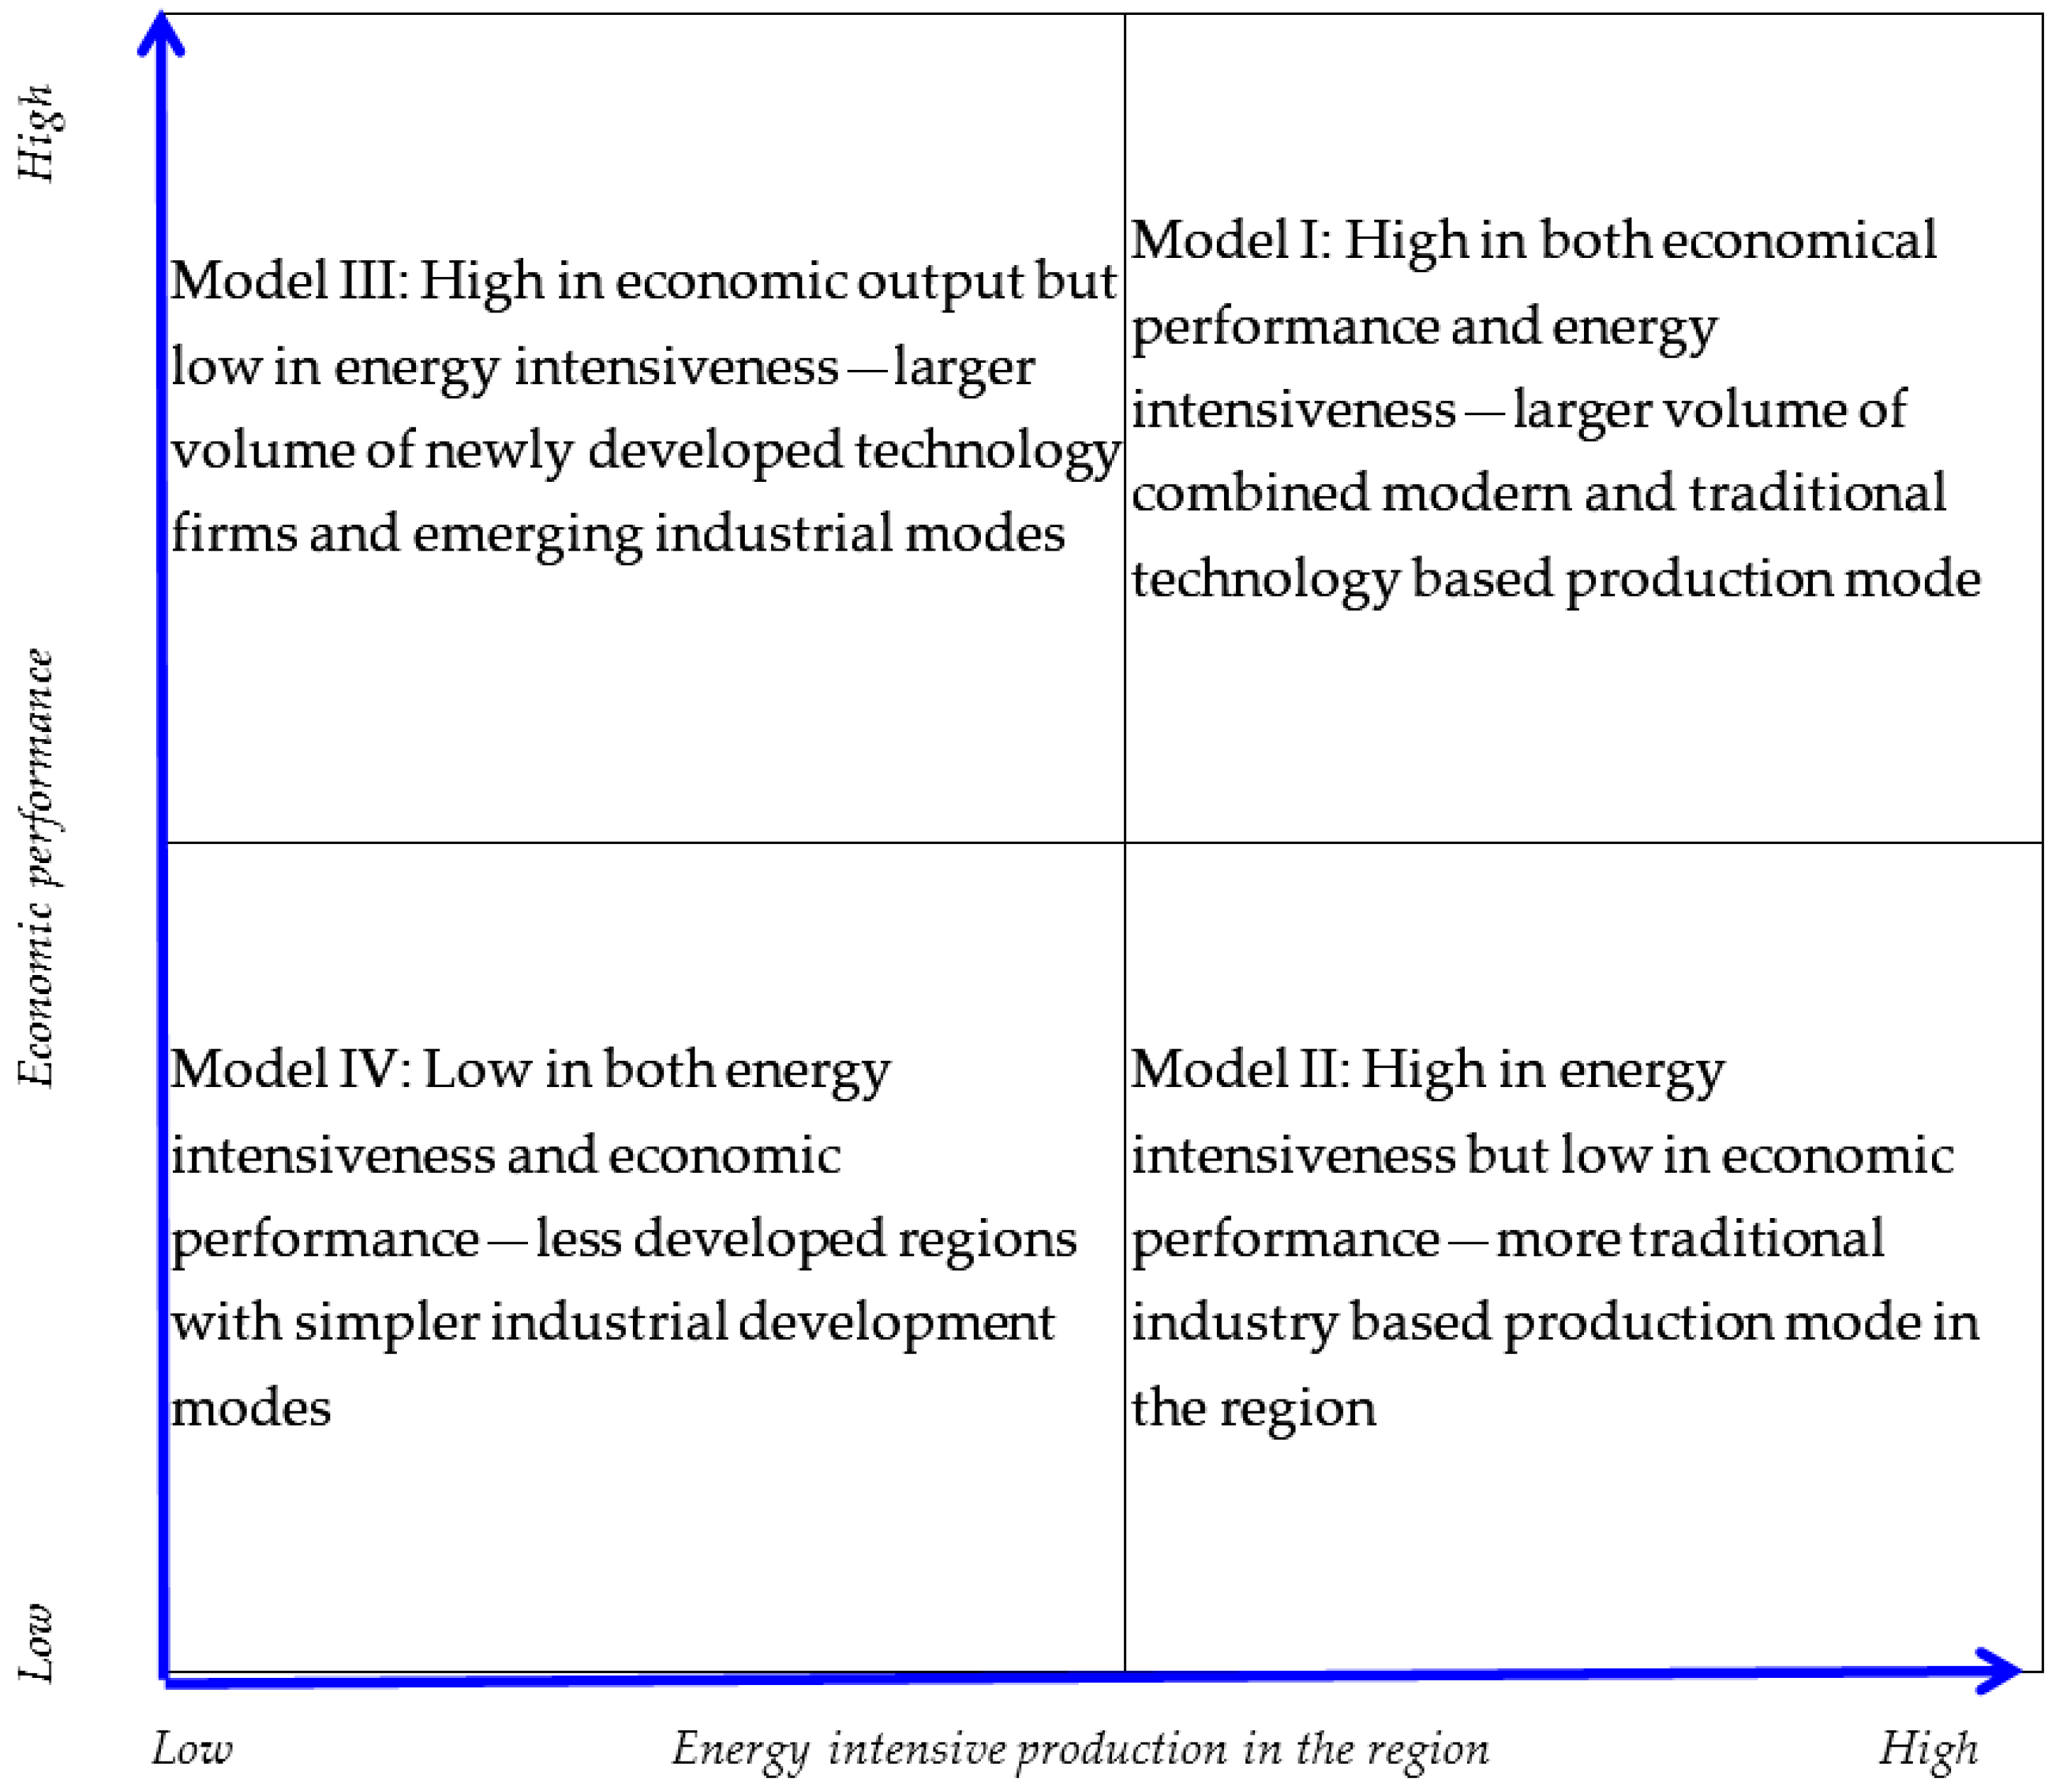
3.1. Lens I: An Investigation Framework on Economic Development and Energy Intensiveness
3.2. Lens II: An Investigation Framework on Mode of Innovation—Current vs. Potential Characters
3.2.1. Current Economic and Innovation—Relative Measures
3.2.2. Potential Economic Development Impact of Human Resource and Knowledge Creation Capacity
3.2.3. Efficiency and Other Enabling Factors
3.2.4. Influence of Industrial Traditions
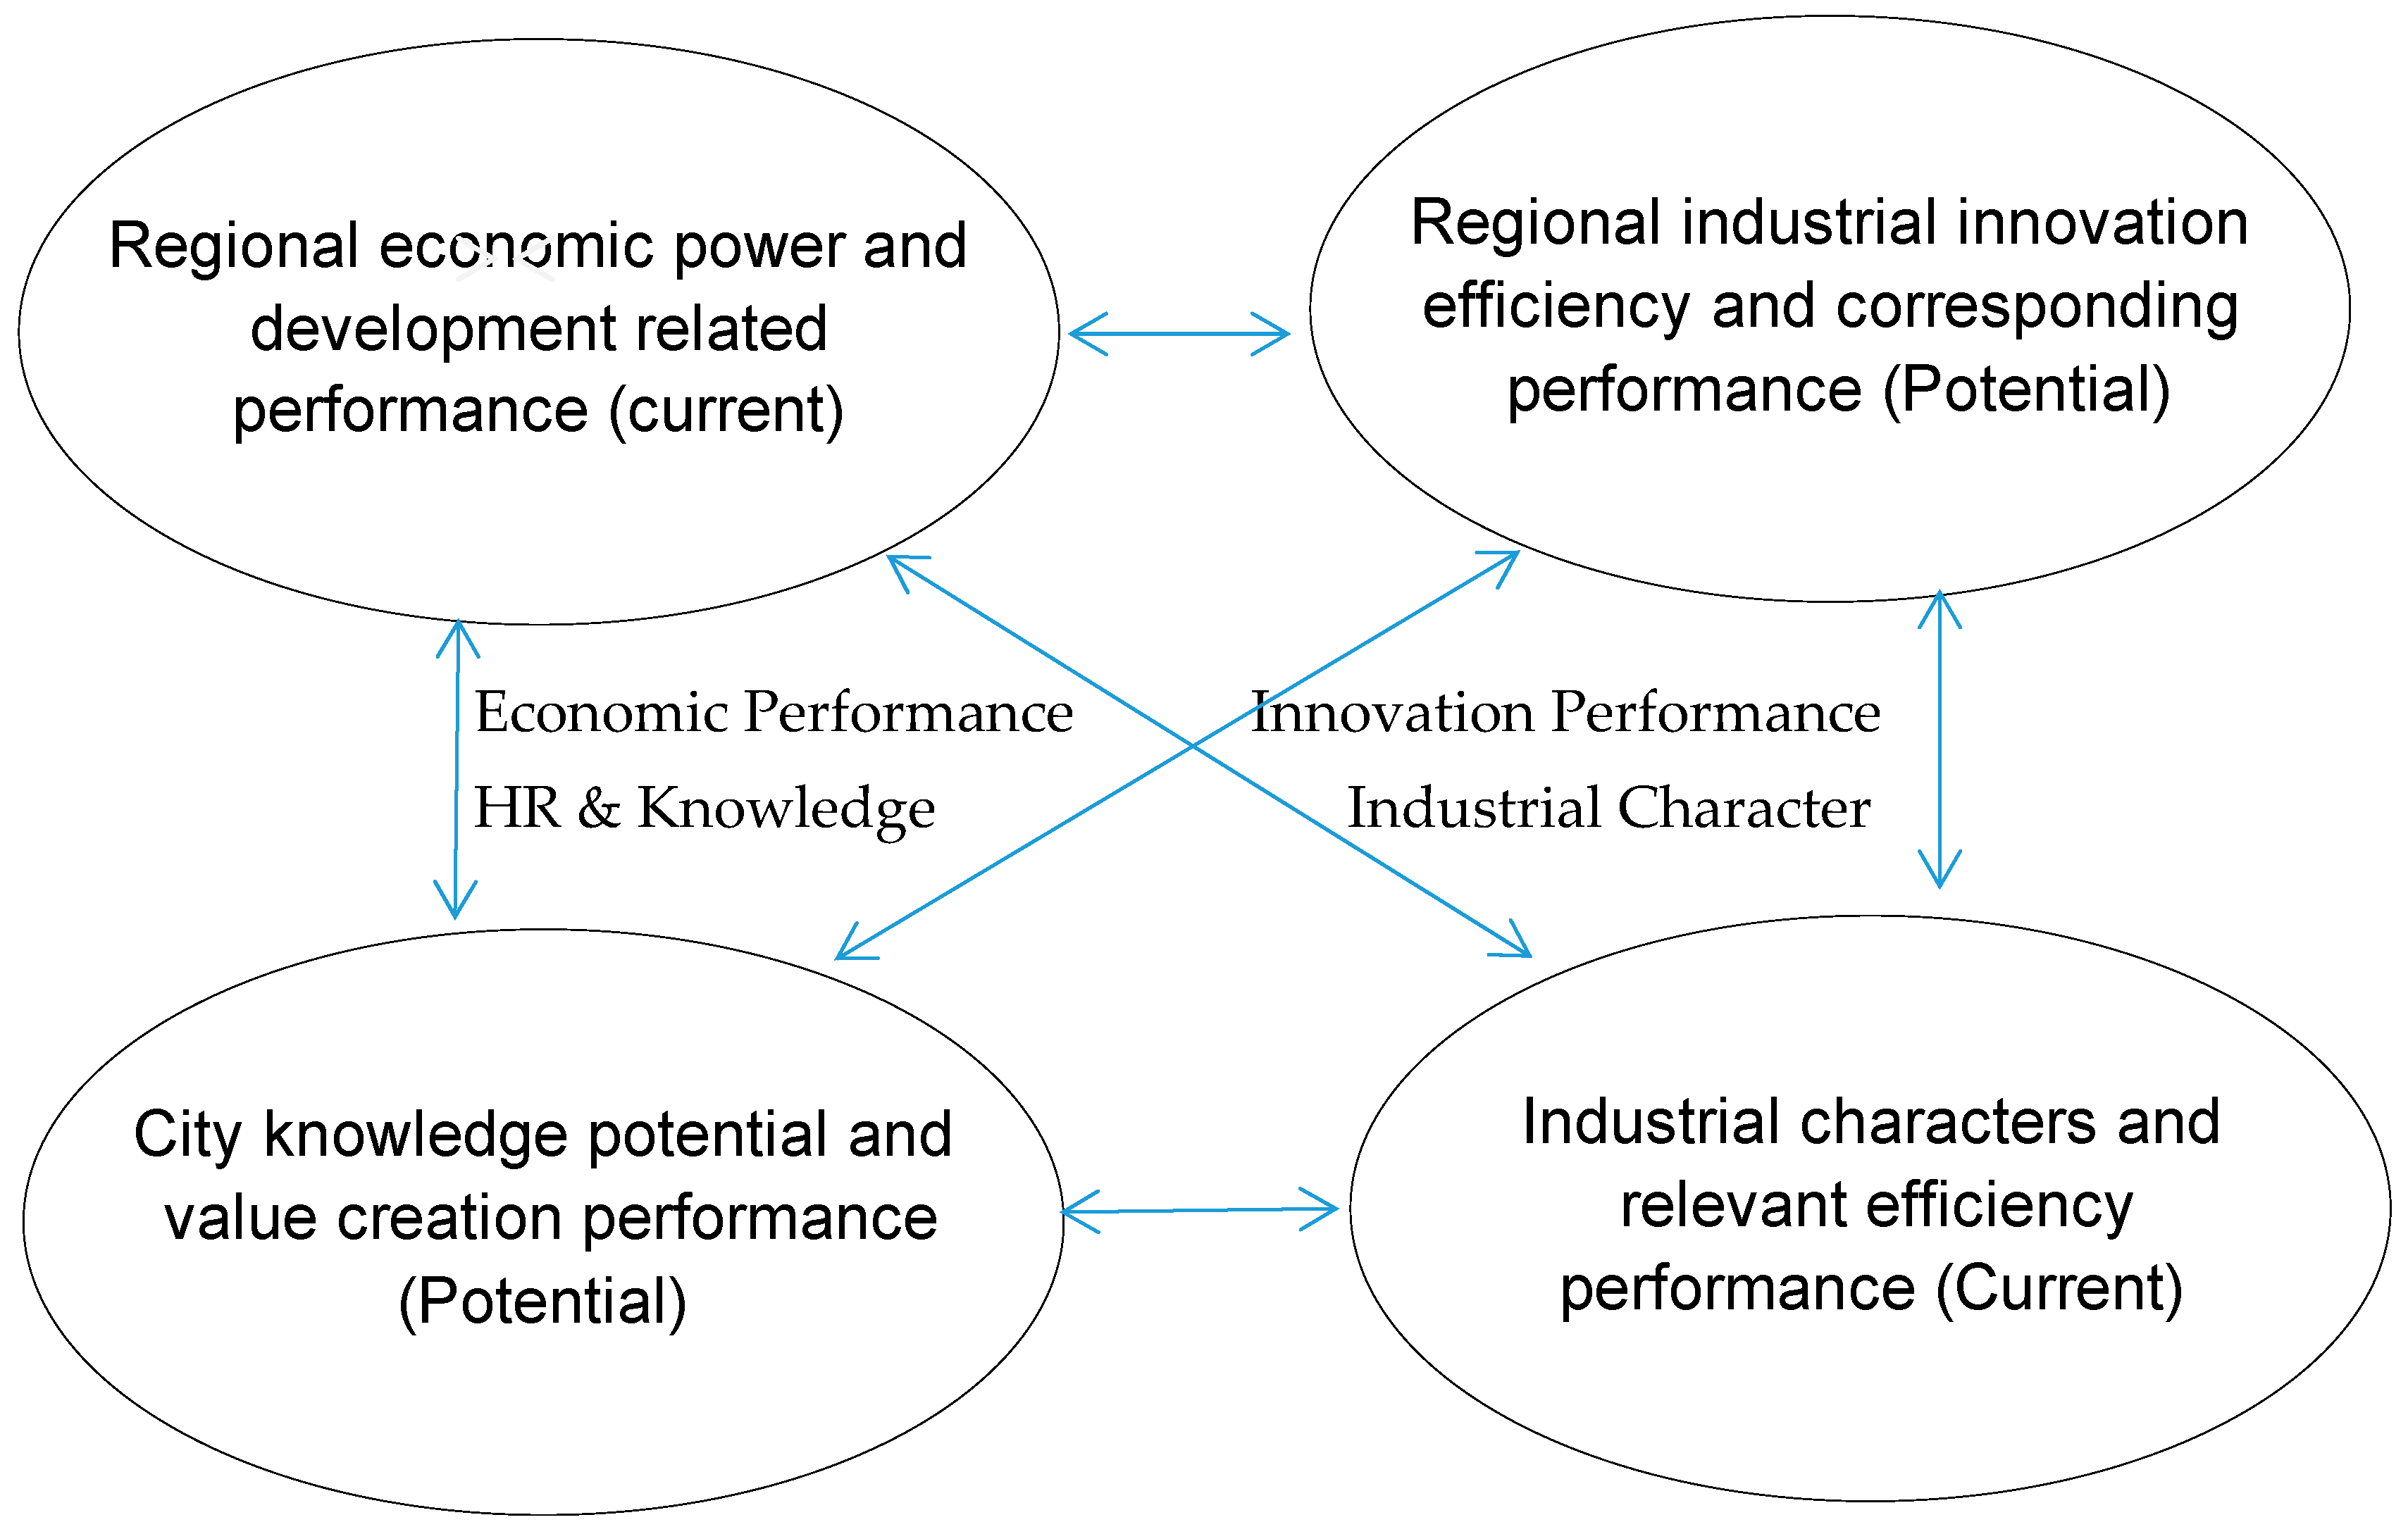
3.3. Research Framework
3.4. Methodology Strategies
- Based on the above literature review, three kinds of indicators are collected in this study (refer to Table 1), which include accessible data resources.
- Important principles are considered for further processing the related data from those accessible data resources, namely, (1) Principle of contents: Indicators should clearly reflect research demand on the nature of the variables described in Section 3.2.1, Section 3.2.2, Section 3.2.3 and Section 3.2.4; (2) Principle of comparability: indicators should be comparable among chosen sample cities, therefore, only relative values of indicators, e.g., proportion of indicators, are used; (3) Principle of availability: data should be available for the designed dimensions (for example, regarding to Efficiency on R&D activities, since patent data and number of science & technological personnel are available in statistical yearbooks in China, we use Granted Patents Per S&T Personnel).
- Principle Factor Analysis technique is applied to this study (based on SPSS 20.0). This kind of technique can best abstract the most representative indicators among all selected ones, effectively decreasing numbers of investigating dimensions. The major character of such technique is to capture the information of those indicators with the highest level of differences among samples, as factor 1 and indicators with next higher level of differences, as factor 2 and so on. In this way, fewer factors can successfully replace original multiple indicators, while still maintaining original information on differences of original indicators among samples and achieving reasonable dimension reduction. The newly formed factors can be further defined according to those original indicators with higher correlations with those factors. When factors are generated from such data processing, nature of samples can be found according to scores of related sample on each corresponding factors. Such techniques can be best fitted to the research purpose in this study, abstracting meaningful factors on innovation and sustainability, from original indicators and positioning those sample cities according to their values on each of the abstracted factors.
4. Data and Results
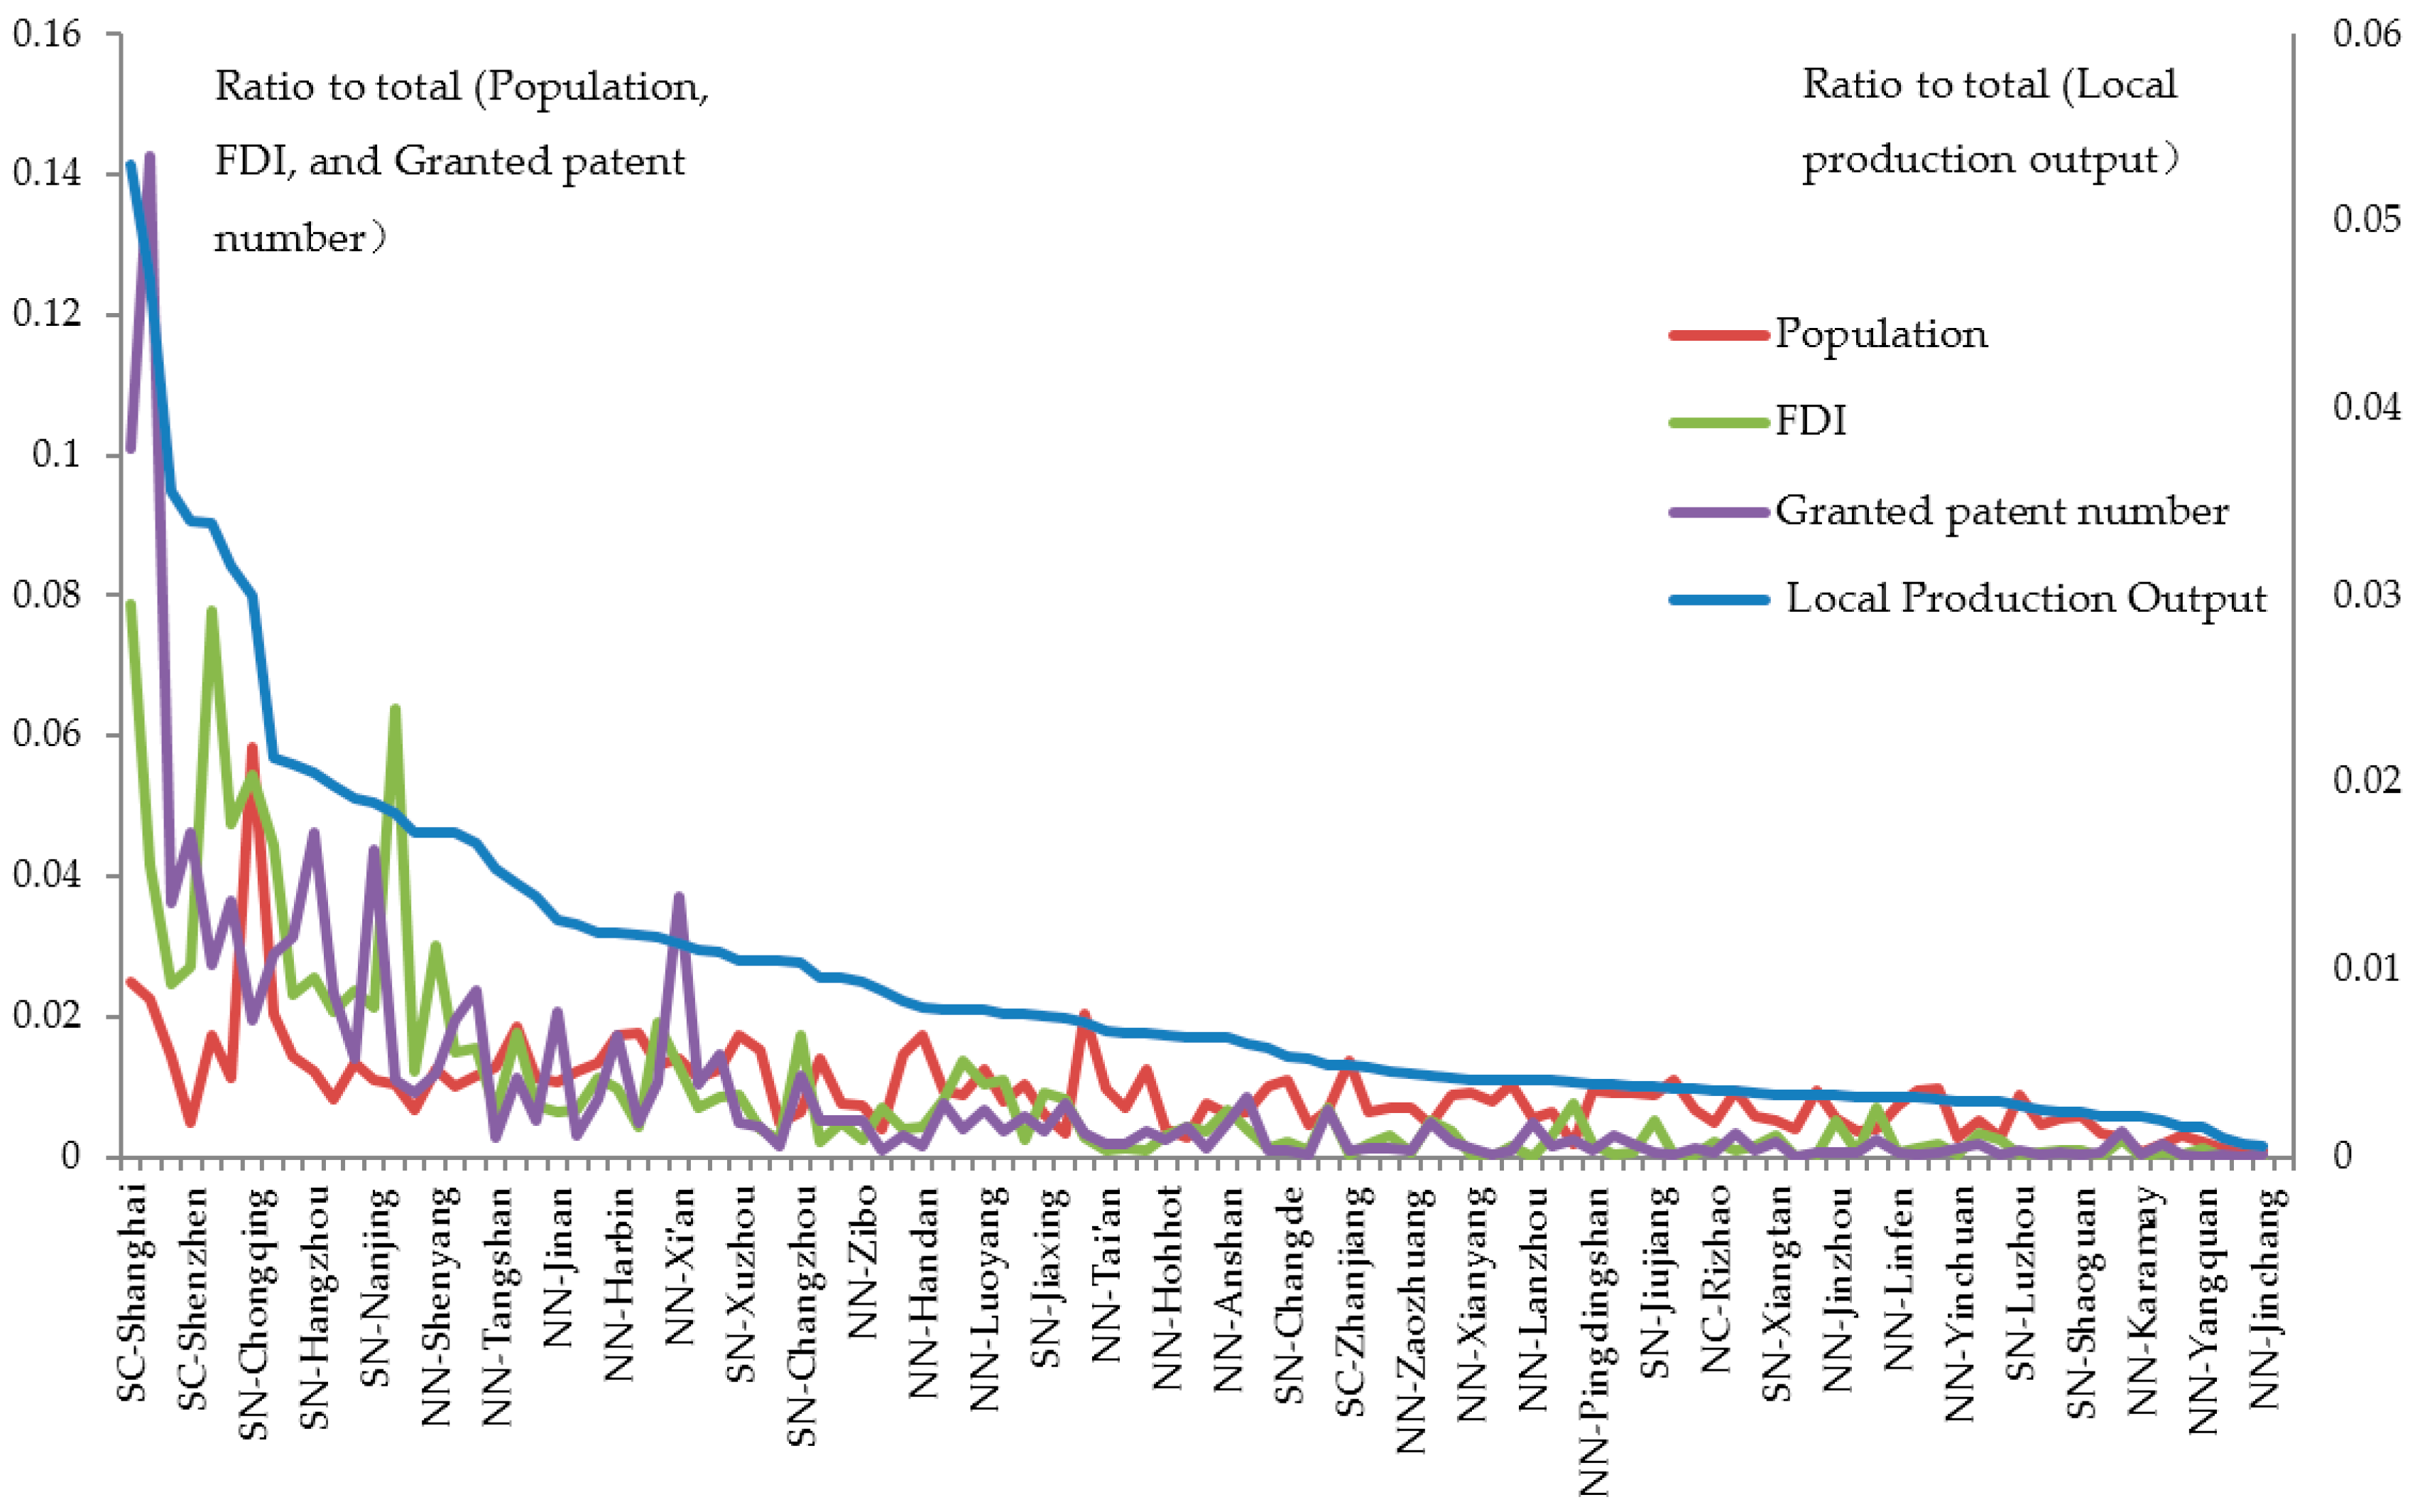
4.1. Investigation through Lens I
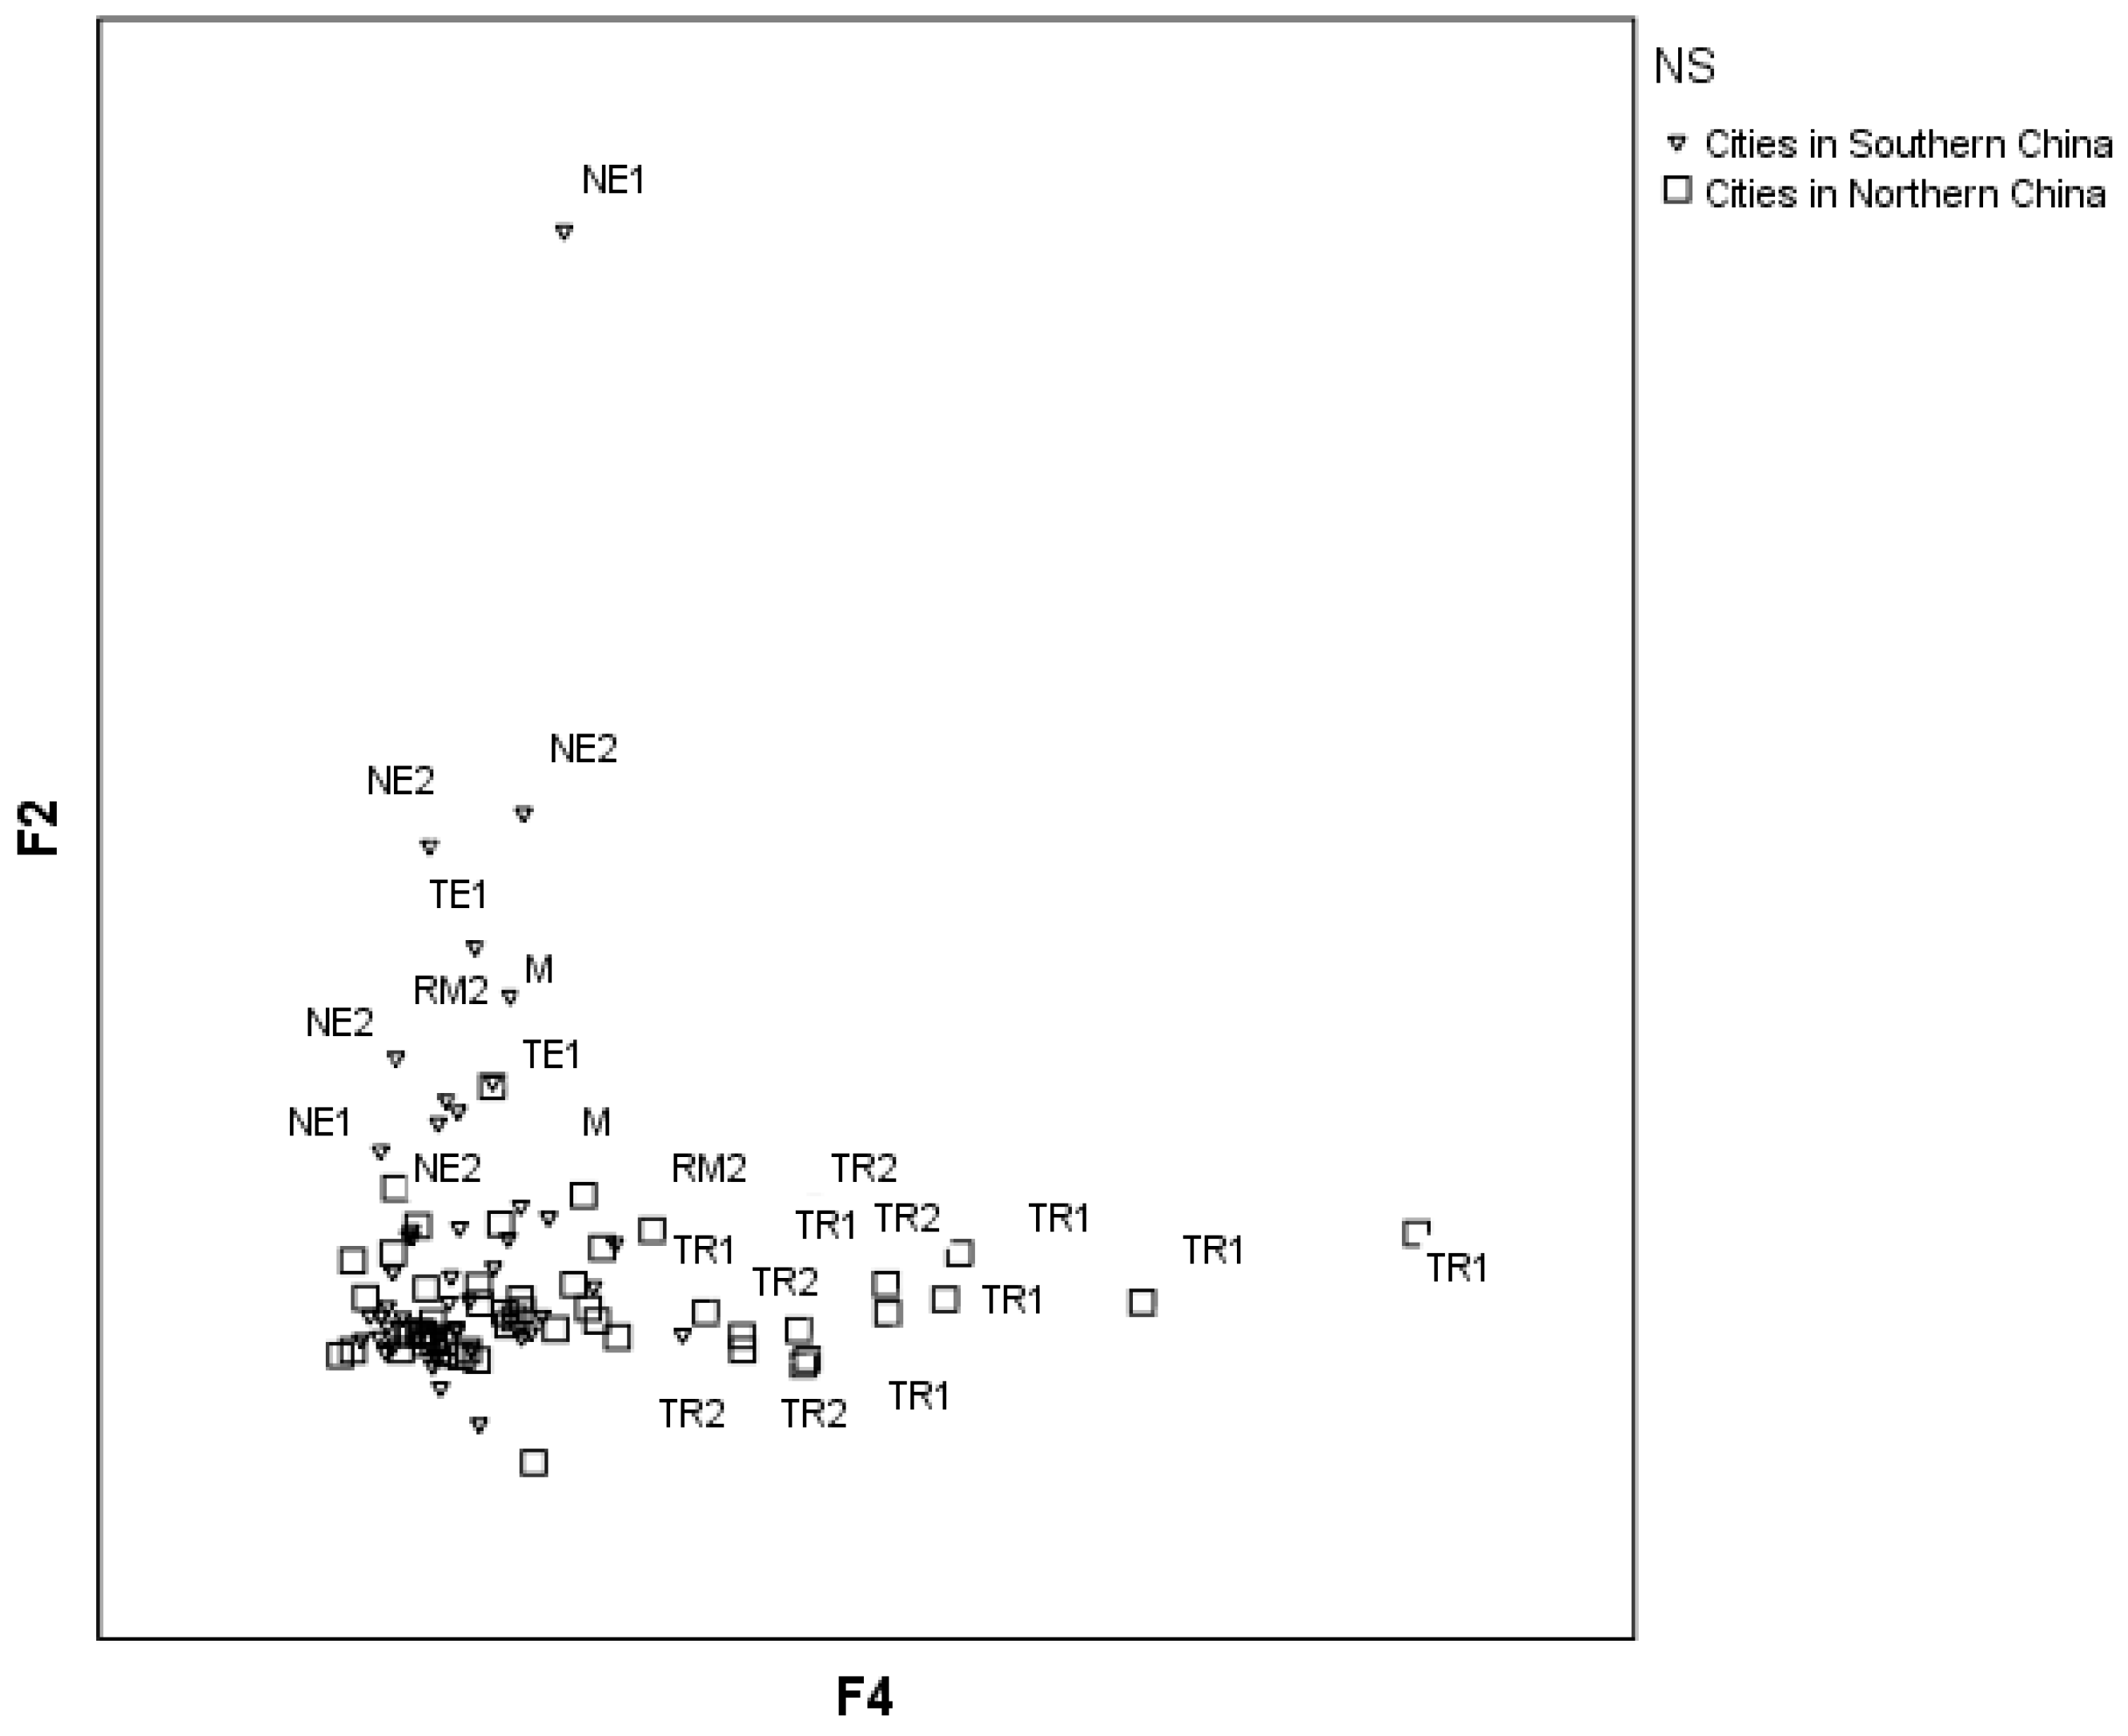
4.2. Investigation through Lens II
5. Discussions
6. Conclusions
Acknowledgments
Author Contributions
Conflicts of Interest
Appendix A

| City | Local Production Output | Population | FDI | Granted Patent |
|---|---|---|---|---|
| Shanghai | 0.05300 | 0.02487 | 0.07870 | 0.10085 |
| Beijing | 0.04696 | 0.02261 | 0.04168 | 0.14250 |
| Guangzhou | 0.03559 | 0.01433 | 0.02458 | 0.03614 |
| Shenzhen | 0.03401 | 0.00501 | 0.02710 | 0.04627 |
| Tianjin | 0.03386 | 0.01731 | 0.07782 | 0.02749 |
| Suzhou | 0.03155 | 0.01129 | 0.04750 | 0.03660 |
| Chongqing | 0.02996 | 0.05827 | 0.05459 | 0.01956 |
| Chengdu | 0.02137 | 0.02045 | 0.04452 | 0.02882 |
| Wuhan | 0.02102 | 0.01432 | 0.02303 | 0.03138 |
| Hangzhou | 0.02049 | 0.01221 | 0.02571 | 0.04623 |
| Wuxi | 0.01988 | 0.00819 | 0.02078 | 0.02357 |
| Qingdao | 0.01918 | 0.01341 | 0.02384 | 0.01401 |
| Nanjing | 0.01891 | 0.01113 | 0.02141 | 0.04396 |
| Dalian | 0.01839 | 0.01029 | 0.06401 | 0.01086 |
| Foshan | 0.01737 | 0.00658 | 0.01218 | 0.00915 |
| Shenyang | 0.01734 | 0.01263 | 0.03008 | 0.01189 |
| Ningbo | 0.01729 | 0.01007 | 0.01478 | 0.01958 |
| Changsha | 0.01681 | 0.01151 | 0.01543 | 0.02366 |
| Tangshan | 0.01539 | 0.01293 | 0.00638 | 0.00264 |
| Zhengzhou | 0.01457 | 0.01869 | 0.01777 | 0.01134 |
| Yantai | 0.01387 | 0.01133 | 0.00731 | 0.00528 |
| Jinan | 0.01262 | 0.01062 | 0.00632 | 0.02064 |
| Quanzhou | 0.01241 | 0.01208 | 0.00684 | 0.00310 |
| Nantong | 0.01197 | 0.01334 | 0.01143 | 0.00813 |
| Harbin | 0.01195 | 0.01732 | 0.00985 | 0.01742 |
| Shijiazhang | 0.01182 | 0.01752 | 0.00440 | 0.00500 |
| Changchun | 0.01170 | 0.01319 | 0.01908 | 0.01056 |
| Xi’an | 0.01147 | 0.01387 | 0.01284 | 0.03707 |
| Fuzhou | 0.01108 | 0.01142 | 0.00694 | 0.01026 |
| Hefei | 0.01094 | 0.01238 | 0.00858 | 0.01465 |
| Xuzhou | 0.01055 | 0.01726 | 0.00881 | 0.00494 |
| Weifang | 0.01054 | 0.01532 | 0.00398 | 0.00415 |
| Daqing | 0.01051 | 0.00491 | 0.00261 | 0.00155 |
| Changzhou | 0.01043 | 0.00636 | 0.01742 | 0.01173 |
| Wenzhou | 0.00964 | 0.01395 | 0.00206 | 0.00516 |
| Shaoxing | 0.00960 | 0.00768 | 0.00494 | 0.00524 |
| Zibo | 0.00934 | 0.00738 | 0.00259 | 0.00518 |
| Baotou | 0.00895 | 0.00390 | 0.00707 | 0.00103 |
| Jining | 0.00838 | 0.01476 | 0.00399 | 0.00310 |
| Handan | 0.00794 | 0.01731 | 0.00415 | 0.00158 |
| Kunming | 0.00791 | 0.00947 | 0.00823 | 0.00757 |
| Nanchang | 0.00788 | 0.00885 | 0.01368 | 0.00410 |
| Luoyang | 0.00783 | 0.01237 | 0.01033 | 0.00664 |
| Yangzhou | 0.00770 | 0.00799 | 0.01108 | 0.00376 |
| Taizhou | 0.00765 | 0.01030 | 0.00246 | 0.00585 |
| Jiaxing | 0.00759 | 0.00600 | 0.00923 | 0.00362 |
| Xiamen | 0.00740 | 0.00333 | 0.00826 | 0.00773 |
| Baoding | 0.00715 | 0.02043 | 0.00285 | 0.00328 |
| Tai’an | 0.00669 | 0.00974 | 0.00088 | 0.00183 |
| Yichang | 0.00659 | 0.00695 | 0.00119 | 0.00175 |
| Nanning | 0.00657 | 0.01244 | 0.00082 | 0.00364 |
| Hohhot | 0.00650 | 0.00401 | 0.00320 | 0.00234 |
| Zhongshan | 0.00641 | 0.00265 | 0.00436 | 0.00416 |
| Jilin | 0.00638 | 0.00751 | 0.00367 | 0.00116 |
| Anshan | 0.00638 | 0.00611 | 0.00661 | 0.00500 |
| Taiyuan | 0.00607 | 0.00638 | 0.00405 | 0.00862 |
| Yueyang | 0.00578 | 0.00999 | 0.00118 | 0.00097 |
| Changde | 0.00535 | 0.01096 | 0.00213 | 0.00083 |
| Urumchi | 0.00526 | 0.00449 | 0.00100 | 0.00024 |
| Wuhu | 0.00492 | 0.00668 | 0.00694 | 0.00667 |
| Zhanjiang | 0.00489 | 0.01369 | 0.00045 | 0.00102 |
| Liuzhou | 0.00478 | 0.00649 | 0.00184 | 0.00111 |
| Zhuzhou | 0.00463 | 0.00690 | 0.00302 | 0.00135 |
| Zaozhuang | 0.00447 | 0.00688 | 0.00074 | 0.00106 |
| Huzhou | 0.00437 | 0.00456 | 0.00532 | 0.00493 |
| Lianyungang | 0.00421 | 0.00891 | 0.00380 | 0.00220 |
| Xianyang | 0.00413 | 0.00920 | 0.00037 | 0.00127 |
| Chifeng | 0.00412 | 0.00804 | 0.00006 | 0.00028 |
| Anyang | 0.00411 | 0.01034 | 0.00164 | 0.00091 |
| Lanzhou | 0.00411 | 0.00560 | 0.00004 | 0.00478 |
| Jiaozuo | 0.00407 | 0.00640 | 0.00311 | 0.00169 |
| Zhuhai | 0.00395 | 0.00186 | 0.00750 | 0.00255 |
| Pingdingshan | 0.00393 | 0.00951 | 0.00194 | 0.00094 |
| Guilin | 0.00390 | 0.00910 | 0.00022 | 0.00317 |
| Shantou | 0.00374 | 0.00929 | 0.00068 | 0.00188 |
| Jiujiang | 0.00373 | 0.00886 | 0.00512 | 0.00068 |
| Qujing | 0.00368 | 0.01111 | 0.00021 | 0.00029 |
| Baoji | 0.00361 | 0.00669 | 0.00031 | 0.00116 |
| Rizhao | 0.00355 | 0.00502 | 0.00218 | 0.00071 |
| Mianyang | 0.00354 | 0.00951 | 0.00109 | 0.00328 |
| Changzhi | 0.00349 | 0.00586 | 0.00145 | 0.00094 |
| Xiangtan | 0.00337 | 0.00509 | 0.00304 | 0.00211 |
| Yan’an | 0.00334 | 0.00410 | 0.00010 | 0.00017 |
| Yibin | 0.00326 | 0.00953 | 0.00024 | 0.00064 |
| Jinzhou | 0.00326 | 0.00537 | 0.00520 | 0.00079 |
| Fushun | 0.00325 | 0.00382 | 0.00065 | 0.00059 |
| Ma onshan | 0.00324 | 0.00398 | 0.00694 | 0.00255 |
| Linfen | 0.00321 | 0.00741 | 0.00071 | 0.00067 |
| Kaifeng | 0.00317 | 0.00949 | 0.00128 | 0.00049 |
| Qiqihaer | 0.00309 | 0.00974 | 0.00181 | 0.00069 |
| Yinchuan | 0.00302 | 0.00291 | 0.00036 | 0.00121 |
| Qinhuangdao | 0.00299 | 0.00508 | 0.00325 | 0.00181 |
| Benxi | 0.00292 | 0.00267 | 0.00239 | 0.00029 |
| Luzhou | 0.00271 | 0.00881 | 0.00027 | 0.00095 |
| Mudanjiang | 0.00258 | 0.00452 | 0.00068 | 0.00034 |
| Datong | 0.00245 | 0.00557 | 0.00109 | 0.00054 |
| Shaoguan | 0.00238 | 0.00569 | 0.00089 | 0.00034 |
| Xining | 0.00224 | 0.00346 | 0.00015 | 0.00065 |
| Haikou | 0.00215 | 0.00282 | 0.00235 | 0.00365 |
| Karamay | 0.00213 | 0.00066 | 0.00009 | 0.00033 |
| Panzhihua | 0.00194 | 0.00195 | 0.00054 | 0.00191 |
| Beihai | 0.00166 | 0.00293 | 0.00027 | 0.00030 |
| Yangquan | 0.00158 | 0.00230 | 0.00122 | 0.00016 |
| Shizuishan | 0.00108 | 0.00129 | 0.00000 | 0.00027 |
| Tongchuan | 0.00072 | 0.00149 | 0.00016 | 0.00006 |
| Jinchang | 0.00064 | 0.00081 | 0.00000 | 0.00020 |
References
- Acs, Z.J.; Anselin, L.; Varga, A. Patents and innovation counts as measures of regional production of new knowledge. Res. Policy 2002, 31, 1069–1085. [Google Scholar] [CrossRef]
- Malecki, E.J. Science, technology, and regional economic development: Review and prospects. Res. Policy 1981, 10, 312–334. [Google Scholar] [CrossRef]
- Sweeney, G.P. Innovation, Entrepreneurs, and Regional Development; Burns & Oates: London, UK, 1987. [Google Scholar]
- Hall, P.; Markusen, A. High technology and regional-urban policy. In Silicon Landscapes; Allen and Unwin: Crows Nest, Australia, 1985; pp. 144–151. [Google Scholar]
- Stöhr, W.B. Regional innovation complexes. Pap. Reg. Sci. 1986, 59, 29–44. [Google Scholar] [CrossRef]
- Varga, A. Time-space patterns of US innovation: Stability or change? In Innovation, Networks and Localities; Fischer, M.M., Suarez-Villa, L., Steiner, M., Eds.; Springer: Berlin/Heidelberg, Germany, 1999; pp. 215–234. ISBN 978-3-642-63631-8. [Google Scholar]
- Hilpert, U.; Hickie, D.; Drüke, H. Old and traditional industrial regions on the archipelago Europe—Governmental systems and regionalization of innovation. In Regionalisation of Globalised Innovation: Locations for Advanced Industrial Development and Disparities in Participation; Hilpert, U., Ed.; Routledge: New York, NY, USA, 2003; Volume 37, ISBN 0-203-44797-2. [Google Scholar]
- Caniëls, M.C. Knowledge Spillovers and Economic Growth: Regional Growth Differentials across Europe; Edward Elgar Publishing: Cheltenham, UK, 2000. [Google Scholar]
- Shen, L.; Cheng, S.; Gunson, A.J.; Wan, H. Urbanization, sustainability and the utilization of energy and mineral resources in China. Cities 2005, 22, 287–302. [Google Scholar] [CrossRef]
- Sun, X.; Liu, X.S.; Li, F.; Tao, Y. Comprehensive evaluation of sustainable development for different scale cities in China. Acta Ecol. Sin. 2016, 36, 5590–5600. [Google Scholar]
- Bell, G.G. Clusters, Networks and Firm Innovativeness. Strateg. Manag. J. 2005, 26, 287–295. [Google Scholar] [CrossRef]
- Baptista, R.; Swann, P. Do firms in clusters innovate more? Res. Policy 1998, 27, 525–540. [Google Scholar] [CrossRef]
- Polanyi, M. The Tacit Dimension; Routledge & Kegan Paul: London, UK, 1996. [Google Scholar]
- Dosi, G. Sources, procedures, and microeconomic effects of innovation. J. Econ. Lit. 1988, 26, 1120–1171. [Google Scholar]
- Feldman, M.P. Knowledge complementarity and innovation. Small Bus. Econ. 1994, 6, 363–372. [Google Scholar] [CrossRef]
- Acs, Z. Regional Innovation, Knowledge, and Global Change; Frances Pinter: New York, NY, USA, 2000. [Google Scholar]
- Braczyk, H.J.; Cooke, P.N.; Heidenreich, M. Regional Innovation Systems: The Role of Governances in a Globalized World; Psychology Press: London, UK, 1998; ISBN 0-203-27671X. [Google Scholar]
- De la Mothe, J.; Paquet, G. Local and regional systems of innovation as learning socio-economies. Econ. Sci. Technol. Innov. 1998, 14, 1–18. [Google Scholar]
- Padmore, T.; Gibson, H. Modelling systems of innovation: II. A framework for industrial cluster analysis in regions. Res. Policy 1998, 26, 625–641. [Google Scholar] [CrossRef]
- Padmore, T.; Schuetze, H.; Gibson, H. Modeling systems of innovation: An enterprise-centered view. Res. Policy 1998, 26, 605–624. [Google Scholar] [CrossRef]
- Fischer, M.M.; Diez, J.R.; Snickars, F. Metropolitan Innovation Systems: Theory and Evidence from Three Metropolitan Regions in Europe. Eur. Plan. Stud. 2002, 10, 275–279. [Google Scholar]
- Liu, X. Analysis and report on regional innovation capacity in China: 2004–2005. Study Sci. Sci. Technol. 2005, 12, 5–14. (In Chinese) [Google Scholar]
- Hao, Y.; Tang, J. Regional innovation capacity and its constrain factors, province based panel data investigation between 1997 and 2007. Manag. J. 2009, 6, 1182–1187. (In Chinese) [Google Scholar]
- Zhou, T.; Kuang, J.; Pan, Y. China City Innovation Report Blue Book; Hong Qi Press: Changchun, China, 2015. (In Chinese) [Google Scholar]
- Cooke, P. The new wave of regional innovation networks: Analysis, characteristics and strategy. Small Bus. Econ. 1996, 8, 159–171. [Google Scholar] [CrossRef]
- Nelson, R. National Innovation Systems—A Comparative Analysis; Oxford University Press: Oxford, UK, 1993. [Google Scholar]
- Buesa, M.; Heijs, J.; Baumert, T. The determinants of regional innovation in Europe: A combined factorial and regression knowledge production function approach. Res. Policy 2010, 39, 722–735. [Google Scholar] [CrossRef]
- Fritsch, M.; Slavtchev, V. How does industry specialization affect the efficiency of regional innovation systems? Ann. Reg. Sci. 2010, 45, 87–108. [Google Scholar] [CrossRef]
- Broekel, T. Collaboration intensity and regional innovation efficiency in Germany—A conditional efficiency approach. Ind. Innov. 2012, 19, 155–179. [Google Scholar] [CrossRef]
- Deyle, H.G.; Grupp, H. Commuters and the regional assignment of innovative activities: A methodological patent study of German districts. Res. Policy 2005, 34, 221–234. [Google Scholar] [CrossRef]
- An, Z. Regulation Reformation and Organizational Change on Harmonizing Development of Metropolitan Regions; Economic Science Press: Beijing, China, 2006. (In Chinese) [Google Scholar]
- Xie, F.J.; Xu, H.M. Study on the modes of metropolitan innovation system. China Econ. Rev. 2007, 3, 1–7. [Google Scholar]
- Xie, F.J. Research on the Operation Mechanism of the Innovation System of the Yangtze River Delta Metropolitan Area; Zhongpu Yangtze River Delta High-Level Forum: Kunshan, China, 2010. [Google Scholar]
- Cooke, P.; Morgan, K. Learning through Networking: Regional Innovation and the Lessons of Baden-Wurttemberg; Regional Industrial Research Report No. 5; University of Wales: Cardiff, UK, 1990. [Google Scholar]
- Hilpert, U.; Smith, H.L. Networking of Regionalised Innovative Labour Market; Routledge: Abingdon-on-Thames, UK, 2013. [Google Scholar]
- Wang, J. Networking environment: The new change of industrial organization. Strateg. Manag. J. 1997, 3, 109–144. (In Chinese) [Google Scholar]
- Gai, W.; Wang, J. Function of regional networking on small high tech companies in China. China Soft Sci. 1999, 9, 102–106. (In Chinese) [Google Scholar]
- Jaffe, A.B. Real Effects of Academic Research. Am. Econ. Rev. 1989, 79, 957–970. [Google Scholar]
- Griliches, Z. The Search for R&D Spillovers. Scand. J. Econ. 1992, 94, 29–47. [Google Scholar]
- Verspagen, B. Uneven growth between rivals: Informal know-how trading. Res. Policy 1993, 16, 291–302. [Google Scholar]
- Pavitt, K.; Patel, P. Uneven (and divergent) technological accumulation among advanced countries. Ind. Corp. Chang. 1994, 3, 59–787. [Google Scholar]
- Spangenberg, J.H. Environmental space and the prism of sustainability: Frameworks for indicators measuring sustainable development. Ecol. Indic. 2002, 2, 295–309. [Google Scholar] [CrossRef]
- Spangenberg, J.H.; Bonniot, O. Sustainability Indicators: A Compass on the Road toward Sustainability; Wuppertal Papers No. 81; Wuppertal Inst. für Klima, Umwelt, Energie: Wuppertal, Germany, 1998. [Google Scholar]
- Feng, Z.; Chen, W. Environmental Regulation, Green Innovation, and Industrial Green Development: An Empirical Analysis Based on the Spatial Durbin Model. Sustainability 2018, 10, 223. [Google Scholar] [CrossRef]
- Johnson, W.H.A.; Liu, Q. Patenting and the role of technology markets in regional innovation in China: An empirical analysis. J. High Technol. Manag. Res. 2011, 22, 14–25. [Google Scholar] [CrossRef]
- Chen, K.; Kenney, M. Universities/research institutes and regional innovation systems: The cases of Beijing and Shenzhen. World Dev. 2007, 35, 1056–1074. [Google Scholar] [CrossRef]
- Li, X. China’s regional innovation capacity in transition: An empirical approach. Res. Policy 2009, 38, 338–357. [Google Scholar] [CrossRef]
- Wang, J.; Fang, C. New-type driving forces of urban agglomerations development in China. Geogr. Res. 2011, 30, 335–347. [Google Scholar]
- Xiao, Z.; Du, X.; Wu, C. Regional Difference and Evolution and Convergence of Innovation Capability in China: Research on Space and Factorial Levels. Sustainability 2017, 9, 1644. [Google Scholar] [CrossRef]
- Zhang, Y.; Na, S.; Niu, J.; Jiang, B. The Influencing Factors, Regional Difference and Temporal Variation of Industrial Technology Innovation: Evidence with the FOA-GRNN Model. Sustainability 2018, 10, 187. [Google Scholar] [CrossRef]
- Yu, C.; Zhang, Z.; Lin, C.; Wu, Y.J. Knowledge Creation Process and Sustainable Competitive Advantage: The Role of Technological Innovation Capabilities. Sustainability 2017, 9, 2280. [Google Scholar] [CrossRef]
- Zhang, B.; Yao, F.; Zhang, J.; Jiang, L. Technology Transfer from Formal Soviet Union to China, 1949–1966; Shandong Press: Jinan, China, 2004. (In Chinese) [Google Scholar]
- Wu, Q.; Ning, Y. Analysis on City Networking in China—From perspective of electronic and information companies. Geogr. Stud. 2012, 31, 207–219. (In Chinese) [Google Scholar]
- Zhou, P.; Bai, Y.; Ma, W.; Wu, R.; Zhang, R.; Zuo, N. Evolvement of Spatial Pattern of Sustainable Development Efficiency and Its Influencing Factors for Resource-based Cities in China. J. Desert Res. 2016, 36, 1489–1495. [Google Scholar]
- Li, Q.; Wu, Y. Intangible capital in Chinese regional economies: Measurement and analysis. China Econ. Rev. 2017. [Google Scholar] [CrossRef]
- Grindsted, T.S. Regional planning, sustainability goals and the mitch-match between educational practice and climate, energy and business plans. J. Clean. Prod. 2018, 171, 1681–1690. [Google Scholar] [CrossRef]
- When, U.; Montalvo, C. Knowledge transfer dynamics and innovation: Behavior, interactions and aggregated outcomes. J. Clean. Prod. 2018, 171, S56–S68. [Google Scholar] [CrossRef]
- Cancino, C.A.; La Paz, A.I.; Ramaprasad, A.; Syn, T. Technological innovation for sustainable growth: An ontological perspective. J. Clean. Prod. 2018, 179, 31–41. [Google Scholar] [CrossRef]
- Chen, J.; Cheng, J.; Dai, S. Regional eco-innovation in China: An analysis of eco-innovation levels and influencing factors. J. Clean. Prod. 2017, 153, 1–14. [Google Scholar] [CrossRef]
- Gliedt, T.; Hoicka, C.E.; Jackson, N. Innovation intermediaries accelerating environmental sustainability transitions. J. Clean. Prod. 2017, 174, 1247–1261. [Google Scholar] [CrossRef]


| Regional Economic Power Concerns | Regional Market concentration and production power | FDI volume in the region |
| Overseas investment | ||
| Industrial firms | ||
| Regional production value | ||
| Transportation | ||
| Internet connection | ||
| Regional Innovation Concerns | Innovation (Input) | Regional science and technology expenditure |
| Regional educational expenditure | ||
| Innovation (output) | Patenting volume | |
| Granted patents | ||
| Regional Environmental Concerns | Environmental friendly production | Green resources |
| Energy intensiveness energy | ||
| Water supply |
| Nature of Economic Performance and Industrial traditions (by No. of Samples) | ID: Lower energy cost per firm (Bottom 30) S vs. N ** | ID: Mid-level energy cost per firm (Other) S vs. N ** | ID: Higher energy cost per firm (Top 21) S vs. N ** |
| ID: Top Production Value/Top economic power (Eco Tp15 & OpenTp 12) | NE1 (Emerging economies& significant open cities) S: 4; N: 3 | TE1(Top economic &significant open cities) S: 4; N: 1 | TE2 *** (Top economic developed areas) S: 2; N: 1 |
| Mid-levelecono. Power (with less openness) (EcoTp 60 & OpenTp60) * | NE2 (Emerging economieslocal power) S: 10; N: 3 | M (Medium) S: 10; N: 13 | TR2 (Significant traditional economies) S: 0; N: 9 |
| Lower economic power (Ebttm 46 & Openbttm46) | RM1 (Remote areas with less developed economies) S: 6; N: 4 | RM2 (Remote areas with more traditional economies) S: 14; N: 10 | TR1 (Highly strong traditional economies) S: 1; N: 11 |
| Indicator | Mean | S.D. | Definition | Factors |
|---|---|---|---|---|
| RFD | 0.98 | 1.58 | Ratio of FDI volume in the region (% of all sample cities) | Factor 1 (Current performance) Metropolitan economic power and innovation output related performance (simplified as MEIO) |
| RPG | 1 | 2.03 | Granted patent volume (Ratio to average all sample cities) | |
| FDF | 0.04 | 0.03 | Overseas investment—ratio to local fixed asset investment (%) | |
| RGA | 1 | 1.68 | Green land ratio of the sample city (% of all sample cities) | |
| RIQ | 1 | 1.03 | Numbers of industrial firms (Ratio to average of all sample cities) | |
| PSA | 0.73 | 1.39 | Patenting volume per science and technology personnel | Factor 2 (Potential capacity) Metropolitan industrial innovation efficiency and corresponding performance (simplified as MIIC) |
| PSG | 0.04 | 0.05 | Granted patents per S&T personnel | |
| HSE | 893.2 | 1057.3 | Science and technology expenditure per 100 S&T personnel | |
| HPC | 4292.7 | 7127.2 | Transporting passengers per 100 local residents | Factor 3 (Potential capacity) Metropolitan human resource and dynamic exchange capacity and relevant performance (simplified as MHRD) |
| HIE | 21.54 | 16.3 | Internet connection number per 100 population | |
| HEE | 162,208.7 | 108,091 | Educational expenditure per 100 population | |
| UFG | 1.7 | 0.67 | Regional production value per unit fixed assets | |
| PEP | 967.6 | 1172.9 | Electrical energy (KW hour electricity) cost per enterprise in the city | Factor 4 (Current performance) Metropolitan industrial nature and efficiency performance (MINE) |
| UWI | 0.03 | 0.02 | Water supply cost per production output in relevant city |
| Indicators | Factor 1 | Factor 2 | Factor 3 | Factor 4 |
|---|---|---|---|---|
| RFD | 0.926 | 0.176 | 0.051 | −0.052 |
| RPG | 0.813 | 0.002 | 0.287 | −0.047 |
| FDF | 0.746 | 0.269 | 0.332 | −0.081 |
| RGA | 0.714 | −0.116 | 0.479 | −0.022 |
| RIQ | 0.654 | 0.562 | 0.236 | −0.220 |
| PSA | 0.053 | 0.958 | 0.093 | −0.071 |
| HSE | 0.094 | 0.940 | 0.153 | −0.041 |
| PSG | 0.153 | 0.943 | 0.146 | −0.079 |
| HPC | 0.058 | 0.101 | 0.888 | −0.087 |
| HEE | 0.414 | 0.143 | 0.797 | 0.155 |
| UFG | 0.257 | 0.149 | 0.779 | 0.007 |
| HIE | 0.290 | 0.169 | 0.808 | 0.021 |
| PEP | −0.094 | −0.117 | 0.049 | 0.939 |
| UWI | −0.062 | −0.060 | −0.016 | 0.930 |
| Cumulative variance after rotation (%) | 24.178 | 47.205 | 70.193 | 83.420 |
| RFD | RPG | FDF | RGA | RIQ | PSA | PSG | HSE | HPC | HIE | HEE | UFG | PEP | UWI | |
|---|---|---|---|---|---|---|---|---|---|---|---|---|---|---|
| RFD | 1 | 0.680 ** | 0.806 ** | 0.596 ** | 0.710 ** | 0.215 * | 0.294 ** | 0.265 ** | 0.187 | 0.317 ** | 0.485 ** | 0.266 ** | −0.145 | −0.13 |
| RPG | 1 | 0.577 ** | 0.707 ** | 0.571 ** | 0.112 | 0.215 * | 0.121 | 0.288 ** | 0.443 ** | 0.569 ** | 0.442 ** | −0.112 | −0.103 | |
| FDF | 1 | 0.556 ** | 0.679 ** | 0.304 ** | 0.399 ** | 0.372 ** | 0.446 ** | 0.524 ** | 0.604 ** | 0.437 ** | −0.177 | −0.122 | ||
| RGA | 1 | 0.514 ** | 0.003 | 0.106 | 0.055 | 0.397 ** | 0.585 ** | 0.569 ** | 0.576 ** | −0.048 | −0.061 | |||
| RIQ | 1 | 0.593 ** | 0.656 ** | 0.604 ** | 0.299 ** | 0.494 ** | 0.470 ** | 0.483 ** | −0.326 ** | −0.252 ** | ||||
| PSA | 1 | 0.928 ** | 0.888 ** | 0.191 | 0.240 * | 0.214 * | 0.233 * | −0.18 | −0.128 | |||||
| PSG | 1 | 0.904 ** | 0.243 * | 0.328 ** | 0.281 ** | 0.280 ** | −0.197 * | −0.137 | ||||||
| HSE | 1 | 0.222 * | 0.294 ** | 0.313 ** | 0.285 ** | −0.136 | −0.13 | |||||||
| HPC | 1 | 0.672 ** | 0.737 ** | 0.601 ** | −0.091 | −0.049 | ||||||||
| HIE | 1 | 0.754 ** | 0.614 ** | −0.008 | −0.005 | |||||||||
| HEE | 1 | 0.685 ** | 0.153 | 0.04 | ||||||||||
| UFG | 1 | 0.036 | −0.059 | |||||||||||
| PEP | 1 | 0.781 ** | ||||||||||||
| UWI | 1 |
© 2018 by the authors. Licensee MDPI, Basel, Switzerland. This article is an open access article distributed under the terms and conditions of the Creative Commons Attribution (CC BY) license (http://creativecommons.org/licenses/by/4.0/).
Share and Cite
Chen, X.; Li, R.; Niu, X.; Hilpert, U.; Hunstock, V. Metropolitan Innovation and Sustainability in China—A Double Lens Perspective on Regional Development. Sustainability 2018, 10, 489. https://doi.org/10.3390/su10020489
Chen X, Li R, Niu X, Hilpert U, Hunstock V. Metropolitan Innovation and Sustainability in China—A Double Lens Perspective on Regional Development. Sustainability. 2018; 10(2):489. https://doi.org/10.3390/su10020489
Chicago/Turabian StyleChen, Xiangdong, Ruixi Li, Xin Niu, Ulrich Hilpert, and Valerie Hunstock. 2018. "Metropolitan Innovation and Sustainability in China—A Double Lens Perspective on Regional Development" Sustainability 10, no. 2: 489. https://doi.org/10.3390/su10020489
APA StyleChen, X., Li, R., Niu, X., Hilpert, U., & Hunstock, V. (2018). Metropolitan Innovation and Sustainability in China—A Double Lens Perspective on Regional Development. Sustainability, 10(2), 489. https://doi.org/10.3390/su10020489