Abstract
As the concept of prospect-refuge defines a preferred environment, the spatial elements that provide good conditions for the catalyst of the theory have been extensively studied. The well-known architectural element of this theory is the window that optimizes visual openness to outdoor or enclosure from outdoor. The aim of this paper is to develop a design method for prospect-refuge condition by adjusting window design attributes. A parametric design model that measures spatial conditions and presents design alternatives for the window is proposed in two major phases. First, this paper explains a parametric model to generate design alternatives for a window according to its size, aspect ratio, location, and shape. In the second phase, the parametric algorithm is defined for the measurement of prospect-refuge with 3D visibility. As a result, we explore the impact of window design variables on average visibility and difference visibility of prospect and refuge area. Using the parametric design technology, the proposed method presents analytical techniques, considering spatial characteristics.
1. Introduction
A well-designed space can be defined psychologically, as it offers people inspiration and comfort that constantly improves their lives, providing a sense of rejuvenation, and a willingness to communicate with others [1]. However, it is not easy to objectify the psychological impact because a person’s psychology depends on age, sex, culture, and experience [2,3]. Nevertheless, there are certain preferences that people have in common, so architects and designers need to approach this issue in terms of architectural or environmental psychology.
As part of an effort to understand the psychological impact of environments, prospect-refuge has been proposed to explain the preferred environment as one in which people cannot be seen by others, but can see others [4]. Within the space that defines this concept, there is provision for restoration, concentration and safety, ultimately improving comfort [5]. Thus, the spatial elements that provide good prospect and refuge conditions have been extensively studied in research on visual preference. For example, some researchers have mentioned that, for interior spaces, fenestration helps optimize visual access to indoor or outdoor areas, enhancing prospect-refuge conditions [5,6,7]. In particular, the design of windows provides a sense of openness, which has a relaxing psychological effect and characterizes visual comfort in buildings [3,8,9,10]. Moreover, window design, which is difficult to change later, should be considered in the early stages of the architectural design process, considering multiple aspects of design at the same time [10].
Previous research findings regarding the quantitative analysis of prospect-refuge in buildings have consisted of psychological experiments based on surveys, and spatial structure analysis with statistical or mathematical values [2,11]. In these studies, perceptual properties are studied by using a survey with design attribute stimuli such as window size in order to identify people’s preferences and perceptions. However, the changes illustrated by the stimuli were not systematic and gradual, and only 20 or so arbitrary images that showed three or four extreme cases of window size and thread size at the same time were used. With few stimuli due to limitations in technology, they were not able to reveal precise information regarding how much the physical environment affected perception, and they showed only the degree of correlation. Therefore, it has been pointed out that that future research should be improved by the use of advanced digital technology [2]. In addition, mathematical research using isovists and 2D or 3D models has been conducted to explore the prospect-refuge theory and to provide a quantitative explanation [12,13,14,15,16]. However, the analysis in these studies were limited to two dimensions, such as a plane or an elevation. Moreover, as these studies focused on exploring specific cases, they are not analyses of precise design elements for prospect-refuge.
Therefore, to fill the gaps mentioned in previous studies, the present study integrates the parametric modeling approach into space design to provide prospect-refuge conditions. Parametric design is a computational design method that features the ability to solve various design problems using rule algorithms [17]. Parametric design can support the entire design process, because its systems support the creation, organization, and management of complex computational design models [18]. Architects use parametric design tools to create complex shapes, or to optimize their design through a multi-purpose design solution [19].
The present study aims to develop a design method to simulate the prospect-refuge spatial quality. The methodology provides a strategy that can be followed to build a parametric model in the digital modeling phase by developing a design model of prospect-refuge in a space [20,21]. To implement such a parametric model, quantification of prospect-refuge is essential. Thus, the study constructs an approach toward the measurement of the prospect-refuge conditions along with procedures for 3D visibility. Thereafter, a parametric model is described to generate design alternatives for windows. According to the input variable values for prospect-refuge design attributes, window design can be changed by considering not only the size, location, and aspect ratio, but also the section shape of the window, analyzing 3D visibility. Finally, the study analyzes and explores a wide range of design alternatives to optimize prospect and refuge.
2. Related Works
2.1. Manifestation of Prospect-Refuge Concept
The geographer Jay Appleton described that people’s instinctively preferred place was an environment that meets the instinctive human desire to observe external dangers and obtain food at the same time [4]. However, as these psychological needs are associated with the individual’s various experience of social, cultural, and personal, the prospect-refuge concept was proposed in order to analyze these complex factors. Appleton explained what circumstances people would like to stay with the conceptual illustration in Figure 1 [4] (p. 76). In view elements (L), the observer (O) is not visible by interrupting barrier (B), while the observer (O) can have a whole view of the environment (L) through the sufficient opening (B). It serves as a place of refuge, and as an environment in which the prospect is provided for at the same time. This shows that the physical environment plays a critical role in the prospect-refuge theory.
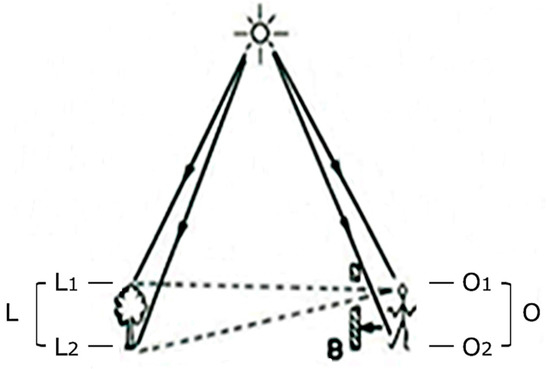
Figure 1.
The conceptual illustration of prospect-refuge.
Stamps reported that about 50% of studies on prospect-refuge theory used qualitative methods of “humanistic speculation or personal experience” [11], including those of Appleton [4], Hildebrand [22], Ulrich [23], Orians [24], and Roberts [25]. Hildebrand integrated prospect-refuge theory into the fields of architecture and interior design, presenting Frank Lloyd Wright’s houses as ideal examples of this theoretical concept [22]. He analyzed the characteristics of the spaces, indicating the balance of prospect and refuge in Wright’s houses qualitatively, which he called the “Wright pattern.” Moreover, this theory has often been applied in works by famous designers, from Alvar Aalto to Glenn Murcutt, Jørn Utzon, and Peter Zumthor [26].
The current study reviews previous studies that qualitatively describe explicit spatial characteristics of prospect-refuge [5,6,7,27,28]. Characteristics of space that provide good prospect-refuge conditions are extracted. As variables, many elements have a determining influence on prospect-refuge conditions and can be separated into two groups, which are related to the outdoor environment and the built environment.
The valuables related to the outdoor environment regarding prospect include natural factors, and the surroundings where the building is located. Although they cannot be controlled, they need to be considered with variables depending on the changing circumstances. The valuables in this group are daylight illumination, obstacles (adjacent buildings), landscape (trees, hedges, reeds, arboreal factors), geographical features (caves, rocks, hollows, hills, mountains), and weather conditions. On the other hand, the built environment is designed according to the intention of the architect and can be evaluated with various criteria. In this group, major building design elements, especially those affecting the visual quality inside the building, can be considered as the valuables: orientation and position of building; floor level, ceiling height, and wall thickness; building form; fenestration (windows, doors) and screening devices (blinds, curtains, etc.); room size, depth, and position; illuminance; paths. It should be noted that previous research emphasized that there were some design elements, such as space area (size), ceiling height, window size, wall (or partition), lighting, and material, that have aspects of both prospect and refuge, depending on their characteristics.
As an environmental preference theory, the concept of prospect-refuge is a combination of environmental and psychological study. Therefore, quantitative studies of prospect and refuge focus on perceptual or behavioral properties, geometric properties, and those that combine the two. Perceptual properties are studied by using a survey with stimuli in order to identify people’s preference, perception, or both [11,29,30,31,32]. On the other hand, geometric properties are analyzed using isovists to study the correlation between isovists and the prospect-refuge condition in space [13], and by isovists or spatial elements (viewing angle, viewing distance) for developing methods and evaluation [9,15,16,33,34,35,36,37,38]. Mixed methods with surveys and isovists are also used together to uncover the relationships between perceptual properties and geometric properties. In particular, mathematical research using isovists with 2D or 3D models has been conducted to explore aspects of prospect–refuge theory by providing a quantitative explanation [12,13,14,15,16]. Therefore, valuables associated with visual properties are differentiated according to the observer (or observation point) or the visibility evaluation element.
As the beginning of extensive research, this study focuses on the window. Therefore, the outdoor environment and built environments, other than windows, were excluded from the scope of this study. Furthermore, for the measurement of prospect-refuge, visibility was used with the isovist area index, which has been widely used in previous studies of visual quality.
2.2. 3D Visibility Analysis with Window Design
Indraprastha and Shinozaki proposed a method for numerically evaluating visual openness, as well as privacy and physical accessibility, considering windows [9]. It is possible to provide more objective information to designers by measuring visual distance and visual angles in a simulation model without the subjective intervention of researchers. However, there are limitations to the 2D approach. Moreover, the visual prospect of the space was quantitatively analyzed by measuring the isovist area at the observer point along the main line from the entrance to the living room [13]. While the ceiling height was separately measured and used for analysis, a 3D analysis was not conducted in this study. Therefore, a comprehensive 3D approach is required for measuring visible areas.
Gibson’s theory of direct perception has been used for 3D visibility analysis and is one of its fundamental theories. Observers perceive “optic arrays” of patterns of light, and “isovist rays” are used as series of visible radiation from the observer [39]. The optic arrays are emitted from the observer’s position at regular intervals, as shown in Figure 2, so the visible and invisible areas change as the observer moves [40] (p. 72).
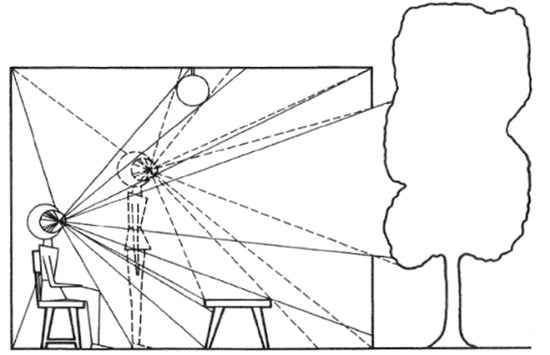
Figure 2.
Optic array by the movement of the observer.
Therefore, when analyzing 3D visibility, the position of the observer and the variability of the observer’s eye level should be considered. To measure visibility through the window by means of 3D visibility, this study intends to use isovist rays to analyze the visible area [41]. This is a method that calculates the number of isovist rays in a different way from the isovist field, which is an area-based analysis [42]. It divides the plane into grids and measures the amount of visible radiation at the observation point, especially in 3D visibility analysis. The visibility may change according to the position of the observer and the eye level of the observer, so various conditions must be considered.
To analyze 3D visibility with window design, we look at some of the studies to understand the design attributes of windows related to prospect-refuge. In these studies, performance evaluations, such as illuminance, glare, and energy are conducted according to window size, aspect ratio (ratio of vertical to horizontal), and location. The size of the window is widely set to the index of WWR (the window-to-wall ratio). The values set according to the variables that determine the design of windows in the literature are shown in Table 1 [20] (p. 14).

Table 1.
Window design variables.
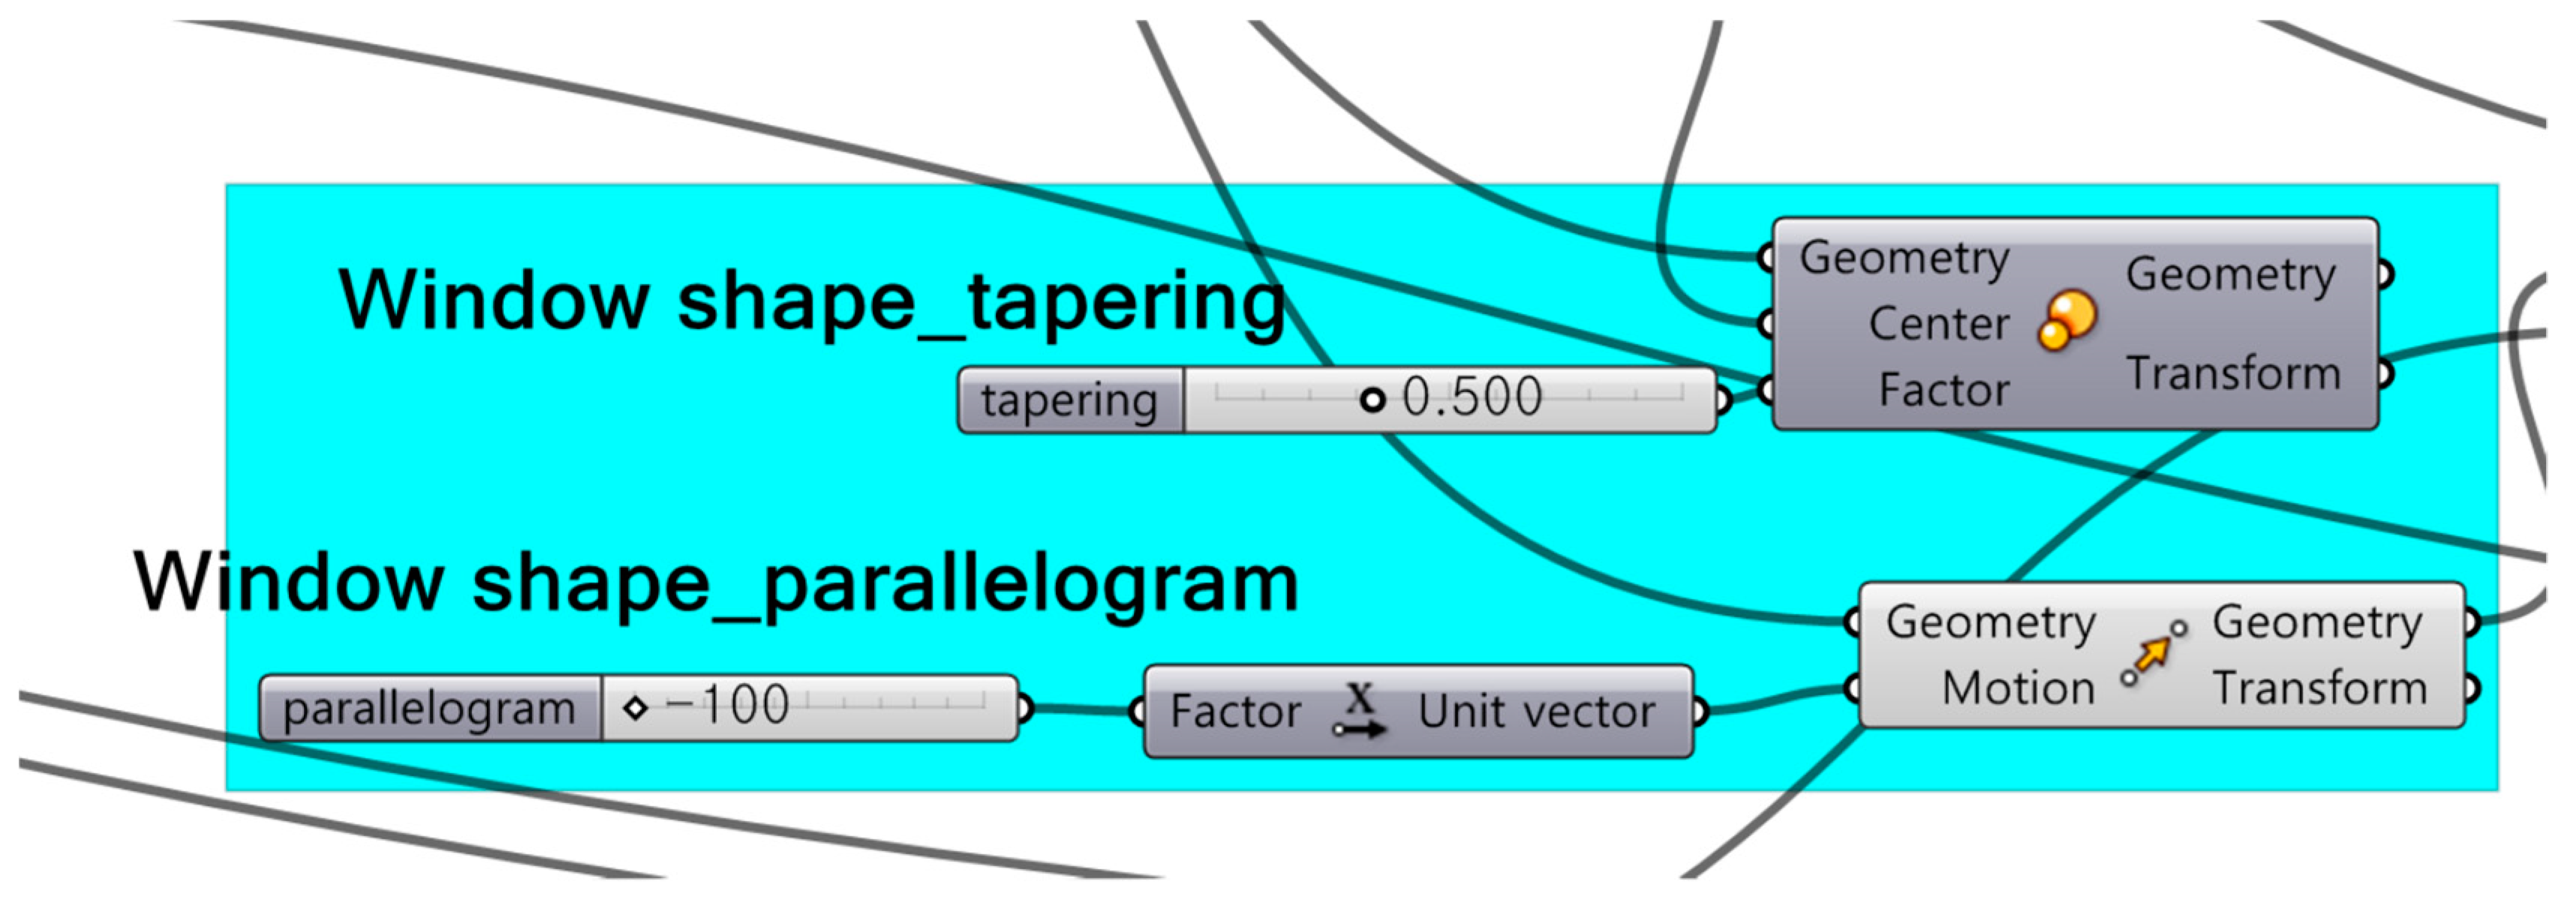
In addition, this study explores the design elements of windows by adding a sectional shape. In this regard, Herzog, et al. [43] (p. 31) describe “how the shape of the reveal affects daylight penetration and the occupant’s view out.” in Figure 3. The shape of the window is divided into five types: (i) Parallel, (ii) tapering inwards, (iii) tapering outwards, (iv) parallelogram, sloping inwards, and (v) parallelogram, sloping outwards. According to each form, the view of the observer in the room changes. Therefore, the shape of the window is very important to the concept of prospect-refuge because the visibility through the window determines the extent of prospect and refuge, which our study verified.
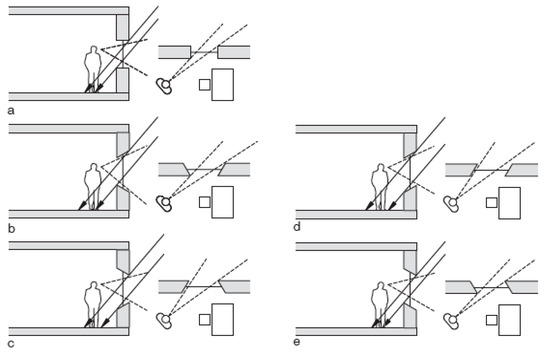
Figure 3.
Window shape: (a) parallel, (b) tapering inwards, (c) tapering outwards, (d) parallelogram, sloping inwards, and (e) parallelogram, sloping outwards.
In this study, we identify the change of visibility by considering the conditions of the observation points and the design elements of the window at the same time. In this regard, parametric models can be an appropriate method to review various conditions.
2.3. Parametric Design
In parametric design, the parameter is a representative controller for delivering design alternatives, and the relational constraints imposed on geometric objects can facilitate the design process at each stage [44]. Therefore, the goal of parametric design is to support the design process in ways that are efficient, productive, and sometimes algorithmically computable. Moreover, in the research literature for architectural design, parametric design is mainly dealt with in the creation of complex shapes, optimization of multiple design solutions, and multidisciplinary designs that address structural and sustainable issues [19]. For example, parametric design is used in the performance-based initial design of high-rise buildings by providing immediate feedback on performance [45,46], in the fabrication and manufacturing process of a building’s components [47,48], and in urban design [49,50].
Recently, research on parametric design in the field of architecture has become more prevalent because an increasing number of architects have begun to use parametric modeling. In this regard, Woodbury said, “parameters admit model variation, which enables design space exploration” [18] (p. 277). He refers to these alternatives and design variations as part of the implicit space of a solution that may not be explicitly visited by the designer during the design process. The value of the parameters at any time defines the space of model instances. Therefore, parametric models intrinsically enable exploration of great numbers of alternatives and variations.
In addition, a great advantage of parametric design is the reduction in architectural design change costs. Focusing on cost and effort early in the design process reduces costs and improves building performance throughout the entire process, particularly with Integrated Product Delivery (IPD), where various experts participate in the early stages of design to create an optimal system [51]. Therefore, parametric design is a tool that can be used to support IPD, and the real benefit of parametric design is the cost savings that are associated with design changes [52].
Architectural design involves finding solutions to problems, often when the problem is unclear, so the design process requires an understanding of the problem [53]. Therefore, a parametric design is a process for describing a problem using a variable, while equations represent the relationship between the parameters [54]. To create a parametric model, a logical sequence of equations, parameters, and relationships need to be considered [18,55].
3. Parametric Model of Prospect-Refuge
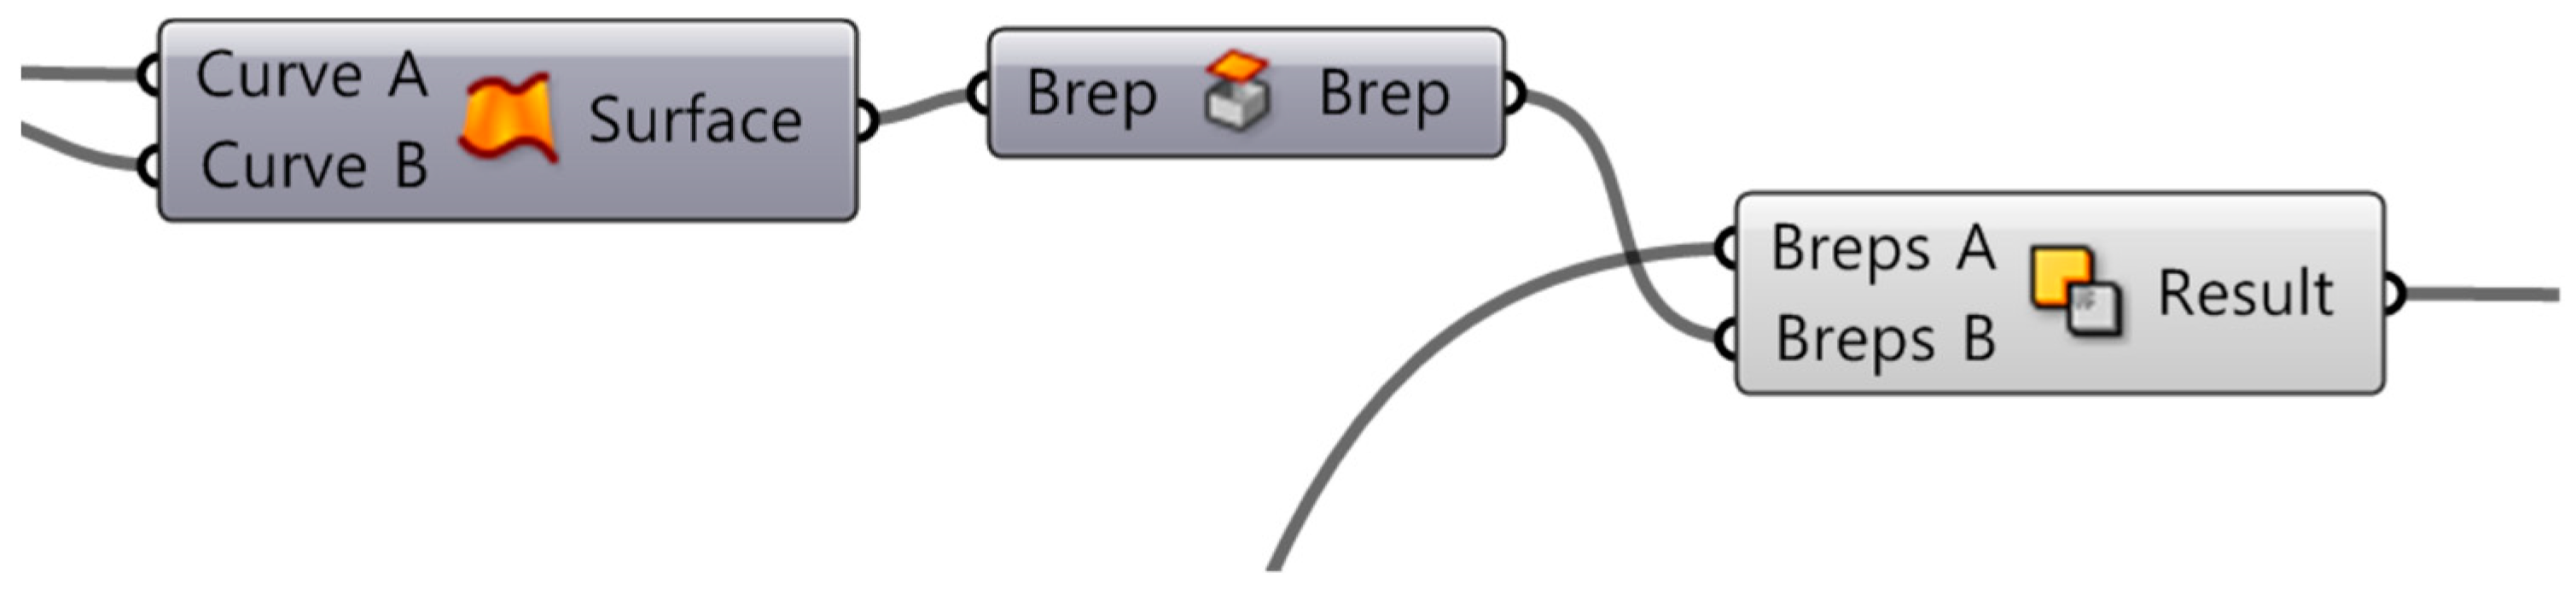
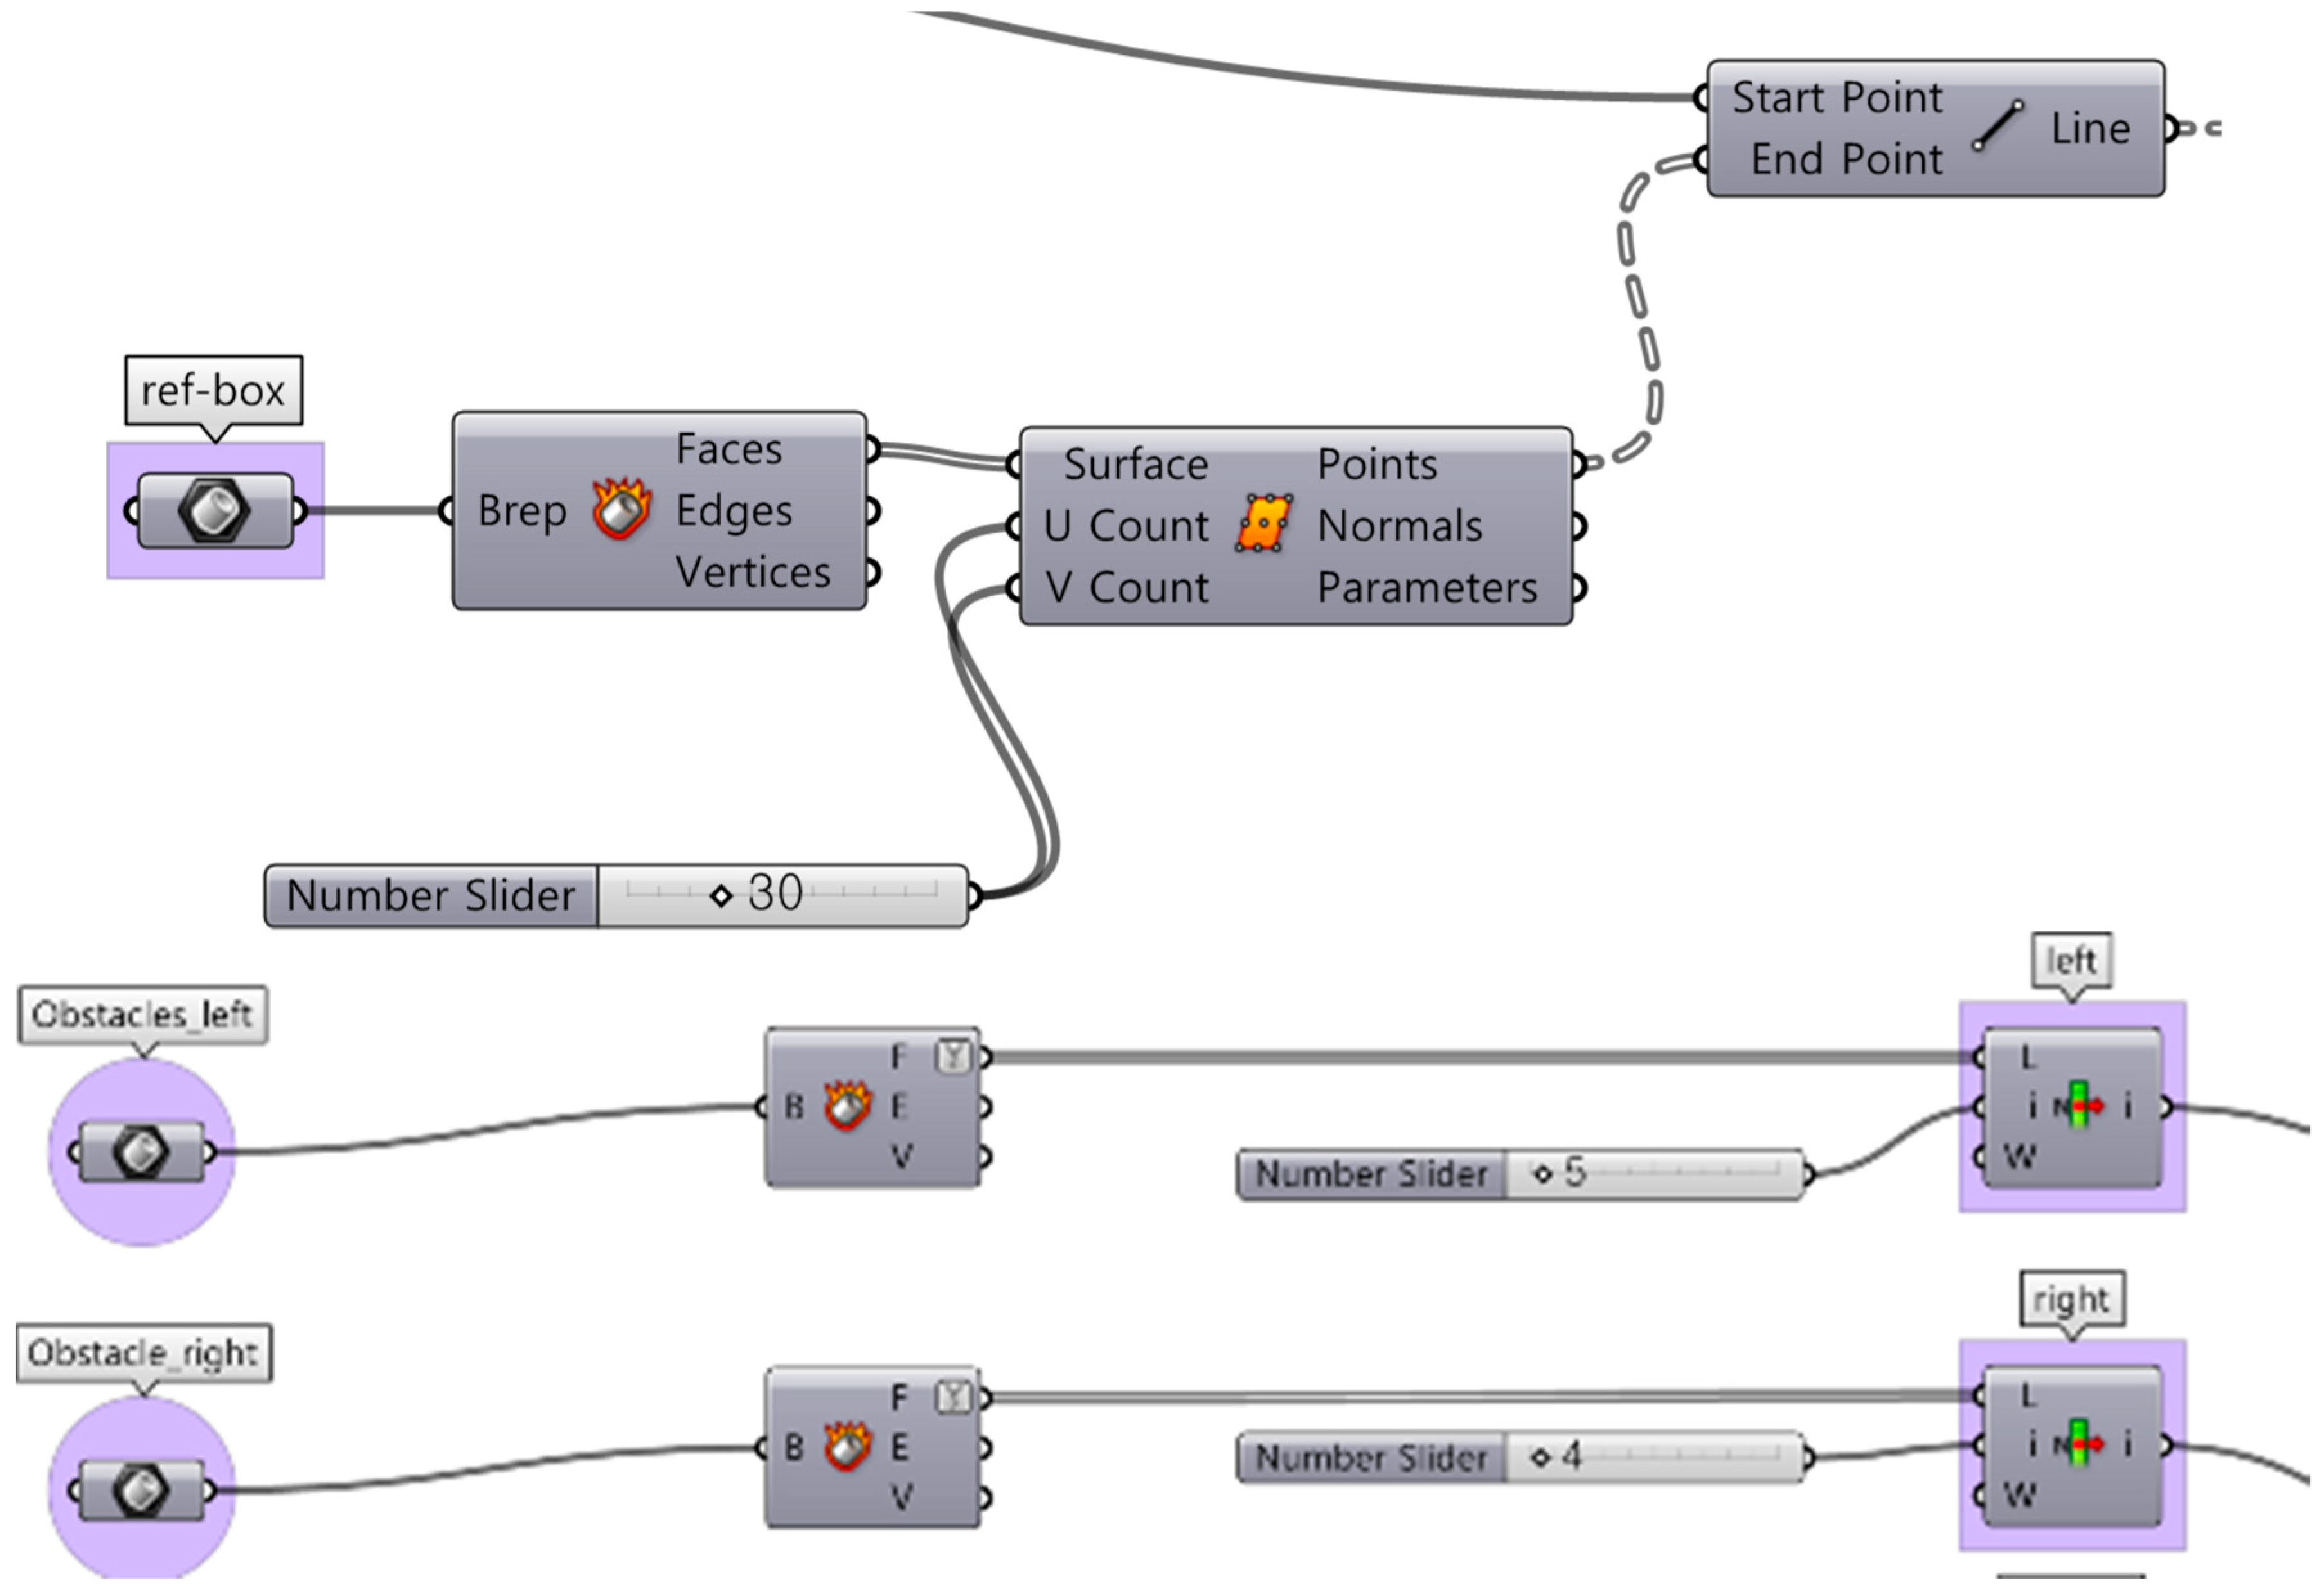
This research proposes an algorithmic and parametric design process developed in Rhino and Grasshopper. The integration of these tools was necessary to fulfill the objectives of this study: Rhino was used as a modeling tool; Grasshopper was used as a parametric interface. gHowl is further utilized as a set of components to extend Grasshopper’s ability to deal with information by exporting analysis data. To integrate the parametric design model in the visual environment of a building and the concepts of environmental psychology, tools can be used to effectively study design attributes and analysis of architectural performance once the model is created.
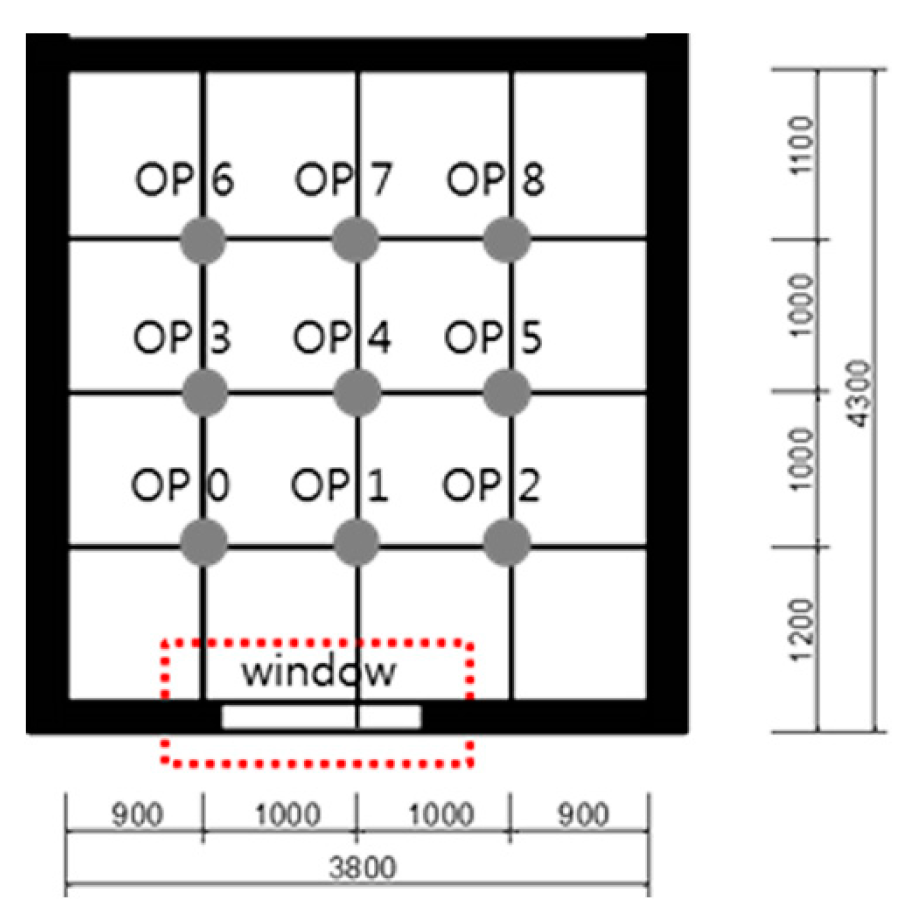
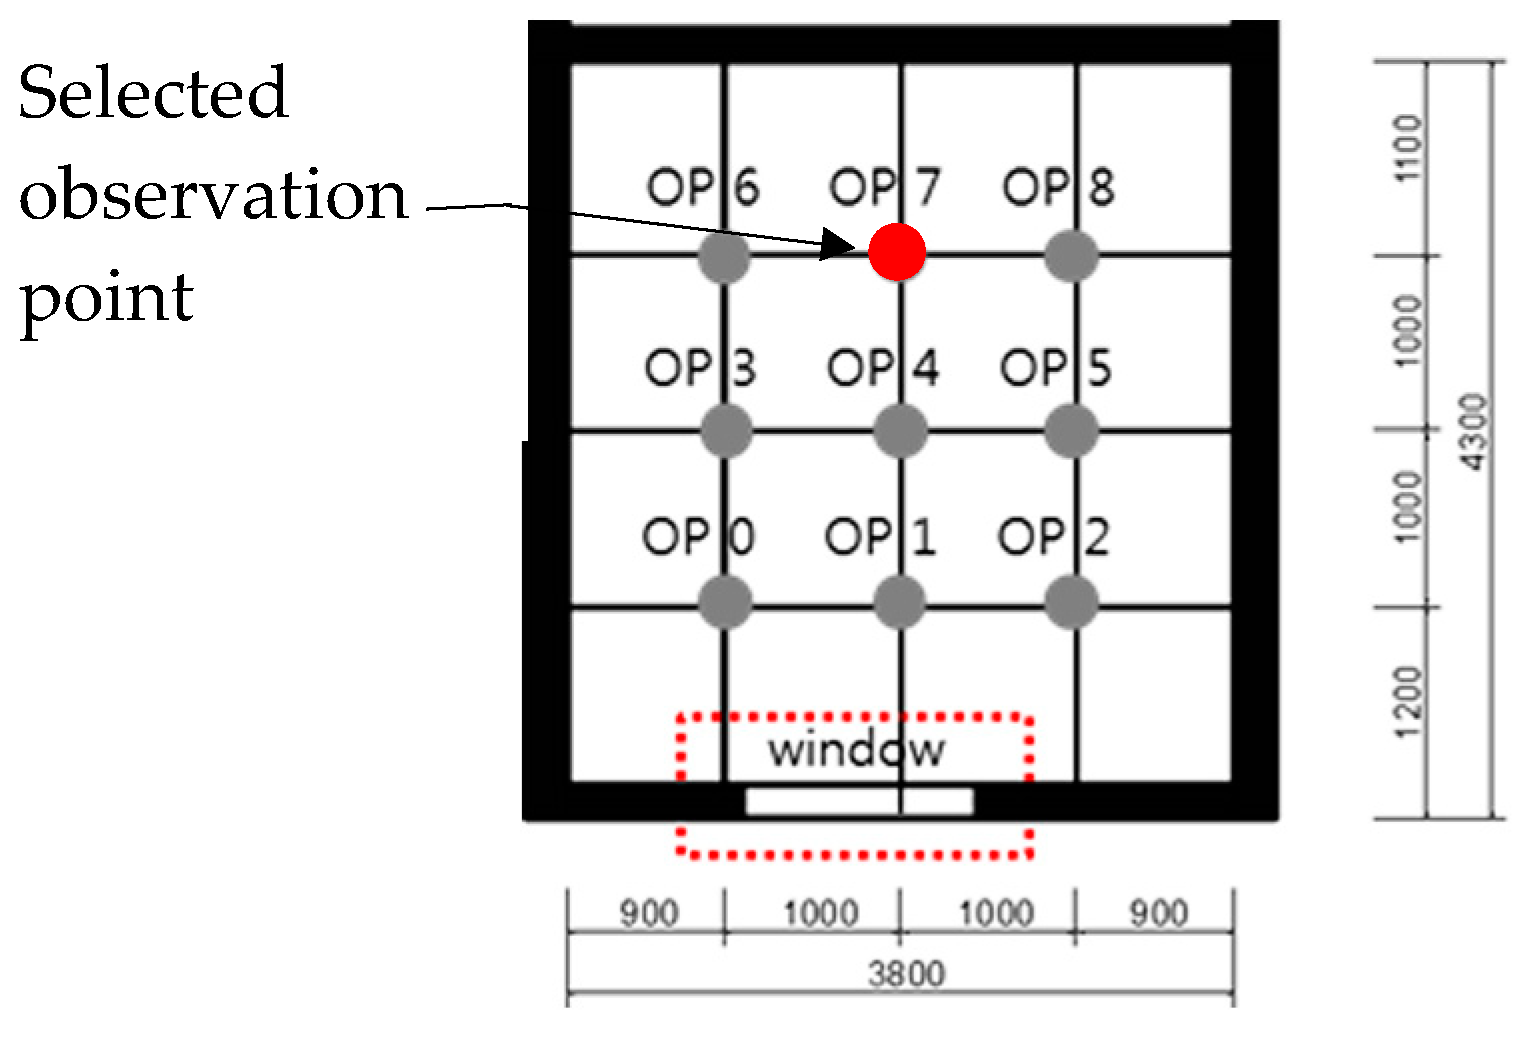
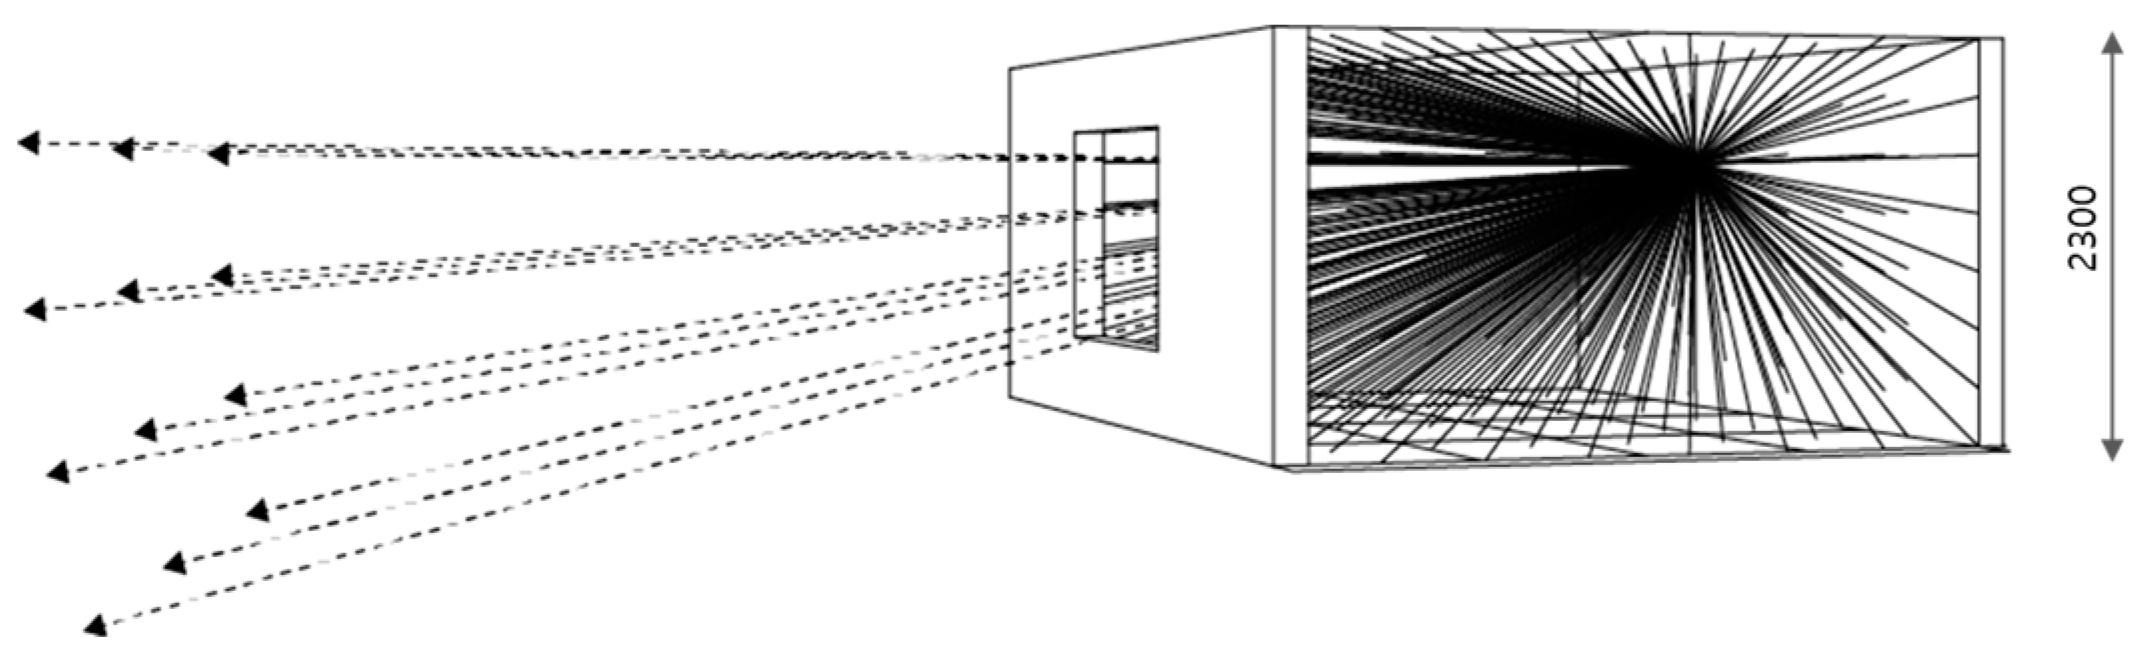
To organize the research flow of this study, the basic 3D model was built as a simple example of a completely glazed South-facing living space with spatial dimensions 3.8 m (width), 4.3 m (depth), and 2.3 m (height) (Figure 4). It is based on the studio room located in Wirye New Town, Southeast of Seoul, Korea, as a typical public rental housing. The measured space was four m in depth so that the opening for the prospect-refuge conditions could be investigated. To maintain spacing by one m, the observer viewpoints were numbered from zero-to-eight from the front of the window, setting a total of nine viewpoints. The observation points one-to-two near the window were the prospect area, whereas six-to-eight were designated as the refuge area.
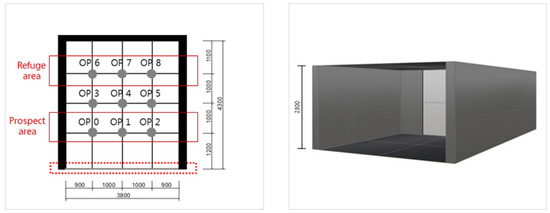
Figure 4.
3D Modeling for parametric design (unit: mm).
As illustrated in Figure 5, the two major phases of the parametric model and their core issues constitute the design process of this study, which are elaborately explained in the following sections. In the first phase, we explain how to generate design alternatives for window according to the design elements. The second phase shows the parametric model for the measurement of prospect and refuge with 3D visibility. We then analyzed 3D visibility according to design elements of window and explore design alternatives for prospect-refuge conditions. In a parametric model that implements a method for measuring 3D visibility, inputting a parameter value automatically calculates visibility. To build a parametric model systematically, it is necessary to identify the input parameter values, the calculated values as output parameters, and their relationship (Figure 6).
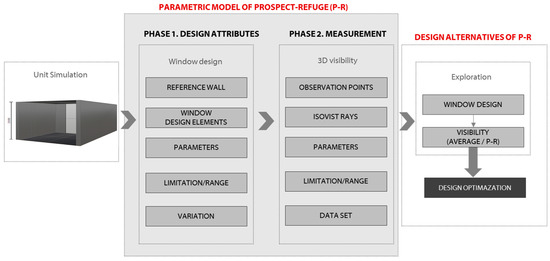
Figure 5.
Window design process in parametric model of this research.
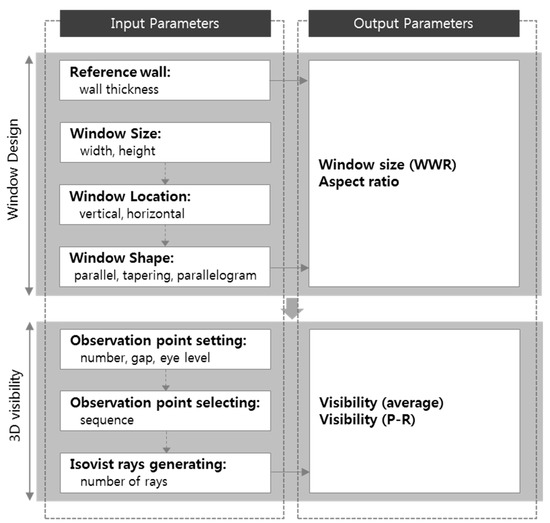
Figure 6.
Input and output parameters.
The design model to be created needs to be predefined in order to apply a variation method. Therefore, the design can be a hierarchical description of a complex problem with many variables. As architects use many tools to create, analyze, and document designs, computing tools can promote and improve the design process [56]. The P-graph is one of the ways to describe the design process of constraint-based parametric modeling. The nodes in a graph representation are always topologically ordered, and the acyclic graph representing such an arrangement is called a P-graph. As illustrated in Figure 7, the parameters, constraints, data flow, and outputs of the parametric design process are easily understood by using the structure of a P-graph [44]. In this paper, a parametric model is proposed based on the P-graph structure that is, in turn, based on features such as parameter setting, constraint assignment, rule algorithm, and change in output. Moreover, the limitation and range of parameters is defined. Thereafter, the P-graph is implemented by an algorithm in GH and the major components are displayed in Table 2.
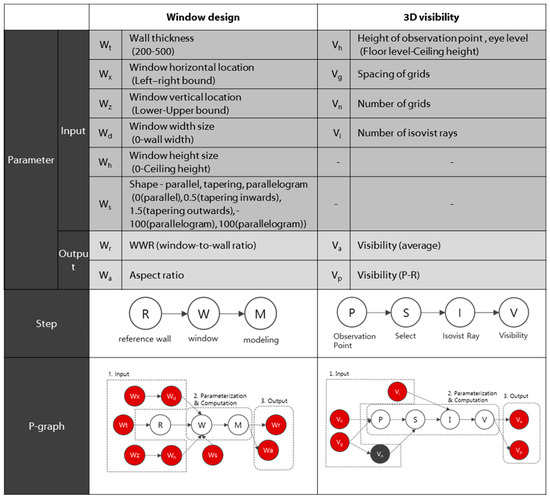
Figure 7.
Parametric model of prospect-refuge.
Table 2.
Main components of Grasshopper (GH).
3.1. The First Phase: Design Attributes of Prospect-Refuge Window Design
As mentioned in the previous chapter, a designated algorithm based on size, location, and aspect ratio was linked to the window sectional shape in order to determine the impact of visibility under changing observation points. The parameters, which are input or output for window design, range from wall thickness to window shape. The minimum and maximum values of the parameters are defined to generate the window design. The output parameters are the WWR, and aspect ratio. Based on these parameters, the rule and process are set for window design, and an algorithm is developed to build a parametric model. The window design algorithm consists of three main steps, as depicted in Figure 6.
- Creating the reference wall in which the window is located (R).
- Designing the width and height of the window, location of its top and bottom, and its shape (W).
- Building the final 3D model, including the window (M).
Furthermore, each step is completed with another algorithmic procedural instruction that is run by the parameters representing “Sliders” and “Panel” in Grasshopper to generate window design, as explained below:
- Building a reference wall with wall thickness.
- Setting the window’s horizontal location between the left bound and right bound.
- Setting the window’s vertical location between the lower bound and upper bound.
- Selecting window width size from 0 to wall width.
- Selecting window height size from 0 to ceiling height.
- Determining window shape (parallel, tapering inwards/outwards, parallelogram, sloping inwards/sloping outwards).
- Calculating WWR and aspect ratio.
When the model is generated, the WWR and the aspect ratio are automatically calculated. To set the size, location, and aspect ratio, the parameter value is also input by using the number slide so that the position of vertex can be selected according to the intervals 100, 200, 300, etc. (unit: mm) at the bottom. Moreover, the parameter value can also be input directly by connecting numbers. In addition, the VB Script component is used to specify that the size of the window should not exceed the reference wall.
While the attributes of window design are significant for the overall visual performance of a space, such parametric changes contribute to superior conformity to visual comfort indices in the second phase.
3.2. The Second Phase: Measurement of Prospect-Refuge 3D Visibility
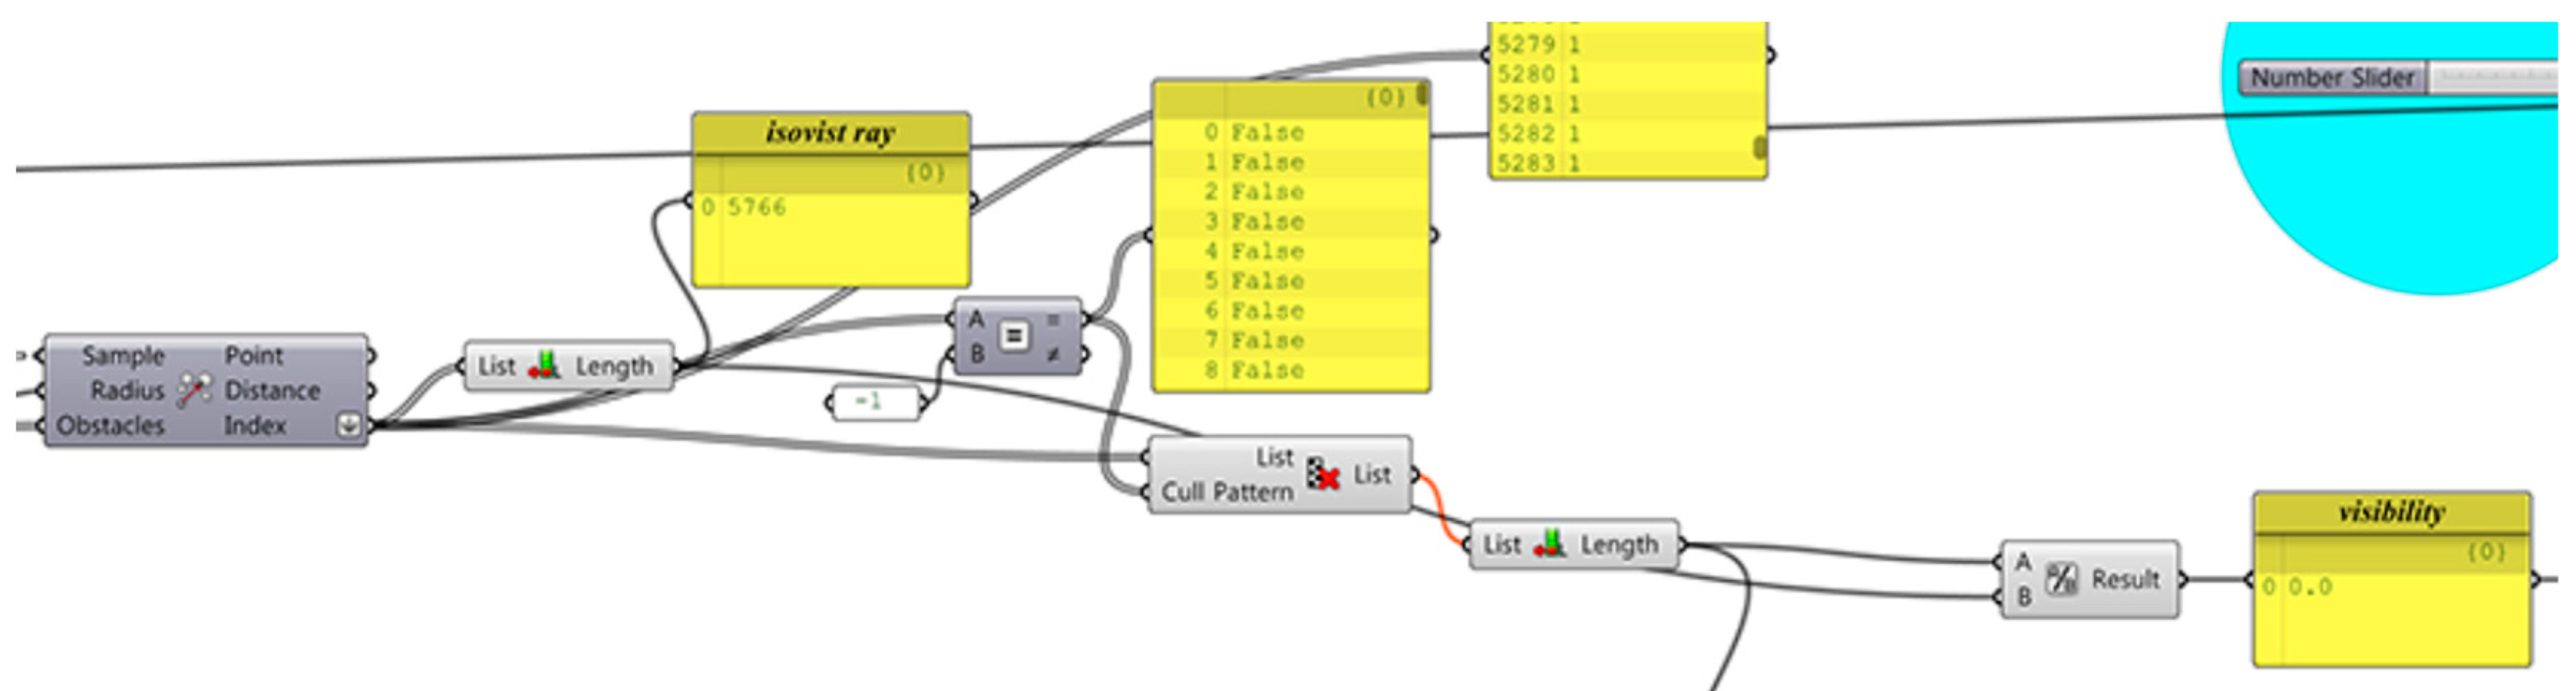
The second phase is primarily focused on developing an algorithm for measurement of the prospect-refuge conditions. It focuses on a parametric model that can automatically analyze 3D visibility according to various window designs so that designers can propose design ideas that optimize prospect and refuge from the initial stage of design. To accomplish this, the IsoVist Ray component of GH was used to generate isovist rays for 3D visibility and physical properties to meet visual comfort.
Prospect is an unimpeded opportunity to see [4] and describes the visual experience of unconsciously looking outward through openings [35]. Therefore, as prospect includes all views that appear unconsciously through the opening, visibility measures the extent to which the visible area of the observation point can be seen through the window.
Table 3 presents procedures for numerically measuring 3D visibility based on Gibson’s theory [21]. First, the observation points are set at eye level in the unit plane. Second, one of the observation points is selected. From the selected point, isovist rays are radiated. The visibility is calculated by the total number of isovist rays at regular intervals from the observation point, and the number of isovist rays that pass through the window without hitting an obstacle such as a ceiling, wall, or floor. The visibility V of the entire space can be obtained as the average value of the visibility V(Pn) of each observation point. The greater the quantity of isovist rays passing through the window at P(n), the higher the visibility. The parametric model for 3D visibility analysis consists of four parts:
Table 3.
Procedures for 3D visibility measurement with the isovist rays of Grasshopper (GH) (unit: mm).
- Setting the observer points (P).
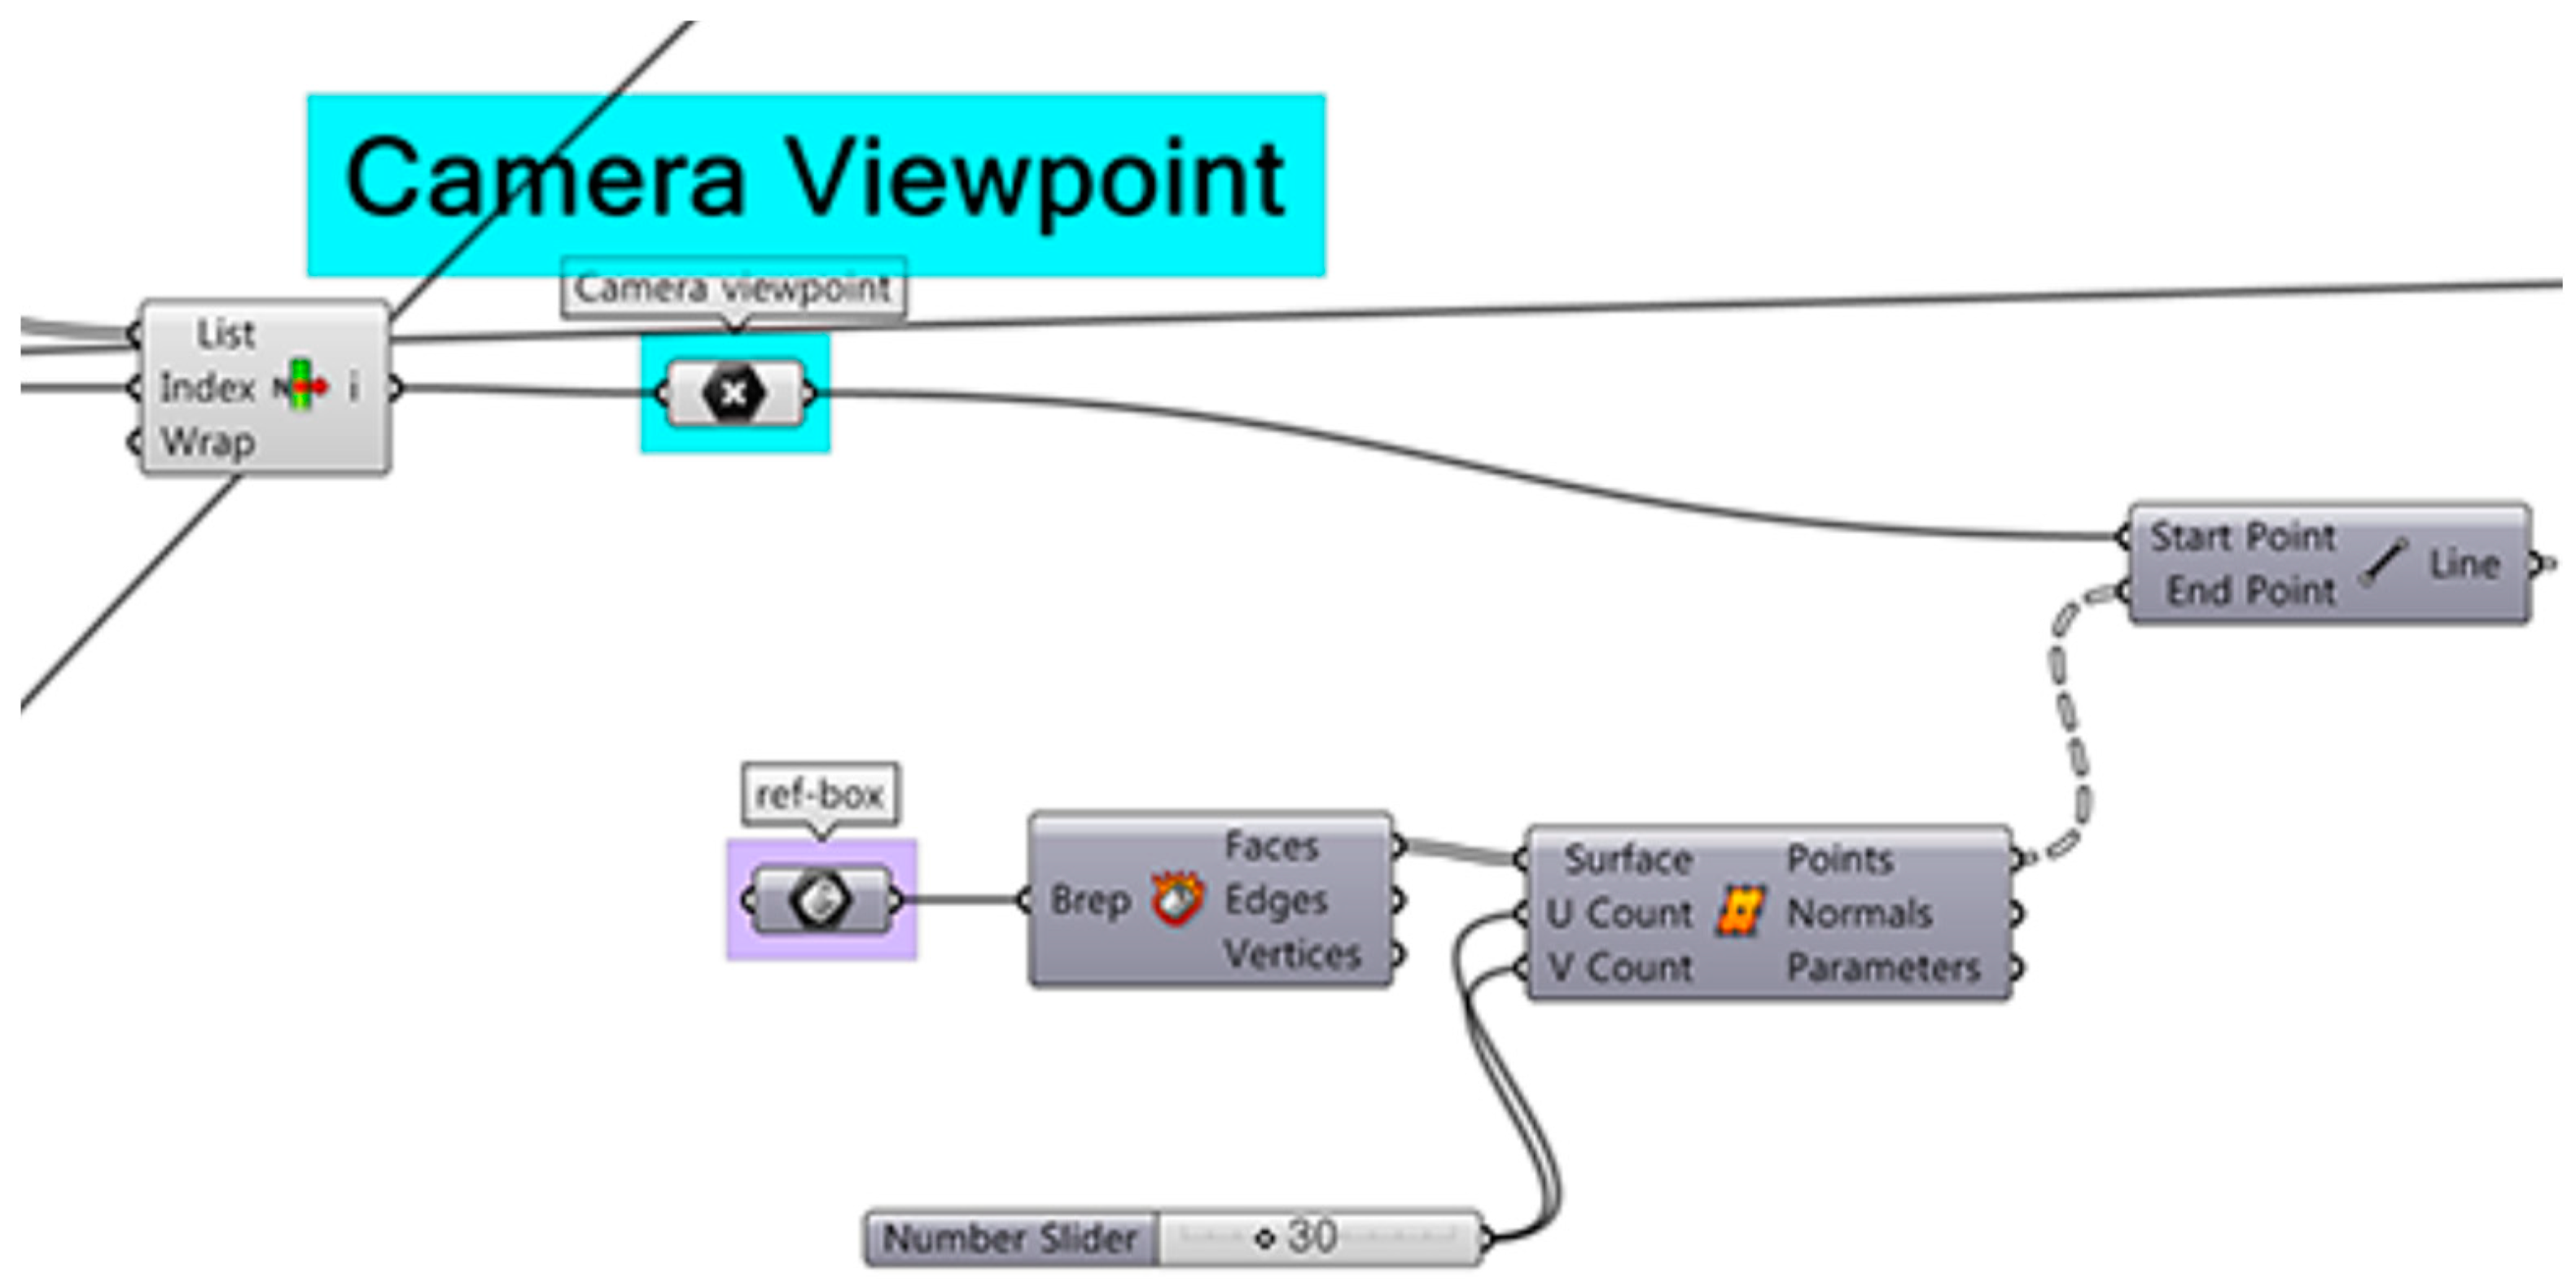
- Selecting the observer point (S).
- Generating isovist rays (I).
- Automatically measuring the visibility by calculating the number of isovist rays (V).
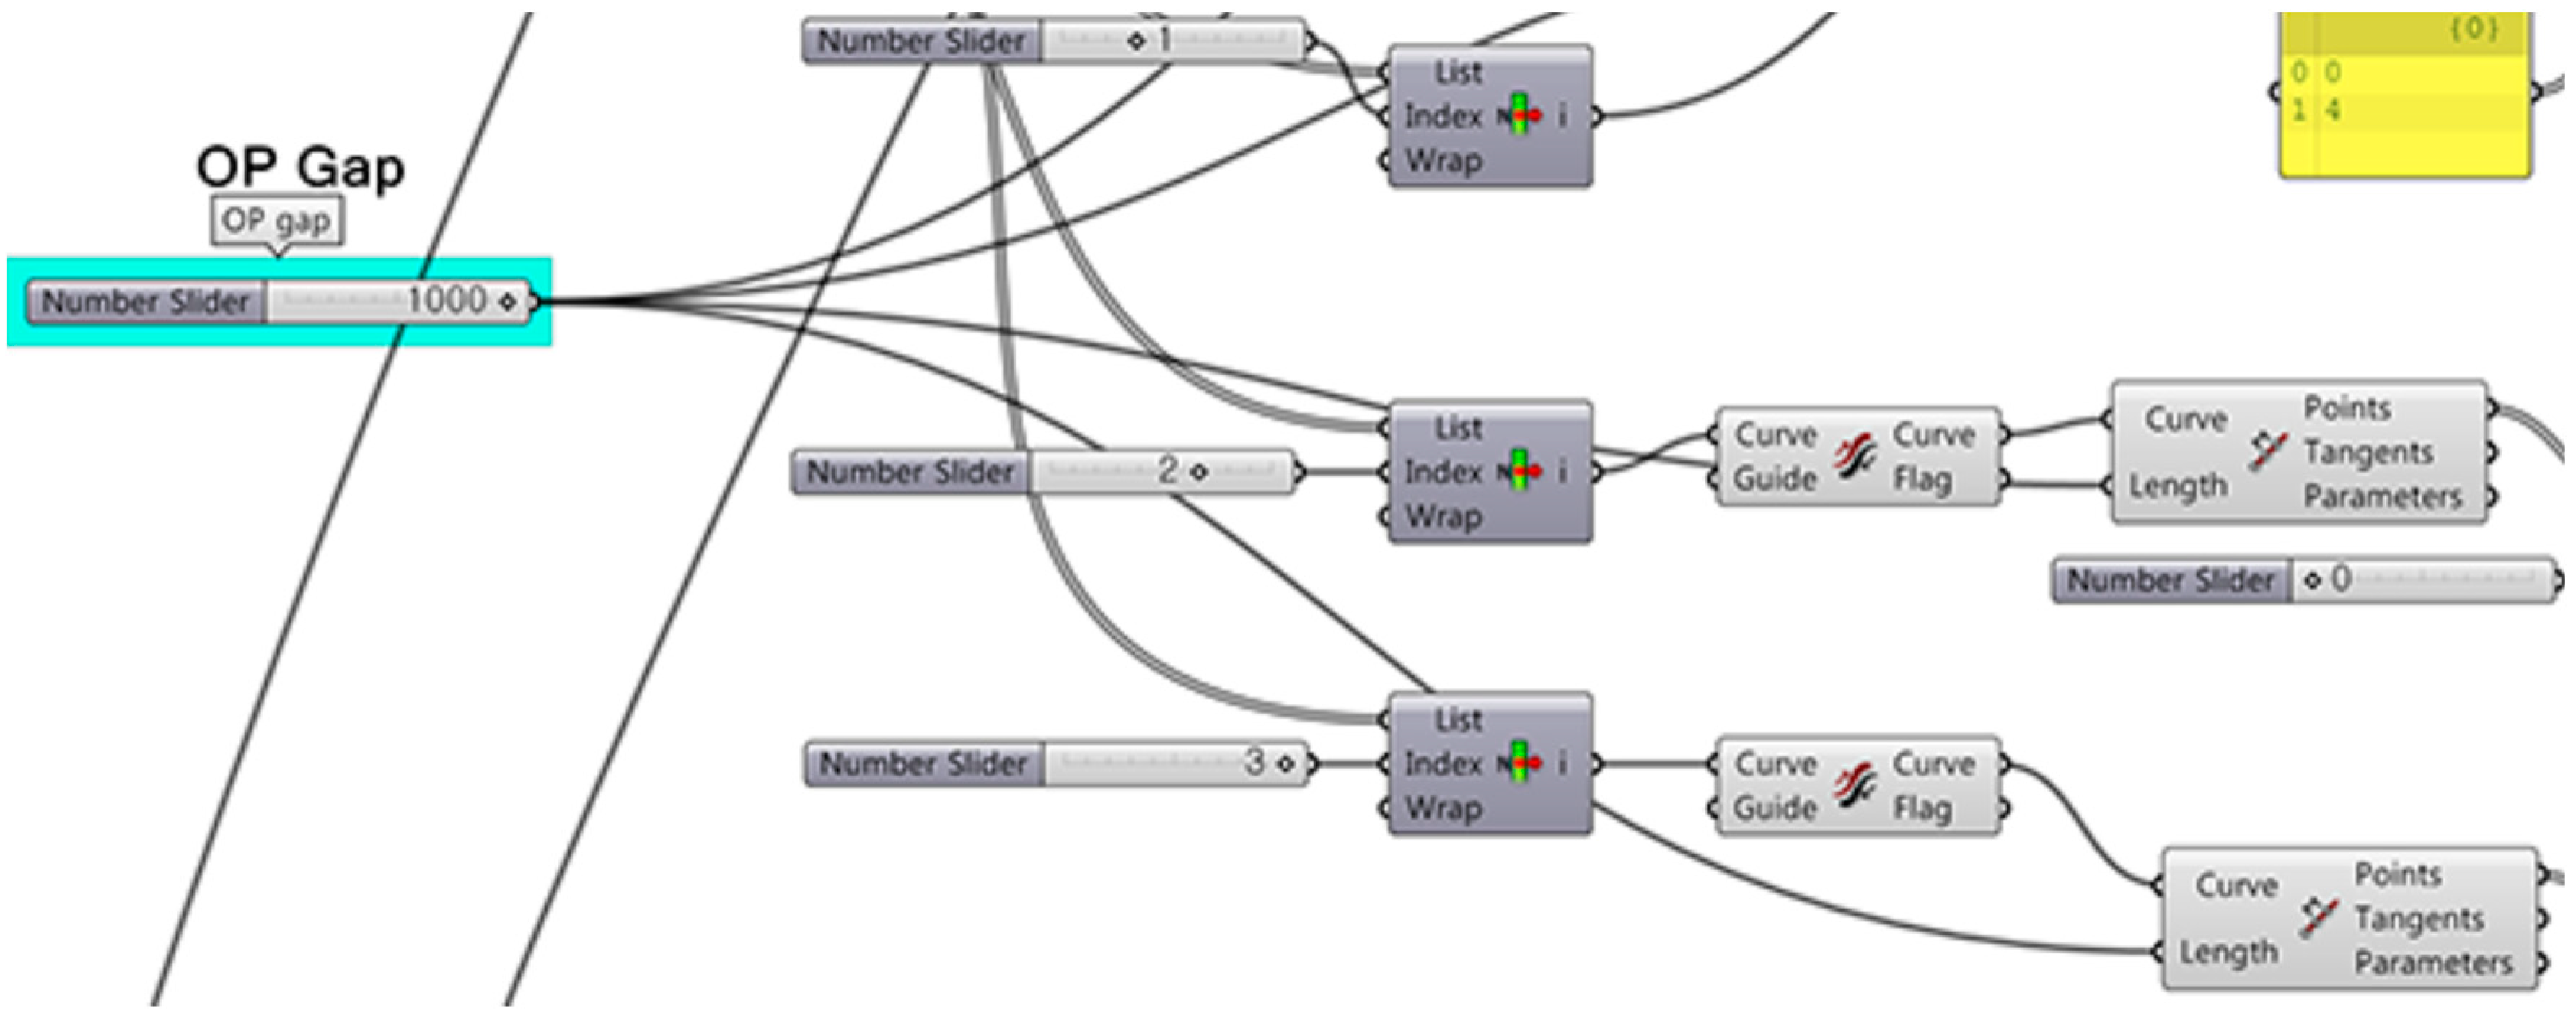
To set the observation point first involves constructing the grids that are used to create the observation points in the space at the eye level of the observer. The spacing of grids and the height of the observation point are used as input parameters. In the next step, an algorithm is generated to select an observation point on the grids. These points can be chosen at the grid intersection created above. Depending on the spacing of the grids on the surface generated previously, the number of observation points is also defined.
In order to measure visibility, the following inputs were integrated into the algorithm:
- Selecting observer eye level for the height of the observation point.
- Setting the observation point gap.
- Setting the total number of observation points.
- Inputting the number of isovist rays.
- Calculating average visibility, prospect area visibility (P), refuge area visibility (R), and visibility (P–R)
The parametric model features can generate many observer points, depending on the spacing between the observer points and the simulation model area, so measuring visibility at all the observer points can take a lot of effort and time. Therefore, this study selected the observer points in sequence and recorded the results of the automatic calculation of visibility at each selected point. These results are also recorded in an Excel file using Grasshopper’s gHowl plug-in.
4. Exploration of Window Design Alternatives
Based on previous studies and 3D modeled simulation unit, this study defined a range of parameter values to preserve the constraints of parametric models for the window design and the measurement of prospect-refuge (Table 4) [20]. With the defined parametric design model, 788 design alternatives were generated for windows. In Appendix A, Table A1 illustrates some of them.
Table 4.
Parametric values for design alternatives.
The conditions and characteristics of the prospect-refuge in a space were explained according to the design of the window presented. First, the average of the visibility in the design alternatives for the windows ranged from 0.0057 to 0.1207. Moreover, the difference in the visibility between the prospect and refuge areas was between 0.0113 and −0.0090. Interestingly, the difference shows a negative value. This study used the assumption that visibility is high when the conditions of prospect are strong at a location close to the window, whereas the visibility becomes weaker as the distance from the window increases. However, as a result of the analysis of the design alternatives, there were cases in which the visibility was reduced in the vicinity of the window, contrary to the assumption that was set at the beginning of the study. To identify the relationships between the visibility with the window size, location, aspect ratio, and shape, and statistical analysis was conducted.
4.1. WWR (Size), Location of Window
According to a regression analysis, WWR is significantly related to average visibility (V(A)). However, in the quadratic relation, the coefficient of R2 is not significant (Table 5). In other words, statistically, visibility and WWR are interpreted as being in a simple linear relationship (Figure 8a). As WWR increases, the average visibility in the whole observation points is increasing in line with the increase in the window area. On the other hand, although there is a significant relationship between the window location and average visibility, the R2 value is too low for it to be possible to predict the linear or quadratic relationship (Figure 8b,c).
Table 5.
R2 values from regression analysis: the relation between average visibility_V(A) at window size_WWR, horizontal location_Ho, and vertical location_Ve.
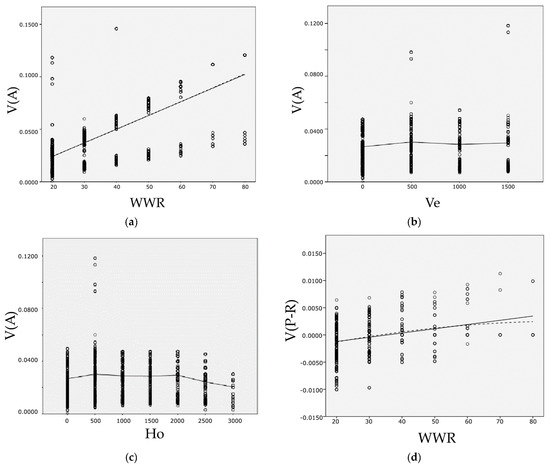
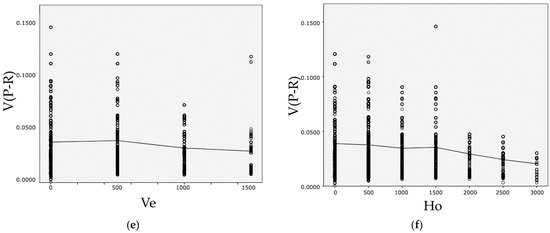
Figure 8.
Scatter plot: (a) Average visibility_V(A) and size_WWR; (b) Average visibility_V(A) and horizontal location_Ho; (c) Average visibility_V(A) and vertical location_Ve; (d) Visibility difference between the prospect area and refuge area_V(P-R) and size_WWR; (e) Visibility difference between the prospect area and refuge area_V(P-R) and horizontal location_Ho; and (f) Visibility difference between the prospect and refuge area_V(P-R) and vertical location_Ve.
The difference in visibility between the prospect area and the refuge area, according to the size of the window is shown in Table 6.
Table 6.
R2 values from regression analysis: the relation between the visibility difference of the prospect and refuge area_V(P-R) at window size_WWR, horizontal location_Ho, and vertical location_Ve.
WWR is also significantly related to the difference in visibility between the prospect area and refuge area (V(P-R)). In addition, in the quadratic relation, the coefficient of R2 is not significant, that is, V(P-R) and WWR are statistically in a simple linear relationship (Figure 8d). Moreover, Figure 8e,f shows a significant relationship between the window location and V(P-R), the R2 value is also too low to identify the linear or quadratic relationship.
4.2. Aspect Ratio and Shape of Window
As the aspect ratio and shape of the window are categorical data, One-Way ANOVA was conducted to identify the differences between the groups and also within each group. Table 7 shows the results:
Table 7.
Results of one-way ANOVA: Means of average visibility_V(A) with the aspect ratio_AR and shape of window_SP.
In two cases, the probability of significance is 0.000, which means that the difference in the group is significant. Moreover, the means plot graph shows the points where the average value of visibility in the window aspect ratio and shape is high or low and its change trend (Figure 9). In the aspect ratio, the average value of visibility is lowest in 1:3 ratio, the highest in 2:1. In the inward tapering shape of the window shape has low visibility, the outward tapering shape has high visibility, and the parallel or parallelogram shape has almost the same visibility average value. Moreover, through One-Way ANOVA, the differences between the groups and within each group were also identified in the relationships between the visibility difference of the prospect area and refuge area and the aspect ratio of the window or the shape of the window (Table 8).
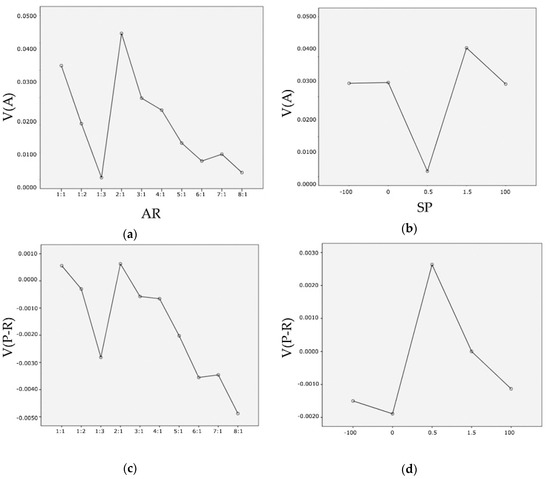
Figure 9.
One-way ANOVA means plot: (a) Average visibility_V(A) and aspect ratio_AR; (b) Average visibility_V(A) and shape_SP; (c) Visibility difference between the prospect area and refuge area_V(P-R) and aspect ratio_AR; and (d) Visibility difference between the prospect and refuge area_V(P-R) and Shape_SP.
Table 8.
Results of one-way ANOVA: Means of visibility difference of the prospect and refuge area_V(P-R) with the aspect ratio_AR and shape of window_SP.
The graph is similar to the average visibility. The probability of significance is also 0.000, so the difference in the group is significant. Moreover, the means plot graph shows the points where the visibility difference in the window aspect ratio and shape is high or low and its change trend (Figure 9). In the aspect ratio, the visibility difference of the prospect area and refuge area (V(P-R)) is lowest in 1:3 ratios, the highest in 1:1 and 2:1. The tapering inward of the window shape has low visibility, while the tapering outward has high visibility.
Through the analysis of design alternatives, it was confirmed that the parameters of the window in this study were meaningful as a design element for spatial prospect and refuge characteristics. WWR alone has a direct impact on visibility, but other elements are closely related to each other and affect visibility.
5. Conclusions
In this study, a parametric model was built and employed to develop a parametric design of prospect and refuge in the test space, and to propose design alternatives according to input variable values for window design. As the parameters of window design are window size, aspect ratio, location, and shape, the input values were the width and height value, horizontal and vertical position, and the five sectional shapes of the window. This study created design alternatives for windows based on these parameters. Subsequently, we developed a numerical analysis methodology that measured prospect and refuge based on 3D visibility. To do this, it was important to establish an observation point. Thus, input parameters were the height of the observation point, number of grids, and spacing of grids to determine the observer viewpoint. The number of isovist rays was also an input parameter to measure visibility. Thereafter, it analyzed the characteristics of design alternatives and space provided by the proposed parametric model.
Based on the exploration of design alternatives, we identified the impact of window design variables on visibility. Part of visibility results confirmed the findings of previous research. As the WWR is an important metric for architectural design, it helps to enhance the conditions of prospect and refuge in a space. As the WWR value increases, the visibility of the entire space increases, and the difference in visibility between the prospect and the refuge area decreases. Moreover, there is a difference in visibility depending on the aspect ratio, location, and shape of the window. In particular, the tapering inwards shape reduces the overall visibility and creates a more distinct difference in visibility between the prospect and refuge areas. The location and proportions of the window, rather than having a distinct tendency, appear to affect visibility in conjunction with other variables.
The greatest advantage of the design method proposed in this study is that it generates design alternatives with various parameters that consider the visibility or partial visibility of the entire space. Based on the change in visibility, the prospect and refuge areas can be provided. As defined in the scope of this study, the parametric model proposed in this study is limited to window design. For the greatest psychological benefit, and an understanding of residents’ comprehensive environmental preferences in a space, studies on all prospect-refuge design elements would be required. One additional design element for future research might be the close relationship between prospect-refuge and the size and depth of a space [5,27]. In addition, this study recognized variable and interrelated design elements for window design, which may lead to further empirical research to confirm new findings for prospect-refuge design elements. In this regard, it is desirable to focus on resident psychological experiments with the stimuli proposed in this study, considering the many variables of creative design.
Author Contributions
Data curation, J.H.H.; Formal analysis, J.H.H.; Methodology, H.L.; Software, J.H.H.; Supervision, H.L.; Validation, H.L.; Visualization, J.H.H.; Writing—original draft, J.H.H.; Writing—review & editing, H.L.
Funding
This work was supported by the BK21 Plus funded by the Ministry of Education of Korea; the Graduate School of YONSEI University Research Scholarship Grants in 2017; the National Research Foundation of Korea (NRF) grant funded by the Korea government(MSIT) (NRF-2015R1D1A1A09061276); Basic Science Research Program through the National Research Foundation of Korea (NRF) funded by the Ministry of Education (NRF-2018R1A6A3A01012857).
Conflicts of Interest
The authors declare no conflict of interest.
Appendix A
Table A1.
Examples of window design alternatives.
Table A1.
Examples of window design alternatives.
| Alternatives | 3 | 25 | 31 | 43 | 54 | 55 | 56 | 57 | 58 |
| Modeling Indoor view |  |  |  |  |  |  |  |  |  |
| Visibility (average) | 0.0279 | 0.0350 | 0.0251 | 0.0350 | 0.0256 | 0.0272 | 0.0272 | 0.0293 | 0.0311 |
| Visibility (P-R) | −0.0051 | 0.0064 | 0.0000 | 0.0064 | −0.0028 | −0.0029 | −0.0029 | −0.0009 | −0.0010 |
| >Alternatives | >59 | >60 | >61 | >62 | >63 | >64 | >65 | >66 | >67 |
| Modeling Indoor view |  |  |  |  |  |  |  |  |  |
| Visibility (average) | 0.0311 | 0.0296 | 0.0337 | 0.0314 | 0.0296 | 0.0314 | 0.0314 | 0.0293 | 0.0311 |
| Visibility (P-R) | −0.0010 | −0.0019 | 0.0015 | −0.0020 | 0.0000 | 0.0000 | 0.0000 | −0.0009 | −0.0010 |
| Alternatives | 68 | 69 | 70 | 71 | 131 | 132 | 134 | 144 | 152 |
| Modeling Indoor view |  |  |  |  |  |  |  |  |  |
| Visibility (average) | 0.0311 | 0.0250 | 0.0265 | 0.0265 | 0.0310 | 0.0310 | 0.0310 | 0.0103 | 0.0312 |
| Visibility (P-R) | −0.0010 | −0.0019 | −0.0020 | −0.0020 | −0.0007 | −0.0007 | −0.0007 | 0.0012 | 0.0000 |
| Alternatives | 162 | 174 | 190 | 258 | 302 | 334 | 336 | 366 | 382 |
| Modeling Indoor view |  |  |  |  |  |  |  |  |  |
| Visibility (average) | 0.0303 | 0.0316 | 0.0290 | 0.0278 | 0.0279 | 0.0289 | 0.0225 | 0.0312 | 0.0268 |
| Visibility (P-R) | −0.0007 | 0.0040 | −0.0036 | −0.0040 | 0.0000 | −0.0044 | −0.0090 | −0.0047 | −0.0050 |
| Alternatives | 467 | 630 | 666 | 715 | 739 | 759 | 774 | 776 | 781 |
| Modeling Indoor view |  |  |  |  |  |  |  |  |  |
| Visibility (average) | 0.0465 | 0.0619 | 0.0631 | 0.0758 | 0.0712 | 0.0911 | 0.1117 | 0.0381 | 0.1207 |
| Visibility (P-R) | −0.0008 | 0.0000 | 0.0000 | 0.0000 | −0.0048 | 0.0000 | 0.0000 | 0.0113 | 0.0000 |
References
- Augustin, S. Place Advantage: Applied Psychology for Interior Architecture; John Wiley & Sons: Hoboken, NJ, USA, 2009. [Google Scholar]
- Dosen, A.S.; Ostwald, M.J. Evidence for prospect-refuge theory: A meta-analysis of the findings of environmental preference research. City Territ. Arch. 2016, 3, 1–14. [Google Scholar] [CrossRef]
- Keedwell, P. Headspace: The Psychology of City Living; Aurum Press: London, UK, 2017. [Google Scholar]
- Appleton, J. The Experience of Landscape; Wiley: New York, NY, USA, 1996. [Google Scholar]
- Browning, W.; Ryan, C.; Clancy, J. 14 Patterns of Biophilic Design Improving Health & Well-Being in the Built Environment; Terrapin Bright Green LLC: New York, NY, USA; Washington, DC, USA, 2014. [Google Scholar]
- Heerwagen, J.; Hase, B. Building Biophilia: Connecting People to Nature in Building Design. Environ. Des. Constr. 2001, 3, 30–36. [Google Scholar]
- Kellert, S.R.; Heerwagen, J.; Mador, M. Biophilic Design: The Theory, Science, and Practice of Bringing Buildings to Life; John Wiley & Sons: Hoboken, NJ, USA, 2008. [Google Scholar]
- Alkhresheh, M.M. Preference for void-to-solid ratio in residential facades. J. Environ. Psychol. 2012, 32, 234–245. [Google Scholar] [CrossRef]
- Indraprasthaa, A.; Shinozakib, M. Computational models for measuring spatial quality of interior design in virtual environment. Build. Environ. 2012, 49, 67–85. [Google Scholar] [CrossRef]
- Ochoa, C.E.; Aries, M.B.C.; Loenen, E.J.V.; Hensen, J.L.M. Considerations on design optimization criteria for windows providing low energy consumption and high visual comfort. Appl. Energy 2012, 95, 238–245. [Google Scholar] [CrossRef] [Green Version]
- Stamps, A.E. Interior Prospect and Refuge. Percept. Mot. Skills 2006, 103, 643–653. [Google Scholar] [CrossRef] [PubMed]
- Dawes, M.J.; Ostwald, M.J. Testing the ‘Wright Space’: Using isovists to analyse prospect-refuge characteristics in Usonian architecture. J. Arch. 2014, 19, 645–666. [Google Scholar] [CrossRef]
- Dawes, M.J.; Ostwald, M.J. Prospect-Refuge theory and the textile-block houses of Frank Lloyd Wright: An analysis of spatio-visual characteristics using isovists. Build. Environ. 2014, 80, 228–240. [Google Scholar] [CrossRef]
- Dosen, A.S.; Ostwald, M.J. Methodological characteristics of research testing prospect–refuge theory: A comparative analysis. Arch. Sci. Rev. 2013, 56, 232–241. [Google Scholar] [CrossRef]
- Ostwald, M.J.; Dawes, M. Prospect-refuge patterns in Frank Lloyd Wright’s Prairie houses: Using isovist fields to examine the evidence. J. Space Syntax 2013, 4, 136–159. [Google Scholar]
- Bhatia, S.; Chalup, S.K.; Ostwald, M.J. Analyzing architectural space: Identifying salient regions by computing 3D isovists. In Proceedings of the 46th Annual Conference of the Architectural Science Association (AN-ZAScA); Griffith University: Gold Coast, Australia, 2012. [Google Scholar]
- Karle, D.; Kelly, B. Year, Parametric Thinking. In Proceedings of the Proceedings of ACADIA Regional 2011 Conference, Lincoln, NE, USA, 10–11 March 2011; pp. 109–113. [Google Scholar]
- Woodbury, R. Elements of Parametric Design; Routledge: London, UK; New York, NY, USA, 2010. [Google Scholar]
- Gu, N.; Yu, R.; Ostwald, M. Computational Analysis and Generation of Traditional Chinese Private Gardens Through Space Syntax and Parametric Design. In Proceedings of the 21st International Conference of the Association for Computer-Aided Architectural Design Research in Asia CAADRIA 2016, Melbourne, Australia, 30 March–2 April 2016; pp. 95–104. [Google Scholar]
- Hwang, J.H. A Parametric Design Model of Prospect and Refuge Towards Psychological Satisfaction; Yonsei University: Seoul, Korea, 2018. [Google Scholar]
- Hwang, J.-H.; Lee, H. A Parametric Design Model for Numerically Measuring the Design Attributes of Prospect-Refuge. In Proceedings of the CAADRIA 2018, Beijing, China, 17–19 May 2018; pp. 577–586. [Google Scholar]
- Hildebrand, G. Origins of Architectural Pleasure; University of California Press: Berkeley, CA, USA, 1999. [Google Scholar]
- Ulrich, R.S. Biophilia, biophobia, and natural landscapes. In The Biophilia Hypothesis; Island Press: Washington, DC, USA, 1993; pp. 73–137. [Google Scholar]
- Orians, G.H. An evolutionary perspective on aesthetics. Bull. Psychol. Arts 2001, 2, 25–29. [Google Scholar]
- Roberts, J.W. Prospect-Refuge Theory and Alvar Aalto’s Experimental House at Muuratsalo: ‘What is it that We Like about Aalto's Site-Related Architecture, and Why?’. In Proceedings of the Twentieth Annual Conference of the Society of Architectural Historians (SAHANZ), Sydney, Australia, 15–19 April 2014; pp. 263–268. [Google Scholar]
- Gallagher, W. House Thinking; Harper Perennial: New York, NY, USA, 2007. [Google Scholar]
- Ramzy, N.S. Biophilic qualities of historical architecture: In quest of the timelessterminologies of ‘life’ in architectural expression. Sustain. Cities Soc. 2015, 15, 42–56. [Google Scholar] [CrossRef]
- Dosen, A.S.; Ostwald, M.J. Prospect and refuge theory: Constructing a critical definition for architecture and design. Int. J. Des. Soc. 2013, 6, 9–24. [Google Scholar] [CrossRef]
- Bokharaei, S.; Nasar, J.L. Perceived Spaciousness and Preference in Sequential Experience. Hum. Factors 2016, 58, 1069–1081. [Google Scholar] [CrossRef] [PubMed]
- Hayward, S.C.; Franklin, S.S. Perceived Openness-Enclosure of Architectural Space. Environ. Behav. 1974, 6, 37–52. [Google Scholar]
- Stamps, A.E. Isovists, enclosure, and permeability theory. Environ. Plan. B Plan. Des. 2005, 32, 735–762. [Google Scholar] [CrossRef]
- Stamps, A.E. Some Findings on Prospect and Refuge I. Percept. Mot. Skills 2008, 2008, 147–162. [Google Scholar] [CrossRef] [PubMed]
- Jung, J.-H.; Kim, S.-Y. A Study on the Analysis Technique and Evaluation Method of the View from Inner Side of Apartment Housing on the Planning Stage of Layout. Arch. Inst. Korea 2010, 26, 261–270. [Google Scholar]
- Kim, I.-H.; Kang, Y.-H.; Hwa, N.-H.; Doe, G.-Y. A Study on the Changes of Openness in Relation to Different Window to Wall Ratio of Buildings in Coastal areas. Arch. Inst. Korea 2014, 16, 235–243. [Google Scholar] [CrossRef]
- Kim, K.-H.; Kim, B.-S. A Study on the Viewpoint to Evaluate the View in the Apartment Unit. J. Arch. Inst. Korea 2004, 20, 149–158. [Google Scholar]
- Piao, G.-S.; Choi, J. The Proposal & Application of Visual Access and Exposure Model Considering ‘the Frequency of the Observer Visit’. J. Arch. Inst. Korea Plan. Des. 2013, 29, 63–70. [Google Scholar]
- Pinsly, D.S.; Fisher-Gewirtzman, D.; Burt, M. ‘Visual exposure’ analysis model: A comparative evaluation of three case studies. Urban. Des. Int. 2007, 12, 155–168. [Google Scholar] [CrossRef]
- Stamps, A.E. Effects of Permeability on Perceived Enclosure and Spaciousness. Environ. Behav. 2010, 42, 864–886. [Google Scholar] [CrossRef]
- Putra, S.Y.; Yang, P.J. Analysing Mental Geography of Residential Environment in Singapore using GIS-based 3D Visibility Analysis. In Proceedings of the International Conference ‘Doing, Thinking, Feeling Home: The Mental Geography of Residential Environments’, Delft, The Netherlands, 14–15 October 2005. [Google Scholar]
- Gibson, J.J. The Ecological Approach to Visual Perception; Lawrence Erlbaum Associates Inc.: Mahwah, NJ, USA, 1986. [Google Scholar]
- Batty, M. Exploring isovist fields: Space and shape in architectural and urban morphology. Environ. Plan. B Plan. Des. 2001, 28, 123–150. [Google Scholar] [CrossRef]
- Benedikt, M.L. To take hold of space: Isovists and isovist fields. Environ. Plan. B Plan. Des. 1979, 6, 47–65. [Google Scholar] [CrossRef]
- Herzog, T.; Krippner, R.; Lang, W. Facade Construction Manual; Birkhauser: Basel, Switzerland, 2004. [Google Scholar]
- Wang, T.-H. Customizing Pattern-Based Tessellation for NURBS Surface Reconstruction with Irregular Boundary Conditions; Carnegie Mellon University: Pittsburgh, PA, USA, 2012. [Google Scholar]
- Almusharaf, A.M.; Elnimeiri, M. A performance-based design approach for early tall building form development. In Proceedings of the 5th International Conference Proceedings of the Arab Society for Computer Aided Architectural Design, Fez, Morocco, 19–21 October 2010; pp. 19–21. [Google Scholar]
- Park, J.-D.; Lee, Y.-K.; Kim, D.-W. A Parametric Analysis for Daylighting Driven Design Optimization of Office Buildings. Arch. Inst. Korea 2015, 31, 21–28. [Google Scholar]
- Anderson, J.; Tang, M. Form Follows Parameters: Parametric modeling for fabrication and manufacturing processes. In Proceedings of the 16th International Conference on Computer-Aided Architectural Design Research in Asia, Newcastle, Australia, 27–29 April 2011; pp. 91–100. [Google Scholar]
- Kwon, S.-H.; Jun, H.-J. A Study on the Representation of Knowledge and Use of Han-ok Components based on Parametric Design. Arch. Inst. Korea 2016, 30, 101–110. [Google Scholar]
- Beirão, J.; Arrobas, P.; Duarte, J. Parametric Urban Design: Joining morphology and urban indicators in a single interactive model. In Proceedings of the 30th eCAADe Conference, Prague, Czech Republic, 12–14 September 2012; pp. 167–175. [Google Scholar]
- Bielik, M.; Schneider, S.; König, R. Parametric Urban Patterns: Exploring and integrating graph-based spatial properties in parametric urban modelling. In Proceedings of the 30th eCAADe Conference, Prague, Czech Republic; pp. 701–708.
- AIA. Integrated Project Delivery: A Guide; AIA: New York, NY, USA, 2007. [Google Scholar]
- Davis, D. Modelled on Software Engineering: Flexible Parametric Models in the Practice of Architecture; RMIT University: Melbourne, Australia, 2013. [Google Scholar]
- Hudson, R. Strategies for Parametric Design in Architecture; University of Bath: Bath, UK, 2010. [Google Scholar]
- Stavric, M.; Marina, O. Parametric Modeling for Advanced Architecture. Int. J. Appl. Math. Inform. 2011, 5, 9–16. [Google Scholar]
- Aish, R. From Intuition to Precision. In Proceedings of the 23rd eCAADe, Lisbon, Portugal, 21–24 September 2005; pp. 10–14. [Google Scholar]
- Katz, N.C. Algorithmic Modeling; Parametric Thinking: Computational Solutions to Design Problems. In Proceedings of the 5th International Conference on Arab Society for Computer Aided Architectural Design, Fez, Morocco, 19–21 October 2010; pp. 19–36. [Google Scholar]
© 2018 by the authors. Licensee MDPI, Basel, Switzerland. This article is an open access article distributed under the terms and conditions of the Creative Commons Attribution (CC BY) license (http://creativecommons.org/licenses/by/4.0/).