Quantitative Analysis on the Influence Factors of the Sustainable Water Resource Management Performance in Irrigation Areas: An Empirical Research from China

Abstract
1. Introduction
2. Development of Index Systems
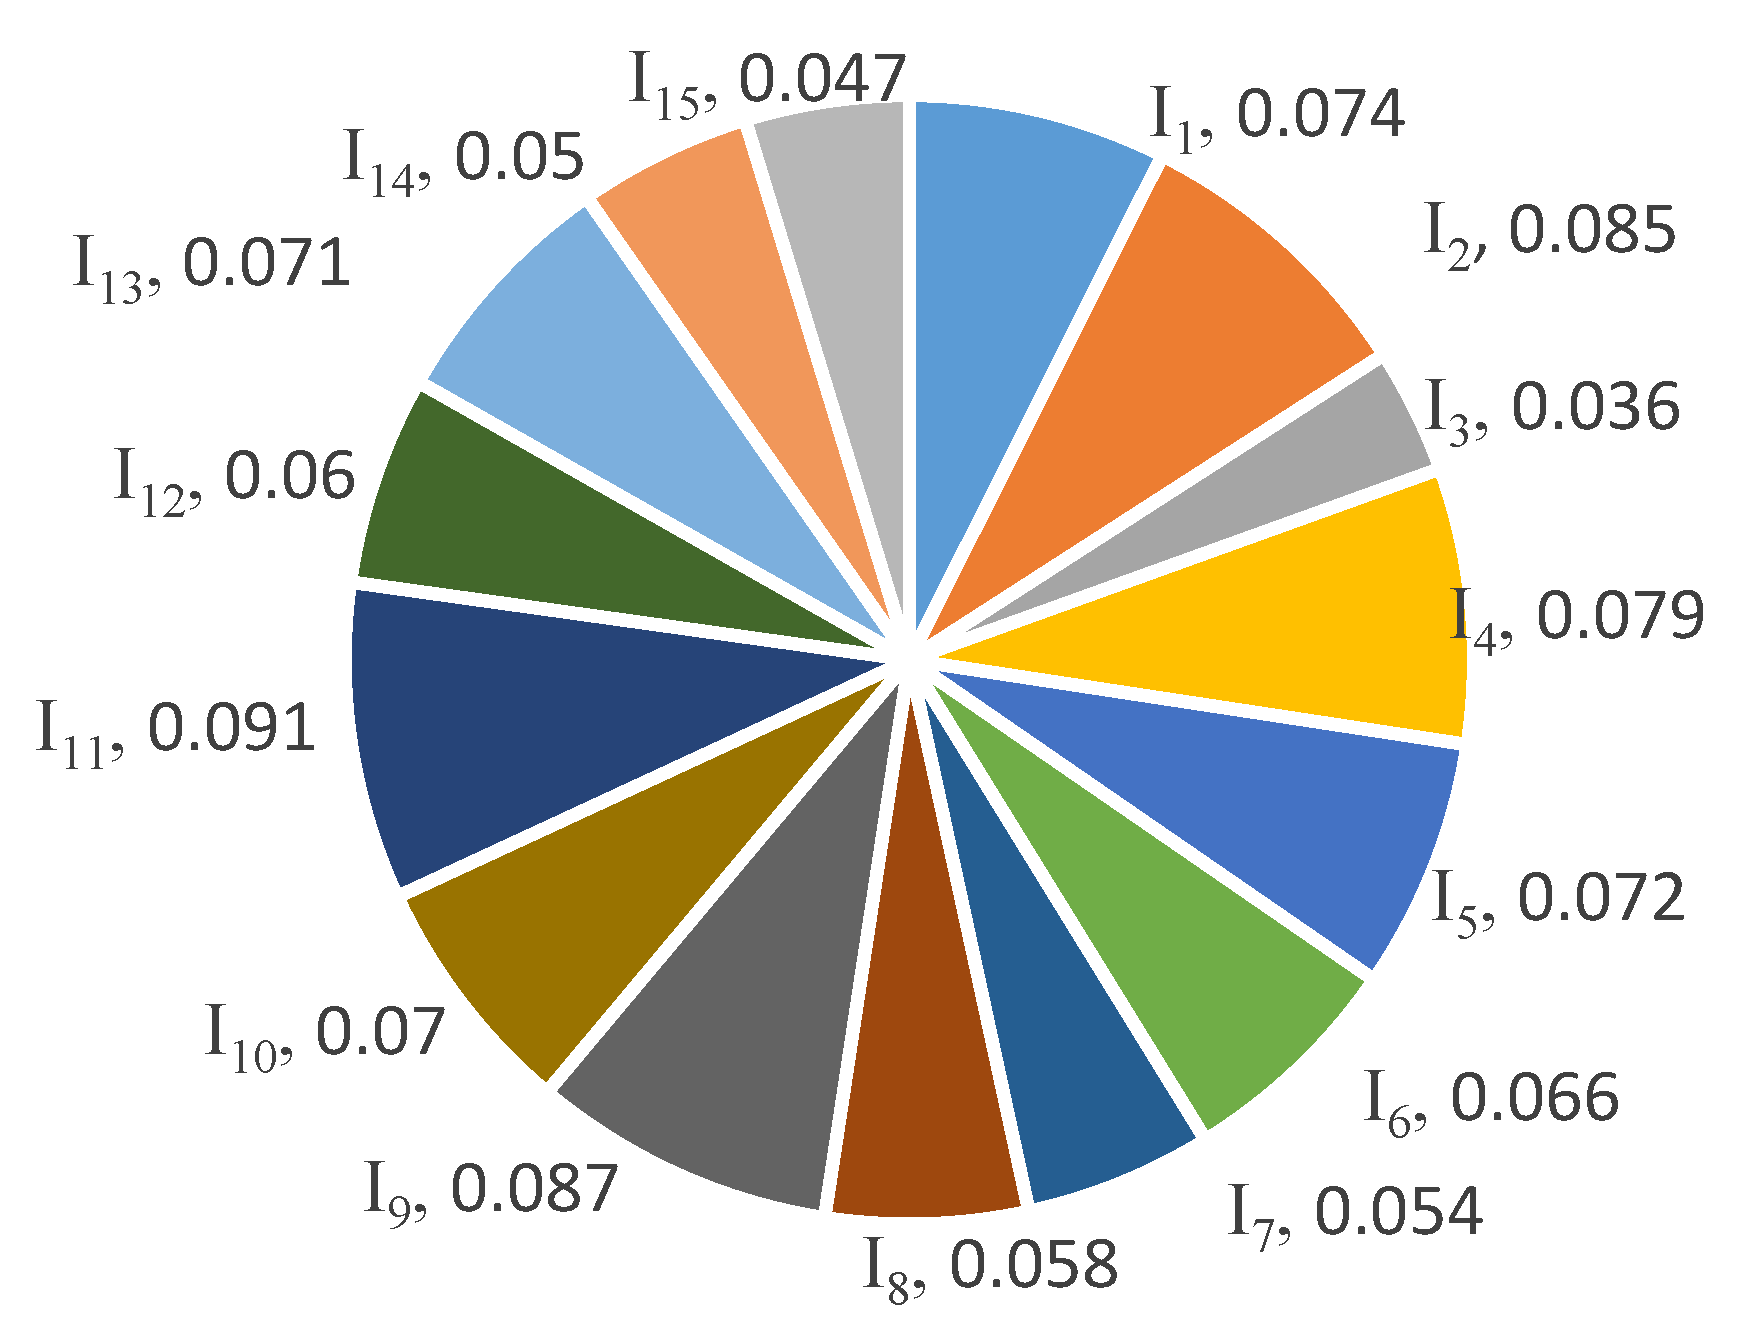
2.1. The Performance Index System
2.2. The Influence Factors Index System
3. Methodology
3.1. Accounting Method of the Performance Index Values
3.2. Accounting Method of Influence Factors Index Values
3.3. Quantitative Regression Analysis Model
4. Empirical Research
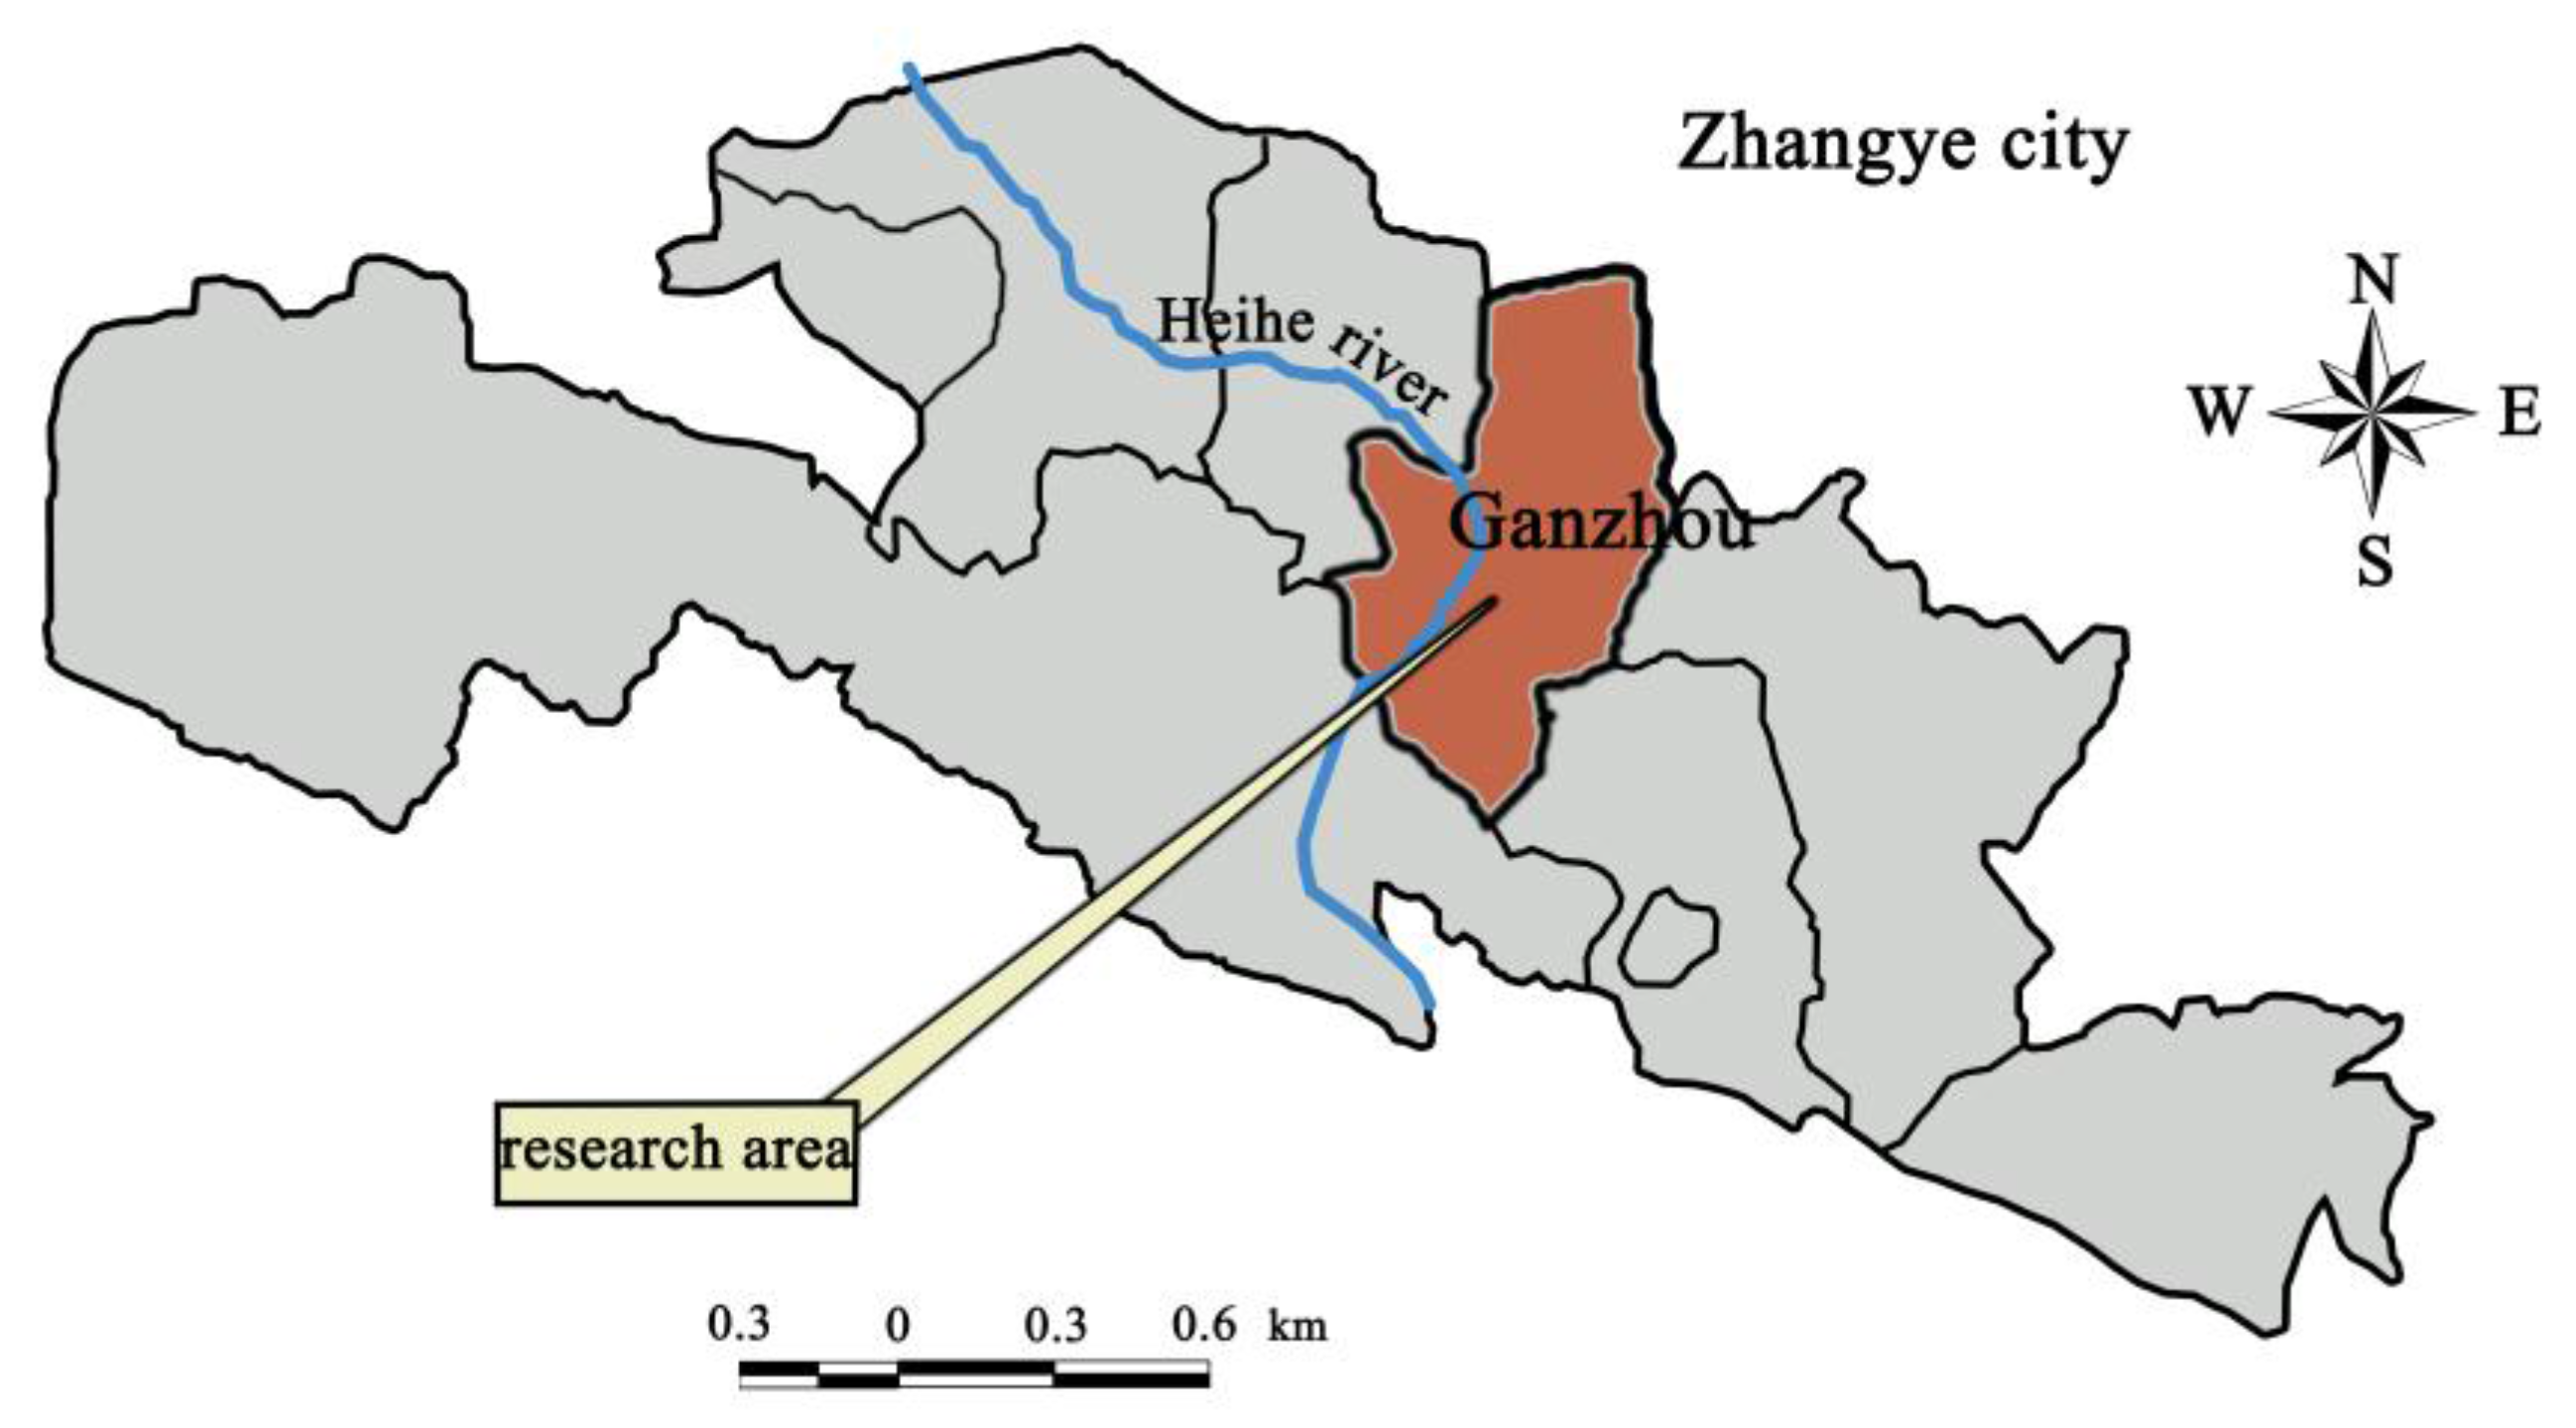
4.1. Data Source
4.2. Results and Analysis
4.2.1. Analysis on the Influence Factors of Overall Performance
4.2.2. Analysis on the Influence Factors of Environment Performance
4.2.3. Analysis on the Influence Factors of Social Performance
4.2.4. Analysis on the Influence Factors of Economic Performance
4.2.5. Analysis on the Influence Factors of Organizational Performance
5. Conclusions and Recommendations
Acknowledgments
Author Contributions
Conflicts of Interest
Appendix A

| Irrigation Areas | Ecological Sustainability Index | Water Use Social Equity Index | Water Use Efficiency Index | Management Operation Efficiency Index | Overall Performance Index |
|---|---|---|---|---|---|
| Daman | 0.031 | 0.120 | 0.042 | 0.083 | 0.281 |
| Yingke | 0.038 | 0.086 | 0.063 | 0.041 | 0.228 |
| Wujiang | 0.048 | 0.093 | 0.025 | 0.073 | 0.239 |
| Yigan | 0.034 | 0.114 | 0.072 | 0.026 | 0.247 |
| Ganjun | 0.022 | 0.091 | 0.086 | 0.069 | 0.268 |
| Shangsan | 0.031 | 0.082 | 0.077 | 0.107 | 0.297 |
| Anyang | 0.012 | 0.191 | 0.030 | 0.049 | 0.282 |
| Huazhai | 0.043 | 0.114 | 0.036 | 0.032 | 0.255 |
| Influence Factor Indicators | Irrigation Areas | |||||||
|---|---|---|---|---|---|---|---|---|
| Daman | Yingke | Wujiang | Xigan | Ganjun | Shangsan | Anyang | Huazhai | |
| X1 | 0.571 | 0.840 | 0.529 | 0.430 | 0.414 | 0.426 | −1.634 | −1.575 |
| X2 | −0.416 | 0.571 | 0.200 | 0.324 | 0.817 | 1.311 | −1.527 | −1.280 |
| X3 | −0.551 | 0.975 | 1.144 | 1.229 | 0.127 | −0.975 | −1.144 | −0.805 |
| D1 | 1.049 | −0.150 | −0.150 | 1.049 | 1.049 | −0.150 | −1.348 | −1.348 |
| D2 | 0.354 | 0.354 | 0.354 | 0.354 | 0.354 | −2.475 | 0.354 | 0.354 |
| D3 | −0.540 | −0.540 | 1.620 | −0.540 | 1.620 | −0.540 | −0.540 | −0.540 |
| X4 | −0.900 | −0.346 | 1.869 | −0.346 | −0.267 | −0.425 | 1.236 | −0.821 |
| X5 | 0.000 | 0.000 | 0.000 | 0.000 | 0.000 | 0.000 | 0.000 | 0.000 |
| X6 | −0.581 | 0.675 | 0.518 | 0.675 | −0.581 | 0.675 | 0.675 | −2.057 |
| X7 | 1.480 | −0.461 | 0.509 | 1.286 | −0.461 | −0.461 | −0.461 | −1.431 |
| D4 | 0.000 | 0.000 | 0.000 | 0.000 | 0.000 | 0.000 | 0.000 | 0.000 |
| D5 | 0.000 | 0.000 | 0.000 | 0.000 | 0.000 | 0.000 | 0.000 | 0.000 |
| D6 | 0.725 | 0.725 | −1.208 | −1.208 | 0.725 | 0.725 | 0.725 | −1.208 |
| X8 | 1.348 | −0.449 | 0.150 | 0.150 | −1.049 | 0.749 | −1.648 | 0.749 |
| X9 | −0.661 | 1.984 | −0.661 | −0.661 | −0.661 | 0.661 | −0.661 | 0.661 |
| X10 | −0.883 | 0.896 | 0.489 | −0.629 | 1.659 | −0.273 | −1.392 | 0.133 |
| X11 | −1.347 | 0.527 | −1.113 | 0.762 | 1.230 | −0.644 | 0.996 | −0.410 |
| D7 | 0.000 | 0.000 | 0.000 | 0.000 | 0.000 | 0.000 | 0.000 | 0.000 |
| D8 | 0.000 | 0.000 | 0.000 | 0.000 | 0.000 | 0.000 | 0.000 | 0.000 |
| X12 | 1.273 | 1.273 | 0.075 | 0.674 | −1.423 | −0.824 | −0.374 | −0.674 |
| D9 | 0.354 | 1.768 | −1.061 | −1.061 | 0.354 | 0.354 | −1.061 | 0.354 |
| D10 | 0.382 | 1.146 | −0.382 | −0.382 | −1.909 | −0.382 | 1.146 | 0.382 |
| X13 | 1.438 | 0.214 | −0.275 | −1.499 | 1.193 | −1.010 | −0.275 | 0.214 |
| X14 | 0.242 | −0.835 | −0.404 | 0.027 | 1.104 | 1.750 | −1.050 | −0.835 |
| X15 | 0.000 | 0.000 | 0.000 | 0.000 | 0.000 | 0.000 | 0.000 | 0.000 |
| X16 | −2.042 | −0.212 | 0.441 | 0.964 | 0.310 | −0.735 | 0.964 | 0.310 |
| X17 | −1.142 | 1.033 | −0.417 | −1.142 | −0.562 | −0.127 | 1.323 | 1.033 |
References
- Zhou, W.B.; Li, P.C. Water environment problem of irrigation in China. Adv. Water Sci. 2001, 12, 413–417. [Google Scholar]
- Fu, Z.Y. Soil and water environment problems and countermeasures in irrigation areas. Chin. Sci. Tech. Asp. 2015, 13, 14. [Google Scholar]
- Yilihamiya, A. Problems of water environment in irrigation and its control measures. Heilongjiang Hydr. Sci. Tech. 2016, 44, 105–107. [Google Scholar]
- Global Water Partnership (GWP). Catalyzing Change: A Handbook for Developing Integrated Water Resources Management (IWRM) and Water Efficiency Strategies; GWP Secretariat: Stockholm, Sweden, 2005. [Google Scholar]
- Global Water Partnership (GWP). Monitoring and Evaluation Indicators for IWRM Strategies and Plans (Technical Brief 3); GWP Secretariat: Stockholm, Sweden, 2006. [Google Scholar]
- Hooper, B.P.; Ward, F.A. River basin indicators: A framework for evaluation in the Rio Grande. West. Econ. Forum 2006, 5, 19–27. [Google Scholar]
- Li, Y.W.; Chen, H.X.; Xu, Z.M. Theory of integrated water resources management and quantitative evaluation application in the Hei-he River Basin. Chin. Ind. Econ. 2010, 3, 139–148. [Google Scholar]
- Gallego-Ayala, J.; Juízo, D. Performance evaluation of river basin organizations to implement integrated water resources management using composite indexes. Phys. Chem. Earth 2012, 50–52, 205–216. [Google Scholar] [CrossRef]
- Wu, D.; Wang, Y.H. Dynamic performance evaluation of water resources management in seven river basins of China. Resour. Environ. Yangtze Basin 2014, 23, 32–38. [Google Scholar]
- Sandoval-Solis, S.; Mckinney, D.C.; Loucks, D.P. Sustainability index for water resources planning and management. J. Water Resour. Plan. Manag. 2015, 137, 381–390. [Google Scholar] [CrossRef]
- Pan, H.L.; Xu, Z.M.; Chen, H.X. Comprehensive evaluation on performances of sustainable water management in arid northwestern China: A case of Ganzhou District. J. Arid Land Res. Environ. 2012, 6, 1–7. [Google Scholar]
- Guo, W.; Zuo, Q.T.; Jin, R.F.; Ma, J.-X. Performance evaluation system and application of the strictest water resources management Zhengzhou. South North Water Trans. Water Sci. Tech. 2014, 12, 86–91. [Google Scholar]
- Xu, H.A. Performance evaluation model and empirical study on regional water resources management. Yellow River 2014, 38, 42–45. [Google Scholar]
- Bos, M.G.; Murray-Rust, D.H.; Merrey, D.J.; Johnson, H.G.; Snellen, W.B. Methodologies for assessing performance of irrigation and drainage management. Irrig. Drain. Syst. 1993, 7, 231–261. [Google Scholar] [CrossRef]
- Wardlaw, R.; Sharif, M. Evaluation of genetic algorithms for optimal Reservoir system operation. J. Water Res. Plan. Manag. 1999, 125, 25–33. [Google Scholar] [CrossRef]
- Reddy, M.J.; Kumar, D.N. Performance evaluation of elitist-mutated multi-objective particle swarm optimization for integrated water resources management. J. Hydroinform. 2009, 11, 1302–1311. [Google Scholar] [CrossRef]
- Joshi, N.N.; Ostrom, E.; Shivakoti, G.P.; Lam, W.F. Institutional opportunities and constraints in the performance of farmer-managed irrigation systems in Nepal. Asia-Pac. J. Rural Dev. 2000, 10, 67–92. [Google Scholar]
- Ma, W.X.; Li, J. Economic performance evaluation of irrigation water resources management system in Suihua City. Chin. For. Econ. 2012, 25, 39–41. [Google Scholar]
- Ren, H.; Zhao, C.Z.; An, L.J. Performance evaluation of water management policy for Minqin Oasis using the catastrophe progression method. Resour. Sci. 2014, 36, 922–928. [Google Scholar]
- Karatas, B.S.; Akkuzu, E.; Unal, H.B.; Asik, S.; Avci, M. Using satellite remote sensing to assess irrigation performance in Water User Associations in the Lower Gediz Basin, Turkey. Agric. Water Manag. 2009, 96, 982–990. [Google Scholar] [CrossRef]
- Kazbekov, J.; Abdullaev, I.; Manthrithilake, H.; Qureshi, A.; Jumaboev, K. Evaluating planning and delivery performance of water user associations (WUAs) in Osh Province, Kyrgyzstan. Agric. Water Manag. 2009, 96, 1259–1267. [Google Scholar] [CrossRef]
- Guo, L.X. Water resources management performance evaluation of farmer’s water use association based on case study. Water Sav. Irrig. 2014, 43, 66–68. [Google Scholar]
- Guo, L.X.; Feng, J.M.; Dong, L.X. An analysis of the farmer’s water use association management performance and its influence factors. Chin. Rural Water Hydr. 2014, 41, 105–108. [Google Scholar]
- Wang, L.J.; Ma, Y.X. Operation mechanism and management performance of the farmer’ self-management mode of water resource. Rural Econ. 2015, 33, 98–103. [Google Scholar]
- Gorantiwar, S.D.; Smout, I.K. Performance assessment of irrigation water management of heterogeneous irrigation schemes: 1. A framework for evaluation. Irrig. Drain. Syst. 2005, 9, 1–36. [Google Scholar] [CrossRef]
- Asres, S.B. Evaluating and enhancing irrigation water management in the upper Blue Nile basin, Ethiopia: The case of Koga large scale irrigation scheme. Agric. Water Manag. 2016, 170, 26–35. [Google Scholar] [CrossRef]
- Lam, W.F. Improving the performance of small-scale irrigation systems: The effects of technological investments and governance structure on irrigation performance in Nepal. World Dev. 1996, 24, 1301–1315. [Google Scholar] [CrossRef]
- Ahmad, M.D.; Turral, H.; Nazeer, A. Diagnosing irrigation performance and water productivity through satellite remote sensing and secondary data in a large irrigation system of Pakistan. Agric. Water Manag. 2009, 96, 551–564. [Google Scholar] [CrossRef]
- Sun, H.; Wang, S.; Hao, X. An improved analytic hierarchy process method for the evaluation of agricultural water management in irrigation districts of north China. Agric. Water Manag. 2017, 197, 324–337. [Google Scholar] [CrossRef]
- Tejada-Guibert, J.A. Integrated Water Resources Management (IWRM) in a Changing World//Sustainability of Integrated Water Resources Management; Springer International Publishing: New York, NY, USA, 2015. [Google Scholar]
- Snellen, W.B.; Schrevel, A. IWRM: For Sustainable Use of Water; 50 Years of International Experience with the Concept of Integrated Water Resources Management; Background Document to the FAO/Netherlands Conference on Water for Food an Ecosystems. In Proceedings of the Conference on Water for Food an Ecosystems, The Hague, The Netherlands, 31 January–5 February 2005. [Google Scholar]
- Zhou, H.P.; Zhu, X.D. A system approach towards sustainable management of urban water resources. J. Arid Land Resour. Environ. 2005, 19, 78–82. [Google Scholar]
- Pan, H.L.; Chen, H.X. Quantitative assessment on the sustainable comprehensive water resources management: An empirical research based on the theory of IWRM. Ecol. Econ. 2014, 30, 145–150. [Google Scholar]
- Global Water Partnership (GWP). Integrated Water Resources Management (TAC Background Paper No.4); GWP Secretariat: Stockholm, Sweden, 2000. [Google Scholar]
- Li, Z.N.; Pan, W.Q. Econometrics; Higher Education, Beijing Press: Beijing, China, 2005; pp. 1–189. [Google Scholar]
- Fan, K.X. Quantitative Methods in Sociology; Nanjing University Press: Nanjing, China, 2014; pp. 377–392. [Google Scholar]
- Yuan, F. Tutorial of Social Research Methodology; Peking University Press: Beijing, China, 2004. [Google Scholar]
- Satty, T.L.; Vargas, L.G. Decision Making in Economic, Political, Social and Technological Environments: The Analytic Hierarchy Process; RWS Publications: Pittburgh, PA, USA, 1994. [Google Scholar]
- Ganzhou District Bureau of Statistics. Ganzhou District Statistical Yearbook from 2001 to 2012; China Statistics Press: Beijing, China, 2013.


| Performance Indicators | Indicators Interpretation | |
|---|---|---|
| Ecological sustainability (C1) | Natural vegetation coverage (I1) | The rate of forestland and grassland area to total land area, reflecting the sustainability and goodness of ecological environment. |
| Water resources exploitation coefficient (I2) | The rate of the number of water withdrawal to total water resources amount, reflecting the potential of water resources amount and its sustainability. | |
| Dilution ratio of water (I3) | The rate of total runoff in irrigation areas to the sewage discharge amount, reflecting the sustainability of water quality environment. | |
| Water-use equity (C2) | Ratio of rural households using tap water (I4) | The rate of the number of rural households using tap water to the total of rural households, reflecting the equity of domestic water accessibility. |
| Ratio of rural households using clean water (I5) | The rate of the number of rural households drinking hygiene-standard water to the total of rural households, reflecting the equity of domestic water quality. | |
| Ratio of water disputes among rural households (I6) | The rate of the number of rural households disputing with others for production water to the total of rural households reflecting the injustice of water utilization. | |
| Ratio of households participating in meetings on water (I7) | The rate of the number of rural households participating in meetings on water to the total of the rural households, reflecting the fairness of the water management process. | |
| Ratio of the rural households’ opinions adopted (I8) | The rate of the number of the farmers’ opinions adopted to the total of farmer’s opinion at the water meetings, reflecting the democracy of water resources management. | |
| Water-use efficiency (C3) | Average irrigation amount per hectare (I9) | The value of irrigation amount divided by the total effective irrigation area in an irrigation area, reflecting the efficiency of agricultural water utilization. |
| Per capita domestic water consumption (I10) | The value of the domestic water consumption divided by the total population, reflecting the efficiency of domestic water consumption in irrigation areas. | |
| Agricultural output value of water per cubic meter (I11) | The value of total agricultural output value divided by total agricultural water consumption, reflecting the economic benefits of agricultural water consumption. | |
| Organizational efficiency (C4) | Ratio of the rural water user paying water fee actually (I12) | The rate of the number of water users paying water fee actually to the total who should pay, reflecting the administrative efficiency and sustainability of water management institutions. |
| Rate of the water disputes resolved (I13) | The rate of the numbers of water disputes resolved effectively in irrigation areas to total water disputes, reflecting the administrative efficiency of water management institutions. | |
| Rate of the irrigation canal system with lining (I14) | The rate of the length of the irrigation canal with lining, to the total length of the irrigation canal system, reflecting the engineering construction efficiency of water administrative departments. | |
| Rate of the intact irrigation canal (I15) | The rate of the length of intact irrigation canal system to the total length of irrigation canal system, reflecting the engineering maintenance efficiency of water administrative departments. |
| Index Type | Influencing Factor Indicators | Index Explanation and Requirement |
|---|---|---|
| Enabled environment | Concerted management policy and legislation (D1) | A series of policies and legislation should be established completely and concertedly for irrigation areas to realize the objectives of sustainable water management. |
| Multiple subjects participation mechanism (D2) | Water managers should include legally the representatives of the water, environment, agriculture sectors and rural water users. | |
| Executing willingness to legislation and policy (D3) | The attitude of water resource managers to implement the water legislation and policies of irrigation areas, which should be positive. | |
| Investment coefficient on water conservancy (X4) | The ratio of water conservancy investment accounting for GDP, which should be enough large to meet the need of water conservancy development in irrigation areas. | |
| Social investment rate on water conservancy (X5) | The rate of farmers’ investment on water conservancy which should be large enough to cover the shortage of government investment in irrigation areas. | |
| Institutional roles | Farmer participation ratio in water user associations (X6) | The ratio of number of the households participating in Water User Associations to total rural households, which should be one hundred percent at best. |
| Representatives of ordinary farmer water users in water user associations (X7) | The rate of representatives of ordinary water users in the water user association congress, which should be enough large in order to safeguard their interests. | |
| Responsibilities division of agencies (D4) | The responsibilities of water authority and other relative government sectors should be clear and specific. | |
| Participation of the vulnerable groups (D5) | A certain proportion of women and impoverished households should join water use association in irrigation areas. | |
| Democratic supervision mechanism (D6) | There is an external supervisory institution that is democratically founded by water users for water management. | |
| Farmer’s information feedback mechanism (D7) | The feedback channel of suggestions from the water user representatives should be established and be effective. | |
| Training of water professional managers and users (D9) | Professional knowledge training of water managers should be implemented periodically. | |
| Educational level of water management personnel (X10) | Average schooling years of administrators in irrigation areas, which should be higher. | |
| Guarantee rate of operation expenses of WUA (X11) | The financial supply for the daily operation of water user association in irrigation areas should be enough. | |
| Management instruments | Water resources supply and demand evaluation (D7) | The monitoring and evaluation of water supply-demand should be implemented in terms of quantity and quality. |
| Water conservancy objects impact assessment (D8) | Social and environmental impacts assessment of water resources development projects should be implemented firmly | |
| Water utilization measurement (X12) | The rate of the number of water users whose water consumption is measured accurately to total water users. | |
| Information providence about water evaluation (D9) | Releasing the data of water resources supply and demand as well as water diversion and water distribution to the public. | |
| Quota management system implementation (D10) | The water distribution should be strictly implemented in accordance with quota management principles. | |
| Popularity of highly efficient water-saving crops (X13) | The ratio of highly efficient water-saving crops areas to the total crops acreage. | |
| Reasonable water price and water charges (X14) | The ratio of water price and water charges to income of farmers, which should be high enough to stimulate water saving. | |
| Ratio of irrigation water trading (X15) | The proportion of irrigation water traded by the farmers to the total water saving amount | |
| Water-saving irrigation technology coverage(X16) | The ratio of water-saving irrigation area to effectively irrigated area, which should be 100% at best | |
| Water-saving technical training rate of farmers (X17) | The ratio of the farmers obtaining water saving technical training to the total farmers, which should be 100% at best. | |
| Development level | Per capita net income of farmers (X1) | The difference of the per capita income and expenses of famers, which should be the higher the better. |
| Science and technology development level (X2) | The number of agricultural sci-tech staff per 1000 employees in irrigation areas, which should be 1000 at best. | |
| Educational level of the population (X3) | The ratio of employees with educational level of the middle school and the higher to total employees, which should be 100% at best. |
| Influencing Factor Index | Correlation Coefficients | ||||
|---|---|---|---|---|---|
| Y1 | Y2 | Y3 | Y4 | Y0 | |
| X1 | 0.307 | −0.731 ** | 0.511 | 0.387 | −0.243 |
| X2 | 0.089 | −0.111 | 0.163 | −0.391 | −0.075 |
| X3 | 0.171 | −0.697 * | 0.643 * | 0.194 | 0.011 |
| D1 | −0.377 | −0.129 | 0.648 * | 0.024 | −0.020 |
| D2 | −0.330 | −0.046 | −0.003 | 0.688 * | 0.288 |
| D3 | −0.712 ** | 0.247 | 0.565 | 0.106 | 0.510 |
| X4 | −0.312 | 0.217 | −0.150 | 0.383 | 0.521 |
| X7 | −0.485 | 0.443 | 0.067 | 0.235 | 0.705 ** |
| D6 | −0.672 * | 0.103 | 0.337 | 0.487 | 0.525 |
| X8 | 0.151 | −0.235 | −0.347 | 0.180 | 0.439 |
| X9 | −0.374 | 0.099 | 0.102 | 0.643 * | 0.729 ** |
| X10 | 0.023 | 0.553 | −0.638 * | −0.450 | −0.076 |
| X11 | −0.677 * | 0.192 | 0.202 | 0.759 ** | 0.951 ** |
| X12 | 0.300 | 0.003 | −0.227 | −0.233 | −0.426 |
| D9 | −0.669 * | 0.637 * | 0.220 | −0.465 | 0.261 |
| D10 | −0.379 | 0.445 | 0.103 | −0.123 | 0.408 |
| X13 | −0.298 | −0.123 | 0.757 ** | 0.582 | 0.679 * |
| X14 | −0.690 * | 0.109 | 0.661 * | 0.660 * | 0.846 ** |
| X15 | −0.857 ** | 0.757 ** | −0.128 | −0.090 | 0.367 |
| X16 | −0.406 | 0.454 | 0.673 * | 0.274 | 0.596 * |
| X17 | −0.223 | 0.033 | 0.561 | −0.102 | 0.012 |
| Z1 | Z2 | Z3 | Z4 | |
|---|---|---|---|---|
| (Y0) | −0.00693 (0.134) | 0.0117 * (0.087) | 0.0235 ** (0.000) | −0.00629 (0.203) |
| (Y1) | 0.08642 ** (0.0220) | −0.01181 ** (0.0043) | −0.001949 (0.5863) | 0.001341 (0.7000) |
| (Y2) | −0.024828 (0.1406) | 0.012048 (0.53886) | 0.004004 (0.7427) | 0.002173 (0.7717) |
| (Y3) | 0.01413 (0.1930) | 0.03896 (0.9727) | −0.07844 * (0.0647) | 0.01808 * (0.0966) |
| (Y4) | 0.0051 (0.3534) | 0.01345 ** (0.0224) | 0.0256 ** (0.0199) | 0.0202 ** (0.0286) |
© 2018 by the authors. Licensee MDPI, Basel, Switzerland. This article is an open access article distributed under the terms and conditions of the Creative Commons Attribution (CC BY) license (http://creativecommons.org/licenses/by/4.0/).
Share and Cite
Pan, H.; Xu, Q. Quantitative Analysis on the Influence Factors of the Sustainable Water Resource Management Performance in Irrigation Areas: An Empirical Research from China. Sustainability 2018, 10, 264. https://doi.org/10.3390/su10010264
Pan H, Xu Q. Quantitative Analysis on the Influence Factors of the Sustainable Water Resource Management Performance in Irrigation Areas: An Empirical Research from China. Sustainability. 2018; 10(1):264. https://doi.org/10.3390/su10010264
Chicago/Turabian StylePan, Hulin, and Qian Xu. 2018. "Quantitative Analysis on the Influence Factors of the Sustainable Water Resource Management Performance in Irrigation Areas: An Empirical Research from China" Sustainability 10, no. 1: 264. https://doi.org/10.3390/su10010264
APA StylePan, H., & Xu, Q. (2018). Quantitative Analysis on the Influence Factors of the Sustainable Water Resource Management Performance in Irrigation Areas: An Empirical Research from China. Sustainability, 10(1), 264. https://doi.org/10.3390/su10010264