Article

Reaching the End of the ICEV Domination: 35 Years of Battery Electric Vehicles in Norway

Institute of Transport Economics, Gaustadalleen 21, N-0349 Oslo, Norway
World Electr. Veh. J. 2026, 17(2), 89; https://doi.org/10.3390/wevj17020089
Submission received: 30 November 2025 / Revised: 25 January 2026 / Accepted: 3 February 2026 / Published: 9 February 2026

Abstract

Norway reached a Battery Electric Vehicle market share of 96% in 2025. The fleet share reached 33%. Other countries are 5–10 years behind Norway. The extraordinary Norwegian development is the result of a 35-year-long complex process involving BEV testing from 1990 and Norwegian BEV industrialization from 1998, supported by a large package of incentives. The incentive package remained in place after the Norwegian actors went bankrupt in 2010 and the global OEMs took over the BEV supply. Norway has a had head start over other countries with high visibility, awareness, and a BEV fleet that accounted for 35% of all BEVs in Europe to build a market from. The incentives made the new OEM BEVs immediately competitive, contrasting with other countries’ insufficient incentives and slow development. A second market expansion followed from 2017 with access to lower-cost and long-range BEVs in more market segments. The EU’s new vehicle CO2-regulation forced OEMs to sell BEVs on a large scale. BEV technology improved rapidly with longer range and faster charging at a reduced cost, making the incentive even more efficient. The model availability increased rapidly from 2020, while ICEV model availability declined rapidly from 2022, enabling Norway to reach the national target of only selling BEVs from 2025. Norway solved the demand-side challenges of BEV adoption through large market pull incentives. The early supply-side challenges were attempted to be solved with Norwegian BEV production targeting a small-city BEV niche. When that failed, a window of opportunity opened to solve the supply-side challenges with the availability of OEM BEVs. The market scope broadened to commuters and multi-vehicle households and eventually to all new vehicle buyers. By 2020, all demand-side and supply-side challenges were solved, and the transition was accelerated by societal processes.

1. Introduction

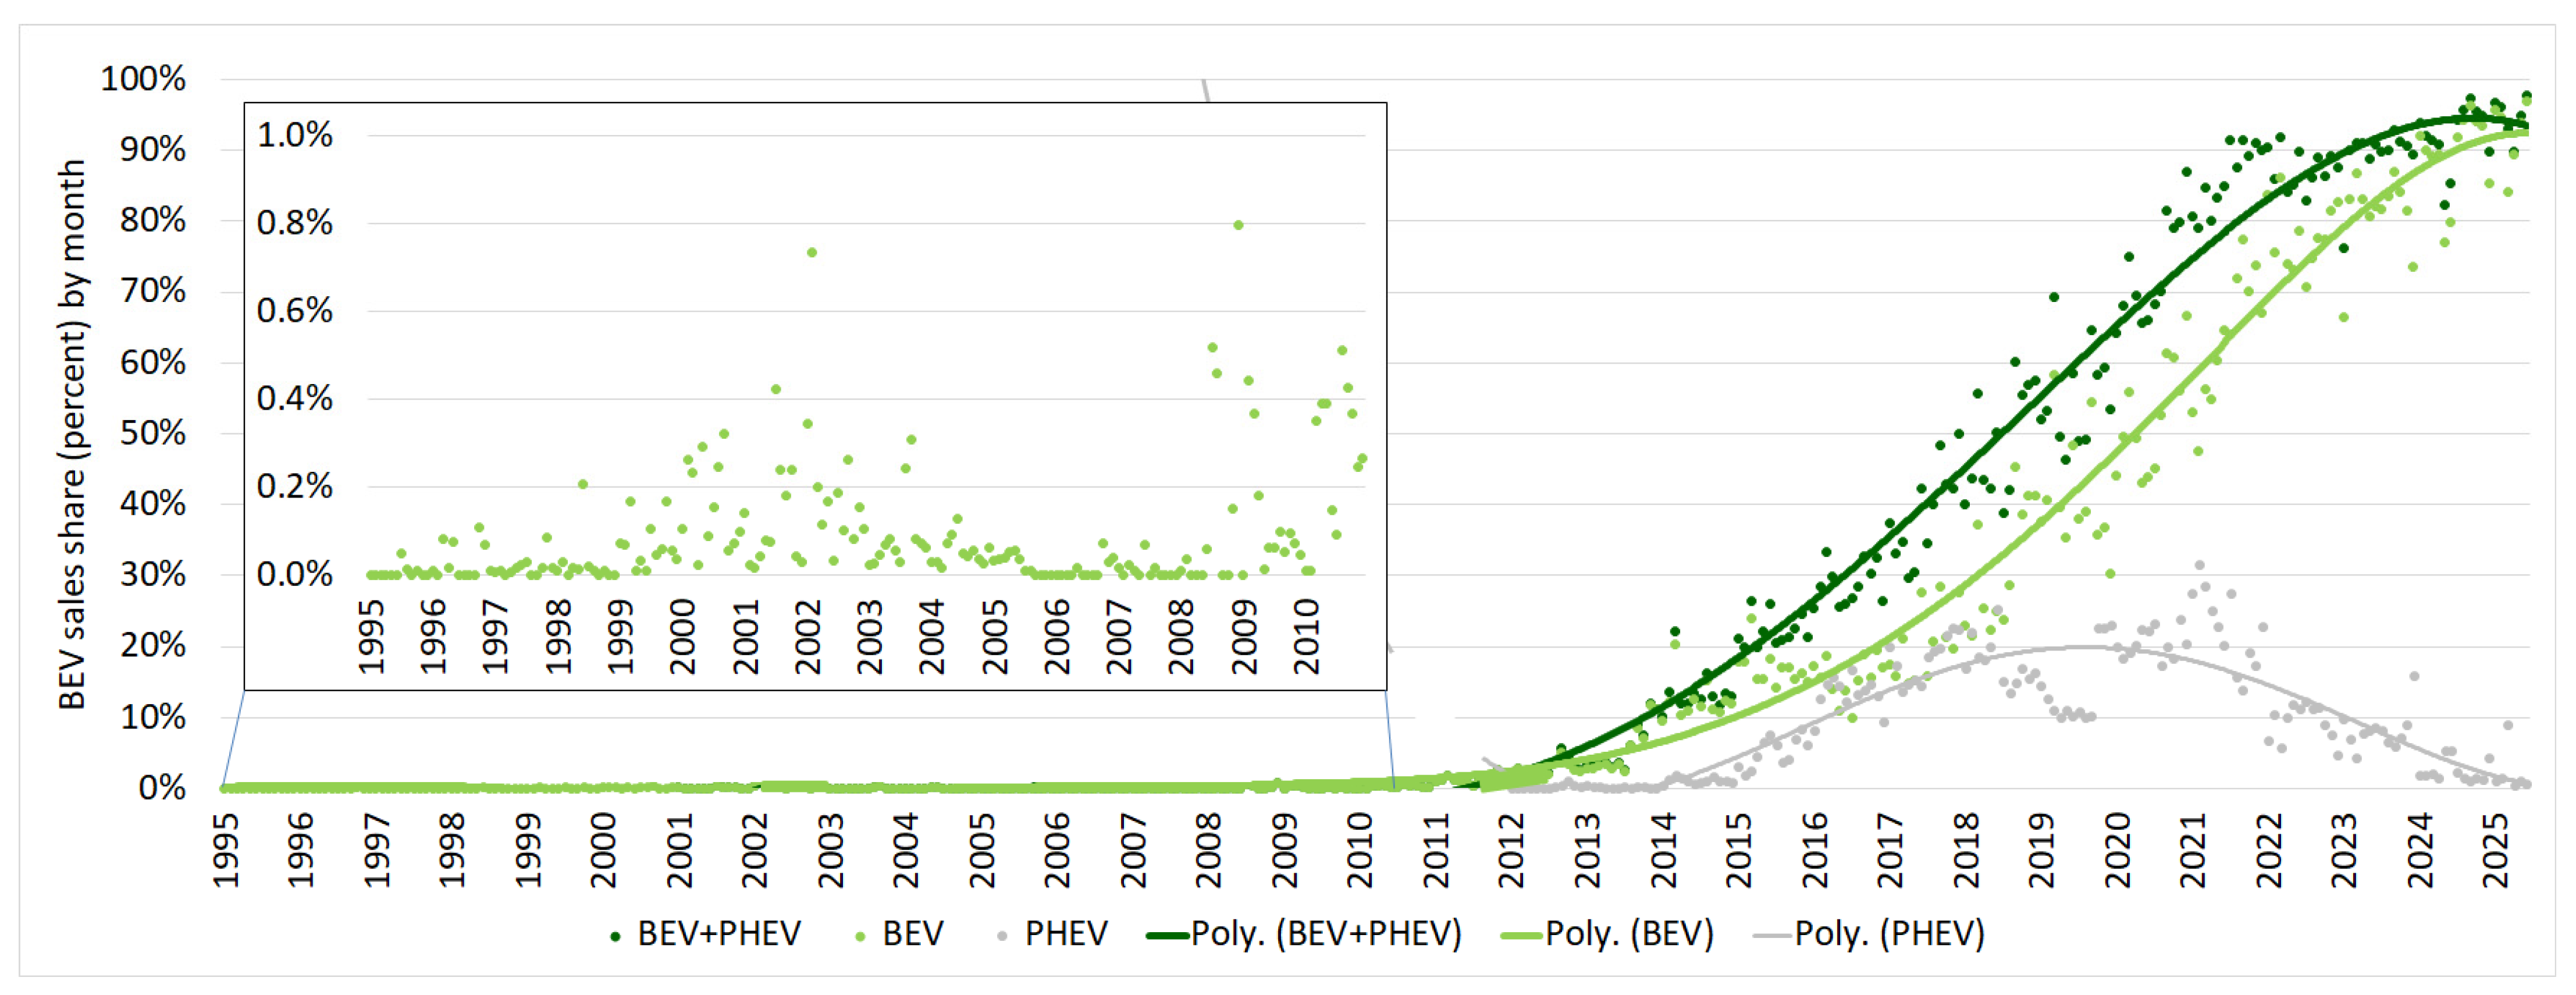
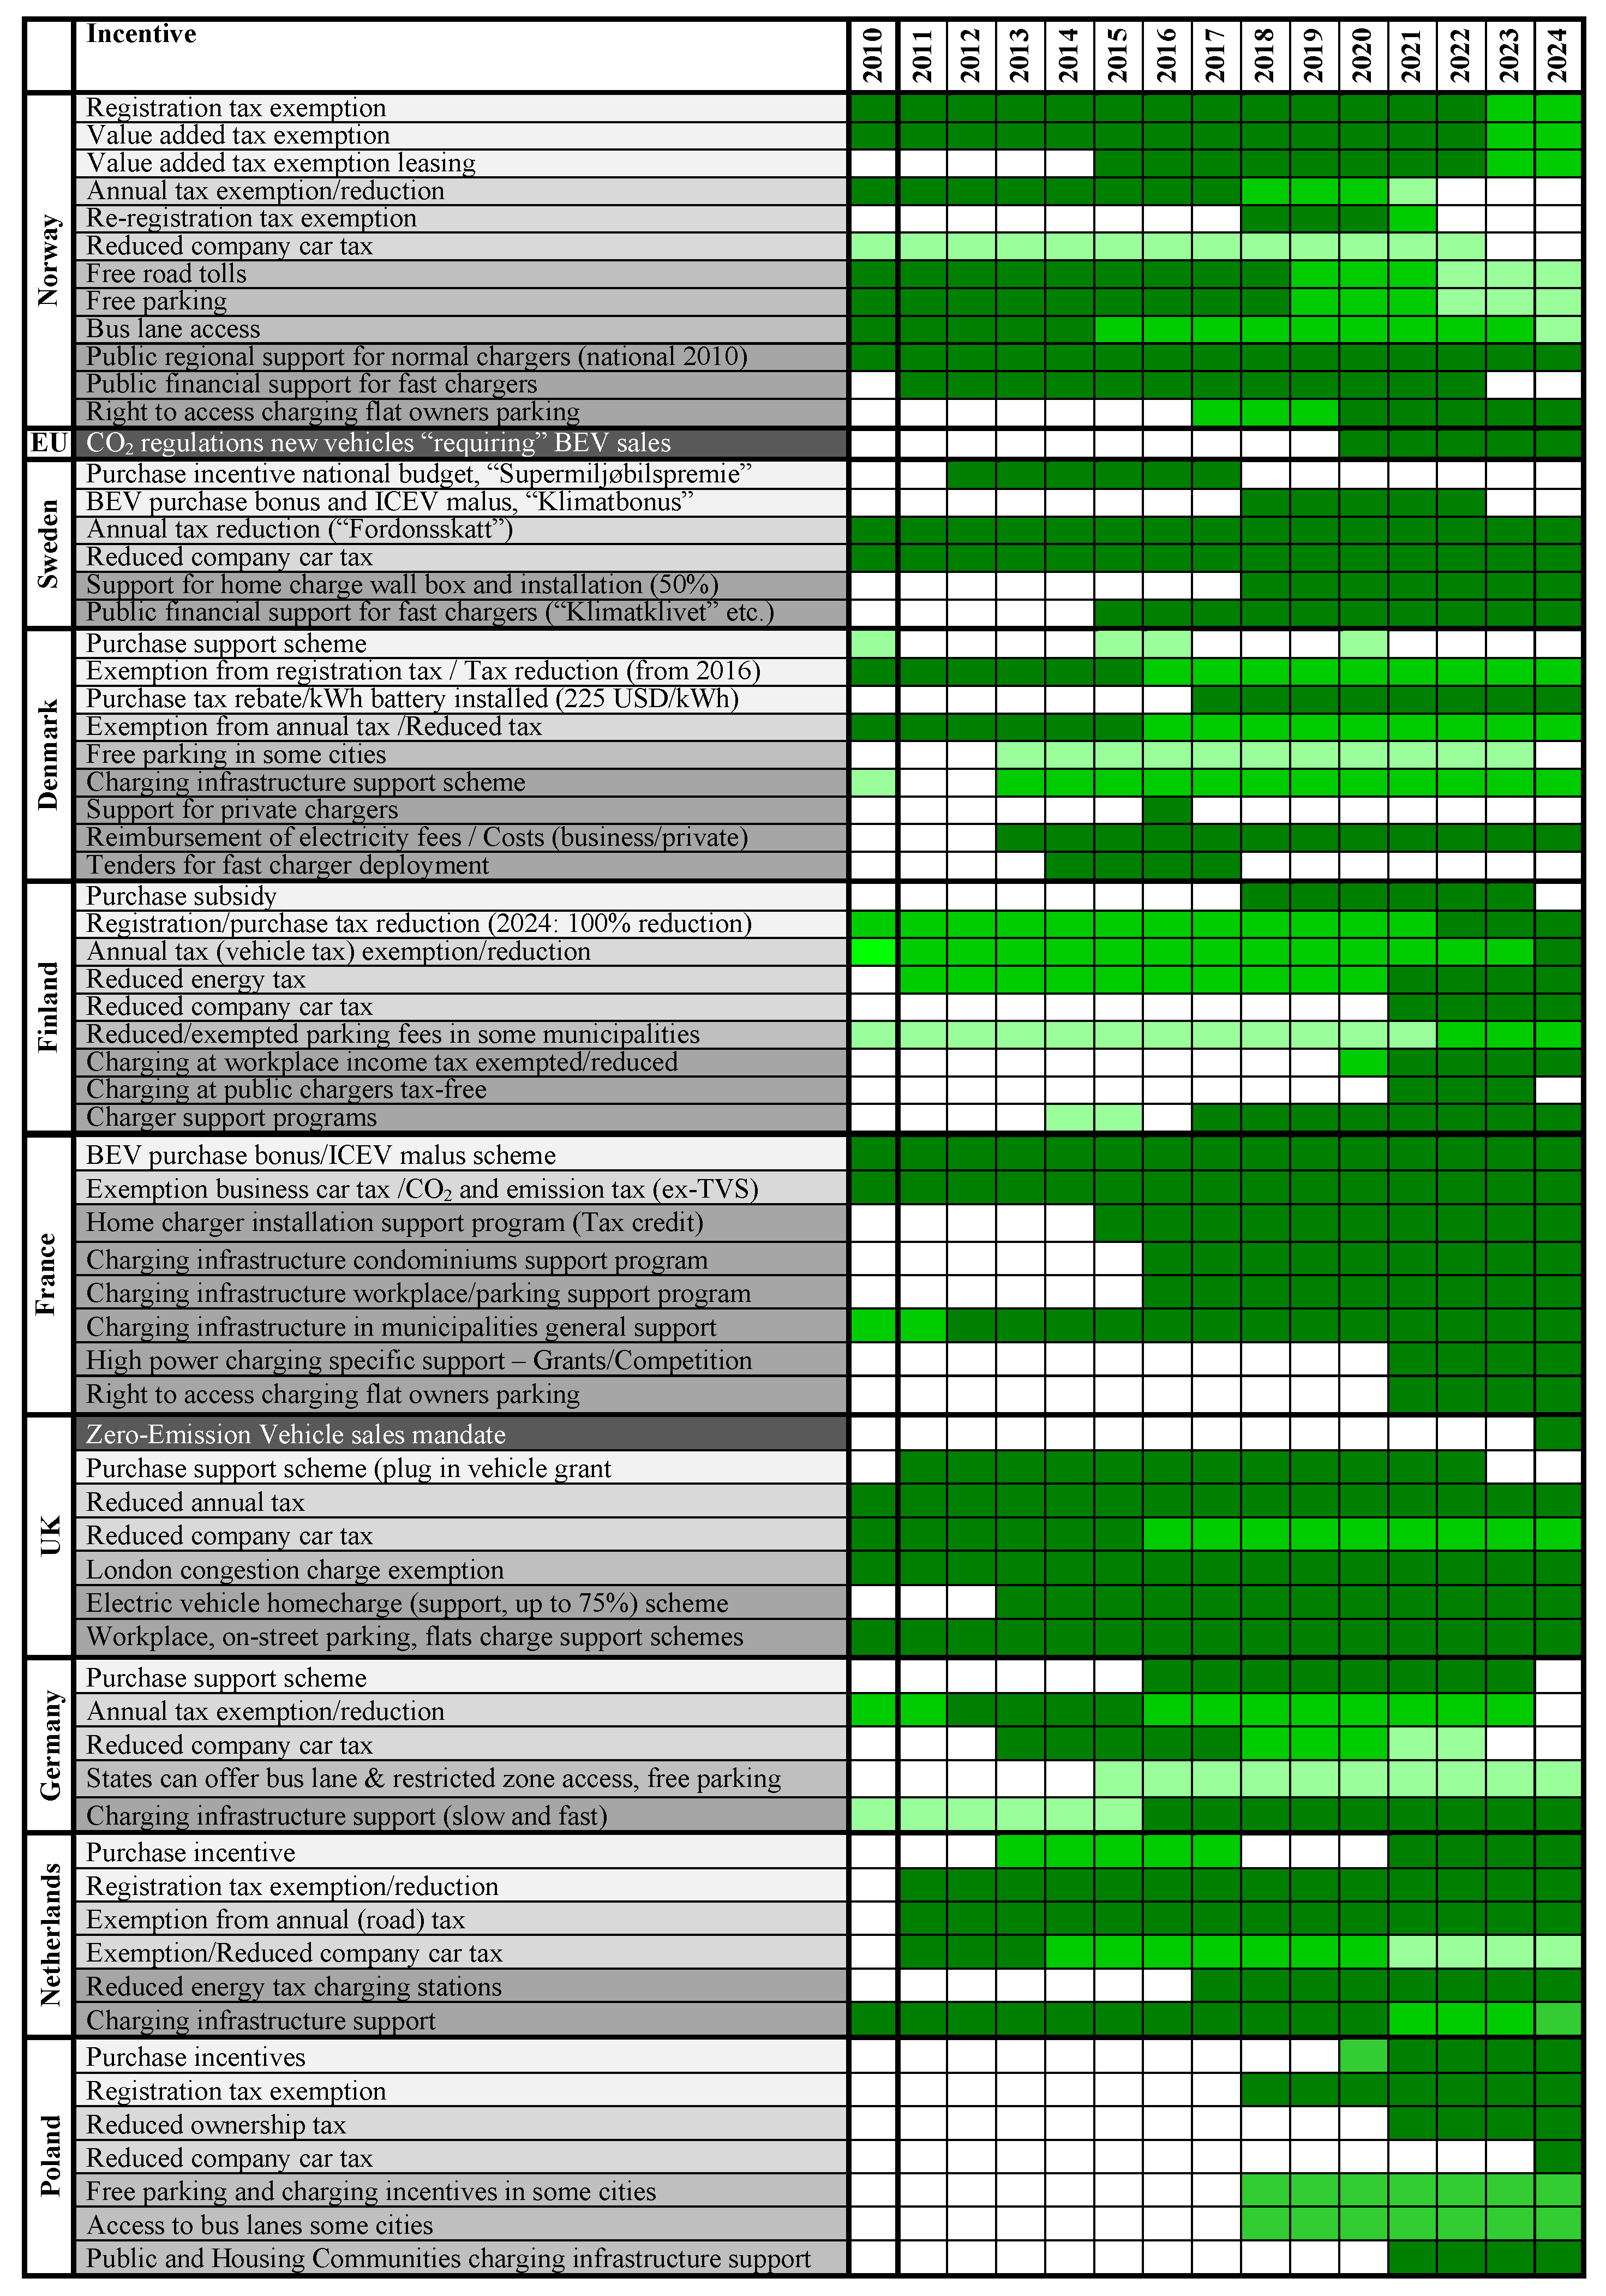
Norway is the world’s leading Battery Electric Vehicle (BEV) market in terms of market- and fleet shares [1]. The market share was 96% in 2025 [2], and the fleet share was 33%, so Norway reached the national target to only sell Zero-Emission Vehicles (ZEVs) in 2025 [3] that was put in place from 2017 to support the Paris Agreement GHG emission reduction target [4]. These achievements were the result of a 35-year-long innovation and market diffusion process enabled by long-term BEV policies [1] with the incentives listed in Table 1 that led to steadily increasing market shares as seen in Figure 1. The 2025 ZEV target provided direction from 2017 for the continued use of the large incentives [5].
The development started when the first BEV was registered in 1990, continued through two periods of failed Norwegian BEV industrialization, until the age of modern OEM Li-Ion powered BEVs started from 2011 [6] and sales took off. The market share passed 50% in 2020 after long-range lower cost BEVs became available from 2017 [7]. Plug in Hybrid Vehicles (PHEVs) that use electricity for short trips and fuel for long trips increased total Plug in Electric Vehicle (PEV) sales, as seen in Figure 1, but are no longer pursued as they do not count towards the 2025 100% ZEV target, and their tax advantages have been reversed [8], which is the reason sales faded out by 2025.
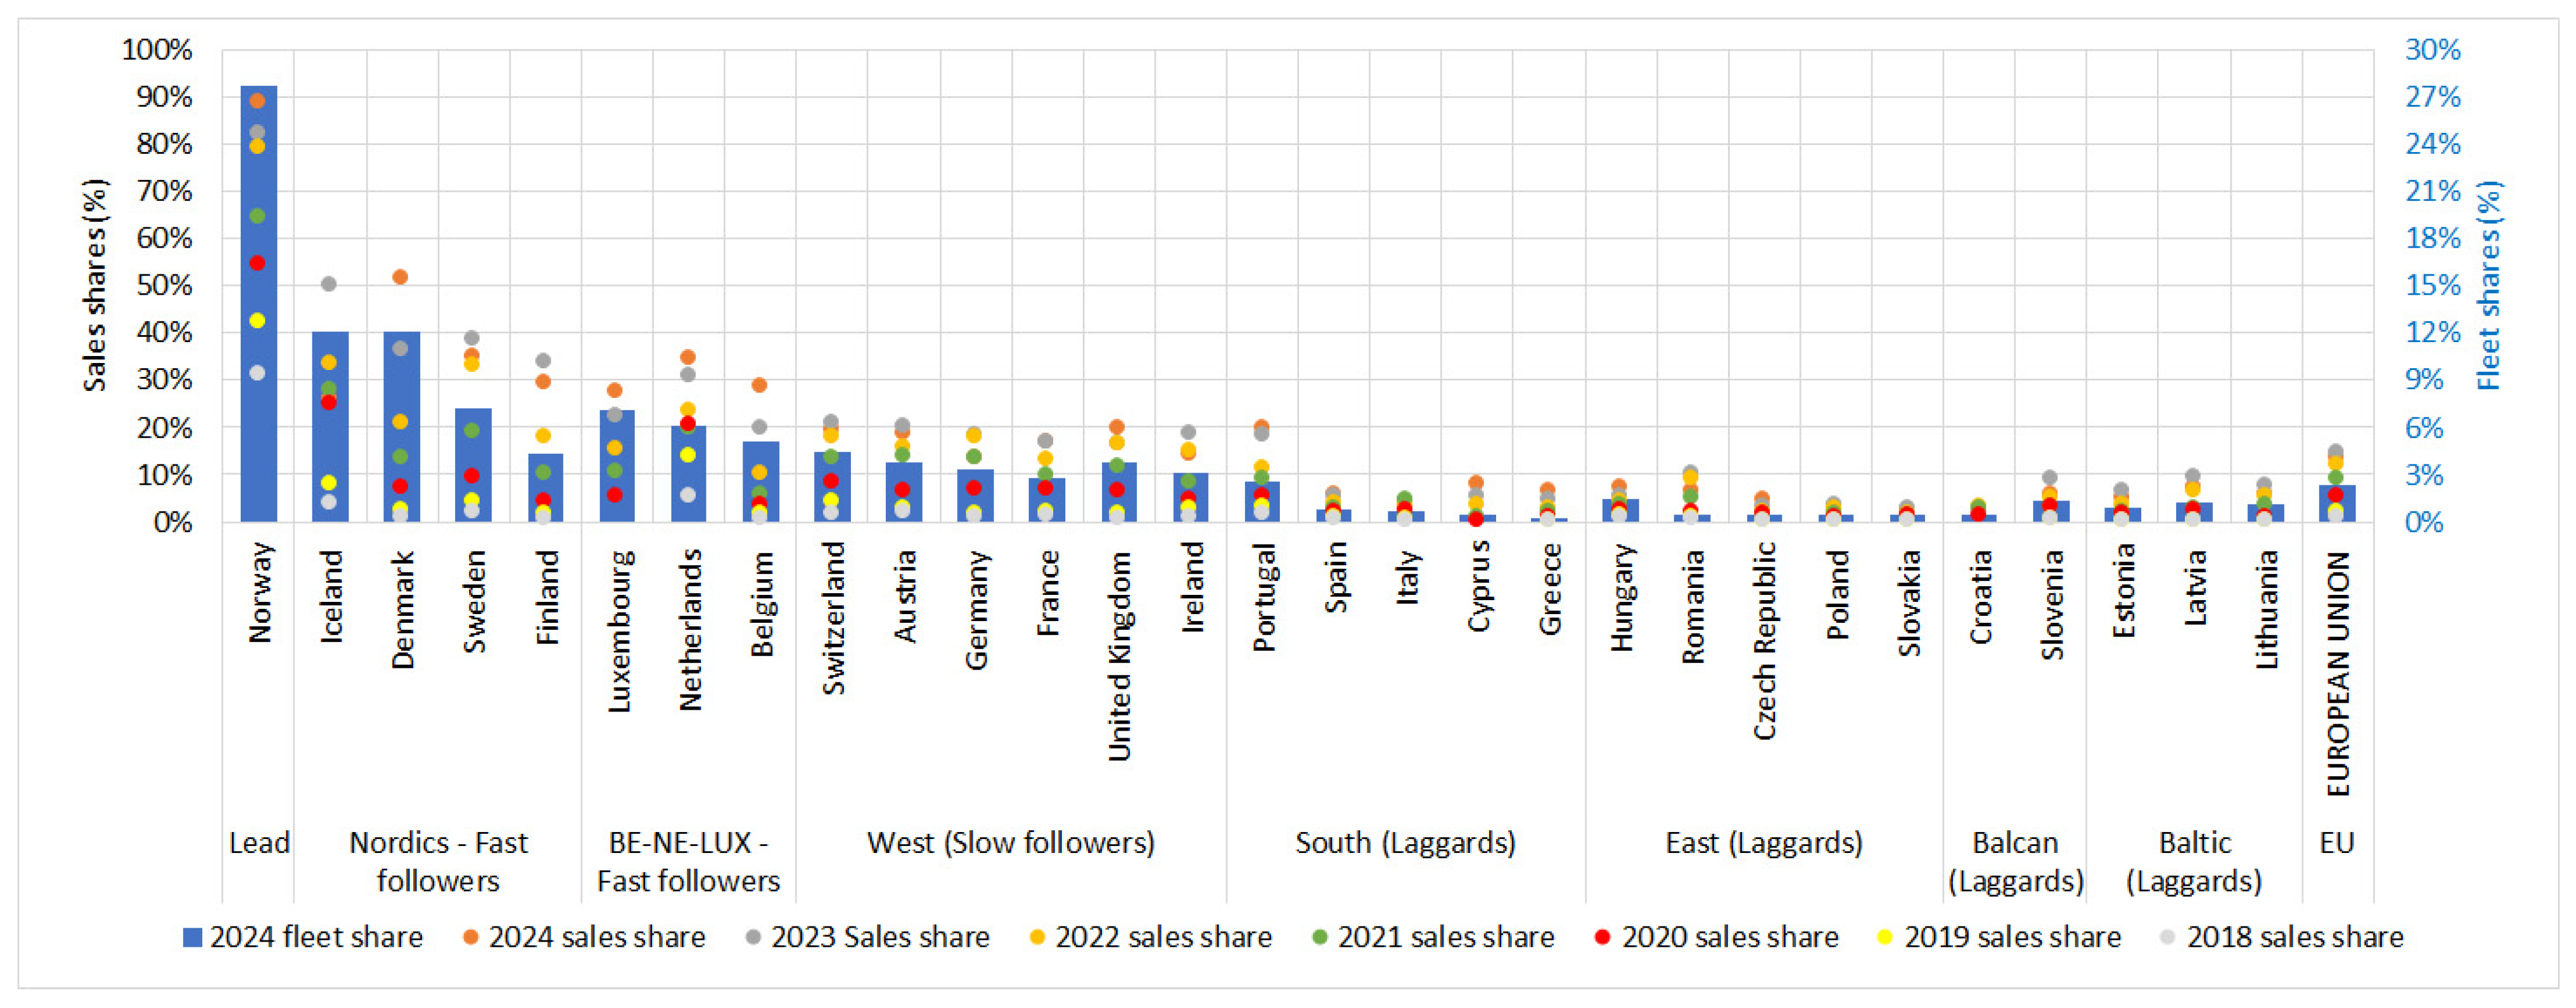
The Norwegian development is 5–10 years ahead of the rest of Europe as seen in Figure 2, which makes Norway an interesting arena to learn from. The only other countries that have passed 50% market share were Denmark in 2024 and Iceland in 2023 [9]. The Nordic and BE-NE-LUX countries are fast followers behind Norway. The rest of Western Europe are slow followers. South- and East Europe, the Baltics, and the Balkans are laggards, apart from Portugal. The Nordics have advantages such as strong grids, low-cost electricity, and a well-off population living in small houses with home charging access that quickly take new technology into use [10].
The purpose of the article is to provide a broader holistic perspective on the Norwegian development than previous articles to increase the general understanding of the different main factors behind the development and identify high-level learnings for other countries. The paper is organized as follows: The background and earlier research is in Section 2. The method and data are in Section 3, followed by an overview of the Norwegian BEV development in Section 4, the results are in Section 5, the discussion is in Section 6, and the conclusions is in Section 7.

2. Background

A review of the demand-side challenges of reaching 100% ZEV sales [12] highlighted consumer perceptions, knowledge, characteristics, infrastructure, and energy prices as the main issues. A review of the supply-side challenges [13] highlighted BEV and battery production value chains and charging-infrastructure deployment as the main challenges. These identified challenges can serve as indicators of BEV development.
Norway has much larger incentives and is so far ahead of other countries that research on the BEV development elsewhere will be a limited representative for the Norwegian development. Previous research on the Norwegian case has investigated the societal development processes using the Multi-Level-Perspective (MLP) framework covering the period up to 2016 [14] and the innovation system [15,16] behind the Norwegian BEV development using the Technology Innovation System (TIS) framework, but most of the literature has focused on long-term availability and effects of economic and local incentives [17,18,19,20,21], development of user characteristics [22,23], needs for and perceptions of BEVs [24,25,26] and charging infrastructure [20,27,28], the need for and impact of policies [29,30], and how and why these policies were put in place [5,31].
Researchers comparing different countries’ development have emphasized Norway’s large package of incentives as the main explanatory factor for the faster diffusion of BEVs than in other countries [32]. Norway also differs from other countries in terms of its early commercial-market experimentation that was enabled by stable and substantial market pull incentives [14] which established early knowledge and awareness of BEVs and built up a local BEV industry [14]. The stability and industrialization led to a continuous BEV fleet increase up to 2010 [14]. New actors could join as other actors failed [6,14]. The incentives remained in place and made BEVs economic to buy for new vehicle buyers from 2012 [14,21]. Increasing losses from the tax exemptions could be covered by Norway’s increasing oil-sector income [5], a luxury not available to other countries. Local incentives have been important [14,15]. The exemptions from road tolls, parking fees, ferry rates, and access to bus lanes had an average user value of about 1000–1300 Euros/year according to user surveys conducted 2014–2019 [24,25,26]. Other countries had weaker incentives that were revised frequently [32,33], leading to volatile markets, uncertainty among vehicle buyers, and challenges for market actors. Norway has used market pull incentives whereas large countries/regions have used market push incentives such as CO2-regulations (EU) and different types of ZEV regulations (UK, China, US/California) that force the OEMs to sell ZEVs.
For charging infrastructure, the most important aspect has been the access to low-cost home charging [25,27], with over 90% having such access [24,25,26] and the deployment of fast chargers since 2011 that have enabled longer trips [6]. Workplace and public charging have enabled BEV ownership without home charging access [27]. Early BEV owners accessed charging by using widely available outdoor/garage power sockets. This method of charging is now considered unsafe and only to be used in emergencies when no other charging options are available [6]. Over 90% now charge at home using wall box charge connections [34].
Norway had national BEV producers that supplied BEVs to the market at points in time when other countries and traditional automakers (OEMs) showed little interest in BEVs [14]. Up to 2002, US OEMs saw BEVs merely as California ZEV mandate compliance vehicles, as reflected in Ford’s business plan for the Norwegian BEV producer THINK [35], which Ford owned from 1999 to 2002. High-volume BEV production was never considered. The OEMs planned to just meet the mandate that they in parallel fought actively against [36]. From 2003, Ford and other OEMs shifted focus to hydrogen fuel-cell vehicles to meet the revised ZEV-mandate [36] that no longer required BEVs.
Norway had no ICEV producers impacting political interest in BEVs but had entrepreneurs wanting to make Norway a BEV-producing country [14] which provided a positive policy focus. The situation after 2011 is that Norway imports all vehicles and has the freedom to use the tax system to influence the type of vehicles which are imported. Norway has natural advantages such as cheap, abundant, and clean electricity, which gives BEVs a positive environmental image, low energy costs, and a strong grid all the way out to households [6,14] that enable home charging. Widely available outdoor power sockets can be used for charging, and the low-speed limits lead to longer range. Disadvantages include long distances between cities, especially in the north, which makes it more expensive to develop the charging infrastructure, and harsh winters and mountainous topography that lead to high energy-consumption and reduced range [37,38].

3. Method and Data Sources

3.1. Research Questions

This article expands on the previous research by providing a holistic overview of Norwegian BEV development from 0 BEVs in 1990 to less than <1% BEV sales share up to 2010, to the 95% sales share in 2025, focusing on the difference to other European countries. It builds on the paper “Reaching the end of the ICEV domination—35 years of BEVs in Norway” presented at the 38th International Electric Vehicle Symposium and Exhibition (EVS38) Gothenburg, Sweden, 15–18 June 2025 [39].
Norway’s 2010 starting position was due to the 1990–2010 BEV industry attempts which were very different from that of other European countries, a fact that has not been investigated in the literature. This article aims to fill that gap, focusing on how the development up to 2010, and the 2010 status, impacted the Norwegian BEV diffusion from 2011 compared to the status and diffusion in other European countries. The research questions are
  • RQ1: What are the most important factors behind the 35-year-long Norwegian BEV development?
    RQ2: What makes the Norwegian BEV development different from that of other countries?

3.2. Method

The analysis of the development of the demand-side [12] and supply-side [13] challenges on the way to 100% ZEV sales focuses on the challenges shown in Table 2. Further analyses focus on technology and cost competitiveness, the societal transition process, innovation, and policy development. The innovation and societal transition processes are discussed using the Multi-Level-Perspective (MLP) [40] and Technology Innovation System (TIS) [41] frameworks and Rogers’ theory on the diffusion of innovations [42]. The competitiveness of BEVs is evaluated on a Total Cost of Ownership basis, in line with rational choice theory, which states that people act rationally. The analysis has a special focus on the 2010 status, which marks the starting point of the OEM BEV production era, and on the post-2021 rapid ICEV decline availability phase.
The MLP framework looks at how new technologies that are nurtured in niche markets can become a new established “regime” technology when a window of opportunity opens following long-term pressure from the “landscape” on the incumbent technology. For BEVs, this pressure takes the form of government and regional regulations in the EU, China, and California for new vehicle CO2 emissions and ZEV sales that force incumbent OEMs to develop and sell BEVs in large numbers, i.e., building a new BEV regime from within the ICEV regime, but also opportunities that arose in the landscape such as improved Li-Ion batteries and increased focus on climate policies that opened new possibilities for climate friendly technologies.
The TIS framework sees diffusion of new technology from an innovation system perspective, identifying development of TIS functions in interaction with system structures in dynamic processes, as the key success factor. The TIS functions cover development and diffusion of knowledge, entrepreneurial activity, guidance of search, market formation, resource mobilization, legitimacy, and generation of positive externalities [15]. The structure consists of actors, institutions, infrastructures, and interactions [15].
Rogers’ theory of the diffusion of innovations see innovation as a social-learning process between successive adopter groups of innovators, early adopters, early- and late majority, and laggards. The diffusion follows an S-shaped curve from 0% to 100% adoption. Adoption starts with innovators that want to test new technology and progress to the subsequent user groups when they see that the innovation works and it provides relative advantages over the incumbent technology. Laggards are conservative and do not adopt until they must, i.e., when the incumbent technology availability declines. The diffusion typically starts in cities with more innovators in the population and where more people are exposed to the first users’ experiences.

3.3. Data Sources

The basis for the study is a document collection of all known articles, reports, and other documents that deal with aspects of the Norwegian BEV development between 1990 and 2020 and beyond. This document collection has previously been used to review the Norwegian BEV development from an innovation perspective [15], from a total cost of ownership perspective [21], a policy development perspective [5], and when analyzing the Norwegian BEV development using the Multi-Level-Perspective (MLP) framework [14]. The collection contains, in total, more than 350 documents of which 100 scientific articles, 100 other research documents, over 80 governance documents, 70 other document types, and 140 press articles have been identified as relevant for understanding the Norwegian BEV development.
The topics of the documents that were selected as relevant for investigating the research questions in this article and providing a holistic overview of the BEV development are summarized by topic in Table A2 in Appendix A. Complementary data from various datasets and press articles shed light on issues not covered in the documents. For other countries, supplementary data was collected from research articles, reports, and datasets.

4. The Norwegian BEV Development

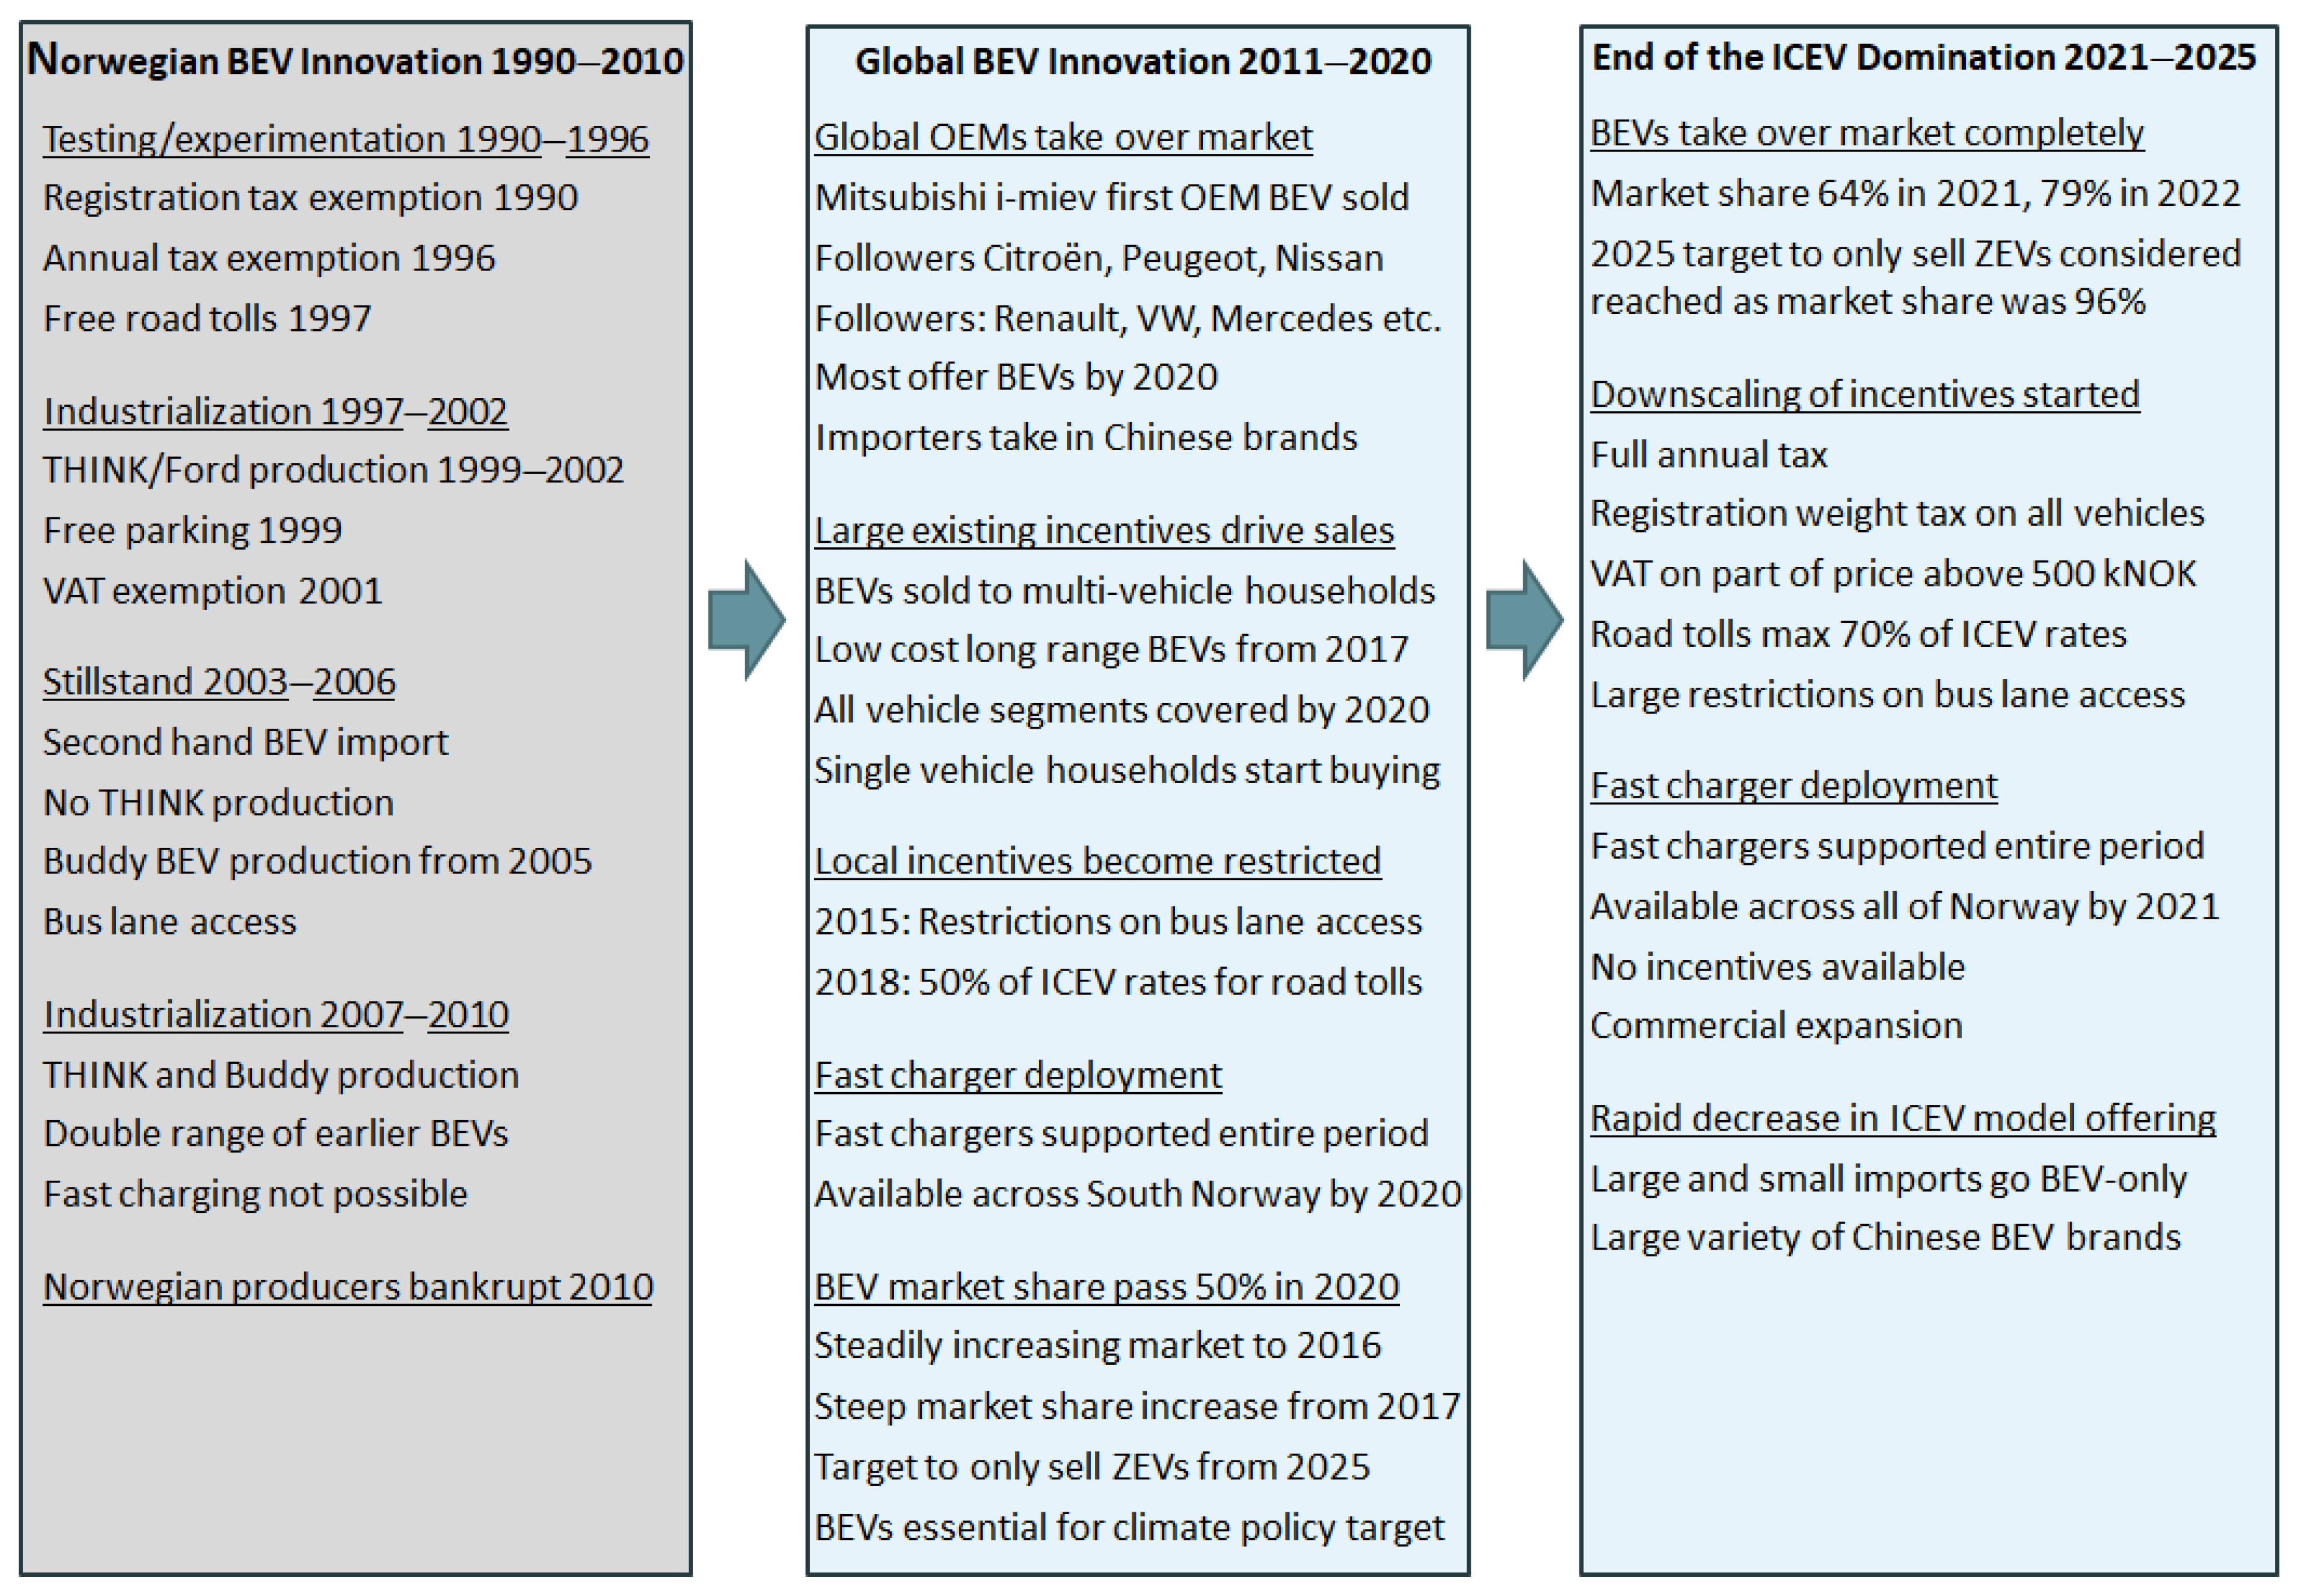
The Norwegian development is split into the three main development phases, shown in Figure 3.

4.1. Main Phase 1: Norwegian BEV Producer Led Innovation 1990–2010

In 1990, BEVs were so unknown that they could not be registered, as the vehicle register lacked a registration code [43]. The first BEV was imported by the environmental NGO Bellona [4] and registered in 1990 when the first incentive, a temporary exemption from the registration tax, was introduced to enable market experiments [5,14]. It became permanent in 1996 when the annual tax became exempted. Charging was performed from existing sockets outside houses/garages that were already used for ICEV engine-block heaters. Norway had Europe’s cheapest and cleanest electricity, but the demanding climate and topography were big barriers.
The entrepreneur PIVCO wanted to produce small BEVs for city use, inspired by the California ZEV mandate which was thought to lead to a BEV breakthrough although OEMs restricted development to “compliance” BEVs to meet the mandate. The inspiration also came from Light EV (LEV) development in Switzerland and BEV industrialization in France that made automotive quality BEV parts available [14,15,43]. PIVCO prototypes were tested in Norway and California [14,43]. Danish-built Kewet BEVs and Finnish Elcat minivans were sold. Energy companies and Oslo Municipality were the main supporters [43]. They established the EV Association network to raise awareness, improve incentives, and support production plans [14,44]. A cooperation with Peugeot brought BEVs to Stavanger City [45]. Statoil (fuel stations) tested BEV rental [46]. PIVCO/THINK, planned to produce 5000–10,000 BEVs/year [14], constituting a few percent of the total market. THINK BEVs had Ni-Cd batteries and chargers from OEM suppliers to the French Automakers and a Siemens drive system. Knowledge gaps were filled by Lotus Engineering UK [45]. These factors reduced the supply-side challenges [13]. THINK went bankrupt after launching their BEV in 1998 but was immediately bought by Ford who needed a low-cost BEV in California [14]. France had, as part of a national plan, established small series BEV production, and Peugeot, Citroën, and Renault BEVs were sold to Norway in limited numbers [14]. BEV sales increased somewhat from 1999 when the incentives increased to support BEV production at THINK/Ford [5]. Free parking was introduced in 1997, free road tolls in 1999, and the Value Added Tax (VAT) exemption came in 2001 [5]. The 1998 model was improved and produced to keep up momentum until a new California model could enter production [43]. The new model was still not ready when California, following OEM lawsuits, in 2002 changed the ZEV mandate so that BEVs were not needed [47]. OEMs focus shifted to hydrogen fuel-cell vehicles that OEMs said had more market potential [36]. Ford sold THINK, which became a prototype workshop. BEV activities also ended in France, after only producing 7500 BEVs instead of the planned 100,000 [48]. Germany, Switzerland, and Sweden tested BEV usability in research projects [49,50] but had no interest in production.
The 2001 government declaration had promised to keep BEV incentives in place [51]. No new BEVs were available, but BEV demand increased after they obtained bus-lane access from 2003 around Oslo to nation-wide access in 2005 [5]. This incentive [24,25,26] generated new demand that was met with imported second-hand BEVs from France [43] and a small production of the Norwegian Buddy mini-BEV (based on Kewet) [43]. Norway became the only European country with an active BEV market. THINK went bankrupt in 2006 [14] and was bought by Norwegian investors seeing opportunity in the global focus on climate change [52]. THINK started production of the Ford/THINK “California model” [43], which with Li-Ion batteries had double range of earlier BEVs. Challenges during the 2009 global financial crisis moved production to Valmet in Finland [53]. Ironically, Valmet had become an owner after a Norwegian government industry financial support agency had demanded that an experienced automotive actor became involved in THINK as a condition for making a small investment in THINK. The Buddy BEV was updated and actors in Greenland planned BEV production with Indian OEM TATA [43]. All these entrepreneurs failed to survive the financial crisis and went bankrupt 2010/2011 [14]. Most BEVs were in the greater Oslo area and other cities, and highly visible in the bus lanes with recognizable designs and BEV-specific number plates [14]. Commuters around Oslo saved half an hour in the morning rush driving in the bus lane to Oslo [24,25]. They accepted BEVs’ short range, slow charge, and limited comfort [14]. The incentives were much higher than in other countries [54]. In 2010, the leading municipality, Asker, already had a 1.15% BEV share of the fleet [2], which was higher than laggard EU countries’ shares in 2024 [11] (see Figure 2). These factors led to a higher awareness of BEVs in the Norwegian population than in other countries and a market to grow from for Mitsubishi that started pre-sales of the I-Miev [55].

4.2. Main Phase 2: Global OEM Led BEV Innovation 2011–2020

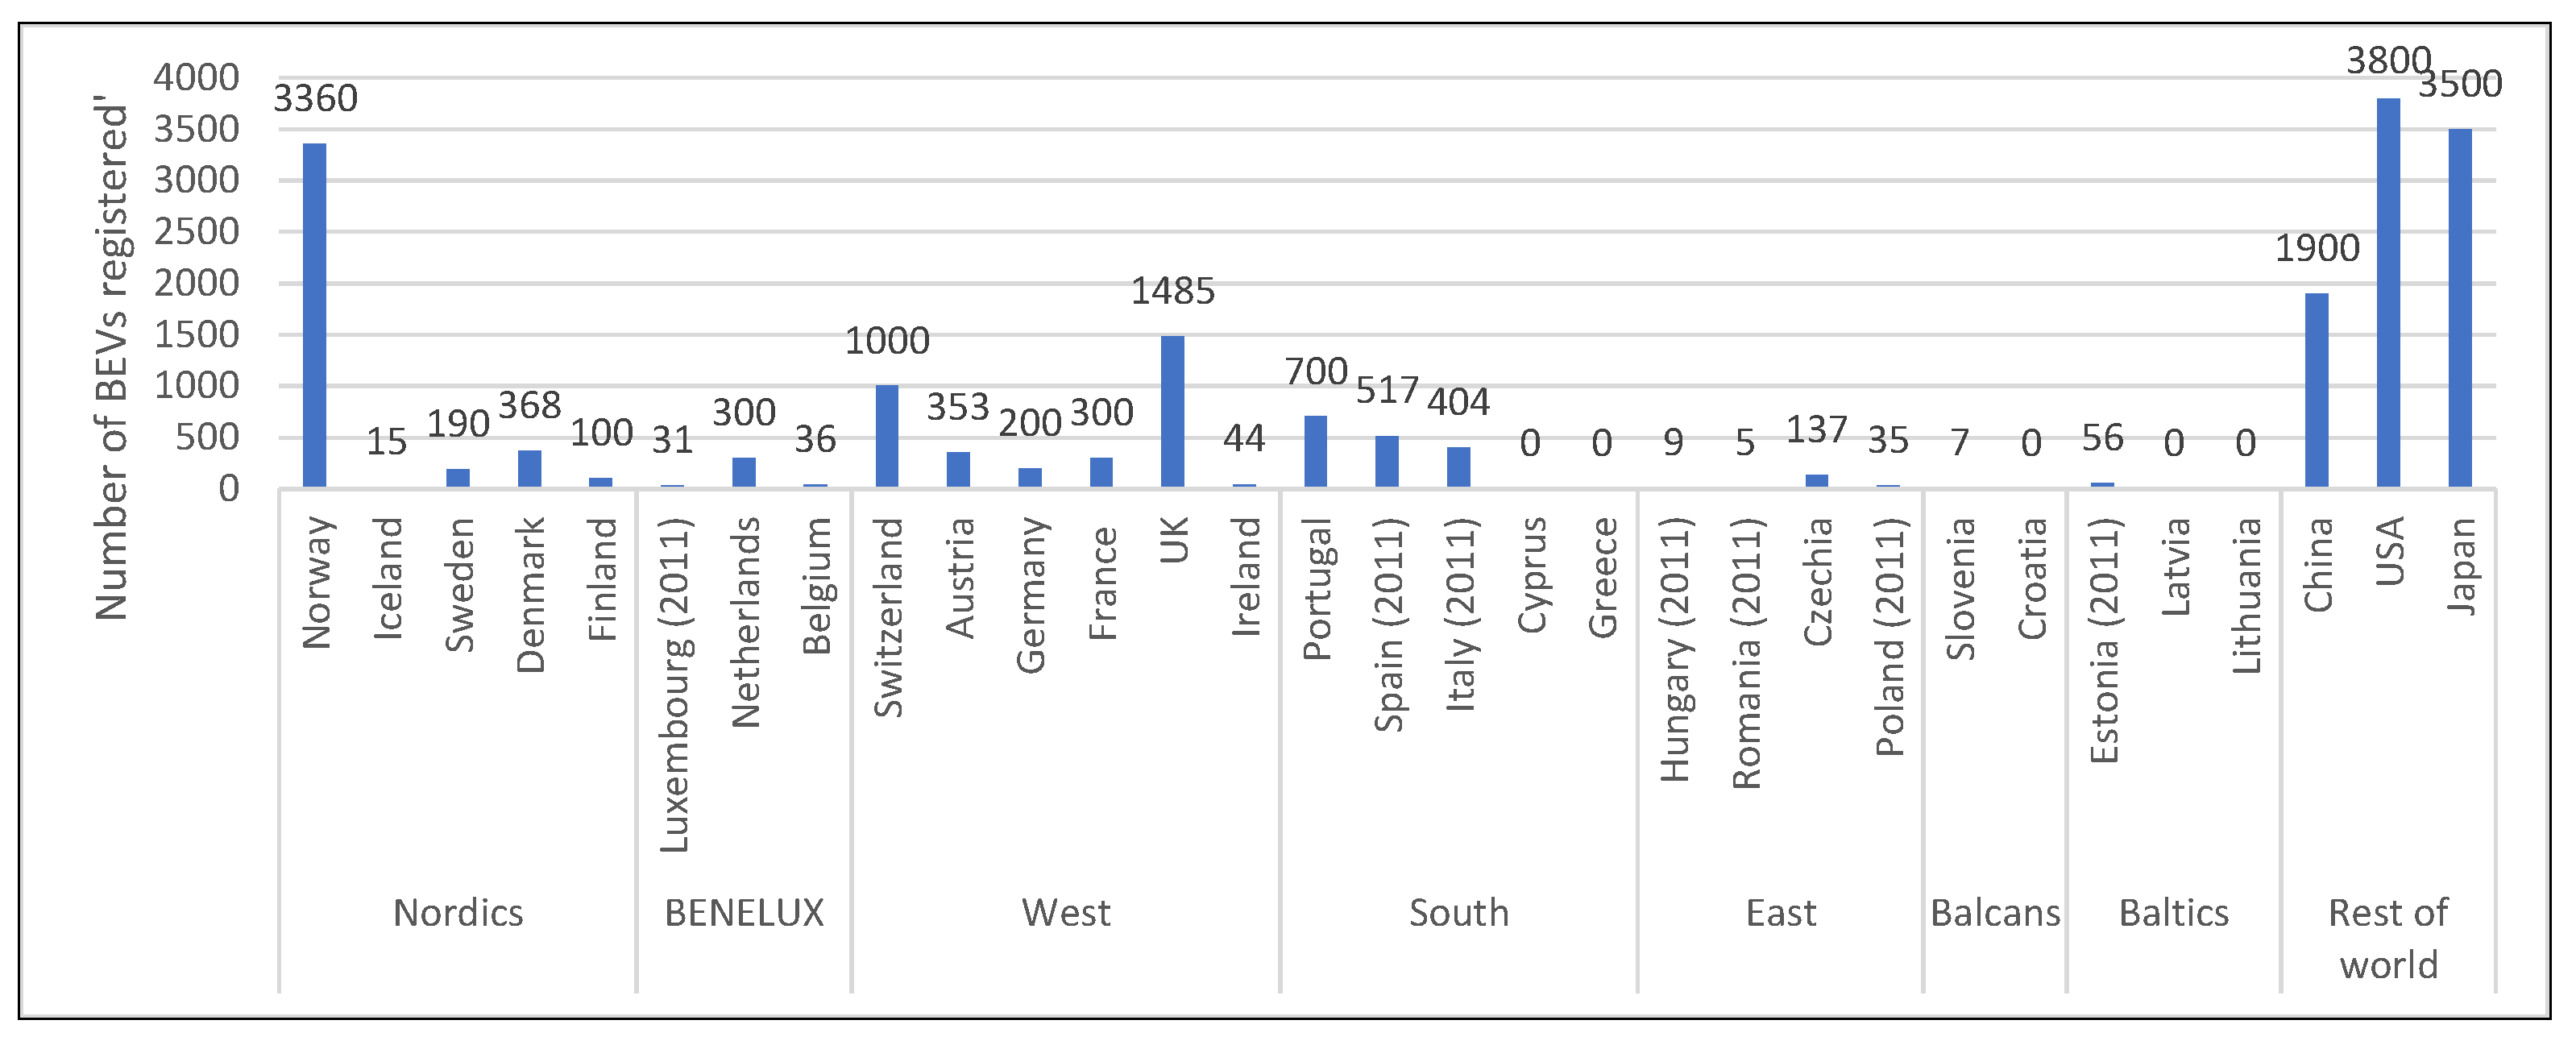
At the end of 2010, Norway had one-third of all BEVs in Europe (3360). The first public slow chargers were installed. Earlier BEVs could not be fast charged, so no fast chargers were available. The first Charge Point Operators (CPOs) emerged in 2010 when public support for chargers became available. The following BEV incentives were available: Exemptions from the registration tax, the value-added tax and the annual tax, free road tolls, no parking fees, reduced ferry rates, and access to bus lanes. OEMs became available in unlimited volumes. The global climate mitigation focus had reached the vehicle industry and Li-Ion batteries enabled the production of good BEVs with falling costs under pressure from the EU new vehicle CO2 regulations. The market took off among commuters and multi-vehicle households and expanded as technology improved and model selection and range increased [24,25]. Tesla proved that BEVs could be usable for long-distance driving with a large battery and high-quality charging infrastructure. The large incentives made Tesla BEVs’ TCO competitive also to some that normally bought vehicles at a lower price. BEVs became increasingly important for reaching climate policy goals [5], and a target for the average new vehicle to emit less than 85 g/km by 2020 [5] was introduced. BEV policies continued unchanged as the market expanded. The first fast chargers were installed in and around cities with public support and covered major parts of southern Norway by 2016 [6] and the rest of Norway by 2020/2021. Charging-infrastructure support became available to flat owners [6] who received a legal right to access charging in their parking areas from 2017/2020 [5]. Long-range BEVs became available in all segments from 2017 to 2020 [56] at an acceptable cost to new vehicle buyers, including single-vehicle owners, when factoring in the Norwegian incentives [6,21]. Norway committed to only sell ZEVs from 2025 to support the Paris Agreement target [5]. The market share passed 50% in 2020 when most vehicle importers offered a variety of BEVs. Municipalities obtained the right to decide bus-lane access and to charge BEV owners up to 50% of the ICEV rate for parking, which also applied to road tolls [5].

4.3. Main Phase 3: Reaching the End of the ICEV Domination 2021–2025

The vehicle technology status was turned upside down. ICEVs became the niche market with rapidly falling model availability [57,58] whereas BEVs became the mainstream choice with a 79% market share in 2022. Some importers went BEV only, while others took in an increasing variety of Chinese brands. With the 96% market share in 2025 [2], Norway could declare that the target to only sell ZEVs had been met. Fast chargers were now built out purely on commercial terms, and the total number passed 10,000 in 2025. Some incentives were scaled back. VAT was re-introduced on the part of the purchase sum above 500,000 NOK, and full annual tax was re-introduced. A negative market impact was avoided when Tesla reduced prices significantly from January 2023 [59], which the other OEMs had to follow and which nullified the effect of the tax increases.

5. Results

Reaching 100% diffusion of BEVs depends on solving demand-side and supply-side challenges, making sure that BEVs are economically competitive with ICEVs, and on supportive societal processes.

5.1. Demand-Side and Supply-Side Challenges

  • BEV Characteristics and Markets
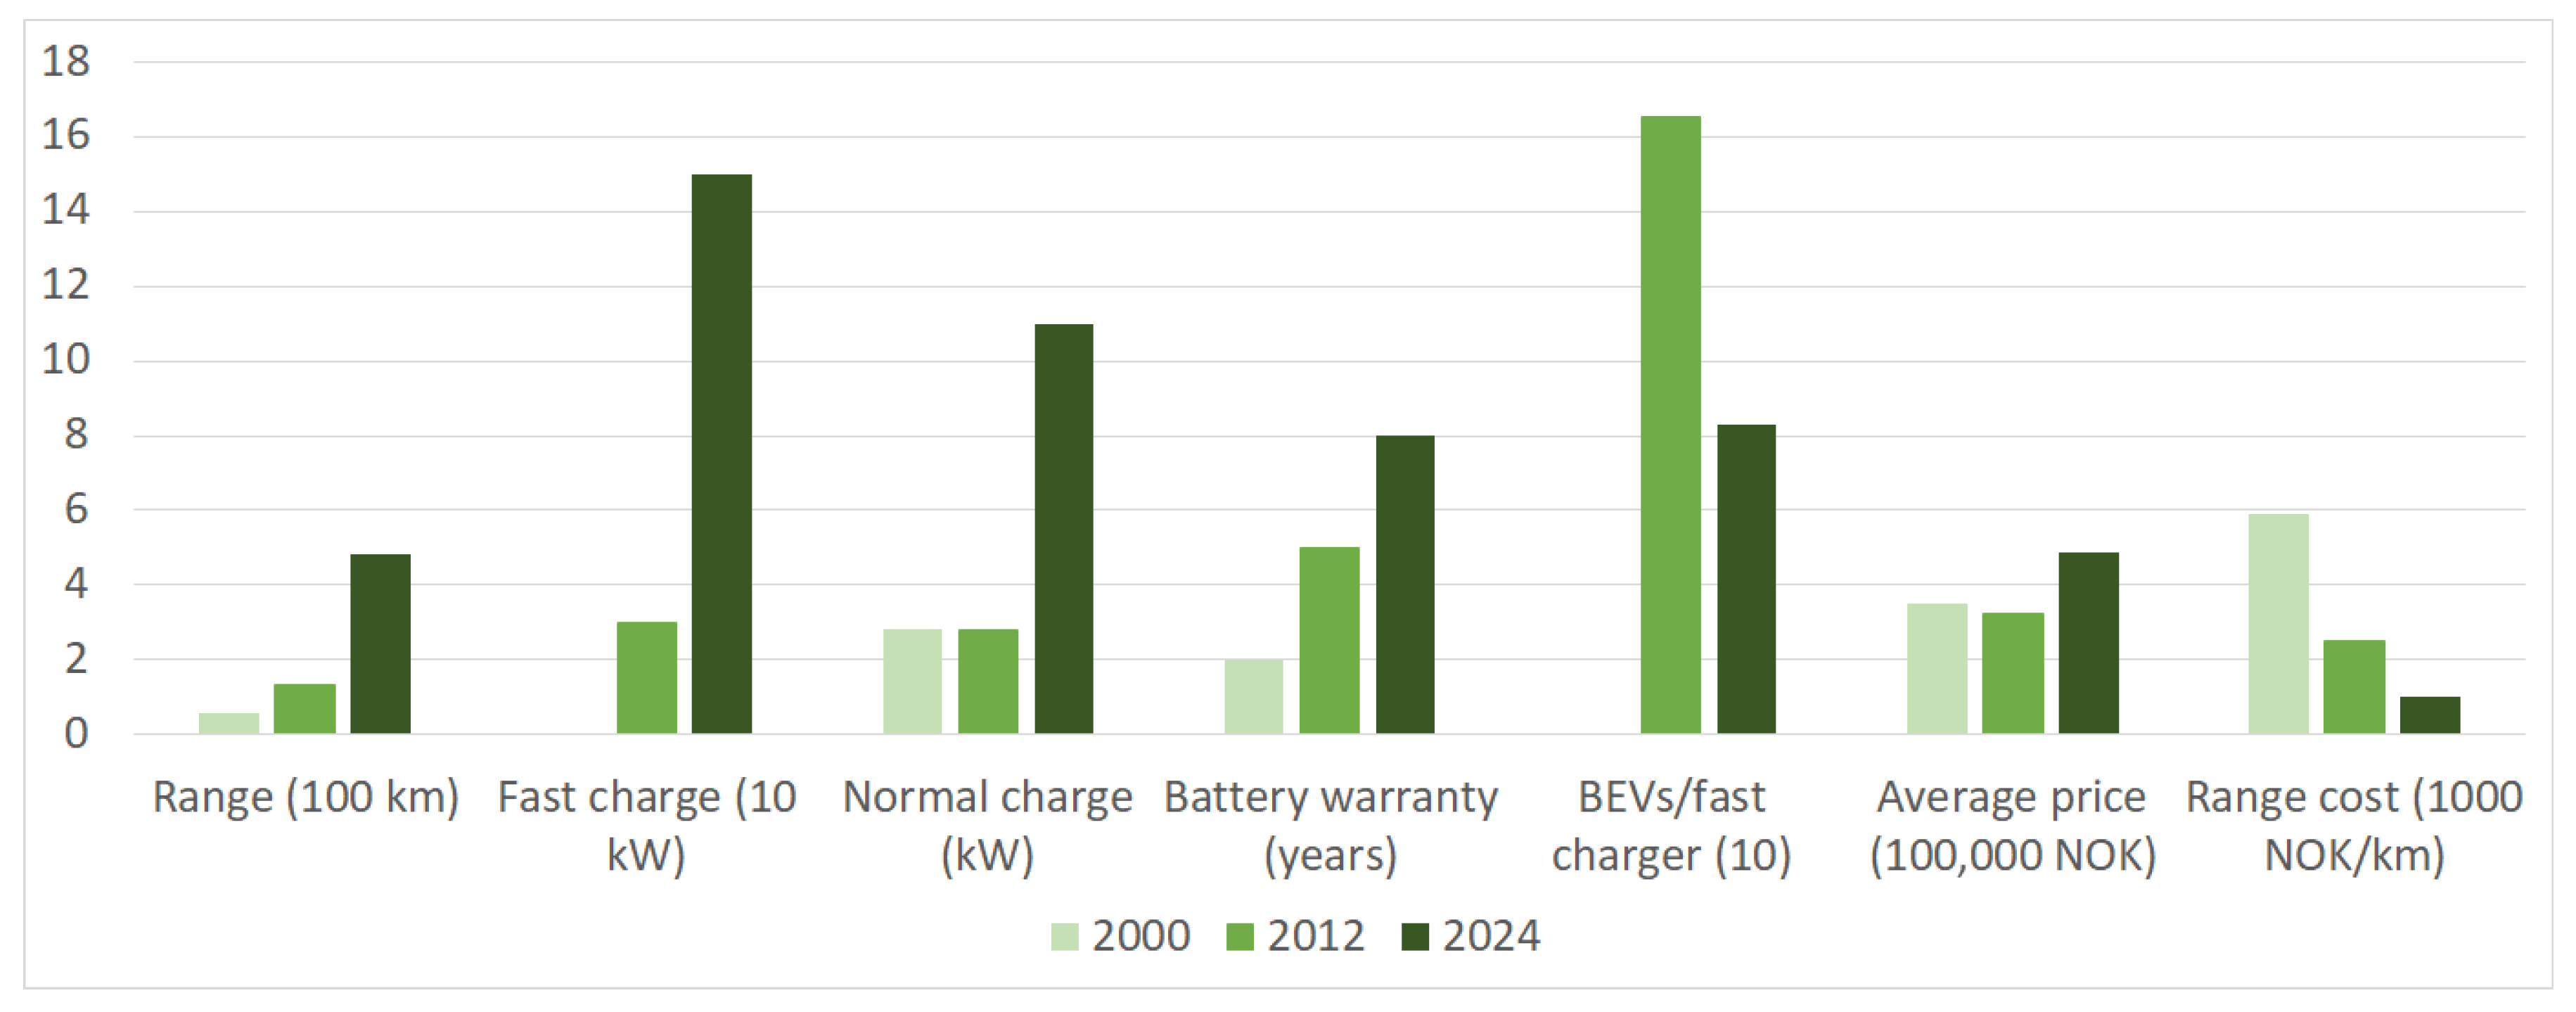
Before 2010, BEVs required large user adaptations due to short- and unreliable range [14]. Ni-Cd batteries improved reliability, but range remained limited. BEVs with two seats, low top-speed, slow acceleration, and all-year range < 50 km [14] were too small, too limiting and too expensive to be a realistic ICEV replacement even in multi-vehicle households. The first Li-Ion BEVs had doubled the range but had no fast-charge. OEM BEVs offered lower costs and a TCO advantage with the incentives factored in, long battery life and warranty, and increasingly longer range and faster charging, as seen in Table 3 and Figure 4. The increased usability made BEVs useful as everyday family run-abouts [24,25] in multi-vehicle households. A broader adoption among single-vehicle owners did not occur until an increasing variety of low-cost, long-range compact BEVs came on the market from 2017, and BEVs became drop-in ICEV replacements.
  • Charging-Infrastructure Challenges
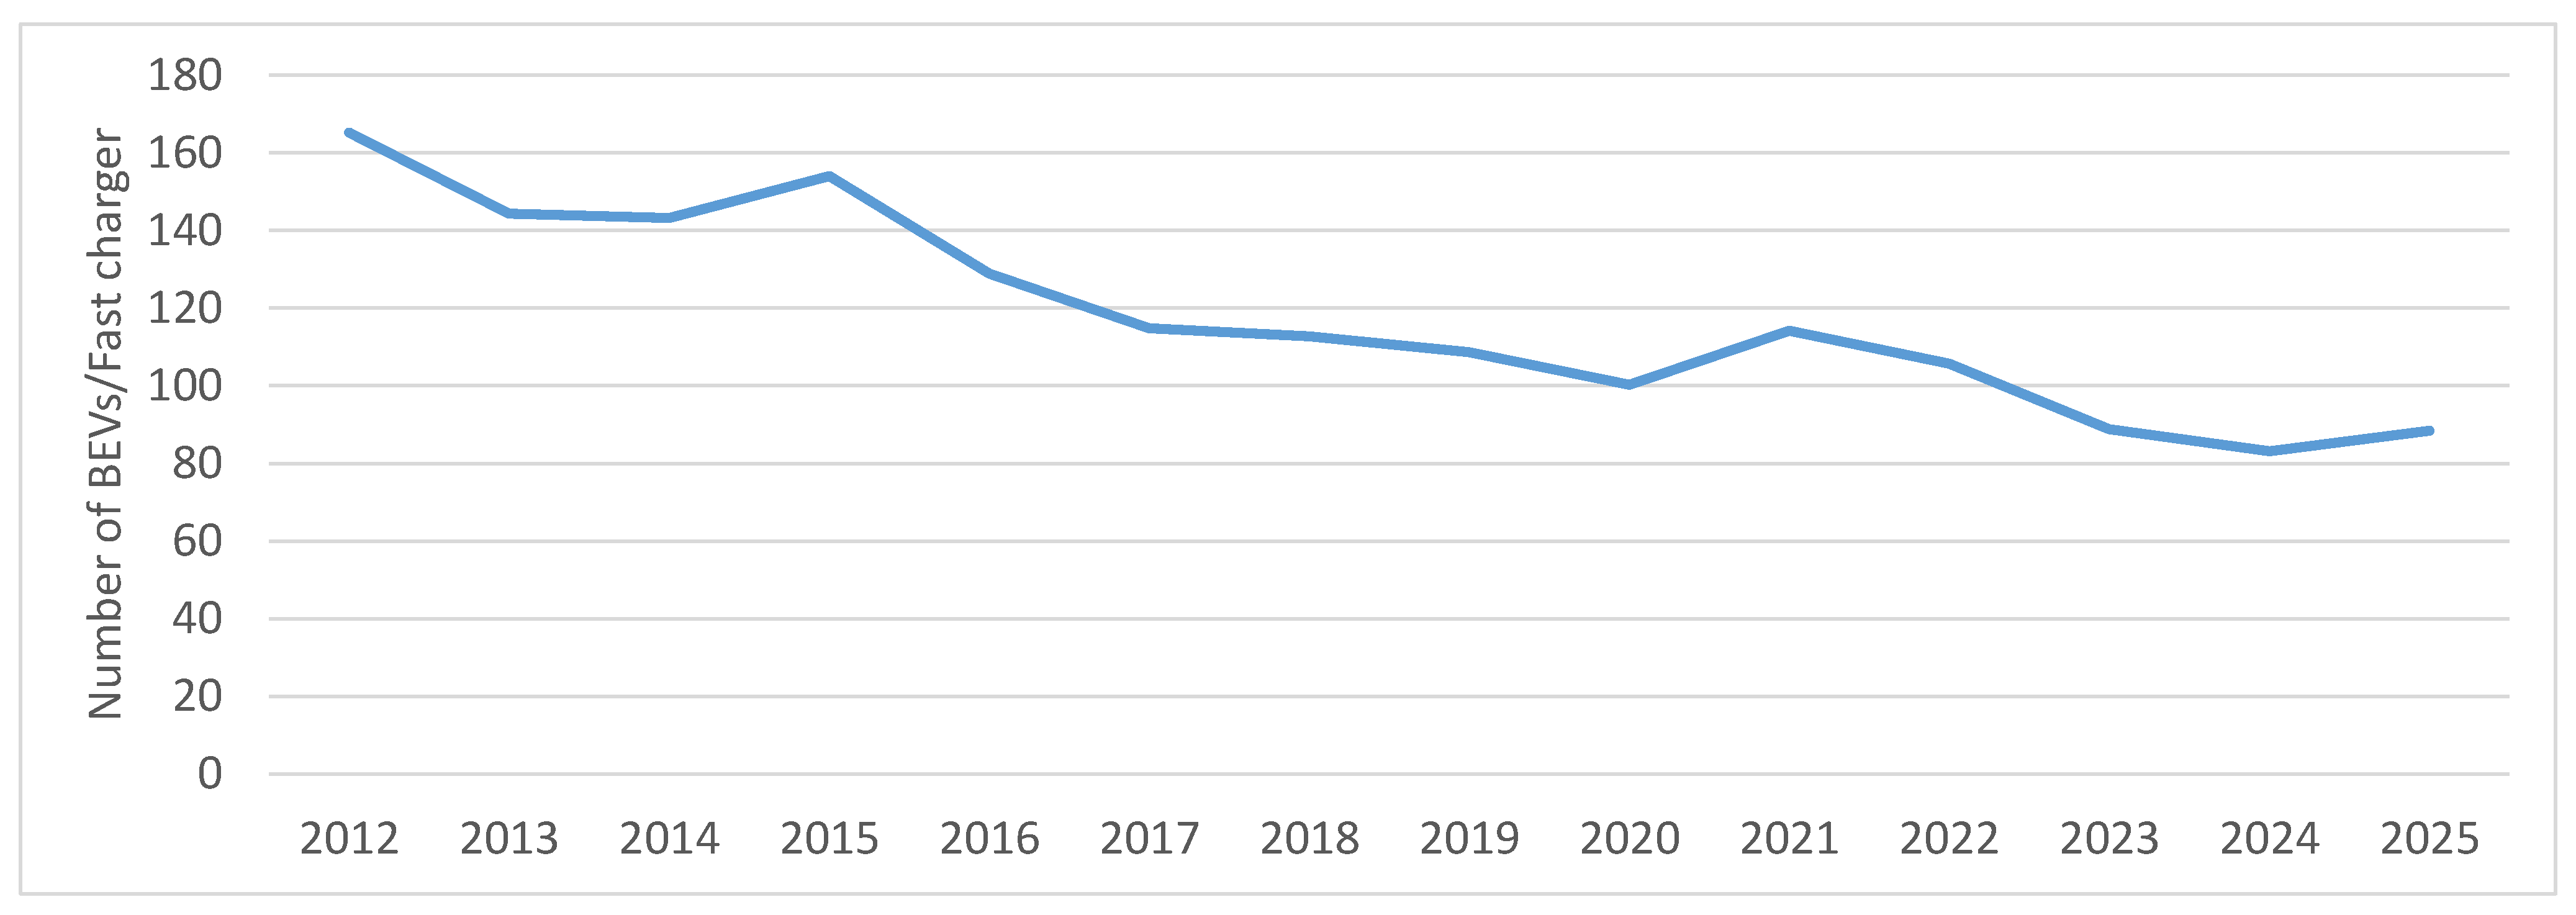
Home charging was first solved using outdoor household sockets available outside most houses and in garages and carports. This worked fine with early BEVs’ small batteries. Wall boxes that add safety and enable higher power charging gradually took over from 2014 and are now the only legal option for permanent charging access. Public charger deployment started from 2008 to 2010 in Oslo and Bergen, across Norway, and in flat owners’ parking facilities with public support. Flat owners received the legal right to access charging in common parking facilities from 2017 [5] which enabled BEV adoption but at a typical cost 50% above house owners [60]. The network of fast chargers, which spread out from cities from 2011 covered Southern Norway by 2017 and Northern Norway by 2021 [61], has become denser relative to the number of BEVs, as seen in Figure 5. The total number of fast chargers passed 10,000 mid-2025 [62]. The network of fast chargers enables long trips, but usability and efficiency have been impacted by queues on peak travel days [6,26] and a chaos of different CPOs, chargers and power levels, apps, and payment systems [63]. The government now demands that all new fast chargers have bank card payment, and as more CPOs offer roaming, charging will become easier in the future.
  • User Groups, Perceptions and Experiences
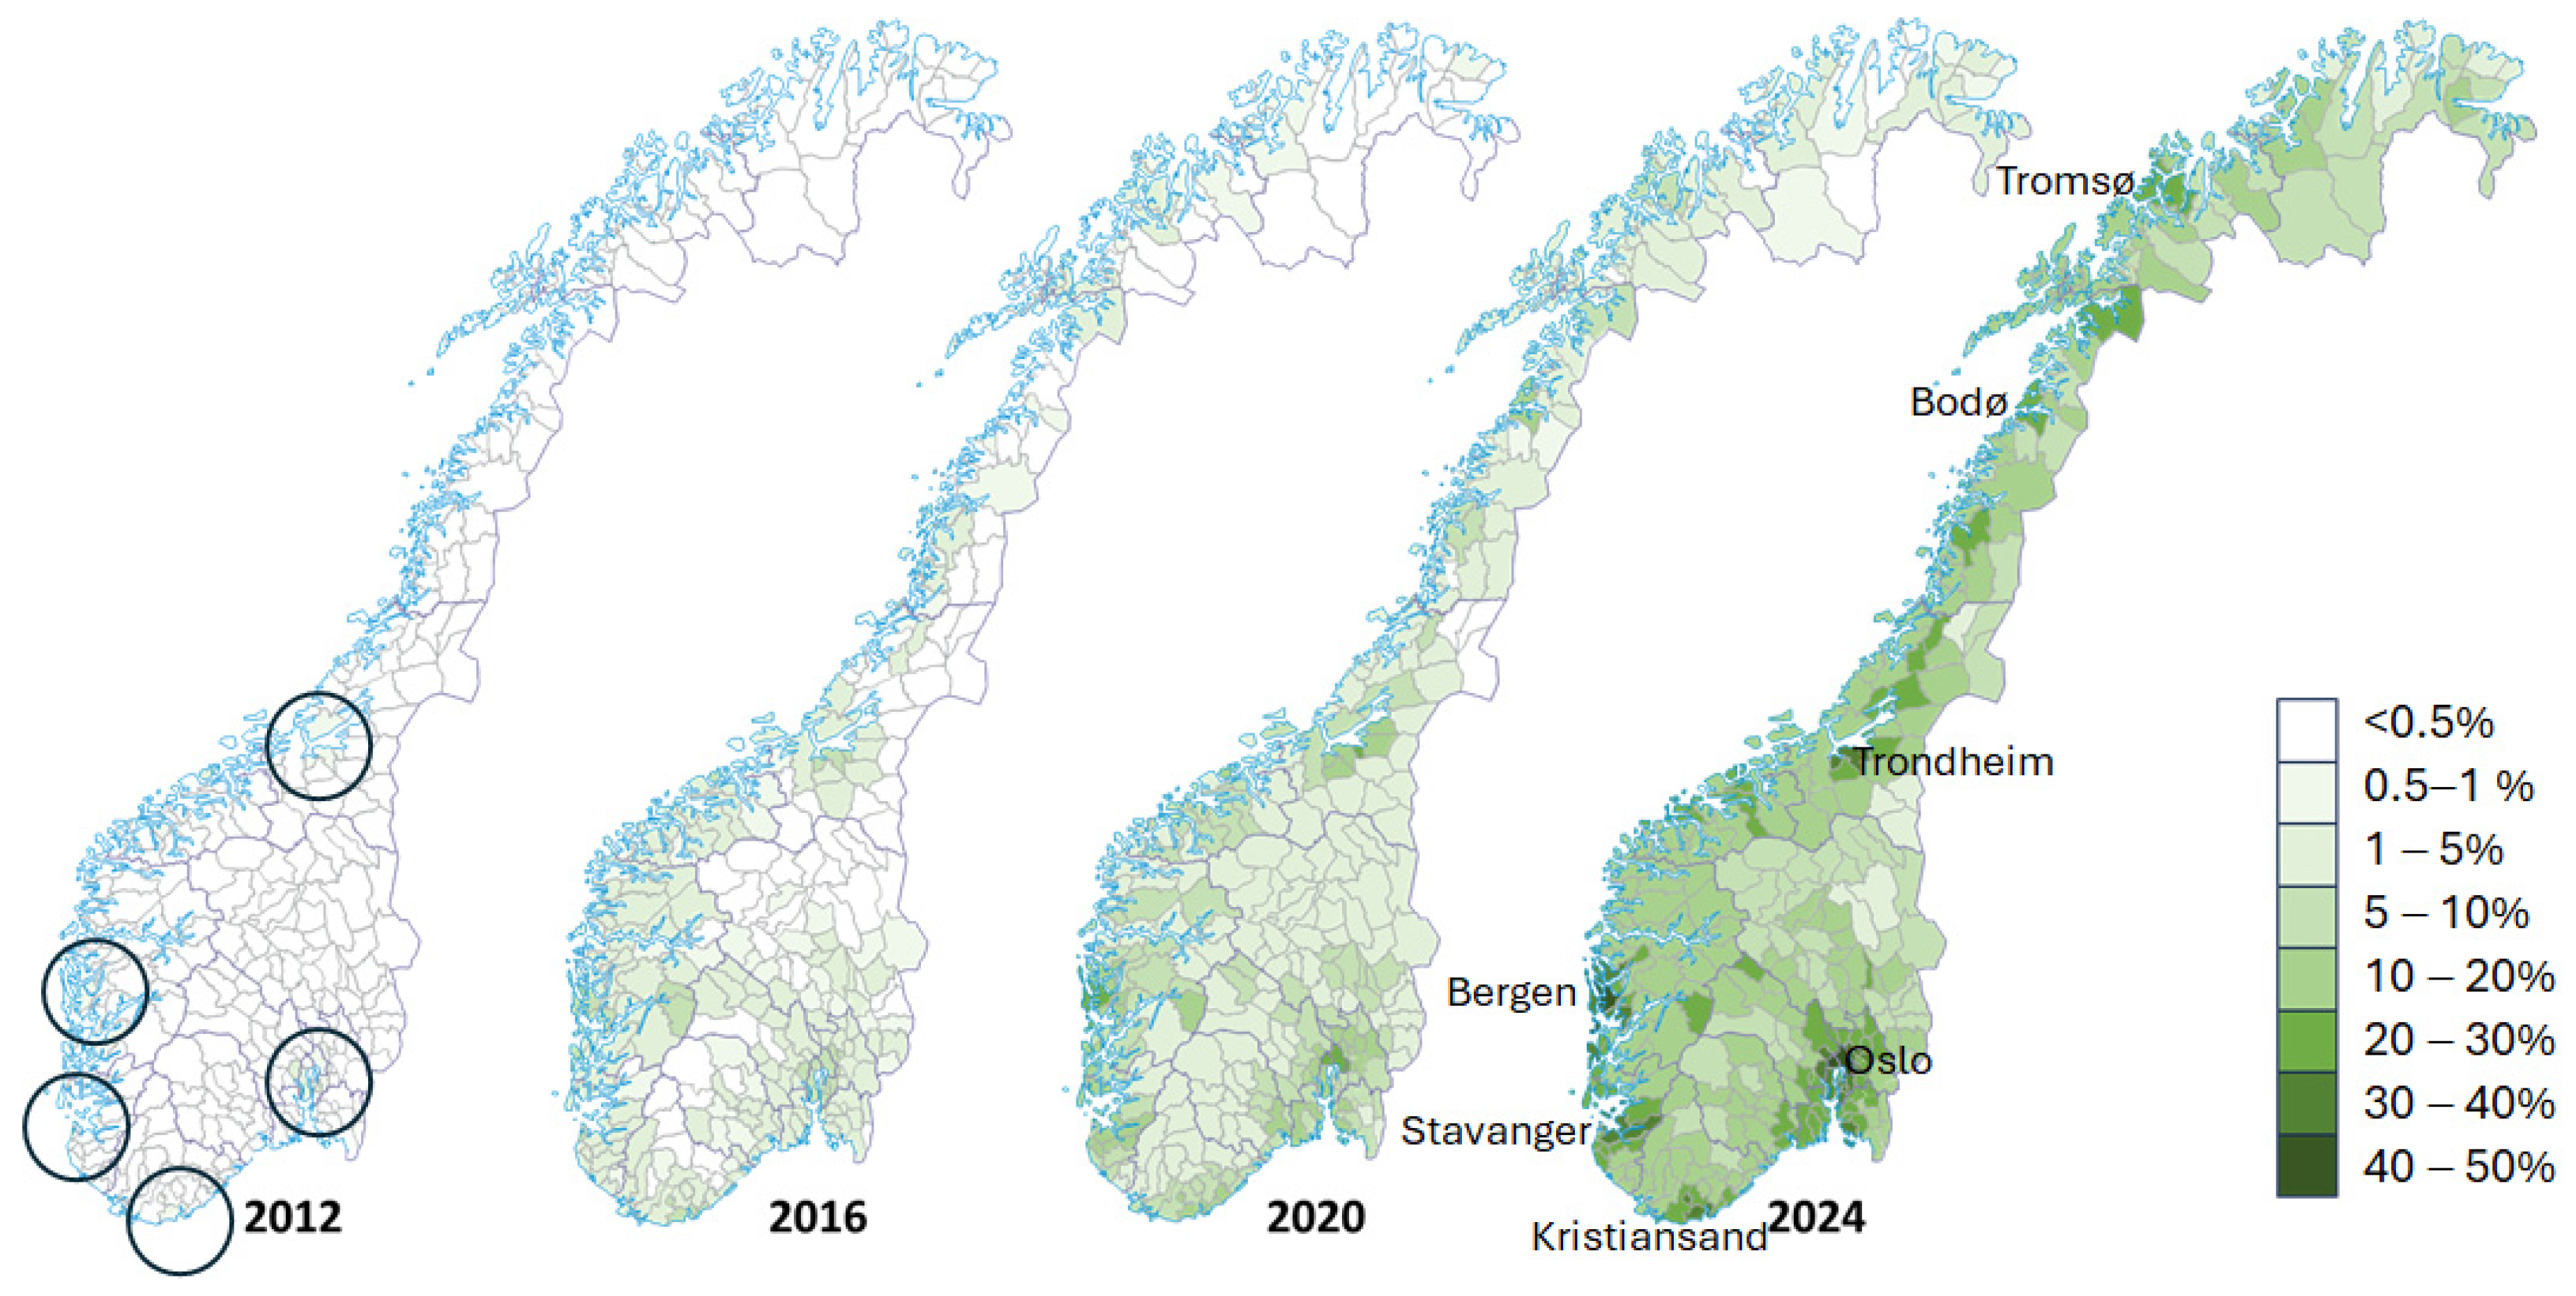
In the 1990s, the first BEV users, i.e., fleets and enthusiasts, did not have positive experiences [14]. From 1999, user experience improved with more reliable BEVs. The bus-lane access from 2003/2005 opened a new niche market. BEVs were still primitive [21] but provided a service inaccessible to ICEV owners, first around Oslo and then other cities [24,25]. The market expanded from municipalities west of Oslo with the biggest bus-lane time savings [64,65] to commuters and multi-vehicle households from 2011 [24] when OEM BEVs became available [21]. They coped with a limited daily traffic range and had ICEVs for vacation trips. BEVs became households favored local run-about, matching similar-aged ICEVs’ annual driving distances [24]. From 2017, access to lower-cost long-range BEVs spread adoption to single-vehicle households [26]. BEVs spread out from city areas with local incentives and the highest visibility of BEVs to city surroundings and eventually across Norway between 2012 and 2024, as seen in Figure 6. User experience became increasingly positive [26].
  • Policies
The Norwegian BEV policies have predominantly been on the demand-side, as seen in the overview in Table 1. They were the first to support BEV testing and experimentation, then BEV industrialization, and since 2011, large-scale diffusion of OEM BEVs to support climate policy targets. The long-term stability allowed new actors to join and develop as others failed and led to a continuous market development between 1990 and 2025, including periods when the global BEV development was down, unlike countries with more variable policies. The main incentives are tax exemptions, which means that the sticker price is what you pay, and the prices have been competitive with ICEVs that have always been heavily taxed in Norway. Some countries provide purchase support that is reimbursed after the purchase, which is not as efficient and transparent to the vehicle buyers as tax exemptions are.
The main supply-side policy has been the support for the roll-out of charging infrastructure, which includes municipal support for normal chargers and deployment of fast chargers from 2011 to build out a basic network of fast chargers along major roads. Most of the later deployment in cities and along major roads has been performed on commercial terms. The Norwegian BEV entrepreneurs did receive specific support, apart from a small investment to help THINK survive through the financial crisis, conditioned on involvement by an experienced auto-actor, which ironically transferred THINK’s production to Valmet in Finland. Vehicle-producing countries supported BEV industrialization to help their producers through the crisis.
  • The end of the road for ICEVs
The Norwegian case shows the effect on the incumbent technology when the new takes over. When BEVs’ market share reached 80% ahead of the 100% national target to only sell ZEVs, ICEV actors became convinced that the market share would continue to grow towards 100% in the coming years and accelerated the development through a rapid downscaling of their ICEV offering. Some importers, including lead brands like VW, went BEV-only. Others imported BEVs from several new Chinese brands. The national fleet share has passed 33%, with areas such as Oslo, Bergen, and Bærum Municipality passing 50% both in fleet share and traffic share [2] through the toll road gates [66]. Whereas the importers and dealers could merely replace ICEV sales with BEV sales [6] with limited impact other than transitional costs, the fuel sellers and workshops are more impacted as BEVs use electricity and require less service as no oil change is needed and they have fewer moving parts. Their market is shrinking as the BEV fleet share increases 4–5 percent points per year and the share of total km driven increases even faster as new BEVs entering the fleet are driven more than the exiting ICEVs [1,2]. Some city stations have already closed (also due to property prices), whereas the remaining install fast chargers.
  • The long lines
The long lines of the Norwegian demand-side and supply-side development are summarized in Table 4, with more details in Table A3 in Appendix A. It shows that the most important demand-side policies for BEV diffusion were put in place before 2011, but the supply-side challenges were not fully solved until after 2011.

5.2. Rational Choices—Total Cost of Ownership

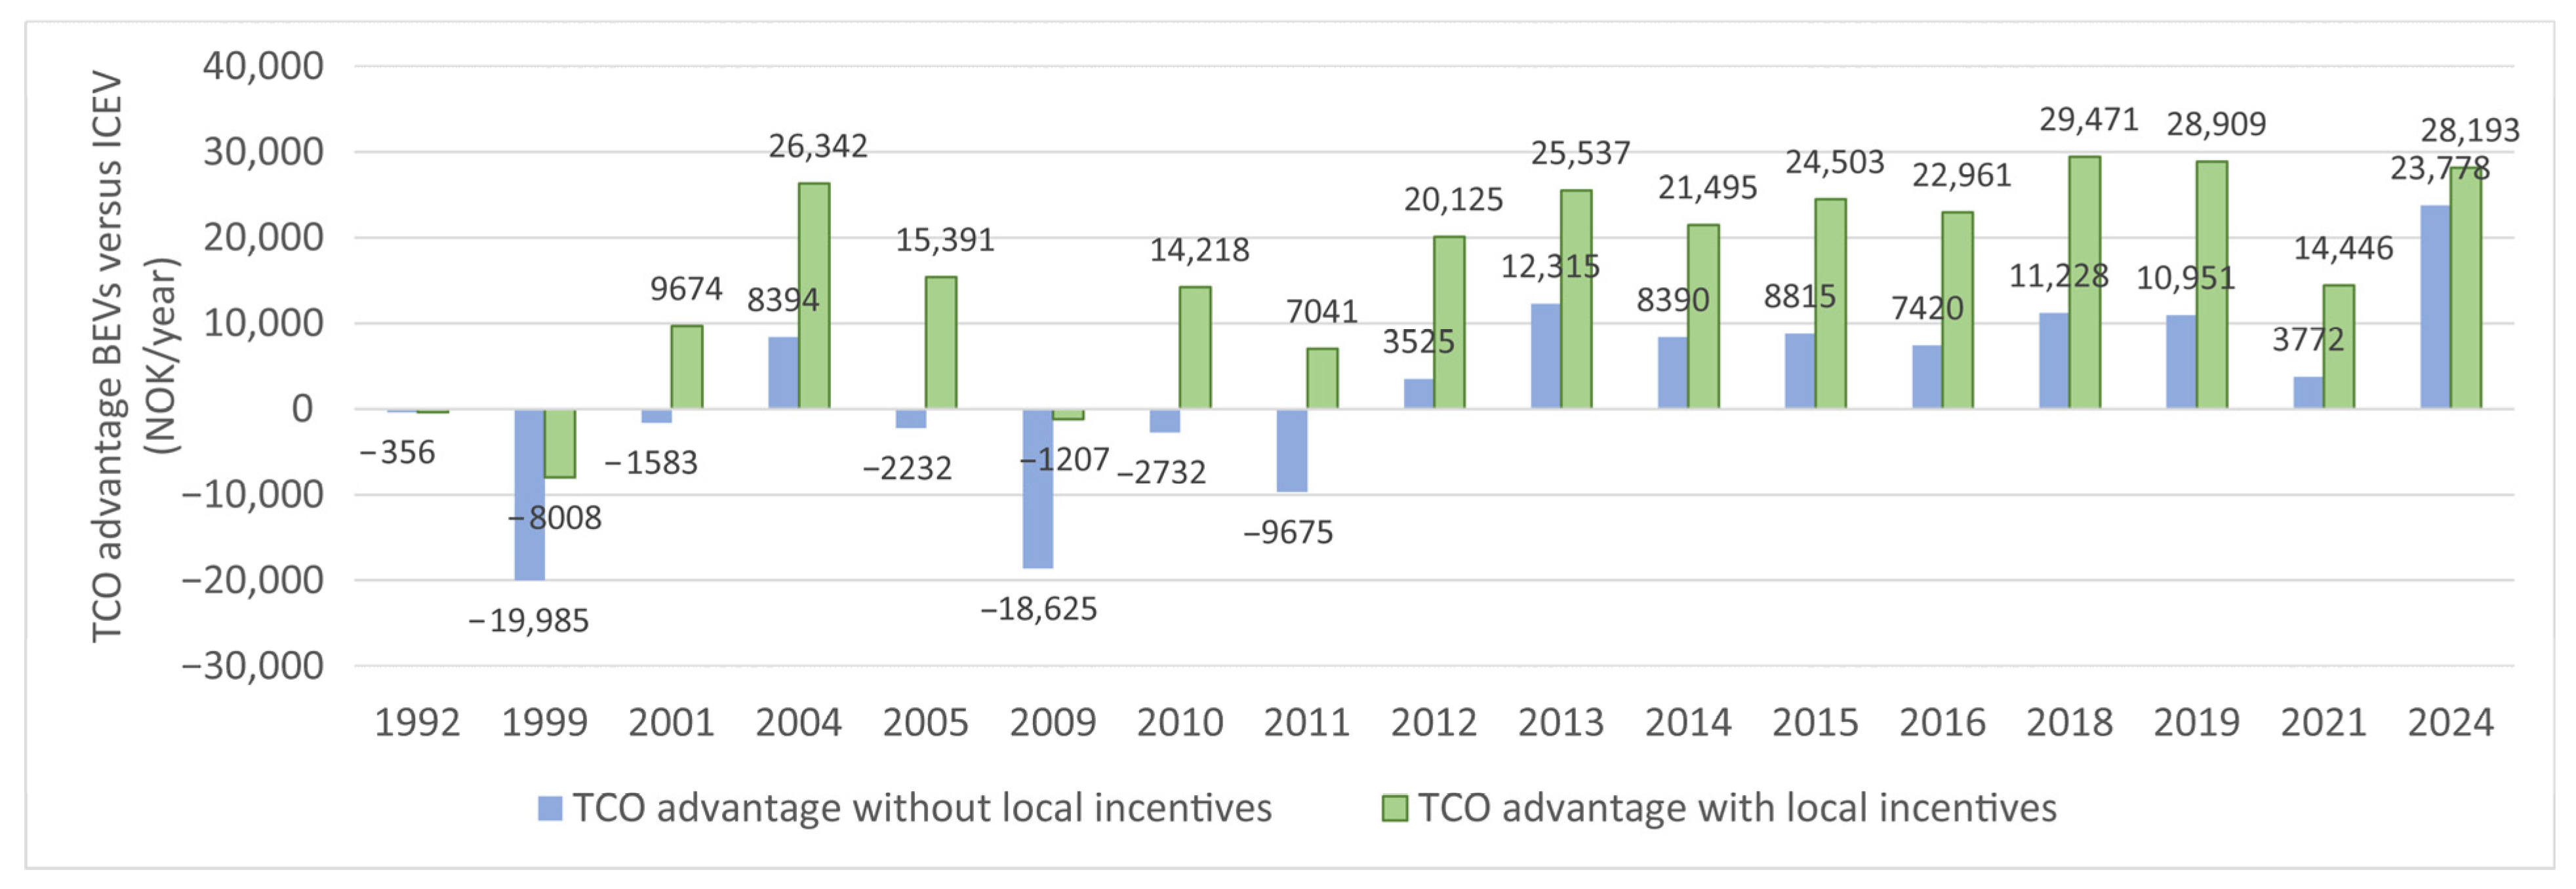
Consumers in Norway have not chosen BEVs over ICEVs for altruistic reasons, but because it was a rational choice providing economic and practical benefits due to the large package of purchase- and local incentives that made BEVs more economic to own than ICEVs [21,24,25,26], as seen in Figure 7. The local incentives have played an important role, with an estimated value in the region of 1000–1400 Euro/year in the period 2014–2019, based on user surveys [24,25,26]. BEV users have been over-compensated for choosing BEVs since 2012 [21], which de-risked battery- and vehicle-life uncertainties and enabled Norway to reach the very ambitious 2025 100% ZEV sales target [3] 10 years before the EU target that new vehicles should emit less than 0/km in 2035. BEVs were less developed in 2025 than they will be in 2035, so less incentives will be needed to meet the EU’s targets for 2035 and in the interim period. The biggest improvements towards 2035 will likely be much higher charge power, also for smaller BEVs with smaller batteries, and reduced costs.

5.3. Societal Process

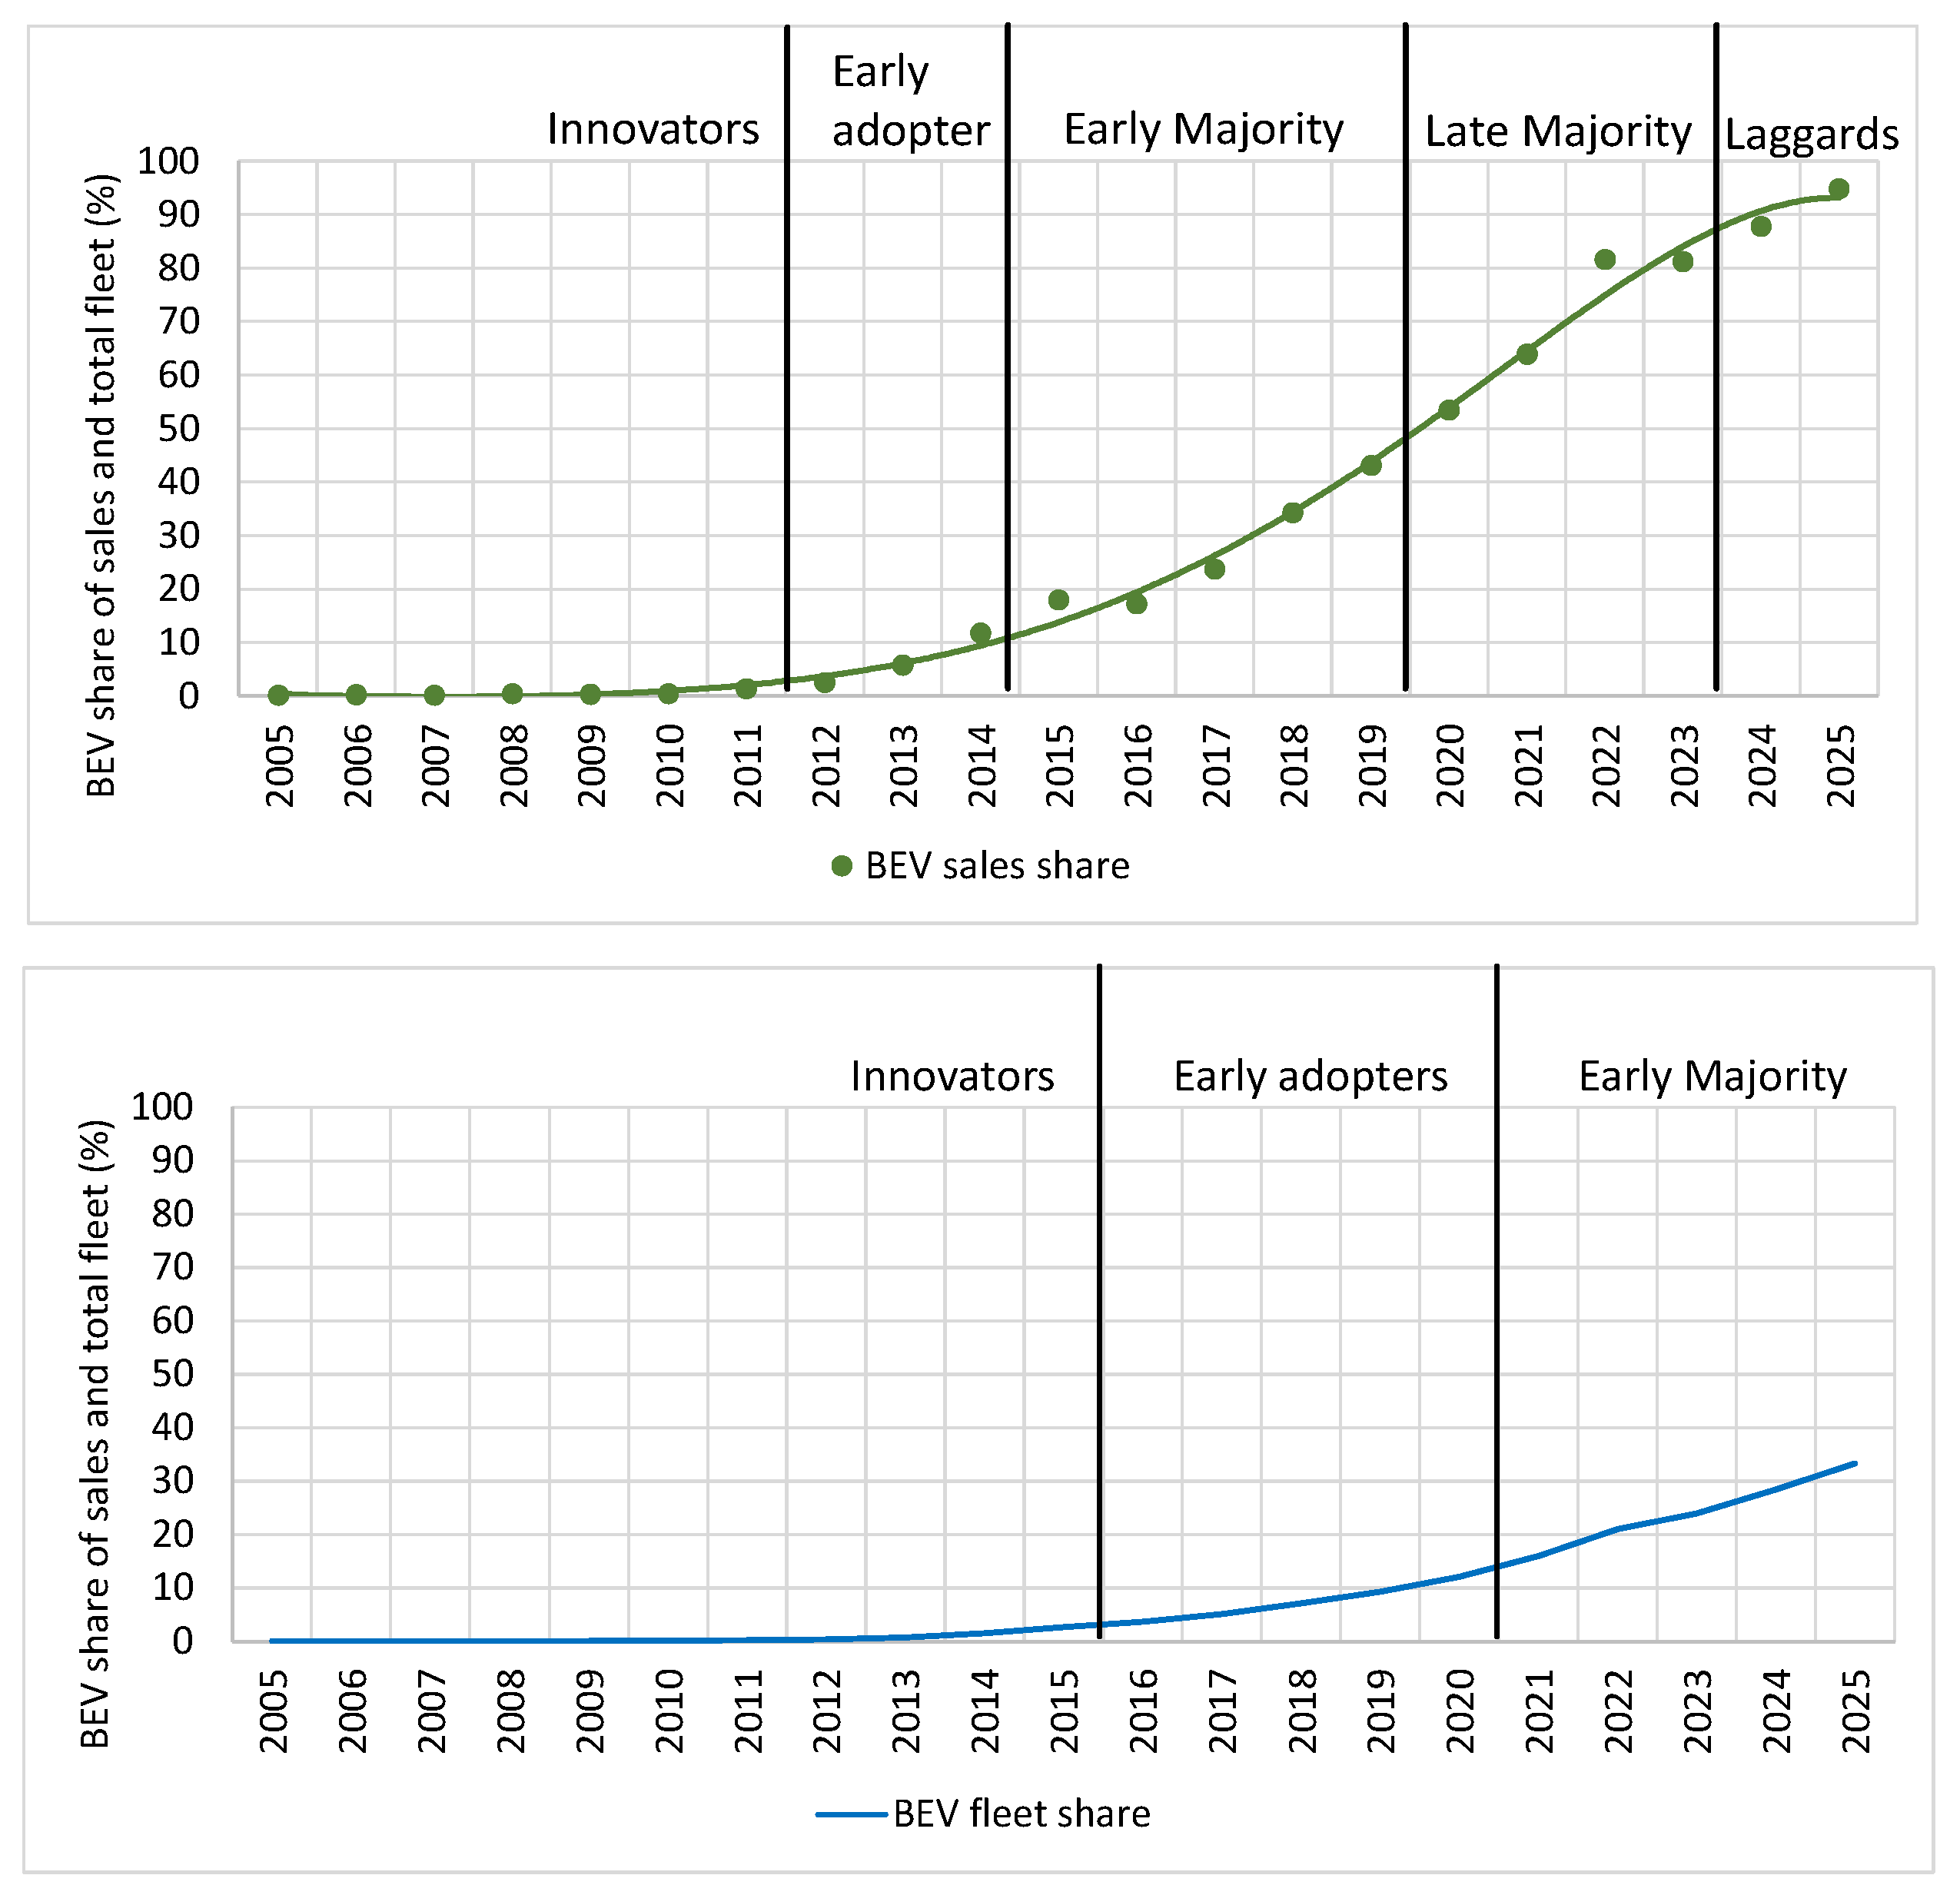
The diffusion of BEVs in new vehicle sales in Norway has, since 2010, followed an S-shaped curve, seemingly in line with Rogers’ theory of diffusion of innovations [42], as seen in Figure 8, for new vehicle sales and the total fleet. The framework conditions and incentives have, since 2010, been constant apart from a gradual reduction of local incentives from 2018 and a minor reduction in financial incentives from 2022. The decisive factor for BEV diffusion is new vehicle sales as new vehicles diffuse through the vehicle fleet as second-hand vehicles until end of life. The policy focus should thus be on new vehicles.
It cannot be concluded that the S-curve is in line with Rogers’ theory. The increases in adoption have followed BEV technology development in terms of reduced cost and charge times, increased range and model availability, and increased fast-charger availability. The first step in 2011 made economically competitive BEVs with a range long enough to be compatible with the needs of commuters and multi-vehicle households available. Fast chargers started to spread out across Norway. BEVs improved gradually until the second main step in 2017 when affordable and smaller BEVs with long range and faster charging became available. The third step from 2020 drastically expanded BEV availability as the EU’s new vehicle CO2 regulation entered into force and BEV sales became a necessity for OEMs to achieve a fleet-average CO2-emission below 95 g/km. The fast-charger network expanded further with 150 kW chargers. Increased adoption was mainly triggered by the continued large total cost of ownership advantages and the increased usability and availability of BEVs over time. Social learning and culture have been less important, although early adopters did report to have enticed others to buy BEVs [25], and the diffusion did spread from households with higher to lower income [22], in line with Rogers’ theory. The final step to move from 80% adoption to over 95%, i.e., into the laggard group, was pushed by the rapidly decreasing ICEV model availability from 2021, in line with Rogers’ theory that laggards do not adopt until they have too. In countries with insufficient incentives to compensate for the extra cost of BEVs, culture, social learning, and personal beliefs may play bigger roles in the current BEV adoption.
The MLP framework explains BEV diffusion from a different perspective. Starting from 1990, a niche market dominated by Norwegian BEV producers slowly developed, but a window of opportunity did not open until 2011 when OEM BEVs became available, after the Norwegian actors had gone bankrupt. Landscape pressure from global climate change concerns and the EU new vehicle CO2-regulation, the ZEV mandate in California, and the NEV regulation in China pushed OEMs to develop and sell BEVs. Long-life Li-Ion batteries enabled an increasingly longer range and faster charging. Norwegian actors took immediate advantage of this window to start the import of BEVs, having Europe’s largest BEV fleet, a full package of incentives in place and high awareness of BEVs in the population to build a market from. Politicians, needing BEVs to be able to meet national GHG emission reduction targets, kept the incentives in place. BEVs became TCO competitive [21] and attractive to multi-vehicle households and commuters. Gradually, a BEV regime emerged, growing from within the existing ICEV regime. This new BEV regime gradually replaced the remaining part of the ICEV regime as the constant pressure from the EU’s CO2-regulation led to continued development of longer-range and faster-charging BEVs at a lower cost that where easy to sell with the Norwegian incentive. BEVs became the dominant regime in new-vehicle sales, but the second-hand market is still dominated by the ICEV regime but will not be for much longer.
The TIS framework is useful for understanding the innovation aspect of the development, which up to 2010 was a classic innovation case in which entrepreneurs, energy companies and municipalities pursued a small niche for Norwegian-made city BEVs. An entire ecosystem with the TIS functions and structural elements required for BEVs to become a success was built up with support from a large package of incentives motivated by the prospect for industrial development. When that TIS failed due to actors’ lack of economic resources to survive the global financial crisis, BEVs became exogenous inputs by OEMs in the global BEV-TIS responding to the EU’s new vehicle CO2-regulation. The incentives remained in place, institutionalized into party programs, government declarations and broad and long-term parliament policy settlements anchored in climate policy. The TIS aligned with a functional system as BEV technology improved, BEV availability increased, and energy actors built out a nationwide charging infrastructure.

5.4. Differences from Other Countries

Norway had a natural advantage with cheap electricity from a strong grid. Most Norwegians have access to private parking in garages, carports, outside houses, and buildings, where electricity often was already available from outdoor sockets that were useable for charging. Speed limits are among the lowest in Europe, which extend BEV range, whereas Norway’s harsh winters work in the opposite direction. Battery life is less impacted by cold environments than hot, so battery life may be longer in Norway than in the south of Europe.
Norway managed to continuously develop a small BEV market between 1990 and 2010 so that the BEV fleet grew slowly but continuously, in contrast to other countries with early and substantial BEV activity such as France and California (US) that abandoned BEVs in 2002/2003. Norway had a head start in 2011, having 35% of all BEVs registered in Europe, as seen in Figure 9, and a higher per capita BEV fleet than any other country. Of all the other European countries, only the UK and France had a broad policy package in place in 2010, as seen in Figure 10. Norway has over-compensated for the extra cost of BEVs [21], whereas other countries have in general undercompensated, with Eastern and Southern Europe, the Balkans, and the Baltics having particularly weak incentives, and low sales shares up to 2025, as seen in Figure 2. The high awareness of BEVs and the existing pool of BEV owners provided importers and dealers with an initial market to grow from that was unavailable in other countries that had insufficient and unstable policies and incentives and low BEV awareness and interest.

6. Discussion

The article has provided a holistic overview of the 35-year-long Norwegian BEV development to be able to investigate the article’s two research questions.
  • RQ1, “What are the most important factors behind the 35-year-long Norwegian BEV development?”
The large package of incentives that were gradually introduced between 1990 and 2009 is by far the most important factor behind Norway’s much more rapid development than other countries. These incentives built up a Norwegian BEV industry and a small initial BEV market that at the time was Europe’s largest. The Norwegian production solved BEV supply-side issues between 2003 and 2010 when no other countries produced BEVs. OEMs saw the technology as insufficient for mass production and too expensive relative to user benefits. Bankruptcies due to insufficient resources and subsequent restarts of the Norwegian producers inhibited the early market expansion. This prehistory and the continuation of the incentives allowed BEVs to take the step up and become a new technological and market regime when a window of opportunity opened with access to OEM BEVs from 2011. The existing incentives, BEV owners, awareness, and knowledge provided a platform for rapid market expansion.
BEVs became the lowest total-cost-of-ownership option and the rational choice for expanding groups of new-vehicle buyers. BEVs conquered the ICEV regime from within, without significant contestation, as the impact on importers and dealers was limited. The economic benefits for buyers far outweighed any importance of social learning or culture as an explanatory factor. Adoption accelerated to new buyer groups for each major technological step, starting with the introduction of OEM BEVs in 2011, followed by the availability of long-range reasonably priced BEVs from 2017, the rapid BEV model expansion from 2020, and the dismantling of the offering of ICEVs from 2021. The development could not have happened without the EU’s CO2 regulations for new vehicles forcing OEMs to sell an increased variety of longer-range, lower-cost BEVs. Charging was solved opportunistically using existing outdoor sockets until wall boxes became the norm and fast chargers were built out to a national network covering all main roads between 2011 and 2021 with public-support money. Parallel and further fast-charger network expansion has been performed on purely commercial terms.
The incentives were put in place when the cost was low. They could remain in place for so long because the political motivation shifted from testing and industrialization up to 2010 to climate policy from 2011, which provided the rationale for continuing BEV incentives that enabled Norway to reach the extremely ambitious national target to only sell ZEVs from 2025 that was put in place from 2017 to support the Paris Agreement. The incentives were over time institutionalized into party programs, government declarations and cross-party policy settlements, and thus were de facto protected. They could be financed with proceeds from the national oil-income-based Government Pension Fund Global [5]. Minor reductions in incentives from 2018 did not harm the market, and further downscaling is possible [70], as seen by increasing market shares in countries with less incentives.
  • RQ2, “What makes the Norwegian BEV development different from that of other countries?”
Norway stands out among other countries in several ways. It is a global and European forerunner that is 5–10 years ahead of the EU, which enables other countries with less-developed markets to learn what happens when the market and fleet shares increase. Norway has no ICEV industry which led to much less BEV contestation than in countries with ICEV production, and more support for building a national BEV industry and market. The electricity is 100% clean, which gives BEVs a positive image and makes BEVs a more important GHG emission reduction tool than in countries with fossil energy in the electricity mix. Charging, which has been raised by many countries and OEMs as a major barrier to BEV adoption, has not been a major challenge in Norway. The strong Norwegian grid delivers sufficient power to households to enable low-cost home charging from 4.6 to 7 kW wall boxes, some places even 11 kW, in private parking spaces, garages and carports. Home charging access will be a bigger challenge in countries with weaker grids, a higher share of flats, and a higher share of the population living in dense cities.
The large incentives and market build up until 2010 gave Norway a head start over other countries. The stable policy and incentives continued beyond 2011 to support ambitious national climate-policy targets, despite increasing tax losses and the bankruptcies of the Norwegian producers. Vehicle-producing countries must take account of policies’ impacts on industry and have less leeway for large incentives than Norway that balances the national budgets with oil-sector income. Weaker and unstable incentives have negatively influenced user perceptions and willingness to buy BEVs and market actors’ willingness to sell BEVs in other countries. Norway shows the importance of a stable policy motivation for targets that provides clear direction for BEV proliferation and ICEV decline, accompanied by incentives that enable the targets to be reached. The incentives in Norway have been very large but also necessary to be able to reach a target to only sell ZEVs a full decade before the EU’s CO2-target was supposed to produce the same result.
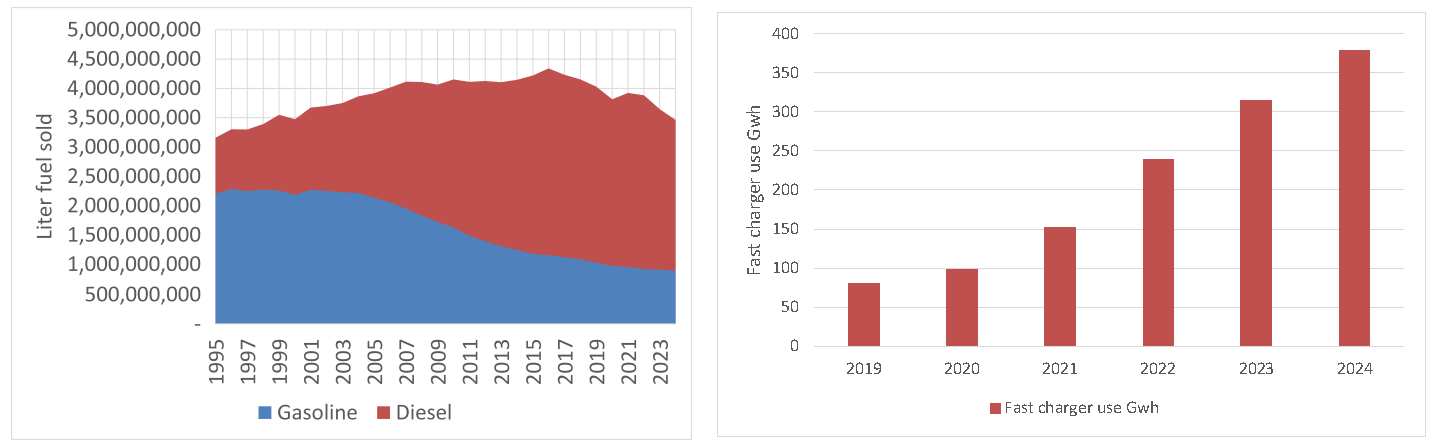
The rapid growth has threatened Norwegian actors’ existing business but has also provided rapidly growing opportunities for new business development. The vehicle sales actors could increasingly replace ICEV imports and sales with BEV imports and sales with little impact on their core businesses. Deployment of a basic network of fast chargers was performed by CPOs from the electricity sector with government-support money in the beginning. It was not until fuel sales started to shrink in 2016, as seen in Figure 11, that fuel-sector actors started to install chargers, first in cooperation with CPOs, and then on their own. The charging infrastructure now grows solely through commercial investments. Several global infrastructure funds have invested in CPOs to fund further expansion [71,72]. Charging infrastructure in other countries should, as in Norway, be turned into a commercial market as the BEV fleet growth continues.
It would not have been possible to reach the large market shares in Norway without the EU’s CO2 regulation for new vehicles forcing OEMs to sell BEVs on a large scale [56] and thus solving the vehicle supply challenge. The long time-horizon and slow ramp-up of the regulation has made it vulnerable to demands for relaxation due to the current slump in BEVs sales. The OEMs blame the slow market on the EU and national states for not providing enough incentives and deploying too few public chargers. The Norwegian market pulling incentives have in contrast pushed demand with little contestation as Norway has no ICEV lobby, and actors found it easy to adapt to the new regime.
Relations to Research Theories
The rapid development of BEV technology constitutes a challenge for using societal transition frameworks for studying BEV adoption over time. A 2025 BEV is simply not the same as the first OEM BEV sold in 2011 and is even more different from a BEV sold in the 1990s and 2000s. Technology development and cost reductions have solved most of the demand-side and supply-sided challenges and been the main drivers of BEV adoption. This is especially accurate in Norway, where the incentives have made BEVs the rational economic choice since 2011. The MLP, the TIS, and Rogers’ theory on the diffusion of innovations nevertheless contribute to the holistic perspective on the Norwegian BEV development, which was the purpose of this article.
The TIS framework explains the pre-2011 development as a classic national entrepreneurial innovation case spearheaded by entrepreneurs and supporters, and the post-2011 development as a national BEV TIS focusing on BEV sales and charger deployment within a larger global BEV TIS supplying the BEVs. The MLP framework sees the niche market and policy development up to 2010 as the steppingstone to a window of opportunity that opened to develop a larger BEV market from 2011 with access to BEVs from inside the ICEV regime, following large climate policy pressure from the landscape. Rogers’ theory predicts an S-shaped adoption curve, but this was not necessarily the result of social learning between buyer groups but rather the result of technological improvements and cost reductions that made BEVs useable, accessible, and economical to buy for broader consumer groups. The mobilization of laggards happened as predicted by Rogers when they no longer had a choice other than to buy BEVs after importers drastically reduced ICEV availability.
Future work:
Norway achieved the very high market shares with very large incentives; a strategy others cannot follow due to the high strain it would have on national budgets. Further research should therefore investigate the following issues:
  • Will BEVs still be a rational choice in Norway when the VAT exemption is fully removed by 2028 and other incentives are reduced, or will the price increase effect of the VAT and reduced advantages be partially or fully compensated by reduced BEV manufacturer prices so that the market share stays high?
  • Have the vehicle buyer preferences changed so much that the “norm” of choosing BEVs in the new-vehicle market will remain even if the economic advantages are reduced?
  • The Norwegian BEV incentives overcompensate BEVs so much that the economic benefits completely overshadow all other reasons for buying or not buying BEVs, but how will this play out in other countries with fewer incentives?
  • Will other countries be able to diffuse BEVs faster now that BEVs are much more developed, desirable, and available, or must costs still be reduced with large incentives, and BEV interest take its time to rise?

7. Conclusions

This paper demonstrates that the Norwegian BEV development can be understood as a 35-year-long interactive process of innovation, development of consumer needs and experiences, cost reductions, technical development of BEVs and batteries, interactions with other countries, and societal processes involving policies and incentives, which solved the demand-side and supply-side challenges of moving towards 100% BEV sales. Norway had specific national conditions that led to higher BEV sales than other countries from 2011, such as clean electricity, good access to low-cost home charging, and a large package of incentives that made BEVs affordable to all new vehicle buyers. In 2010, Norway had a head start due to having Europe’ largest pool of BEV owners and high-awareness and visibility of BEVs due to earlier activity. Other countries started from scratch.

Funding

Parts of this article is based on data and knowledge funded by the research council of Norway under contract nr. 267848.

Data Availability Statement

The original contributions presented in this study are included in the article. Further inquiries can be directed to the corresponding author.

Conflicts of Interest

The author declares no conflict of interest.

Appendix A

Table A1. BEV incentives. Source: Author.
IncentivesYearComments
Fiscal incentives: Reduction in purchase price/yearly cost gives competitive prices
Exemption from the registration tax1990/1996Temporary 1990. Permanent 1996 as tax on value and weight. Weight, engine power and volume 1999–2005. CO2 replaced engine volume 2007. Engine power removed in 2018.
Value Added Tax (VAT) exemption, implemented as a zero-rate VAT.2001Introduced in mid-2001 when the VAT was 24% (now 25%). From 2023 was full VAT introduced on the part of the value of BEVs exceeding 500,000 NOK.
Zero-rate VAT on BEV leasing and on replacement batteries2015Reduce worries about second-hand value and make leasing more attractive. Battery replacement VAT exemption only effective outside battery warranty. Changed as above.
Zero-rate VAT on wall box and standard installation cost2013–2019Zero VAT on BEV purchase extended to equipment and the wall box with standard installation was considered equipment when purchased with the BEV
Reduced annual tax (from 2018 called insurance tax)1996/20041996–2003: full exemption. 2004–2017: low rate. 2018–2020: full exemption. Gradual re-introduction to full annual tax 2022–2023.
Reduced company car benefit tax2000Introduced when BEVs had short range and minimal private advantage. The reduction varied over the years, with limited impact on top of other incentives.
Exemption from ownership change tax2018–2021This tax is imposed on sales of used ICEVs. BEVs were exempted 2018–2021.
Direct subsidies to users: Reduction in variable costs and help solving range challenges
Reduced toll roads19971997–2017 full exemption. Oslo users saved up to 1000 €/year. Other places users could save more. Revised 2017: Rates decided locally, max 50% of ICEVs. From 2023:70%.
Reduced fare main road ferries2009Reduced fares 2009–2017. From 2018 up to 50% of the ICEV rate. From 2023 up to 70%.
Financial support normal chargers20092009 financial crisis fund. Additional local support from counties and municipalities
Financial support for fast chargers2011Supported by Transnova 2011–2014. Enova from 2015 and some counties.
User privileges: Reduction in time costs and providing users with relative advantages
Access to bus lanes2003/2005Full access Oslo area: 2003. Nationally 2005. Local authorities to decide from 2017. Some restriction around Oslo since 2015 due to congestion in bus lanes.
Free/reduced parking fees, including. Preferential BEV parking to charge1999Fully exempted 1999–2016. Local authorities can since 2017 charge BEVs. Parliament decided max BEV rate 50% of ICEV rate from 2018, 70% from 2023, not implemented.
Organizational measures enabling an efficient transition
Right to access chargers in jointly owned properties (flats) 2017Law change. Owners of flats in jointly owned properties can demand access to chargers in the jointly owned parking area/garage.
Right to access chargers in parking areas of housing communities 2020Law change. Owners of flats in housing communities can demand possibility to charge BEVs in the jointly owned parking area/garage.
Obligation to offer charging access in parking facilities2017/2020Law change. Up to 6%, depending on BEV fleet shares, of parking spaces in park houses, other parking areas should also be equipped.
DisincentivesYearComments
Vehicle weight tax2023Weight tax on weight above 500 kg on all vehicles. Hit heavy BEVs harder than ICEVs.
Annual tax2024A slightly higher tax on BEVs than on ICEVs from 2024.
Table A2. Documents and sources.
TopicResearch Articles and ReportsOther Reports and Documents
Demand-side and supply-side issues[1,6,12,13,14,27,36,48,49,50,56]
BEV and market development[1,6,12,13,14,15,16,20,21,36,37,38,48,49,50,63,69][35,43,56]
BEV user needs, perceptions and characteristics[1,6,12,14,20,22,23,24,25,26,27,28,63,64,65][39]
Effects of policies and incentives [1,6,12,13,14,17,18,19,20,21,24,25,26,29,30,31,70]
Charging-infrastructure needs/perceptions[1,6,12,24,25,26,27,28]
Charging-infrastructure experiences[1,6,12,24,25,26,27,28]
Charging-infrastructure deployment and organization[1,6,13,27,28,63]
Policy development[1,5,6,12,13,18,36,48][2,4,47,51]
Societal development [1,14,15,16,18,22,40,41,42,48,49][10,52]
Governance[3,4,5,31,51]
Datasets[2,9,11,32,33,54,58,67,69,73]
Press articles, press releases, and newsletter[7,8,34,45,46,53,55,57,59,60,61,62,66,68,71]
Table A3. Summary of the 1990–2025 BEV diffusion phases separated into supply-side and demand-side characteristics: Source: Author.
Supply-Side ChallengesDemand-Side Challenges
PeriodBEV Production and AvailabilityBEV Value ChainsCharging Infra-Structure DeploymentCharging Infra-Structure Value ChainPolicies VehiclesPolicies Charging InfrastructureUser CharacteristicsUser Knowledge Awareness and PerceptionMarket ActivityCharging Infrastructure AvailabilityTotal Cost of Owner-Ship (TCO)Policies
1990 Status
1990 statusNoneNoneNoneNoneNoneNoneNo usersBEVs totally unknownNone Outdoor power sockets are widely available, used for ICEV engine heaters None
Norwegian BEV producer-led innovation phases
1990–1996Import of Kewets, PIVCO prototypes, tests of French BEVsEnergy sectors actors invest in PIVCO who use standard BEV system and Ni-CD batteryNone, could use existing outdoor Schuko socketsNoneResearch grantsNoneFleets, technology enthusiastsEnergy sector and other fleets test BEVs.
Test programs evaluate potential
Testing BEV as a concept. BEV rental tests.
Demonstrations and awareness raising activities
Home charging with domestic outdoor Schuko sockets Unfavorable Exemption reg. Tax Exemption annual tax
1997–2002THINK city BEVs
French BEVs limited
THINK uses available BEV components and French Ni-CD batteryLess than 30 charge boxes with Schuko plugs availableSome dealers and energy sector actors deploy chargers on own landNoneNoneFleets, technology enthusiastsSlow uptake, fleets and enthusiasts, uncertainty prevailRegular sales to fleets, some consumersHome charging with domestic outdoor Schuko socketsUnfavorable As above plus: Free road tolls Free public parkingExemption VATReduced company car tax
2003–2006Import of used BEVs from France/USA, Buddy production from 2005Buddy: Uses standard drive system and lead-acid batteryLess than 30 domestic type Schuko sockets availableNoneNoneNoneCommuters driving in bus lanesCommuter bus-lane access and toll road savings build positive imageSecond-hand import to support bus lane marketHome charging with domestic outdoor Schuko socketsUnfavorable unless very large local incentives advantageAs above plus: Bus lanes access
2007–2010THINK BEVs and Buddy produced in Norway (THINK move production to Finland 2010). Reva imported. THINK: uses Na-NiCl2 and Li-Ion batteries and THINK specific drive-system.
Buddy: Std. drive syst., lead-acid and Ni-MH battery
<30 domestic Schuko sockets available. Oslo plan to deploy 400 public chargers, Municipalities are the main actors in deployment. Some producers of outdoor power socket installationsA public funding agency invests in THINK.
Transnova support for chargers outside Oslo
Transnova support for chargers across Norway.
Oslo City decide to deploy 400 public chargers with own funding
Commuters driving in bus lanesAs above, longer range at the cost of higher prices and challenges in vehicle supply limit the potential buying interest. Climate is not an important driver for buyingMainly domestic producers that sell directly to fleets and consumersHome charging using existing domestic outdoor Schuko sockets solve the charging challenges. Available BEVs cannot be fast chargedUnfavorable unless very large local incentives advantageAs above plus: Reduced ferry rates
2010 Status
2010 National brand BEVs limited available
Mitsubishi pre-sale of I-Miev.
Norwegian producers ended production and went bankrupt Chargers in Oslo and across Norway under deployment. Energy actor funds CPOs too support build out fast and normal chargersNational target for average new vehicles to emit <120 g CO2/km by 2012Oslo and Transnova offer support for Normal chargers3360 BEV owners, mainly commutersPre-sale of Mitsubishi I-miev broadens interest to more traditional vehicle buyersPre-sales OEM BEVsAs aboveUnfavorable unless very large local incentives advantageAs above.
Global OEM BEV production-led innovation phases
2011–2016No Norwegian BEVs available anymore
Import of Mitsubishi, Peugeot/Citroën BEVs, then Nissan Leaf before many other OEMs follow
BEV value chains are now global led by the OEMs Fast chargers deployed from 2011, along major south roads from 2015. The first wall boxes are installed, often bundled with BEV saleNew value chain for charging developed in Norway, including Tesla and national CPOs/EMSPs and producers of chargersNational target for average new vehicles to emit less than 85 g CO2
/km by 2020.
Fast chargers supported by Transnova, Enova, some Counties. Support along major roads from 2016At first mainly commuters, then multi-vehicle households in general BEVs a natural economic choice as second household vehicles, with access to home charging. Tesla long distance capability demonstratedOEM BEVs sold through regular auto-dealers and importersFast chargers in and around major cities, increasingly along major roads southern NorwayFavorableAs above, bus-lane access restrictions in some areas (must have passenger)
2017–2021All traditional OEMs apart from Toyota, and some luxury brands offer BEVs. Chinese BEVs from 2019. BEV market share pass > 50%Chines BEV brands join market from 2019. Network of fast chargers along all major roads built, as well as in Municipalities lacking fast chargers, low-capacity lead to queuesAs above, national producers of normal chargers dominate markets, international investment funds buy into CPOs. National target to only sell ZEVs from 2025Support for main road fast chargers and in Municipalities lacking fast chargers.
Cities support curb-side chargers.
Multi- and increasingly single- vehicle householdsBEVs is a real economic alternative for all new vehicle buyers, users struggle with all the charging APPs and payment systems Fast chargers in cities and along all major roads in the South by 2020, and by 2021 North, enable long distance driving across the nation. Law change: Flat owners can demand access to charging in common parking Very favorable As above, plus exemption from re-registration tax, local authorities decide on bus-lane access, up to 50% of ICEV rates allowed for road tolls, parking, ferry, decided locally
2022–2025BEVs dominate market, ICEV availability declines rapidly Chargers built out on commercial terms As above, all fuel station chains invest in chargers and becomes CPOsAs aboveNo deployment policies decided but requirement to install bank-card paymentAll new vehicle buyers, and increasingly second-hand vehicle buyersBEVs favored option among vehicle buyers. Charging infrastructure usability challenge, less queuing issues Fast charge stations upgraded to ultra-fast chargers, payment terminals from 2025 Favorable Reduction in VAT exemption, annual tax exemption, 70% of ICEV rate road toll; parking, ferries

References

  1. Figenbaum, E. Norway, the world leader in BEV adoption. In Who’s Driving Electric Cars. Understanding Consumer Adoption and Use of Plug-in Electric Cars; Springer Nature: Berlin/Heidelberg, Germany, 2020; Available online: https://link.springer.com/book/10.1007/978-3-030-38382-4#about (accessed on 5 January 2026).
  2. Statistics Norway 2026. Datasets of New Vehicle Sales and Fleet, Energy Carrier Compositions. Available online: www.ssb.no (accessed on 1 February 2026).
  3. Parliament 2017a. Innst. 460 S (2016–2017). Nasjonal Transport Plan (2018–2029). Stortinget 12 Juni 2017. Available online: https://www.stortinget.no/no/Saker-og-publikasjoner/Publikasjoner/Innstillinger/Stortinget/2016-2017/inns-201617-460s/?all=true (accessed on 1 February 2026).
  4. Paris Agreement 2016. Norway’s First NDC (National Determined Contribution) Towards the Paris Agreement. Available online: https://unfccc.int/NDCREG?gclid=Cj0KCQjwjryjBhD0ARIsAMLvnF8DtyTQnYevIyA43VrqOx1qG1vjOau084RhWpWFoHuyug8Yw_FzpHkaAjjyEALw_wcB (accessed on 20 June 2016).
  5. Figenbaum, E. An empirical study of the policy process behind Norway’s BEV-olution. World Electr. Veh. J. 2024, 15, 37. [Google Scholar] [CrossRef]
  6. Figenbaum, E. Electromobility Status in Norway: Mastering Long Distances—The Last Hurdle to Mass Adoption; TØI-Rapport 1627/2018; Transportøkonomisk Institutt: Oslo, Norway, 2018; Available online: https://www.toi.no/publikasjoner/status-for-elektromobilitet-i-norge-lange-reiser-den-siste-barrieren-for-videre-ekspansjon-article34902-8.html (accessed on 5 January 2026).
  7. Electrifying: First Norwegian Customers Receive Their Opel Ampera-e. Press Release 17 May 2017. Stellantis. Available online: https://www.media.stellantis.com/em-en/opel/press/electrifying-first-norwegian-customers-receive-their-opel-ampera-e (accessed on 30 January 2026).
  8. Elbil.no 2024b. Økte Avgifter På nye Forurensende Biler i 2025 (News Article on Elbil.no. 2 December 2024). Available online: https://elbil.no/okte-avgifter-pa-nye-forurensende-biler-i-2025/ (accessed on 10 December 2024). (In Norwegian)
  9. ACEA 2026a. New Car Sales Registration Statistics 2018–2025. Available online: https://www.acea.auto/nav/?content=press-releases&tag=registrations-of-vehicles (accessed on 20 January 2026).
  10. Garcia-Swartz, D.D.; Campbell-Kelly, M. Cellular: An Economic and Business History of the International Mobile-Phone Industry; MIT Press: Cambridge, MA, USA, 2022; ISBN 978-0-262-54392-7. [Google Scholar]
  11. ACEA 2026b. Vehicles on European Roads. ACEA Report January 2026. Available online: https://www.acea.auto/files/ACEA_Report_-_Vehicles_on_European_roads_2025.pdf (accessed on 20 January 2025).
  12. Hardman, S.; Axsen, J.; Chakraborty, A.; Figenbaum, E.; Jensen, A.F.; Helveston, J.P.; Hoogland, K.; Jenn, A.; Jochem, P.; Plötz, P.; et al. Demand-side challenges and research needs on the road to 100% zero-emission vehicles sales. Prog. Energy 2024, 7, 022001. [Google Scholar] [CrossRef]
  13. Jenn, A.; Chakraborty, A.; Hardman, S.; Hoogland, K.; Sugihara, C.; Tal, G.; Helveston, G.; Rich, J.; Jochem, P.; Plötz, P.; et al. Supply-side challenges and research needs on the road to 100% zero-emissions vehicle sales. Prog. Energy 2024, 7, 022002. [Google Scholar] [CrossRef]
  14. Figenbaum, E. Perspectives on Norway’s supercharged electric vehicle policy. Environ. Innov. Soc. Transit. 2017, 25, 14–34. [Google Scholar] [CrossRef]
  15. Langeland, O.; George, C.; Figenbaum, E. Technological innovation system and transport innovations: Understanding vehicle electrification in Norway. In Innovations in Transport: Success, Failure and Societal Impacts; van Wee, B., Annema, J., Köhler, J., Eds.; Edward Elgar: Glos, UK, 2022; Available online: https://www.elgaronline.com/edcollchap-oa/book/9781800373372/book-part-9781800373372-14.xml (accessed on 5 January 2026).
  16. Vergis, S.; Turrentine, T.S.; Fulton, L.; Fulton, E. Plug-in Electric Vehicles: A Case Study of Seven Markets; Research Report—UCD-ITS-RR-14-17; UC Davis: Davis, CA, USA, 2014. [Google Scholar]
  17. Bjerkan, K.Y.; Nørbech, T.E.; Nordtømme, M.E. Incentives for promoting Battery Electric Vehicle (BEV) adoption in Norway. Transp. Res. Part D Transp. Environ. 2016, 43, 169–180. [Google Scholar] [CrossRef]
  18. Bjerkan, K.Y.; Bjørge, N.M.; Babri, S. Transforming socio-technical configurations through creative destruction: Local policy, electric vehicle diffusion, and city governance in Norway. Energy Res. Soc. Sci. 2021, 82, 102294. [Google Scholar] [CrossRef]
  19. Halse, A.H.; Hauge, K.E.; Isaksen, E.T.; Johansen, B.G.; Raaum, O. Local Incentives and Electric Vehicle Adoption. J. Assoc. Environ. Resour. Econ. 2025, 12, 2025. [Google Scholar] [CrossRef]
  20. Mersky, A.C.; Sprei, F.; Samaras, C.; Qian, Z. Effectiveness of incentives on electric vehicle adoption in Norway. Transp. Res. Part D 2016, 46, 56–68. [Google Scholar] [CrossRef]
  21. Figenbaum, E. Retrospective Total Cost of Ownership analysis of Battery Electric Vehicles in Norway. Transp. Res. Part D 2022, 105, 103246. [Google Scholar] [CrossRef]
  22. Fevang, E.; Figenbaum, E.; Fridstrøm, L.; Halse, A.H.; Hauge, K.E.; Johansen, B.J.; Raaum, O. Who goes electric? The anatomy of electric car ownership in Norway. Transp. Res. Part D 2021, 92, 102727. [Google Scholar] [CrossRef]
  23. Nayum, A.; Klöckner, C.A.; Mehmetoglu, M. Comparison of socio-psychological characteristics of conventional and battery electric vehicle buyers. Travel Behav. Soc. 2016, 3, 8–20. [Google Scholar] [CrossRef]
  24. Figenbaum, E.; Kolbenstvedt, M.; Elvebakk, B. Electric Vehicles—Environmental, Economic and Practical Aspects. As Seen by Current and Potential Users; Report 1329/2014; Institute of Transport Economics: Oslo, Norway, 2014; Available online: https://www.toi.no/publications/electric-vehicles-environmental-economic-and-practical-aspects-as-seen-by-current-and-potential-users-article32644-29.html (accessed on 5 January 2025).
  25. Figenbaum, E.; Kolbenstvedt, M. Learning from Norwegian Battery Electric and Plug-in Hybrid Vehicle Users—Results from a Survey of Vehicle Owners; TØI Report 1492/2016; Institute of Transport Economics: Oslo, Norway, 2016; Available online: https://www.toi.no/publications/learning-from-norwegian-battery-electric-and-plug-in-hybrid-vehicle-users-results-from-a-survey-of-vehicle-owners-article33869-29.html (accessed on 5 January 2025).
  26. Figenbaum, E.; Nordbakke, S. Battery Electric Vehicle User Experiences in Norway’s Maturing Market; TØI Report 1719/2019; Institute of Transport Economics: Oslo, Norway, 2019; Available online: https://www.toi.no/publications/battery-electric-vehicle-user-experiences-in-norway-s-maturing-market-article35709-29.html?deviceAdjustmentDone=1 (accessed on 5 January 2025).
  27. Hardman, S.; Jenn, A.; Tal, G.; Axsen, J.; Beard, G.; Daina, N.; Figenbaum, E.; Jakobsson, N.; Jochem, P.; Kinnear, N.; et al. A review of consumer preferences of and interactions with electric vehicle recharging infrastructure. Transp. Res. Part D 2018, 62, 508–523. [Google Scholar] [CrossRef]
  28. Figenbaum, E. Fast Charging—Evidence from the Norwegian Market. World Electr. Veh. J. 2020, 11, 38. [Google Scholar] [CrossRef]
  29. Münzel, C.; Plötz, P.; Sprei, F.; Gnann, T. How large is the effect of financial incentives on electric vehicle sales?—A global review and European analysis. Energy Econ. 2019, 84, 104493. [Google Scholar] [CrossRef]
  30. Fridstrøm, L.; Østli, V. The vehicle purchase tax as a climate policy instrument. Transp. Res. Part A 2017, 96, 168–189. [Google Scholar] [CrossRef]
  31. Ryghaug, M.; Skjølsvold, T.M. Nurturing a Regime Shift Toward Electro-mobility in Norway. In The Governance of Smart Transportation Systems; The Urban Book Series; Finger, M., Audouin, M., Eds.; Springer: Cham, Switzerland, 2019. [Google Scholar] [CrossRef]
  32. EAFO 2025. Data on Incentives Phase-in and Phase-out in European Countries. Available online: https://alternative-fuels-observatory.ec.europa.eu/transport-mode/road (accessed on 5 January 2026).
  33. Tsakalidis, A.; Thiel, C. Electric Vehicles in Europe from 2010 to 2017: Is Full-Scale Commercialisation Beginning? An Overview of the Evolution of Electric Vehicles in Europe; EUR 29401 EN; Publications Office of the European Union: Luxembourg, 2018. [Google Scholar]
  34. Elbil.no 2023a. Nå Bruker Nesten Alle Ladeboks. News Article on Elbil.no 8 September 2023. 19 July 2023. Available online: https://elbil.no/na-bruker-nesten-alle-ladeboks/ (accessed on 11 November 2024). (In Norwegian)
  35. Think City. Think City Business Plan (Version 2.0); Think City: Pulau Pinang, Malaysia, 2000. [Google Scholar]
  36. Wesseling, J.H.; Farla, J.C.M.; Sperling, D.; Hekkert, M.P. Car manfacturers’ changing political strategies on the ZEV mandate. Transp. Res. Part D 2014, 33, 196–209. [Google Scholar] [CrossRef]
  37. Laurikko, J.; Granström, R.; Haakana, A. Realistic estimates of EV range based on extensive laboratory and field tests in Nordic climate conditions. In Proceedings of the 2013 World Electric Vehicle Symposium and Exhibition (EVS27), Barcelona, Spain, 17–20 November 2013; Volume 6, ISSN 2032-6653. [Google Scholar]
  38. Laurikko, J.; Granström, R.; Haakana, A. Assessing range and performance of electric vehicles in Nordic driving conditions—Project “RekkEVidde”. In Proceedings of the EVS26, Los Angeles, CA, USA, 6–9 May 2012; Volume 5, ISSN 2032-6653. [Google Scholar]
  39. Figenbaum, E. Reaching the end of the ICEV domination 35 years of BEVs in Norway. In Proceedings of the 38th International Electric Vehicle Symposium and Exhibition (EVS38), Gothenburg, Sweden, 15–18 June 2025; Available online: https://evs38-program.org/images/Proceedings/B%20Policy%20&%20Society/333_Reaching%20the%20end%20of%20the%20ICEV%20domination%2035%20years%20of%20BEVs%20in%20Norway.pdf (accessed on 1 February 2026).
  40. Geels, F.W. A socio-technical analysis of low-carbon transitions: Introducing the multi-level perspective into transport studies. J. Trans. Geogr. 2012, 24, 471–482. [Google Scholar] [CrossRef]
  41. Bergek, A. Technological innovation systems: A review of recent findings and suggestions for further research. In Handbook of Sustainable Innovation; Boons, F., McMeekin, A., Eds.; Edward Elgar: Glos, UK, 2019; pp. 200–218. Available online: https://www.elgaronline.com/edcollchap/edcoll/9781788112567/9781788112567.00019.xml (accessed on 5 January 2026).
  42. Rogers, E.M. Diffusion of Innovations, 5th ed.; Simon & Schuster: New York City, NY, USA, 2003; ISBN 9780743222099. [Google Scholar]
  43. Asphjell, A.; Asphjell, Ø.; Kvisle, H.H. Elbil På Norsk; Transnova: Lincoln, UK, 2013; ISBN 978-82-7704-142-1. [Google Scholar]
  44. Norstart. The Original First Statutes of «Norstart—Norsk Elbilforening», i.e., The Norwegian EV Association. Obtained from the Norwegian EV Association; Norwegian EV Association: Oslo, Norway, 1995. (In Norwegian) [Google Scholar]
  45. Elbilnytt Oktober 1996. News Notes from the Norwegian EV Association 1996. Available online: https://elbil.no/elbilnytt-arkiv/#oktober (accessed on 28 November 2025). (In Norwegian)
  46. Elbilnytt Juli 1996. News Notes from the Norwegian EV Association 1996. Available online: https://elbil.no/elbilnytt-arkiv/#juli (accessed on 28 November 2025). (In Norwegian)
  47. CARB 2004. 2003 Zero Emission Vehicle Program Change. Fact Sheet. 3/18/04. Available online: https://grist.org/wp-content/uploads/2008/03/2003zevchanges.pdf (accessed on 5 January 2025).
  48. Calef, D.; Goble, R. The allure of technology: How France and California promoted electric and hybrid vehicles to reduce urban air pollution. Policy Sci. 2007, 40, 1–34. [Google Scholar] [CrossRef]
  49. Hoogma, R.; Kemp, R.; Schot, J.; Truffer, B. Experimenting for Sustainable Transport. In The Approach of Strategic Niche Management. Chapter 4: Experiments in Electrifying Mobility, The PIVCO Experience: Ecological Product Differentiation; Routledge: Oxfordshire, UK, 2002; ISBN 978-0-415-27116-5. [Google Scholar]
  50. KFB. “Rena Fordon Med Eldrift”, Slutrapport Från KFBs Forsknings- Utvecklings- och Demonstrationsprogram Kring el- och Hybridfordon 1993–2000; KFB-Rapport 2000:26; KFB: Stockholm, Sweden, 2000; ISBN 91-88371-81-6. [Google Scholar]
  51. Sem 2001. Government Declaration. Information Found in: Samarbeidsregjeringens Statusrapport. Oppfølging av Sem-Erklæringen etter 1 år 19 Oktober 2002. Available online: https://www.nb.no/maken/item/URN:NBN:no-nb_digibok_2009070101002 (accessed on 5 January 2026). (In Norwegian)
  52. UNEP FI. Investor leadership on climate change. An analysis of the investment community’s role on climate change, and snapshot of recent investor activity. In UNPRI/UNEP Financial Initiative; UN Global Compact Office: New York, NY, USA, 2009; Available online: https://unglobalcompact.org/library/127 (accessed on 1 February 2026).
  53. TU 2009a. Til Finland Med Statsstøtte (News Article). TU 27 August 2009. Available online: https://www.tu.no/artikler/til-finland-med-statsstotte/242491 (accessed on 30 November 2025). (In Norwegian)
  54. IEA Electric Vehicles Technology Collaboration Programme (EV TCP) Annual Reports. Available online: https://evtcp.org/publications/ (accessed on 30 November 2025).
  55. Finansavisen 2010. Fire-Seters el-bil til Under 240000. News Article. 20 August 2010. Available online: https://www.finansavisen.no/nyheter/motor/2010/08/fire-seters-el-bil-til-under-240-000?zephr_sso_ott=xTbrWX (accessed on 31 July 2025). (In Norwegian)
  56. T&E. Electric Surge: Carmakers’ BEV Plans Across Europe 2019–2025; Rapport; Transport & Environment: Brûssel, Belgium, 2019; Available online: https://www.transportenvironment.org/publications/electric-surge-carmakers-electric-car-plans-across-europe-2019-2025 (accessed on 10 June 2025).
  57. Elbil 2024. Nær Halvparten av Modellene er Borte (News Article). Available online: https://elbil.no/naer-halvparten-av-ladbare-hybrider-er-borte/ (accessed on 3 October 2021). (In Norwegian)
  58. Nybilvelger 2025. Data Extracted 26. May from Norwegian Public Roads Administrations—Nybilvelger, a Dynamic Database of Currently Available Vehicle Models. Available online: https://www.vegvesen.no/kjoretoy/kjop-og-salg/nye-biler-med-minst-klimaavtrykk/ (accessed on 26 May 2025).
  59. Bilnytt.no 2023. Tar Alle på Senga: Tesla Setter Ned Prisen Med 120,000 Kroner på Model Y. News Note Bilnytt.no 13 January 2024. Available online: https://www.bilnytt.no/subscriber/showArticle.aspx?articleID=11297 (accessed on 12 December 2024).
  60. DEFA 2020. Så Mye bør Ditt Borettslag Eller Sameie ta for Elbillading. DEFA Pressemelding 30 September 2020. Press Release. Available online: https://www.mynewsdesk.com/no/defasverige/pressreleases/saa-mye-boer-ditt-borettslag-eller-sameie-ta-for-elbillading-3039197 (accessed on 1 August 2025). (In Norwegian)
  61. Elbil.no 2020. Endelig Bygges Ladenettverket i Troms og Finnmark! News Article 28 May 2020. Available online: https://elbil.no/endelig-bygges-ladenettverket-i-troms-og-finnmark/ (accessed on 1 August 2025). (In Norwegian)
  62. Elbil.no 2025. Nå er det over 10,000 Hurtigladere i Norge (News Article). Elbil.no 9 July 2025. Available online: https://elbil.no/na-er-det-over-10-000-hurtigladere-i-norge/ (accessed on 16 July 2025). (In Norwegian)
  63. Figenbaum, E.; Wangsness, P.B.; Amundsen, A.H.; Milch, V. Empirical Analysis of the User Needs and the Business Models in the Norwegian Charging Infrastructure Ecosystem. World Electr. Veh. J. 2022, 13, 185. [Google Scholar] [CrossRef]
  64. ECON 2006. Elbileiernes Reisevaner. ECON Analyse. Rapport 2006-040. Available online: https://kudos.dfo.no/dokument/9646/elbileiernes-reisevaner (accessed on 5 January 2026). (In Norwegian)
  65. Asplan 2009. Spørreundersøkelse om Bruk av og Holdninger Til Elbiler i Norske Storbyer. Asplan Viak NOTAT, 2009-12-14. Unavailable Online but Some of the Data Is Available in: Trafikk i kollektivfelt. Kapasitet og avvikling. Elbilens rolle. Prosam rapport 176, December 2009. Available online: https://prosam.maps.arcgis.com/home/item.html?id=2ec1846e9588418290c77cdcaec4c962 (accessed on 1 February 2026). (In Norwegian)
  66. NRK 2025. Flertall av Elbiler i Bomringen for Første Gang. NRK.no News Article. Available online: https://www.nrk.no/stor-oslo/flertall-av-elbiler-i-bomringen-for-forste-gang-1.17615121 (accessed on 24 November 2025). (In Norwegian)
  67. Data from EAFO, IEA Global EV Outlook 2020, and Complementary National Sources. Available online: https://alternative-fuels-observatory.ec.europa.eu/; https://www.iea.org/reports/global-ev-outlook-2020 (accessed on 30 November 2025).
  68. SN 2010. Danskerne Købte 153,512 Benzinbiler og 50 Elbiler i 2010. Sjællandske Nyheder 20 January 2011. Available online: https://www.sn.dk/art5179087/danmark/danskerne-koebte-153512-benzinbiler-og-50-elbiler-i-2010/ (accessed on 30 November 2025).
  69. Gis, W.; Menes, M. The development of the world electric vehicles fleet in years 201–2017. IOP Conf. Ser. Mater. Sci. Eng. 2018, 421, 022008. Available online: https://iopscience.iop.org/article/10.1088/1757-899X/421/2/022008 (accessed on 1 February 2026). [CrossRef]
  70. Pfaffenbichler, P.; Fearnley, N.; Figenbaum, E.; Emberger, G. Simulating the effects of tax exemptions for plug-in electric vehicles in Norway. Eur. Transp. Res. Rev. 2024, 16, 26. [Google Scholar] [CrossRef]
  71. Cube 2022. Cube Infrastructure Fund III invests in Kople. News Note on Cubeinfrastructure.com 18 January 2022. Available online: https://www.cubeinfrastructure.com/news/cube-infrastructure-fund-iii-invests-in-kople/ (accessed on 5 January 2025).
  72. Fortum to Sell Remaining Ownership in Charging Point Operator Recharge AS to Infracapital. Fortum Press Release 10 June 2022. Available online: https://www.fortum.com/media/2022/06/fortum-sell-remaining-ownership-charging-point-operator-recharge-infracapital (accessed on 5 January 2026).
  73. Statistics from DrivkraftNorge. Available online: https://www.drivkraftnorge.no/Tall-og-fakta/ (accessed on 22 January 2026).
Figure 1. Monthly sales shares of BEVs (light green), PHEVs (gray), and BEVs + PHEVs (dark green). Source: Author, based on data from Statistics Norway [2].
Wevj 17 00089 g001
Figure 2. Right axis: BEV fleet shares 2024, Left axis: BEV market shares 2018–2024. Source: Author based on ACEA data [9,11].
Wevj 17 00089 g002
Figure 3. The main three BEV development phases. Source: Author.
Wevj 17 00089 g003
Figure 4. BEV and charging-infrastructure improvements between 2000 and 2012 and between 2012 and 2024. Source: Author.
Wevj 17 00089 g004
Figure 5. Number of BEVs per fast charger (incl. Tesla) 2012–2024. Source: Author based on data from Nobil database.
Wevj 17 00089 g005
Figure 6. Diffusion of BEVs in the Norwegian fleet 2012–2024. Percent of total vehicle fleet. Areas in circles in 2012 were the regions with most BEVs. Source: Author based on data from SSB [2].
Wevj 17 00089 g006
Figure 7. Total cost of ownership advantage BEV vs. ICEV 1992–2024 with/without local incentives in NOK/year. Source: Author, expanding on [21].
Wevj 17 00089 g007
Figure 8. BEV new vehicle sales and fleet adoption as seen by Rogers’ theory on the diffusion of innovations, splitting the market into innovators, early adopters, early and late majority, and laggards (separated by the horisontal lines). Source: Author.
Wevj 17 00089 g008
Figure 9. Number of BEVs in the vehicle fleet in 2010, some countries in 2011. Source: Author, based on data collected from [67,68,69].
Wevj 17 00089 g009
Figure 10. BEV incentives 2010–2024, European countries. Darker green means stronger incentive, lighter green means weaker or partial incentive. Sources: Author, based on data from [32,33].
Wevj 17 00089 g010
Figure 11. Sales of fuels in liters 1995–2024 and fast-charger usage in GWh 2019–2024. Source: author, based on data from [73].
Wevj 17 00089 g011
Table 1. Overview of the Norwegian BEV incentives, including revisions, and disincentives. Source: Author. Further data in Table A1 in Appendix A.
IncentivesYear
Fiscal incentives: Reduction in purchase price/yearly cost
Exemption from the registration tax1990/1996
Zero rate Value Added Tax (VAT) 2001
VAT exemption BEV leasing/batteries 2015
Zero rate VAT on wall box and standard installation cost2013–2019
Reduced annual tax (from 2018 called insurance tax)1996/2004
Reduced company car benefit tax2000
Exemption from ownership change tax2018–2021
Direct use subsidies: Reduction in variable costs, reduce range concerns
Reduced toll roads1997
Reduced fare main road ferries2009
Financial support normal chargers2009
Financial support for fast chargers2011
User privileges: Reduction in time and usage costs
Access to bus lanes2003/2005
Free/reduced parking fee, preferential BEV parking when charging1999
Organizational measures enabling an efficient transition
Right to access charging in parking area of jointly owned properties and housing communities2017/2020
Obligation to offer charging access in parking facilities (parking, houses, etc.)2017/2020
DisincentivesYear
Vehicle weight tax2023
Annual tax2024
Table 2. Supply-side and demand-side challenges for BEV diffusion. Source: Author, based on [12,13].
Supply-Side FactorsDemand-Side Factors
BEV availabilityNational production
Import
UsersCharacteristics
Awareness and knowledge
Perception
BEV value chainsAccess to parts, technology
Access to knowledge
Market Market shares
Fleet shares
Total cost of ownership
Charging infrastructure Deployment
Value chains
Charging-infrastructure availabilityHome
Public
Fast-charger networks
PoliciesVehicles
Charging infrastructure
PoliciesPurchase incentives
Ownership incentives
Local incentives and driver advantages
Table 3. BEV and charging-infrastructure characteristics 1990–2025, Source: Author.
1990–19961997–20022003–20062007–20102011–20162017–20212022–2025
Vehicle segmentsMiniMini-SmallMini-SmallMini-SmallSmall-CompactSmall-LargeAll
Number of seats22–42–424–54–7All variants
Battery typeLead/Ni-CdLead/Ni-CdLead/Ni-CdLi-Ion/Ni-MHLi-IonLi-IonLi-Ion
Battery warranty (years/km)2/-2/-2/-2/-5/100,0008/160,0008/160,000
Average WLTP range km30–4040–7040–7050–86120 to 209301 to 433433 to 484
Average range winter (est.) km2030–5030–5035–6080 → 150210 → 300300 → 340
Charge power (normal) kW2.32.82.82.82.8–74.6–7 (Some up to 11)4.6–11 (some up to 22)
Charge power (fast, average) kW 30–8040–15060–150
Use areaLocalLocalLocalLocalRegionalEverywhereEverywhere
Average price in 1000 (2024) NOK186–202201–368190209–263315–411466–542487–609
Price/km range in 1000 (2024) NOK6.7 → 6.26.1 → 4.43.8 → 3.73.8 → 3.03 → 21.6 → 1.11.2 → 1.0
Public normal chargers (nr. of)0–3030–50Not availableFrom ca. 0 to 1163From 2297 to 7830From 6858 to 12,962From 17,558 to 18,932
Public fast chargers (nr. of)NoneNoneNoneNoneFrom 5 to 529From 847 to 2950From 5183 to 9478
Tesla reserved chargers (nr. of)NoneNoneNoneNoneFrom 0 to 228From 364 to 1085From 484 to 4
BEVs/fast charger (incl. Tesla)n.a.n.a.n.a.n.a.From 165 to 129From 115 to 100From 114 to 83
Geography fast charger available.n.a.n.a.n.a.n.a.Local/regionalSouth-NorwayAcross Norway
n.a = not applicable.
Table 4. Development of the demand-side and the supply-side challenges towards reaching 100% ZEV sales. Source: Author.
1990–20102011–20202021–2025
Supply-side issuesBEV supplyNorwegian small-volume production of mini BEVs, a few BEVs imported from FranceOEM BEVs, starting with four brands, growing to most brands and new Chinese brands at the end of the periodAll OEMs offered BEVs, BEV model availability became higher than ICEV model availability
BEV characteristics30–60 km range, increasing to 80–120 km at the end of the period. Slow, small (two seats). No fast charge capabilityFirst small/compact OEM BEVs had 80–140 km range, expanding to 300–500 km for most segments by 2020. 30–50 kW fast charge up to 2016, then 40–150 kWRange expanded to 400–700 km and fast charge power to 100–200 kW, some even higher
Charging-infrastructure deploymentNone, until 2009–2010 when the first public normal chargers were put in place, first in Oslo, then nationwideSupport for normal chargers across Norway, fast chargers around and between cities. Flat owners received a right to charge All charging infrastructure deployed on commercial terms. Very limited support available in areas without fast chargers
Norwegian Policies Generally applicable policies such as research grants, none for vehicle production specificallyIncreasingly ambitious targets until target to only sell ZEVs from 2025 introduced 2017. National target to only sell ZEVs from 2025
European policies EU new vehicle CO2 regulation increases BEV availabilityEU new vehicle CO2 regulation forces all OEMs to offer BEVs
Demand-side issuesUser characteristicsMainly fleets testing BEV usability and a few enthusiastsCommuter, multi-vehicle house-holds, and expansion to single-vehicle households from 2017Everyone buys BEVs, including laggards as selection of ICEVs is greatly reduced
Consumer awarenessBEVs were unknown in 1990. By 2010, BEVs were well-known in/around cities, highly visible with recognizable designs and use of bus lanesAwareness increases to all parts of Norway as diffusion increased outside city areas and BEVs were widely covered in the press BEVs established as a standard vehicle purchase option along with gasoline and diesel vehicles
Charging-infrastructure availabilityHome charging from regular household outdoor sockets. No public chargers, no fast chargersFirst fast chargers deployed and spread gradually out across Southern NorwayFast chargers available all over Norway and expanded further on commercial terms.
PoliciesExemptions from registration tax, annual tax, value added tax, access bus lanes, free road tolls, free parking, reduced ferry ratesIncentives continue, local incentive value is reduced by 50% from 2018 Incentives still available but downscaling of tax exemptions started and reduction in local incentive value continued.
Total cost of ownership factoring in incentivesUnfavorable apart from when cheap second-hand BEVs were imported from FranceFavorable, but barriers related to limited range, uncertain life persisted the first yearsFavorable, very few barriers, life expectancy of batteries now matches vehicle life
Market and fleetBEV market shareClose to zero, below 0.5%Increasing from 1% to 16% (2016) and 54% 2020.Increasing from 65% to 96%
BEV fleet share~0%Increasing from ~0% to 12%Increasing from 16% to 33%
Intended market nicheLocal transport in cities and public and private fleetsCommuters, multi-vehicle households and fleets. In the end all household typesGeneral purpose one-to-one ICEV replacements in all vehicle segments and uses
Disclaimer/Publisher’s Note: The statements, opinions and data contained in all publications are solely those of the individual author(s) and contributor(s) and not of MDPI and/or the editor(s). MDPI and/or the editor(s) disclaim responsibility for any injury to people or property resulting from any ideas, methods, instructions or products referred to in the content.