
A Study of the Social Identity of Electric Vehicle Consumers from a Social Constructivism Perspective

Abstract
1. Introduction
2. Literature Reviews
2.1. Conceptual Foundations of Brand Image and Perception
2.2. Social Identity Construction Through Consumption
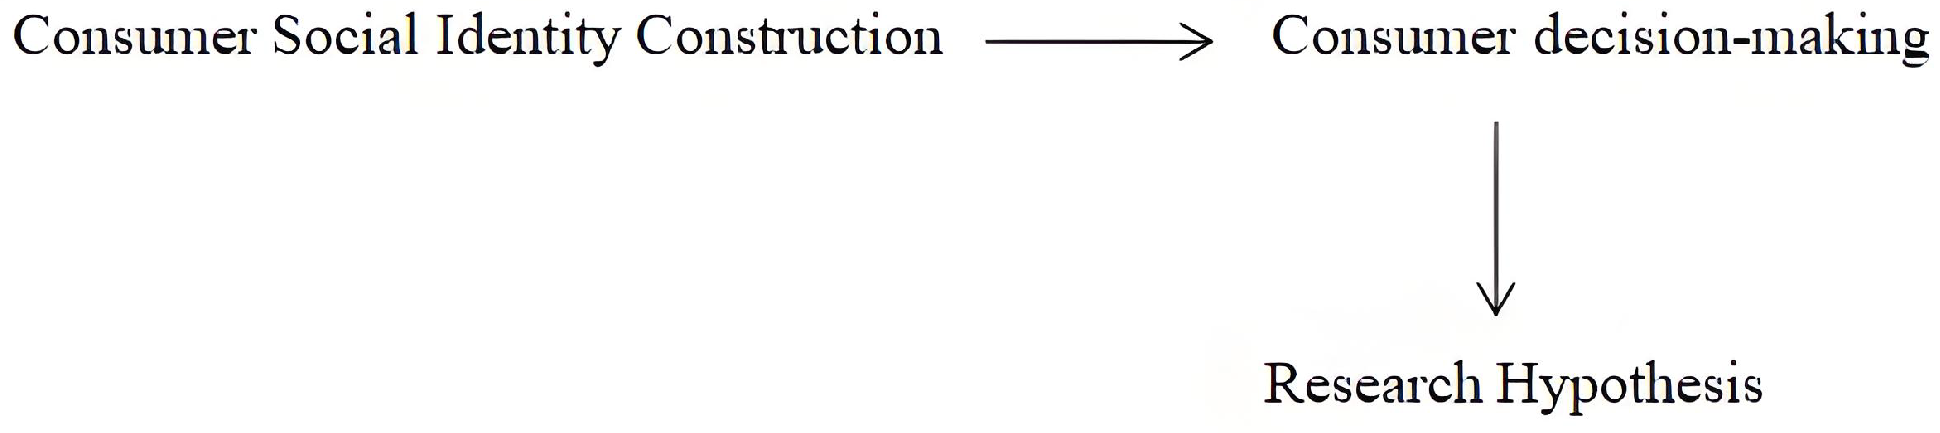
3. Research Objective, Model, and Hypotheses
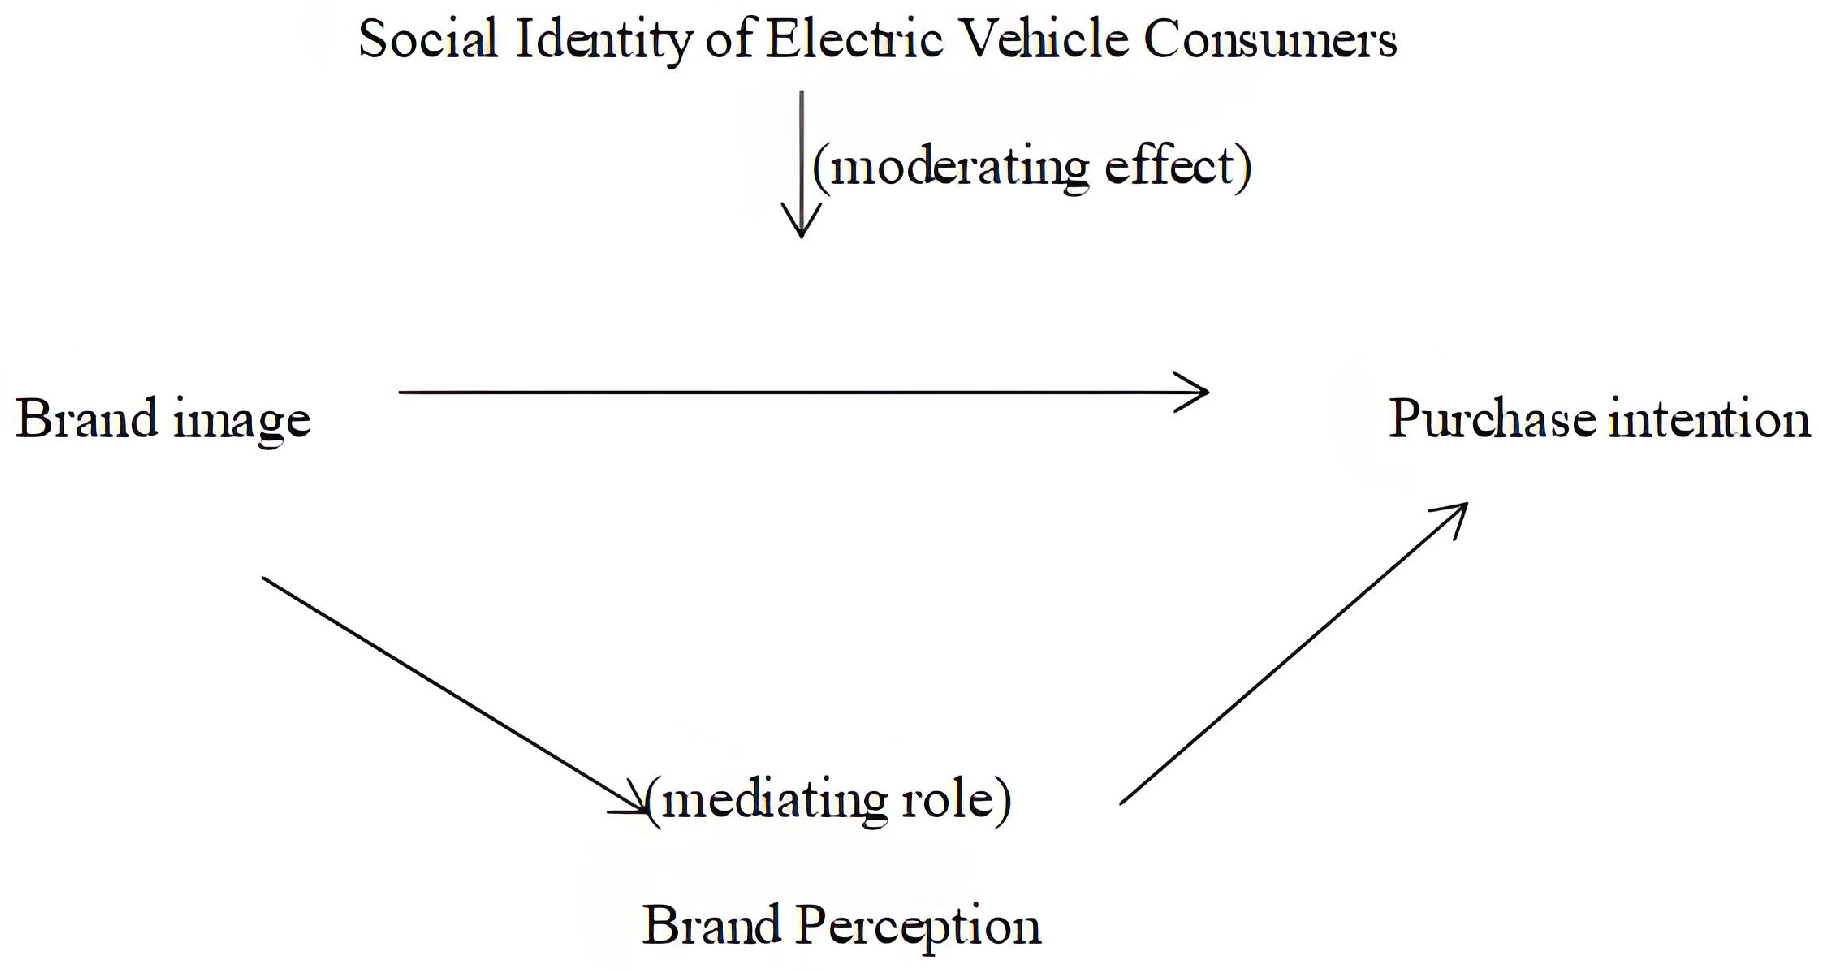
3.1. Research Objective
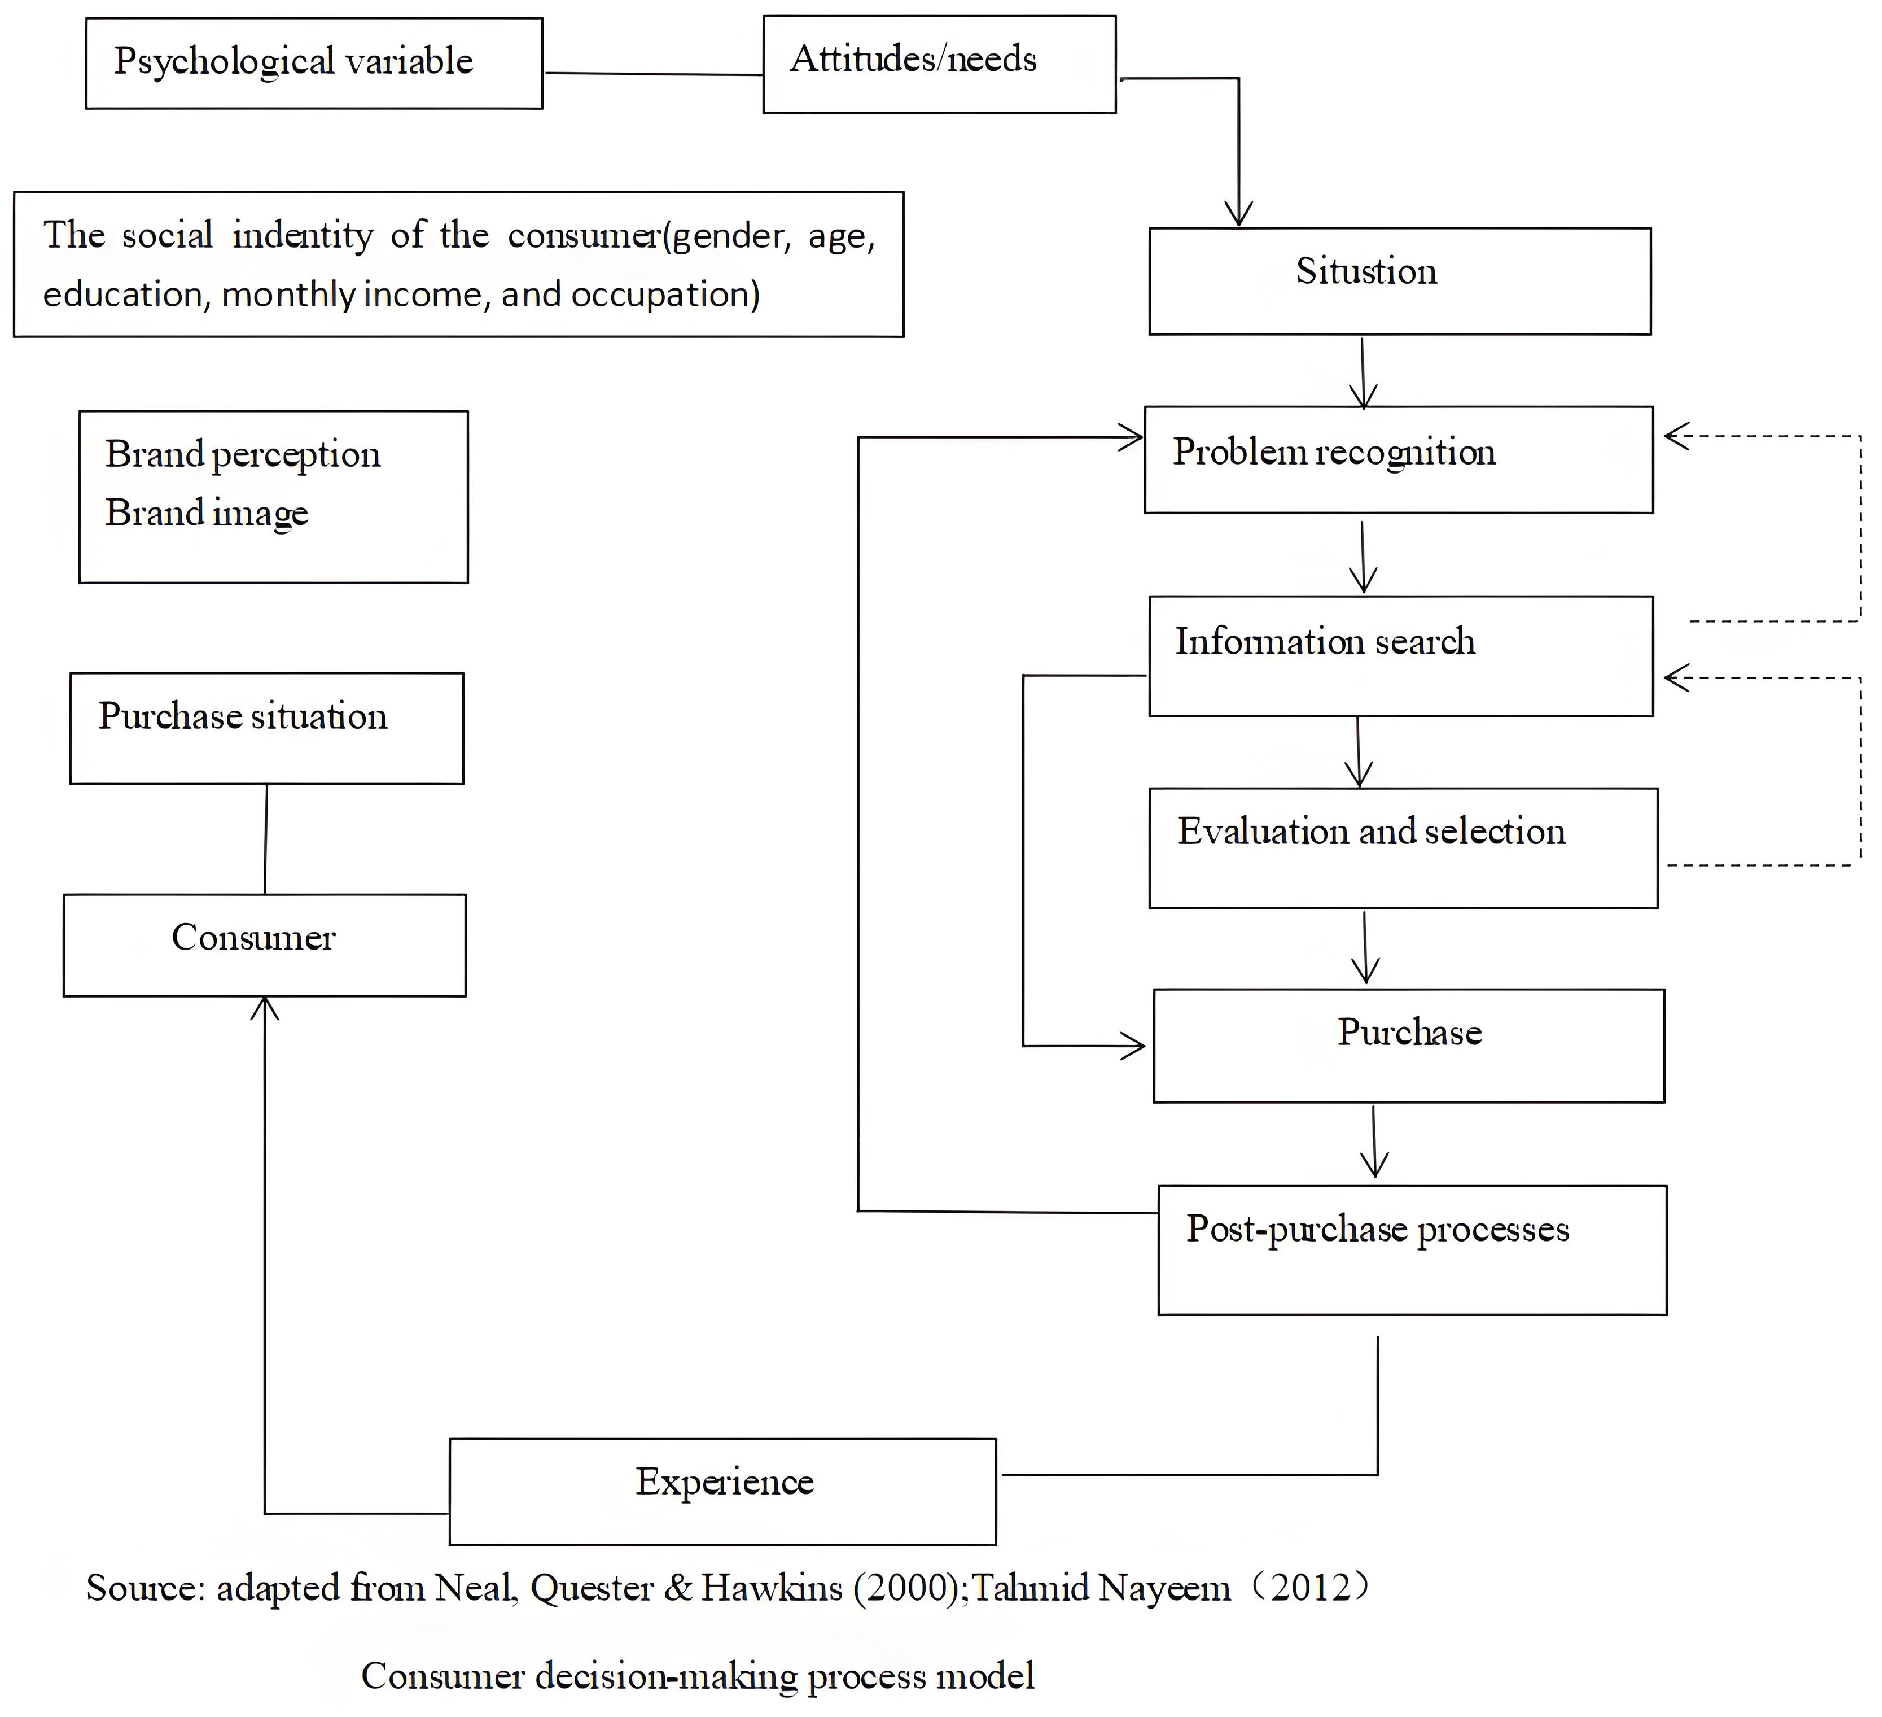
3.2. Consumer Decision-Making Process Model
3.3. Research Hypothesis
4. Research Method and Data Testing
4.1. Research Method
4.1.1. Design of Questionnaires
4.1.2. Sample Collection
4.1.3. Descriptive Analysis
4.2. Reliability and Validity Analysis
4.2.1. Reliability Analysis
4.2.2. Validity Analysis
4.3. Correlation, Regression, and Mediation Analysis
4.3.1. Correlation Analysis
4.3.2. Regression Analysis
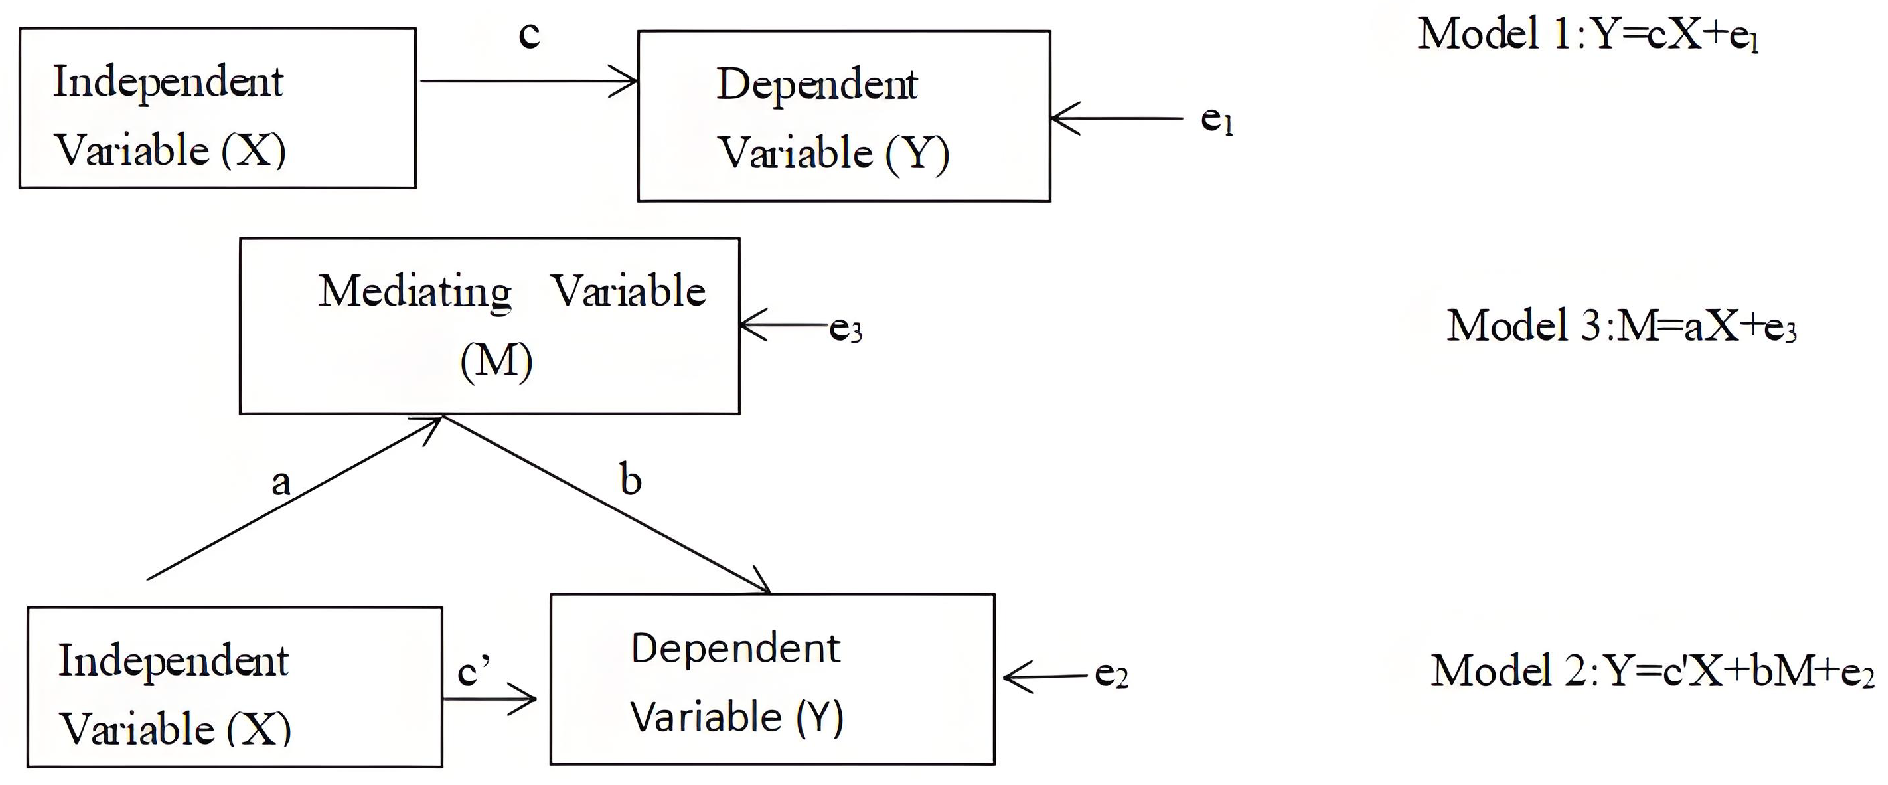
4.3.3. Mediation Analysis
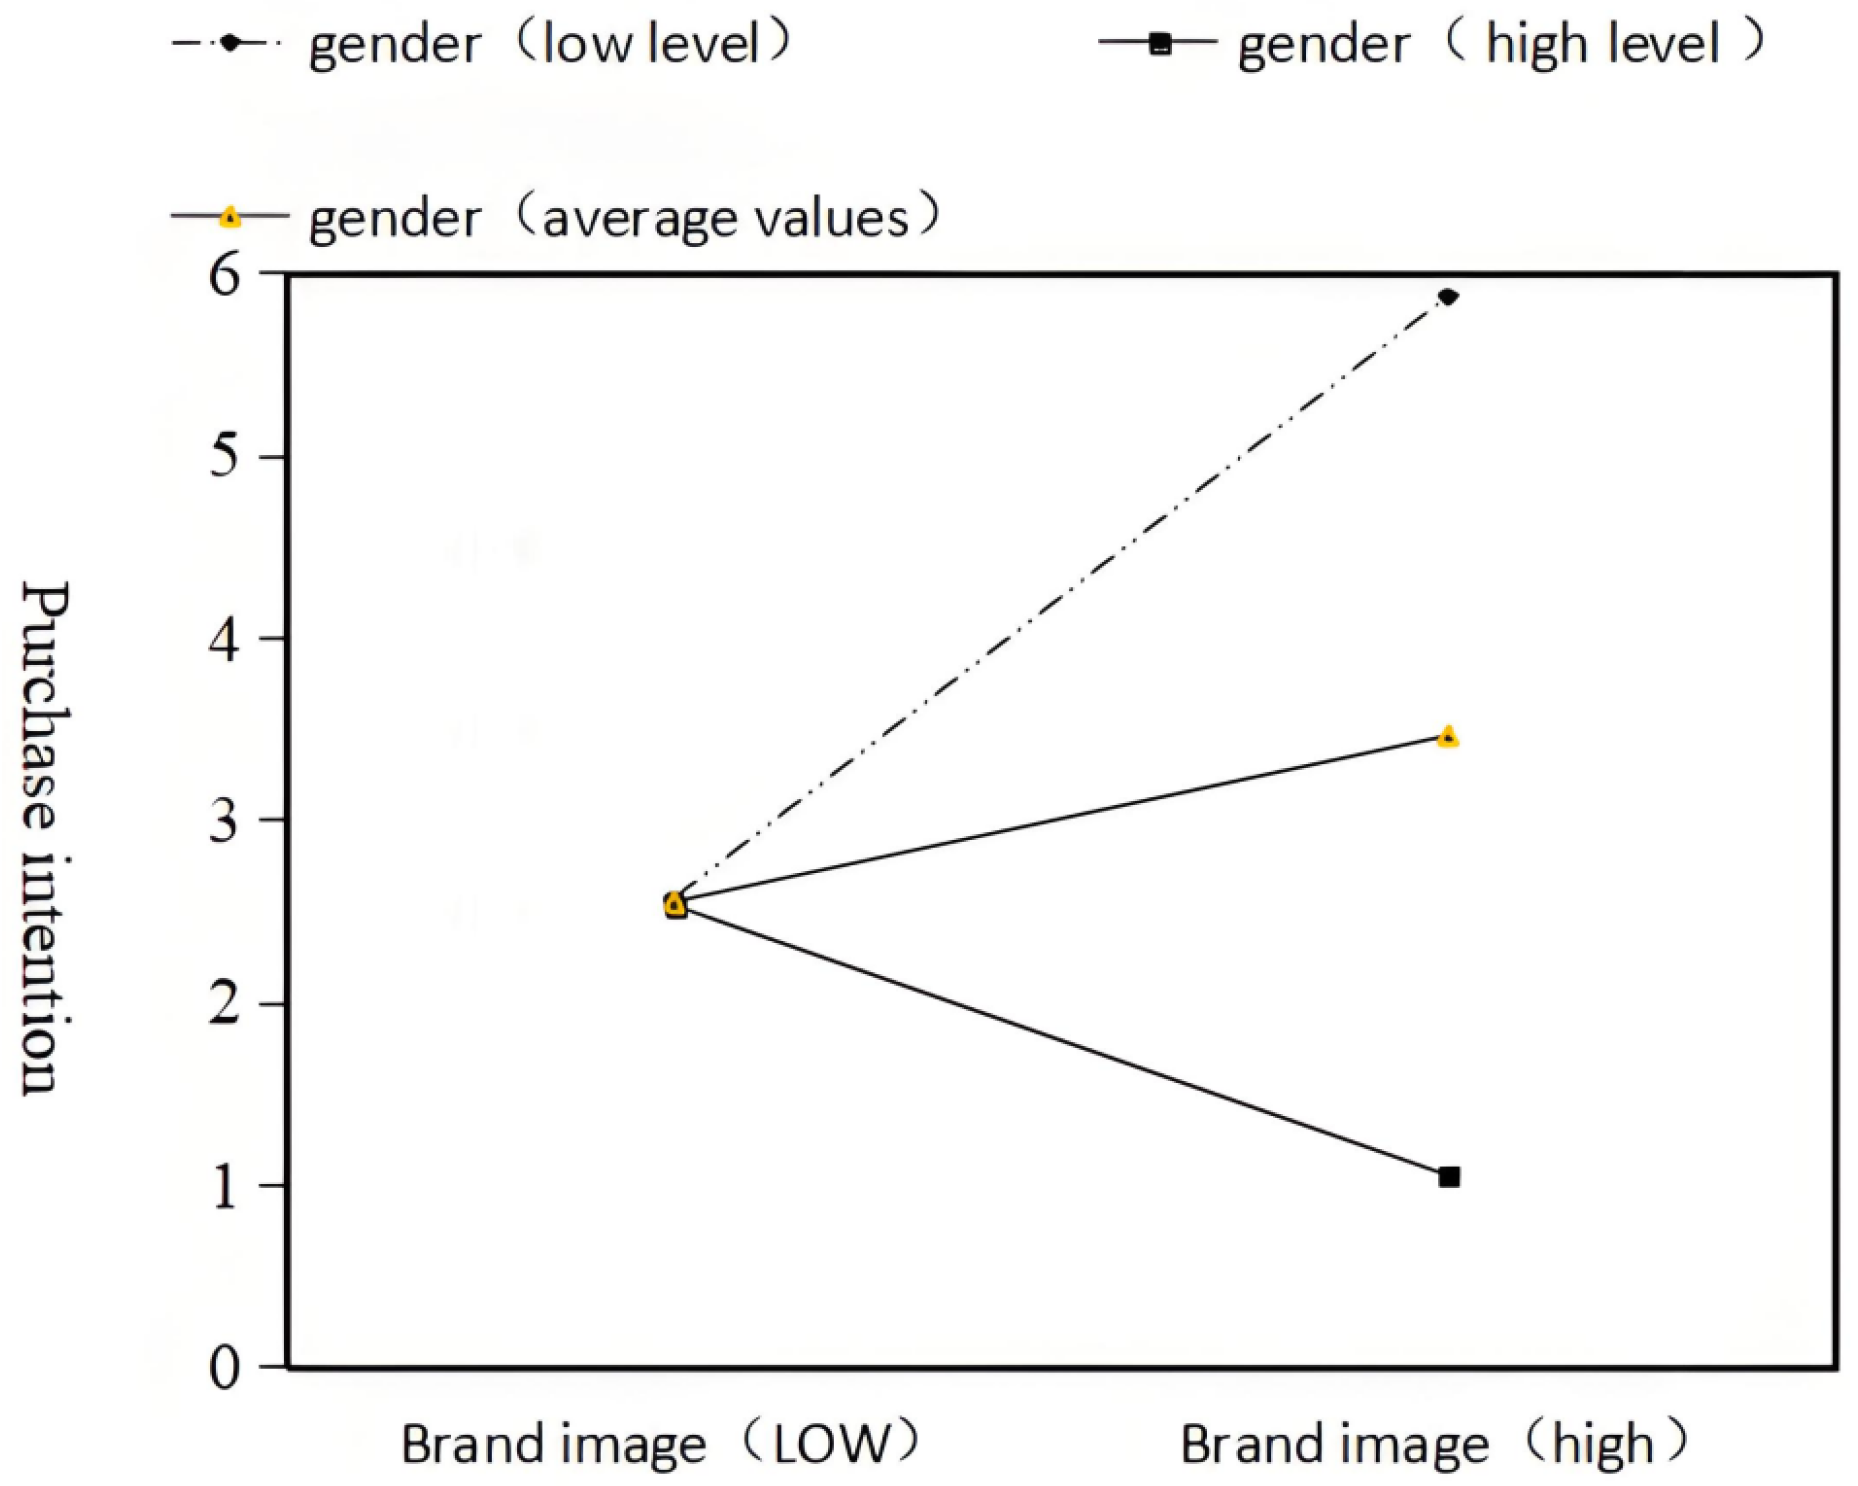
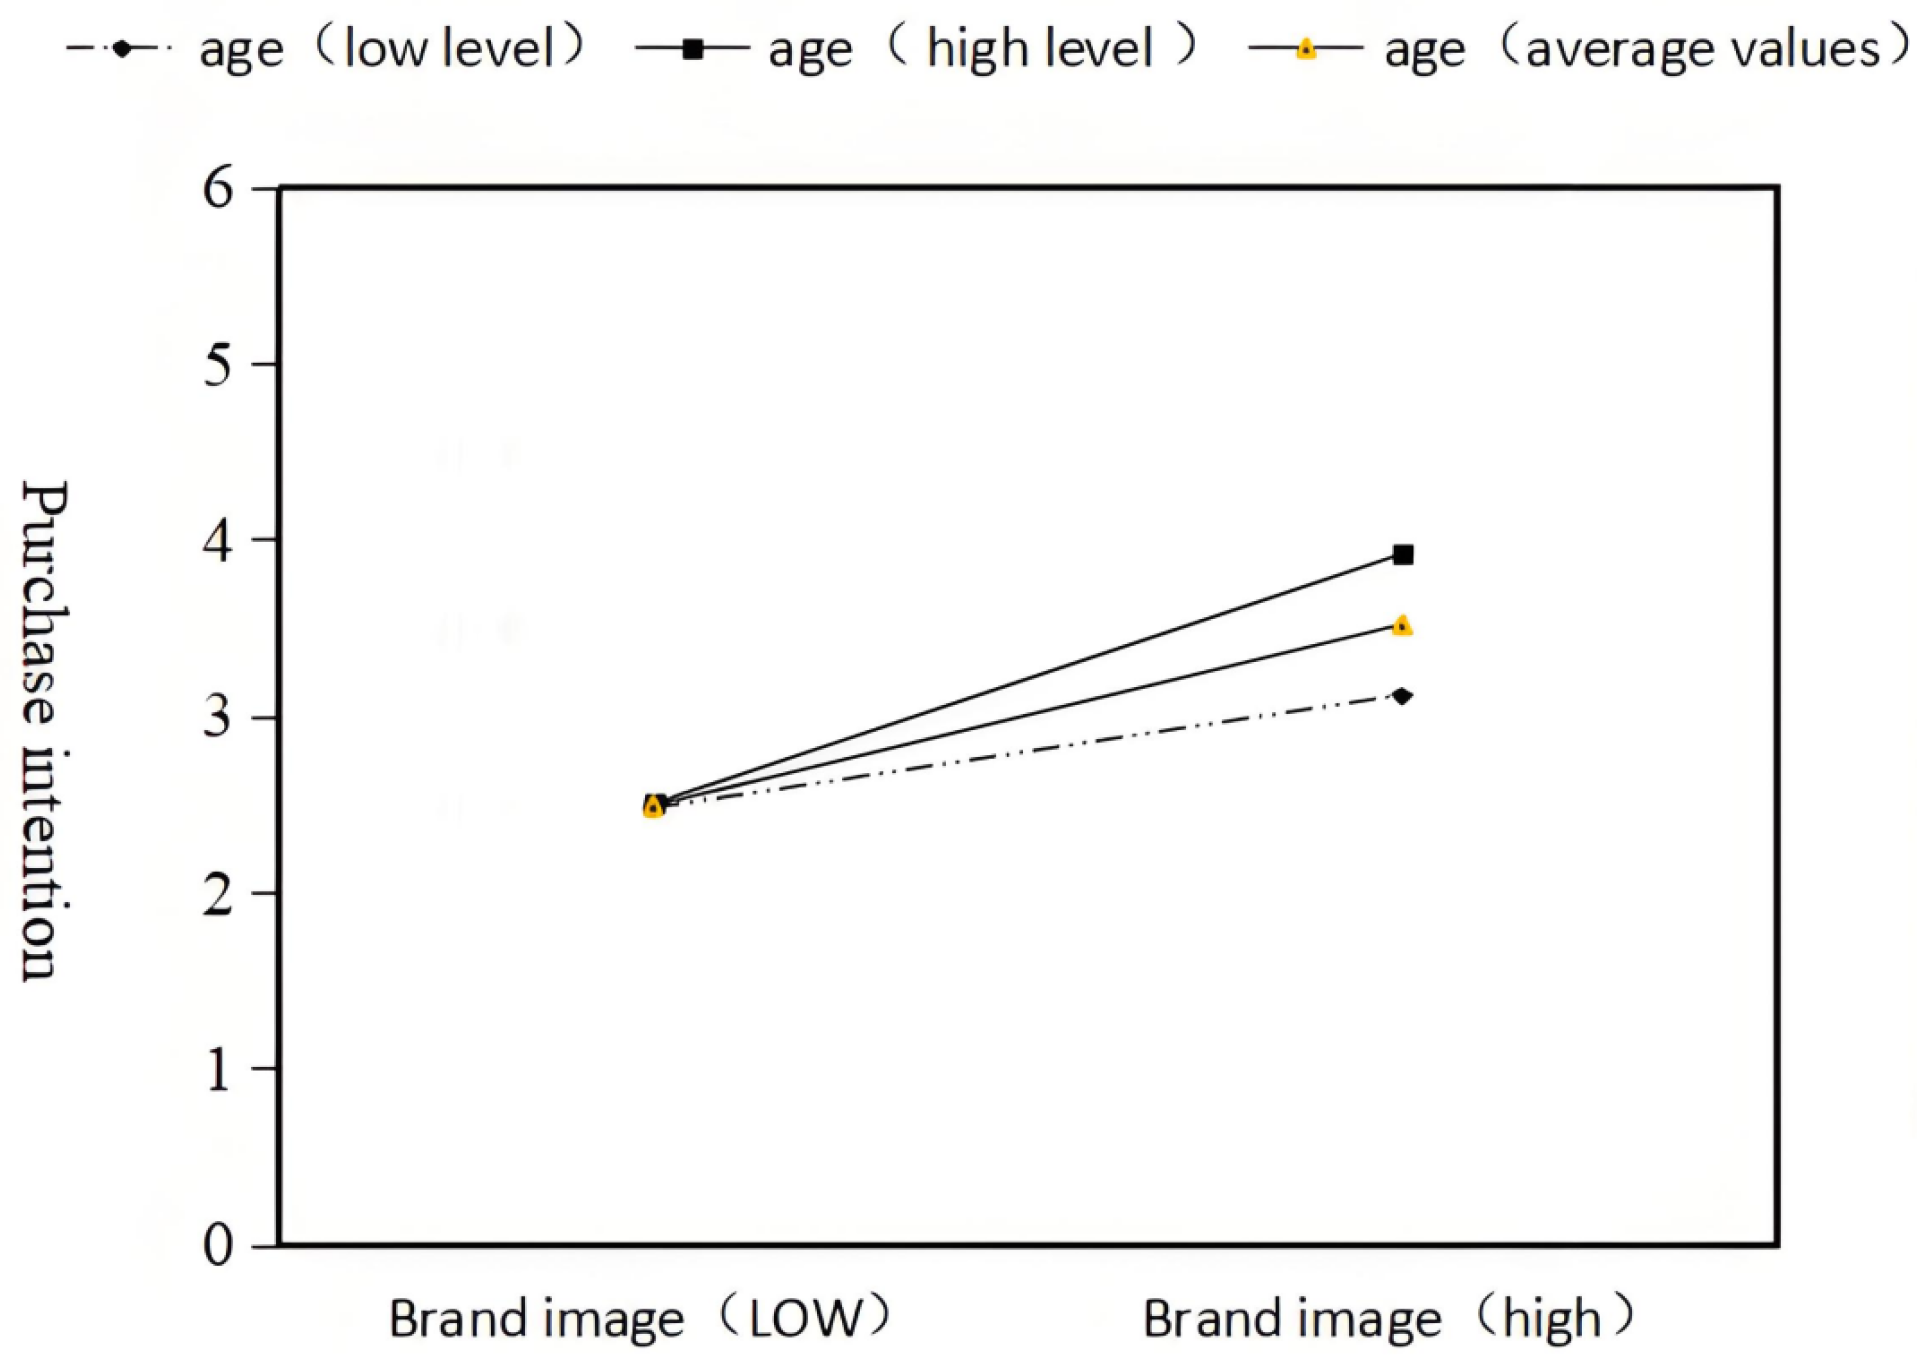
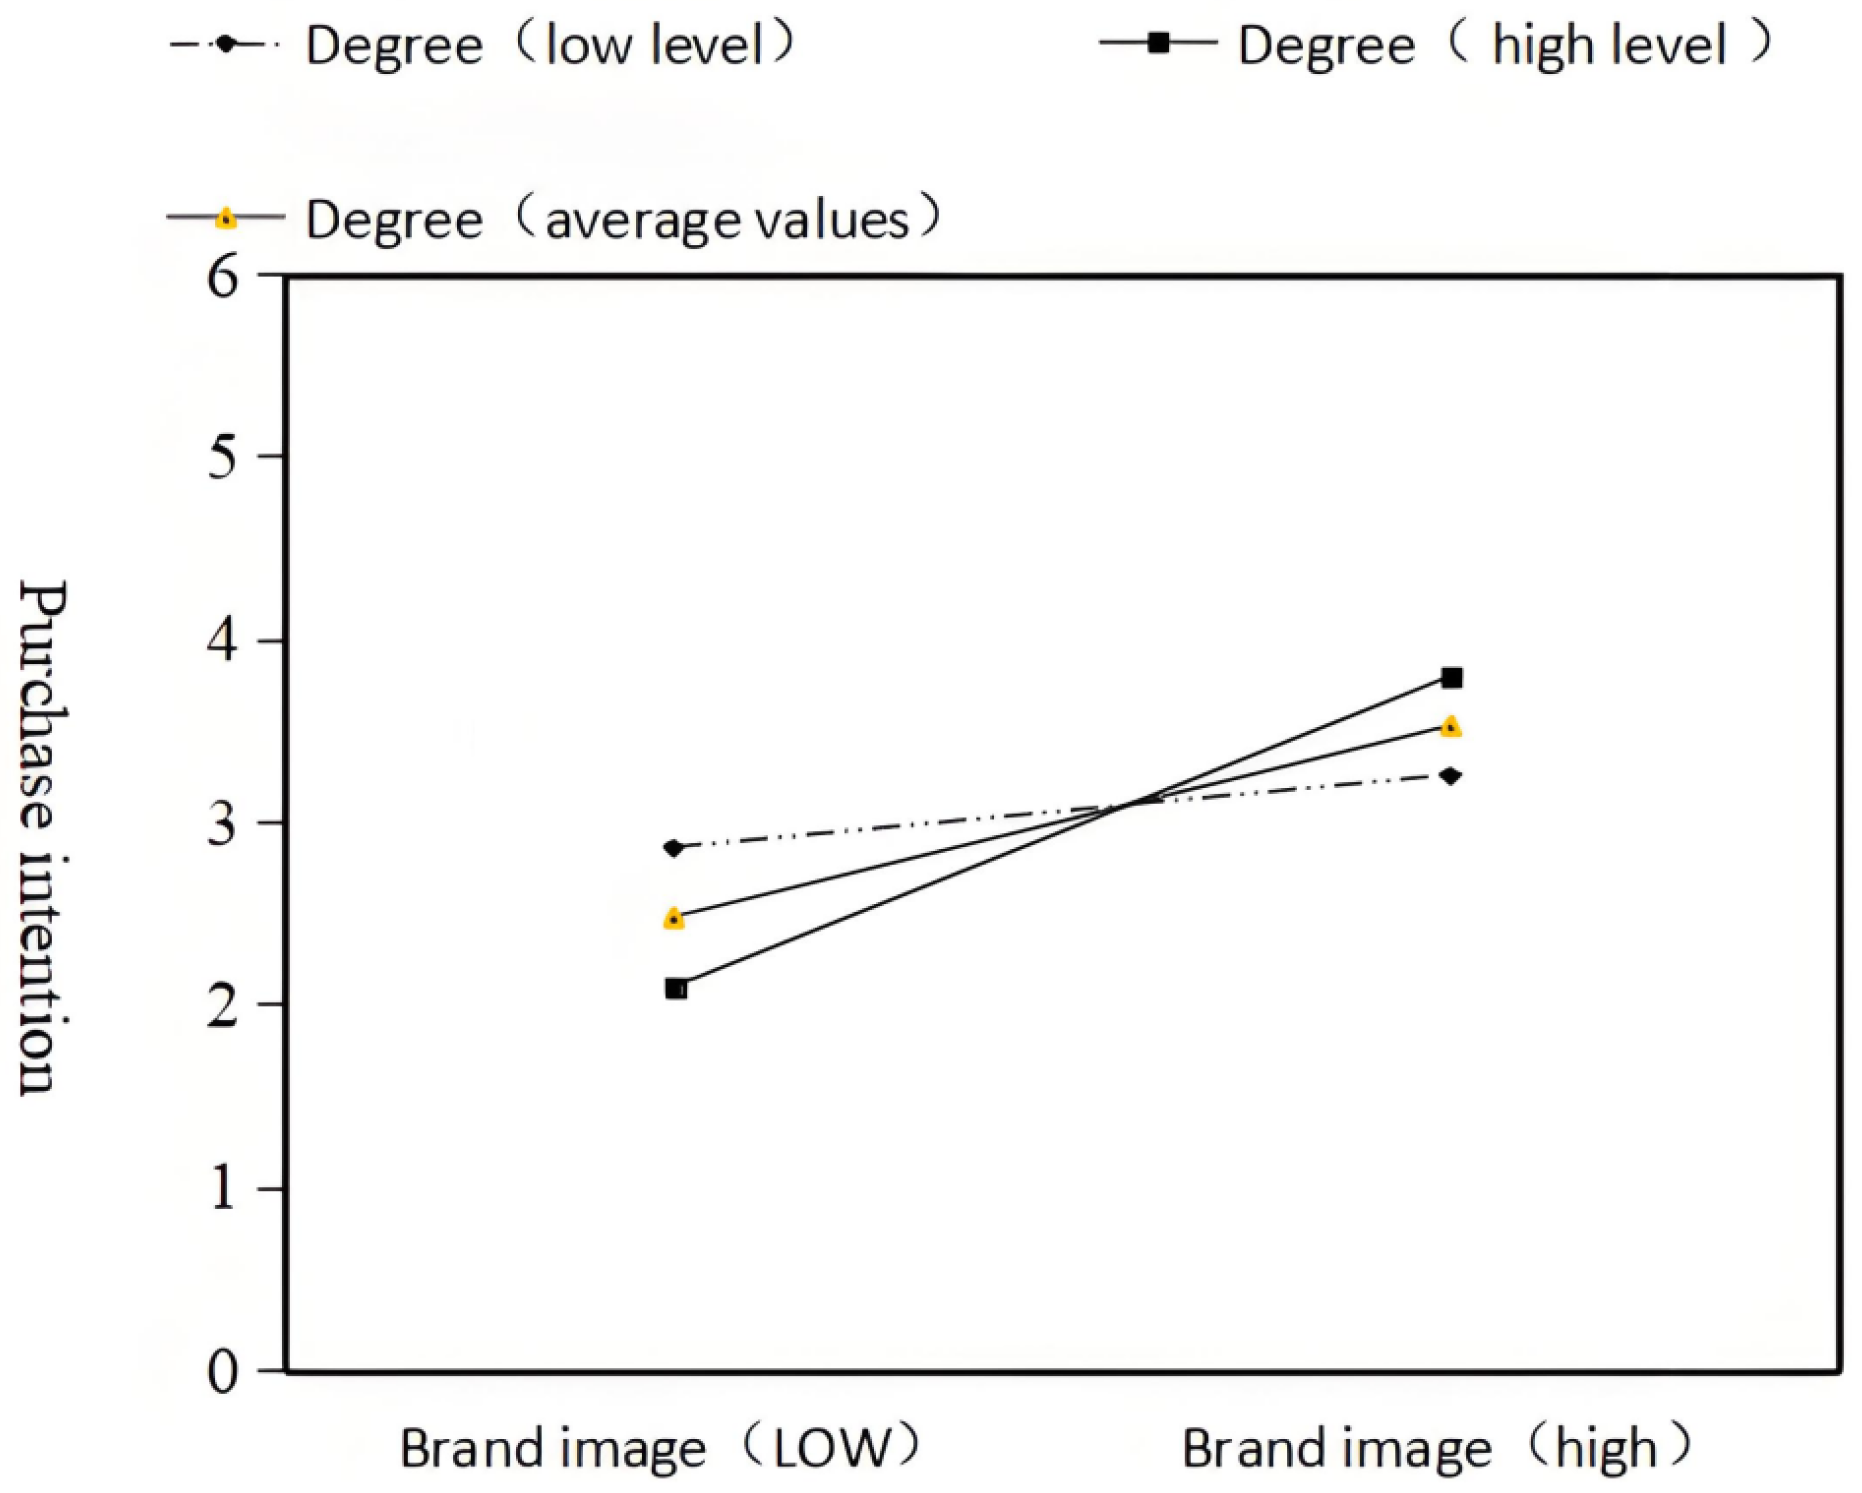
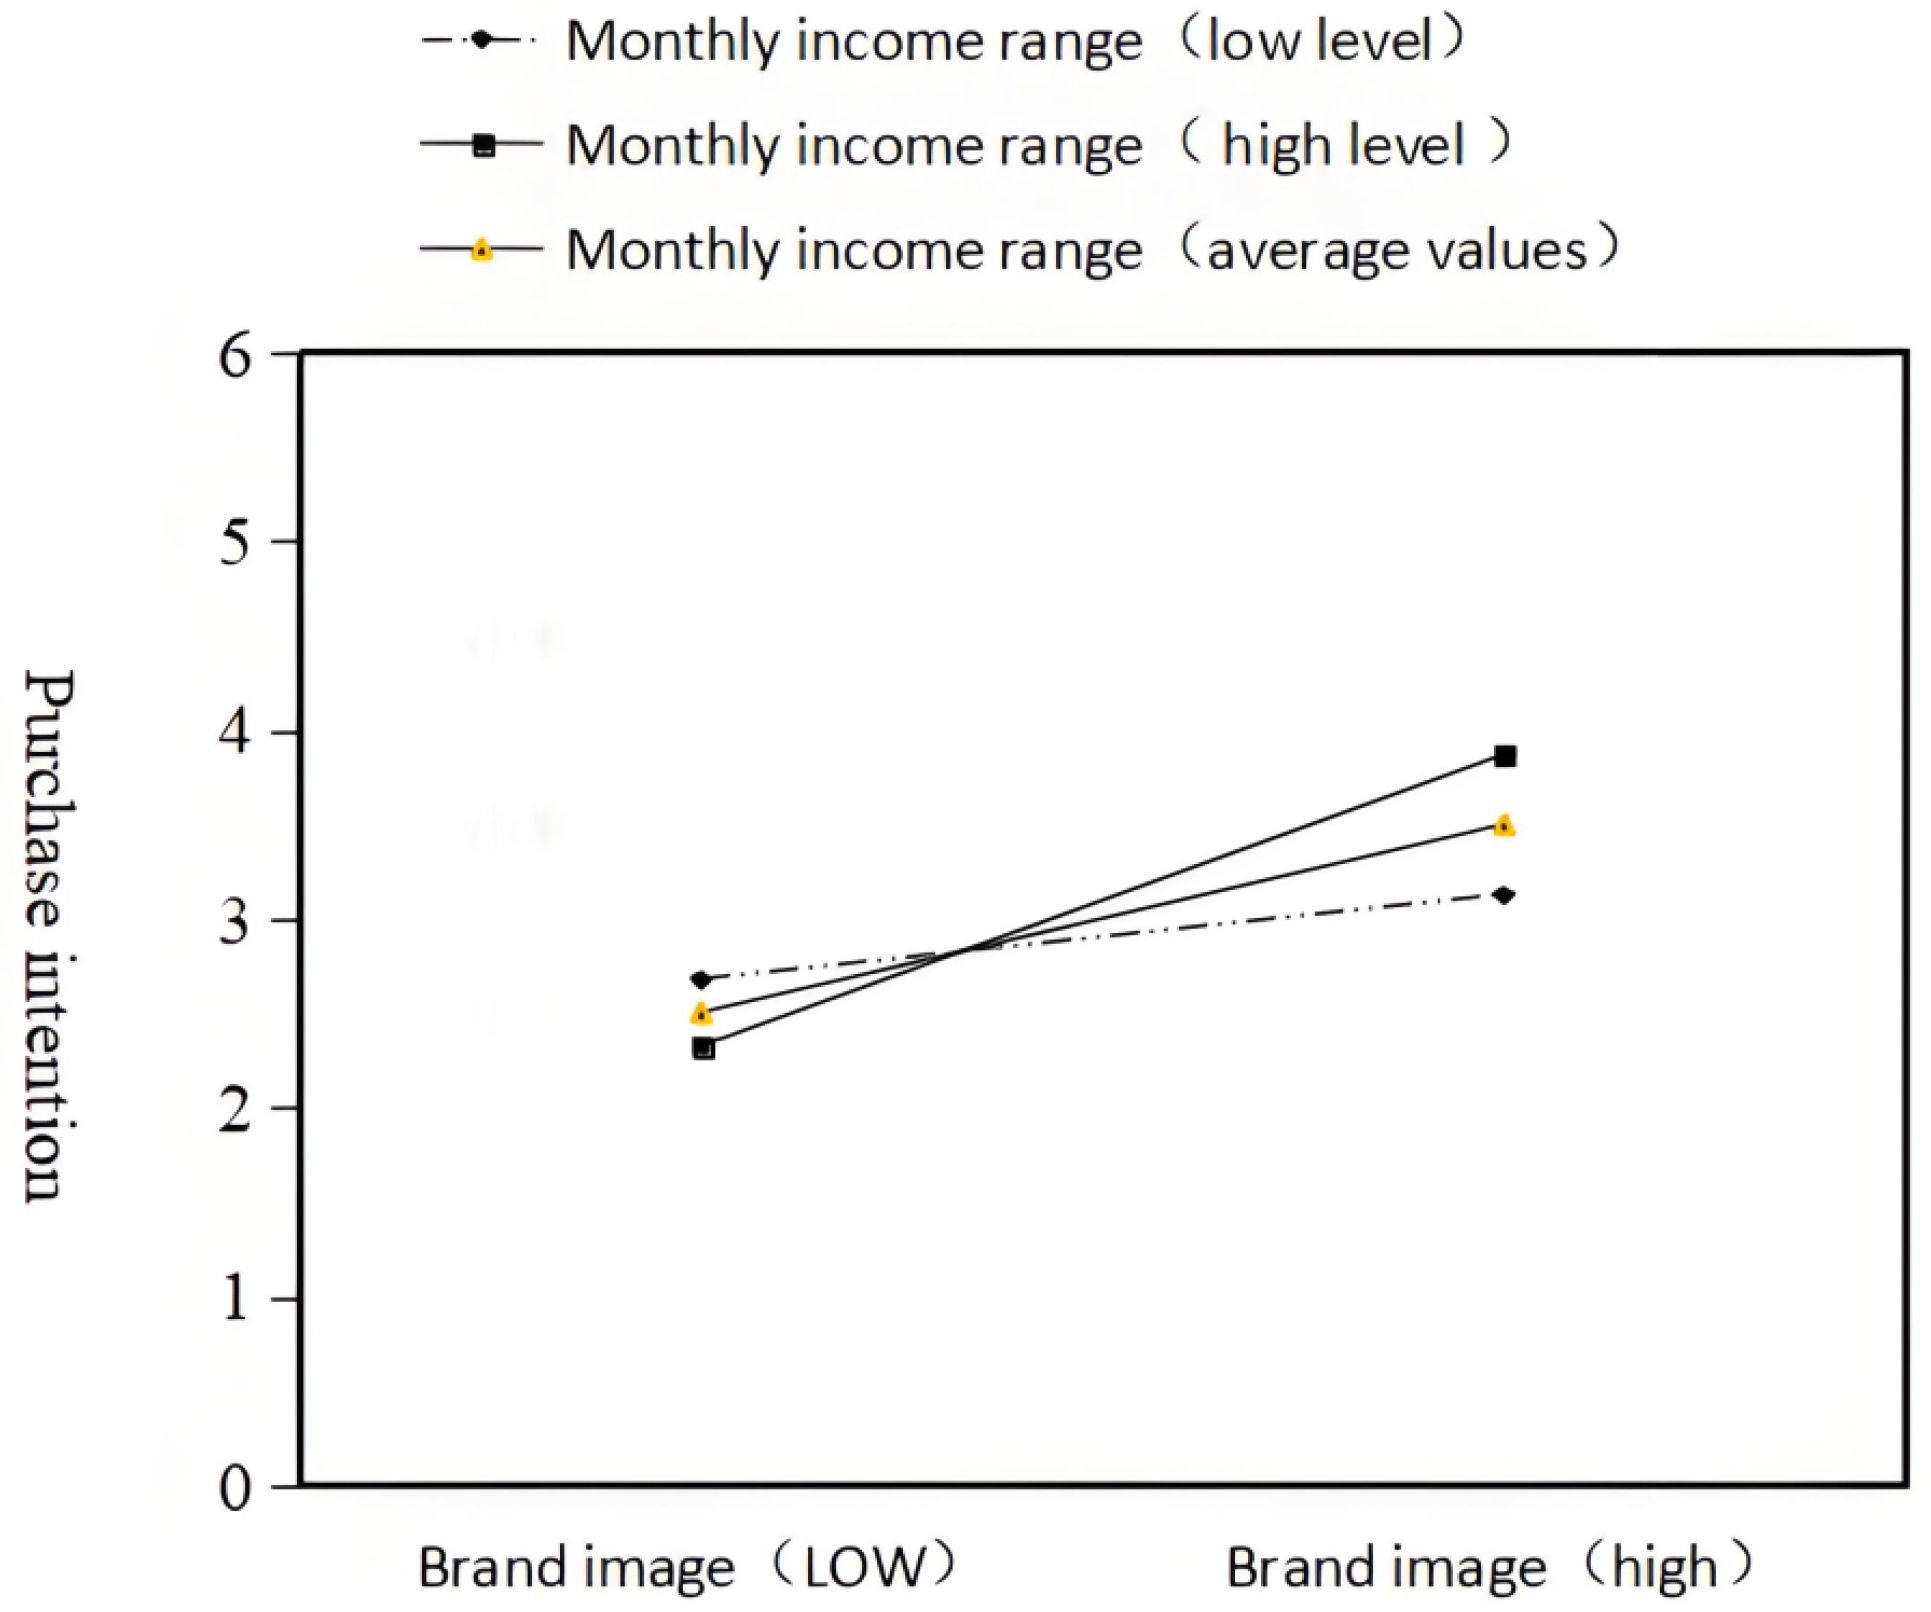
4.4. Moderating Effects
5. Conclusions and Discussion
5.1. Discussion
5.2. Conclusions
5.3. Research Limitations and Prospects for Future Works
5.3.1. Research Limitations
5.3.2. Future Works Prospects
Author Contributions
Funding
Institutional Review Board Statement
Informed Consent Statement
Data Availability Statement
Conflicts of Interest
References
- Crippa, M.; Guizzardi, D.; Banja, M.; Solazzo, E.; Muntean, M.; Schaaf, E.; Pagani, F.; Monforti-Ferrario, F.; Olivier, J.G.J.; Quadrelli, R.; et al. CO2 emissions of all world countries—JRC/IEA/PBL 2022 Report. Eur. Comm. 2022. [Google Scholar] [CrossRef]
- Gärling, A.; Thøgersen, J. Marketing of electric vehicles. Bus. Strategy Environ. 2001, 10, 53–65. [Google Scholar] [CrossRef]
- Available online: https://www.thenationalnews.com/future/technology/2024/12/21/electric-vehicle-sales-to-zoom-by-nearly-a-third-in-2025-sp-says/ (accessed on 12 March 2025).
- Available online: https://www.irishtimes.com/business/2024/12/26/chinas-ev-sales-set-to-overtake-traditional-cars-years-ahead-of-west/ (accessed on 12 March 2025).
- Meckling, J.; Nahm, J. The politics of technology bans: Industrial policy competition and green goals for the auto industry. Energy Policy 2019, 126, 470–479. [Google Scholar] [CrossRef]
- Available online: https://www-ft-com.ezp-prod1.hul.harvard.edu/content/fddc1c5b-7494-4f0c-94cd-0409d7e9df70 (accessed on 17 May 2025).
- Chu, Y. China’s new energy vehicle industrial development plan for 2021 to 2035. Polocy Update. ICCT, 13 June 2021. [Google Scholar]
- Biden Accuses China of ‘Cheating’ on Trade, Imposes New Tariffs. Available online: https://businessmirror.com.ph/2024/05/15/biden-accuses-china-of-cheating-on-trade-imposes-new-tariffs/ (accessed on 17 May 2025).
- EU Tariffs on China EVs to Reach as High as 48% with New Levies. Available online: https://www.bloomberg.com/news/articles/2024-06-12/eu-to-impose-additional-tariffs-on-ev-imports-from-china (accessed on 17 May 2025).
- Dua, R. Net-zero transport dialogue: Emerging developments and the puzzles they present. Energy Sustain. Dev. 2024, 82, 101516. [Google Scholar] [CrossRef]
- Pole Position: Chinese EV Investments Boom Amid Growing Political Backlash. Available online: https://rhg.com/research/pole-position-chinese-ev-investments-boom-amid-growing-political-backlash/ (accessed on 17 May 2025).
- China’s Plan to Sell Cheap EVs to the Rest of the World. Available online: https://www.ft.com/content/c77fefa3-7f47-429b-8149-50aa60f39498 (accessed on 17 May 2025).
- Schuitema, G.; Anable, J.; Skippon, S.; Kinnear, N. The role of instrumental, hedonic and symbolic attributes in the intention to adopt electric vehicles. Transp. Res. Part A Policy Pract. 2013, 48, 39–49. [Google Scholar] [CrossRef]
- Berger, P.; Luckmann, T. The Social Construction of Reality Anchor Books; Garden City: New York, NY, USA, 1966. [Google Scholar]
- Anable, J.; Gatersleben, B. All work and no play? The role of instrumental and affective factors in work and leisure journeys by different travel modes. Transp. Res. Part A Policy Pract. 2005, 39, 163–181. [Google Scholar] [CrossRef]
- Bergstad, C.J.; Gamble, A.; Hagman, O.; Polk, M.; Gärling, T.; Olsson, L.E. Affective–symbolic and instrumental–independence psychological motives mediating effects of socio-demographic variables on daily car use. J. Transp. Geogr. 2011, 19, 33–38. [Google Scholar] [CrossRef]
- Steg, L.; Vlek, C.; Slotegraaf, G. Instrumental-reasoned and symbolic-affective motives for using a motor car. Transp. Res. Part F Traffic Psychol. Behav. 2001, 4, 151–169. [Google Scholar] [CrossRef]
- Steg, L. Car use: Lust and must. Instrumental, symbolic and affective motives for car use. Transp. Res. Part A Policy Pract. 2005, 39, 147–162. [Google Scholar] [CrossRef]
- Heffner, R.R.; Turrentine, T.; Kurani, K. A Primer on Automobile Semiotics; Institute of Transportation Studies: Berkeley, CA, USA, 2006. [Google Scholar]
- Heffner, R.R.; Kurani, K.S.; Turrentine, T.S. Symbolism in California’s early market for hybrid electric vehicles. Transp. Res. Part D Transp. Environ. 2007, 12, 396–413. [Google Scholar] [CrossRef]
- Kurani, K.S.; Turrentine, T.S.; Heffner, R.R. Narrative self-identity and societal goals: Automotive fuel economy and global warming policy. In Driving Climate Change; Academic Press: Cambridge, MA, USA, 2007; pp. 217–238. [Google Scholar]
- Skippon, S.; Garwood, M. Responses to battery electric vehicles: UK consumer attitudes and attributions of symbolic meaning following direct experience to reduce psychological distance. Transp. Res. Part D Transp. Environ. 2011, 16, 525–531. [Google Scholar] [CrossRef]
- Cherrier, H.; Murray, J.B. Reflexive dispossession and the self: Constructing a processual theory of identity. Consum. Mark. Cult. 2007, 10, 1–29. [Google Scholar] [CrossRef]
- Reed, A., II; Forehand, M.R.; Puntoni, S.; Warlop, L. Identity-based consumer behavior. Int. J. Res. Mark. 2012, 29, 310–321. [Google Scholar] [CrossRef]
- Arnould, E.J.; Thompson, C.J. Consumer culture theory (CCT): Twenty years of research. J. Consum. Res. 2005, 31, 868–882. [Google Scholar] [CrossRef]
- Chernev, A.; Hamilton, R.; Gal, D. Competing for consumer identity: Limits to self-expression and the perils of lifestyle branding. J. Mark. 2011, 75, 66–82. [Google Scholar] [CrossRef]
- Ahuvia, A.C. Beyond the extended self: Loved objects and consumers’ identity narratives. J. Consum. Res. 2005, 32, 171–184. [Google Scholar] [CrossRef]
- Elliott, R.; Wattanasuwan, K. Brands as symbolic resources for the construction of identity. Int. J. Advert. 1998, 17, 131–144. [Google Scholar] [CrossRef]
- Hackbarth, A.; Madlener, R. Willingness-to-pay for alternative fuel vehicle characteristics: A stated choice study for Germany. Transp. Res. Part A Policy Pract. 2016, 85, 89–111. [Google Scholar] [CrossRef]
- He, X.; Zhan, W.; Hu, Y. Consumer purchase intention of electric vehicles in China: The roles of perception and personality. J. Clean. Prod. 2018, 204, 1060–1069. [Google Scholar] [CrossRef]
- Han, Y.J.; Nunes, J.C.; Drèze, X. Signaling status with luxury goods: The role of brand prominence. J. Mark. 2010, 74, 15–30. [Google Scholar] [CrossRef]
- Kates, S.M. The dynamics of brand legitimacy: An interpretive study in the gay men’s community. J. Consum. Res. 2004, 31, 455–464. [Google Scholar] [CrossRef]
- Schembri, S.; Merrilees, B.; Kristiansen, S. Brand consumption and narrative of the self. Psychol. Mark. 2010, 27, 623–637. [Google Scholar] [CrossRef]
- Lam, S.K.; Ahearne, M.; Hu, Y.; Schillewaert, N. Resistance to brand switching when a radically new brand is introduced: A social identity theory perspective. J. Mark. 2010, 74, 128–146. [Google Scholar] [CrossRef]
- Keller, K.L. Conceptualizing, measuring, and managing customer-based brand equity. J. Mark. 1993, 57, 1–22. [Google Scholar] [CrossRef]
- Park, C.W.; Jaworski, B.J.; MacInnis, D.J. Strategic brand concept-image management. J. Mark. 1986, 50, 135–145. [Google Scholar] [CrossRef]
- Delgado-Ballester, E.; Munuera-Alemán, J.L. Brand trust in the context of consumer loyalty. Eur. J. Mark. 2001, 35, 1238–1258. [Google Scholar] [CrossRef]
- Chernev, A.; Blair, S. Doing well by doing good: The benevolent halo of corporate social responsibility. J. Consum. Res. 2015, 41, 1412–1425. [Google Scholar] [CrossRef]
- Aaker, J.L. Dimensions of brand personality. J. Mark. Res. 1997, 34, 347–356. [Google Scholar] [CrossRef]
- Carroll, B.A.; Ahuvia, A.C. Some antecedents and outcomes of brand love. Mark. Lett. 2006, 17, 79–89. [Google Scholar] [CrossRef]
- Park, C.W.; MacInnis, D.J.; Priester, J.; Eisingerich, A.B.; Iacobucci, D. Brand attachment and brand attitude strength: Conceptual and empirical differentiation of two critical brand equity drivers. J. Mark. 2010, 74, 1–17. [Google Scholar] [CrossRef]
- Muehling, D.D.; Sprott, D.E.; Sprott, D.E. The power of reflection: An empirical examination of nostalgia advertising effects. J. Advert. 2004, 33, 25–35. [Google Scholar] [CrossRef]
- Loveland, K.E.; Smeesters, D.; Mandel, N. Still preoccupied with 1995: The need to belong and preference for nostalgic products. J. Consum. Res. 2010, 37, 393–408. [Google Scholar] [CrossRef]
- Zeithaml, V.A. Consumer perceptions of price, quality, and value: A means-end model and synthesis of evidence. J. Mark. 1988, 52, 2–22. [Google Scholar] [CrossRef]
- Gürhan-Canli, Z.; Batra, R. When corporate image affects product evaluations: The moderating role of perceived risk. J. Mark. Res. 2004, 41, 197–205. [Google Scholar] [CrossRef]
- Erdem, T.; Swait, J. Brand credibility, brand consideration, and choice. J. Consum. Res. 2004, 31, 191–198. [Google Scholar] [CrossRef]
- Belk, R.W. Possessions and the extended self. J. Consum. Res. 1988, 15, 139–168. [Google Scholar] [CrossRef]
- Solomon, M.R. The role of products as social stimuli: A symbolic interactionism perspective. J. Consum. Res. 1983, 10, 319–329. [Google Scholar] [CrossRef]
- Escalas, J.E.; Bettman, J.R. Self-construal, reference groups, and brand meaning. J. Consum. Res. 2005, 32, 378–389. [Google Scholar] [CrossRef]
- Lam, S.K.; Ahearne, M.; Mullins, R.; Hayati, B.; Schillewaert, N. Exploring the dynamics of antecedents to consumer–brand identification with a new brand. J. Acad. Mark. Sci. 2013, 41, 234–252. [Google Scholar] [CrossRef]
- Zhang, J.; Shavitt, S. Cultural values in advertisements to the Chinese X-generation–Promoting modernity and individualism. J. Advert. 2003, 32, 23–33. [Google Scholar] [CrossRef]
- Schivinski, B.; Christodoulides, G.; Dabrowski, D. Measuring consumers’ engagement with brand-related social-media content: Development and validation of a scale that identifies levels of social-media engagement with brands. J. Advert. Res. 2016, 56, 64–80. [Google Scholar] [CrossRef]
- Berger, J.; Heath, C. Where consumers diverge from others: Identity signaling and product domains. J. Consum. Res. 2007, 34, 121–134. [Google Scholar] [CrossRef]
- Veblen, T.; Galbraith, J.K. The Theory of the Leisure Class; Houghton Mifflin: Boston, MA, USA, 1973; Volume 1899. [Google Scholar]
- Griskevicius, V.; Tybur, J.M.; Van den Bergh, B. Going green to be seen: Status, reputation, and conspicuous conservation. J. Personal. Soc. Psychol. 2010, 98, 392–404. [Google Scholar] [CrossRef] [PubMed]
- Axsen, J.; Kurani, K.S. Interpersonal influence within car buyers’ social networks: Applying five perspectives to plug-in hybrid vehicle drivers. Environ. Plan. A 2012, 44, 1047–1065. [Google Scholar] [CrossRef]
- Neal, C.; Quester, P.; Hawkins, D. Consumer Behaviour–Implications for Marketing Strategy, 3rd ed.; Irwin/McGraw-Hill: Sydney, Australia, 2000. [Google Scholar]
- Okumus, B.; Okumus, F.; McKercher, B. Incorporating local and international cuisines in the marketing of tourism destinations: The cases of Hong Kong and Turkey. Tour. Manag. 2007, 28, 253–261. [Google Scholar] [CrossRef]
- Nayeem, T. Cultural Influences on Consumer Behaviour. Int. J. Bus. Manag. 2012, 7, 78–91. [Google Scholar] [CrossRef]
- Belch, G.E.; Belch, M.A. Advertising and Promotion: An Integrated Marketing Communications Perspective; McGraw-Hill: New York, NY, USA, 2018. [Google Scholar]
- Anurit, J.; Newman, K.; Chansarker, B. Consumer Behaviour of Luxury Automobiles: A Comparative Study between Thai and UK Customers Perceptions. J. Consum. Mark. Manag. 2008, 14, 749–763. [Google Scholar]
- Panwar, D.; An, S.; Ali, F.; Singal, K. Consumer decision making process models and their applications to market strategy. Int. Manag. Rev. 2019, 15, 36–44. [Google Scholar]
- Burr, V. Social Constructionism, 3rd ed.; Routledge: New York, NY, USA, 2015; pp. 123–124. [Google Scholar]
- Widodo, T.; Mahadika, P.K. Factors Affecting Electronic Product Purchase Intention During Pandemic: The Moderating Effect of Gender and Occupation. Manag. Anal. J. 2023, 12, 157–167. [Google Scholar]
- Hayes, A.F. Partial, conditional, and moderated moderated mediation: Quantification, inference, and interpretation. Commun. Monogr. 2018, 85, 4–40. [Google Scholar] [CrossRef]
- MacKinnon, D.P. Introduction to Statistical Mediation Analysis; Routledge: New York, NY, USA, 2008. [Google Scholar]
- VanderWeele, T.J. Explanation in Causal Inference: Methods for Mediation and Interaction; Oxford University Press: Oxford, UK, 2015. [Google Scholar]
- Graham-Rowe, E.; Gardner, B.; Abraham, C.; Skippon, S.; Dittmar, H.; Hutchins, R.; Stannard, J. Mainstream consumers driving plug-in battery-electric and plug-in hybrid electric cars: A qualitative analysis of responses and evaluations. Transp. Res. Part A Policy Pract. 2012, 46, 140–153. [Google Scholar] [CrossRef]
- Plötz, P.; Schneider, U.; Globisch, J.; Dütschke, E. Who will buy electric vehicles? Identifying early adopters in Germany. Transp. Res. Part A Policy Pract. 2014, 67, 96–109. [Google Scholar] [CrossRef]
- Sovacool, B.K.; Kester, J.; Noel, L.; de Rubens, G.Z. The demographics of decarbonizing transport: The influence of gender, education, occupation, age, and household size on electric mobility preferences in the Nordic region. Environ. Change 2018, 52, 86–100. [Google Scholar] [CrossRef]
- Chen, C.F.; de Rubens, G.Z.; Noel, L.; Kester, J.; Sovacool, B.K. Assessing the socio-demographic, technical, economic and behavioral factors of Nordic electric vehicle adoption and the influence of vehicle-to-grid preferences. Renew. Sustain. Energy Rev. 2020, 121, 109692. [Google Scholar] [CrossRef]
- Jia, W.; Chen, T.D. Are Individuals’ stated preferences for electric vehicles (EVs) consistent with real-world EV ownership patterns? Transp. Res. Part D Transp. Environ. 2021, 93, 102728. [Google Scholar] [CrossRef]
- Tomasi, S.; Zubaryeva, A.; Pizzirani, C.; Dal Col, M.; Balest, J. Propensity to choose electric vehicles in cross-border alpine regions. Sustainability 2021, 13, 4583. [Google Scholar] [CrossRef]
- Yang, A.; Liu, C.; Yang, D.; Lu, C. Electric vehicle adoption in a mature market: A case study of Norway. J. Transp. Geogr. 2023, 106, 103489. [Google Scholar] [CrossRef]
- Ziegler, A. Individual characteristics and stated preferences for alternative energy sources and propulsion technologies in vehicles: A discrete choice analysis for Germany. Transp. Res. Part A Policy Pract. 2012, 46, 1372–1385. [Google Scholar] [CrossRef]
- Ouyang, D.; Ou, X.; Zhang, Q.; Dong, C. Factors influencing purchase of electric vehicles in China. Mitig. Adapt. Strateg. Glob. Change 2020, 25, 413–440. [Google Scholar] [CrossRef]
- Bennett, R.; Vijaygopal, R. Consumer attitudes towards electric vehicles: Effects of product user stereotypes and self-image congruence. Eur. J. Mark. 2018, 52, 499–527. [Google Scholar] [CrossRef]
- He, X.; Zhan, W. How to activate moral norm to adopt electric vehicles in China? An empirical study based on extended norm activation theory. J. Clean. Prod. 2018, 172, 3546–3556. [Google Scholar] [CrossRef]
- Jenn, A.; Laberteaux, K.; Clewlow, R. New mobility service users’ perceptions on electric vehicle adoption. Int. J. Sustain. Transp. 2018, 12, 526–540. [Google Scholar] [CrossRef]
- Kim, M.K.; Oh, J.; Park, J.H.; Joo, C. Perceived value and adoption intention for electric vehicles in Korea: Moderating effects of environmental traits and government supports. Energy 2018, 159, 799–809. [Google Scholar] [CrossRef]
- Vassileva, I.; Campillo, J. Adoption barriers for electric vehicles: Experiences from early adopters in Sweden. Energy 2017, 120, 632–641. [Google Scholar] [CrossRef]
- Electric Vehicles in Europe: Gearing up for a New Phase? Available online: https://www.mckinsey.com/featured-insights/europe/electric-vehicles-in-europe-gearing-up-for-a-new-phase (accessed on 17 May 2025).
- Brand, C.; Preston, J.M. ‘60-20 emission’—The unequal distribution of greenhouse gas emissions from personal, non-business travel in the UK. Transp. Policy 2010, 17, 9–19. [Google Scholar] [CrossRef]
- Sovacool, B.K.; Valentine, S.V.; Bambawale, M.J.; Brown, M.A.; de Fatima Cardoso, T.; Nurbek, S.; Zubiri, A. Exploring propositions about perceptions of energy security: An international survey. Environ. Sci. Policy 2012, 16, 44–64. [Google Scholar] [CrossRef]
- Nykvist, B.; Nilsson, M. The EV paradox–A multilevel study of why Stockholm is not a leader in electric vehicles. Environ. Innov. Soc. Transit. 2015, 14, 26–44. [Google Scholar] [CrossRef]
- Fisher, R.J. Social desirability bias and the validity of indirect questioning. J. Consum. Res. 1993, 20, 303–315. [Google Scholar] [CrossRef]
- Jiang, C.; Zhang, Y.; Zhao, Q.; Wu, C. The impact of purchase subsidy on enterprises’ R&D efforts: Evidence from China’s new energy vehicle industry. Sustainability 2020, 12, 1105. [Google Scholar]
- Diamond, D. The impact of government incentives for hybrid-electric vehicles: Evidence from US states. Energy Policy 2009, 37, 972–983. [Google Scholar] [CrossRef]
- Hidrue, M.K.; Parsons, G.R.; Kempton, W.; Gardner, M.P. Willingness to pay for electric vehicles and their attributes. Resour. Energy Econ. 2011, 33, 686–705. [Google Scholar] [CrossRef]
- Naldi, L.; Cazzaniga, S. Research techniques made simple: Latent class analysis. J. Investig. Dermatol. 2020, 140, 1676–1680. [Google Scholar] [CrossRef] [PubMed]
- Ali, J.; Khan, R.; Ahmad, N.; Maqsood, I. Random forests and decision trees. Int. J. Comput. Sci. Issues (IJCSI) 2012, 9, 272. [Google Scholar]
- Kamphuis, C.B.M.; de Bekker-Grob, E.W.; van Lenthe, F.J. Factors affecting food choices of older adults from high and low socioeconomic groups: A discrete choice experiment. Am. J. Clin. Nutr. 2015, 101, 768–774. [Google Scholar] [CrossRef] [PubMed]
- Bolger, N.; Laurenceau, J.-P. Intensive Longitudinal Methods: An Introduction to Diary and Experience Sampling Research; Guilford Press: New York, NY, USA, 2013. [Google Scholar]
- Datta, H.; Foubert, B.; Van Heerde, H.J. The challenge of retaining customers acquired with free trials. J. Mark. Res. 2015, 52, 217–234. [Google Scholar] [CrossRef]
- Netzer, O.; Feldman, R.; Goldenberg, J.; Fresko, M. Mine your own business: Market-structure surveillance through text mining. Mark. Sci. 2012, 31, 521–543. [Google Scholar] [CrossRef]
- Tirunillai, S.; Tellis, G.J. Mining marketing meaning from online chatter: Strategic brand analysis of big data using latent dirichlet allocation. J. Mark. Res. 2014, 51, 463–479. [Google Scholar] [CrossRef]


| Brand Image | Brand Perception | Purchase Intention | Social Identity |
|---|---|---|---|
| I think the EV brand has a high level of social responsibility. | I think the EV is a reliable quality product. | I would be willing to buy the EV in the next two years. | Your gender is? |
| I was impressed by the ad campaign for the EV. | I am satisfied with the after sales service of the EV. | I would be more inclined to buy the EV if someone around me recommended it. | Your age is? |
| The product design of the EV fits my aesthetic preferences. | The range of the EV was in line with my expectations. | The price/performance ratio of the EV gives me a strong incentive to buy it. | What is your education level? |
| The EV excels in environmental protection and sustainability. | The price of the EV matches the value it provides. | I would prioritize the EV. | What is your monthly income range? |
| EV’s history and cultural heritage endeared it to me. | The technical innovations of the EV give me confidence in it. | What is your occupation? |
| Item | Options | Frequency | Percentage (%) |
|---|---|---|---|
| Gender | Male | 735 | 76.40 |
| Female | 227 | 23.60 | |
| Age | 18–24 years | 254 | 26.40 |
| 25–30 years | 278 | 28.90 | |
| 31–36 years | 261 | 27.13 | |
| 36–45 years | 75 | 7.80 | |
| Over 46 years | 94 | 9.77 | |
| Education | Junior high or below | 127 | 13.20 |
| High school | 119 | 12.37 | |
| Vocational school | 151 | 15.70 | |
| Bachelor’s degree | 421 | 43.76 | |
| Master’s degree or above | 144 | 14.97 | |
| Monthly income | ≤¥5000 | 201 | 20.89 |
| ¥5001–7000 | 259 | 26.92 | |
| ¥7001–10,000 | 273 | 28.38 | |
| ¥10,001–12,000 | 133 | 13.83 | |
| ≥¥12,001 | 96 | 9.98 | |
| Occupation | Manufacturing | 194 | 20.17 |
| Education | 152 | 15.80 | |
| Healthcare | 197 | 20.48 | |
| Finance | 162 | 16.84 | |
| Government and institutions | 56 | 5.82 | |
| Construction and real estate | 157 | 16.32 | |
| Other | 44 | 4.57 | |
| Total | 962 | 100.00 |
| Item | Sample Size | Mean | Std. Deviation | Kurtosis | Skewness |
|---|---|---|---|---|---|
| Brand image | 962 | 3.054 | 0.971 | −0.249 | −0.849 |
| Brand perception | 962 | 3.061 | 1.011 | −0.176 | −0.893 |
| Purchase intention | 962 | 3.295 | 0.815 | −0.667 | −0.286 |
| Dimension | Item | Corrected Item-Total Correlation (CITC) | Deleted Item’s Coefficient | Cronbach’s Coefficient | Overall Reliability |
|---|---|---|---|---|---|
| Brand image | A1 | 0.785 | 0.897 | 0.916 | |
| A2 | 0.775 | 0.899 | |||
| A3 | 0.787 | 0.897 | |||
| A4 | 0.782 | 0.898 | |||
| A5 | 0.794 | 0.895 | |||
| Brand perception | B1 | 0.787 | 0.902 | 0.919 | |
| B2 | 0.796 | 0.900 | 0.890 | ||
| B3 | 0.806 | 0.898 | |||
| B4 | 0.772 | 0.905 | |||
| B5 | 0.797 | 0.900 | |||
| Purchase intention | C1 | 0.642 | 0.770 | 0.818 | |
| C2 | 0.619 | 0.781 | |||
| C3 | 0.651 | 0.766 | |||
| C4 | 0.646 | 0.768 |
| KMO Value | 0.912 | |
|---|---|---|
| Bartlett Sphericity Test | Approx. Chi-Square | 8092.845 |
| df | 91 | |
| p-value | 0.000 | |
| Factor | Eigenvalue | Before Rotation | After Rotation | ||||||
|---|---|---|---|---|---|---|---|---|---|
| Value | % | Cum.% | Value | % | Cum.% | Value | % | Cum.% | |
| 1 | 5.784 | 41.311 | 41.311 | 5.784 | 41.311 | 41.311 | 3.768 | 26.916 | 26.916 |
| 2 | 2.527 | 18.051 | 59.362 | 2.527 | 18.051 | 59.362 | 3.730 | 26.640 | 53.556 |
| 3 | 1.813 | 12.950 | 72.312 | 1.813 | 12.950 | 72.312 | 2.626 | 18.756 | 72.312 |
| 4 | 0.513 | 3.666 | 75.978 | – | – | – | – | – | – |
| 5 | 0.479 | 3.420 | 79.398 | – | – | – | – | – | – |
| 6 | 0.442 | 3.155 | 82.553 | – | – | – | – | – | – |
| 7 | 0.344 | 2.455 | 85.009 | – | – | – | – | – | – |
| 8 | 0.340 | 2.430 | 87.439 | – | – | – | – | – | – |
| 9 | 0.322 | 2.299 | 89.738 | – | – | – | – | – | – |
| 10 | 0.315 | 2.249 | 91.986 | – | – | – | – | – | – |
| 11 | 0.303 | 2.166 | 94.152 | – | – | – | – | – | – |
| 12 | 0.285 | 2.038 | 96.190 | – | – | – | – | – | – |
| 13 | 0.268 | 1.913 | 98.103 | – | – | – | – | – | – |
| 14 | 0.266 | 1.897 | 100.000 | – | – | – | – | – | – |
| Item | Factor Loading Coefficients | Commonality (Common Factor Variance) | ||
|---|---|---|---|---|
| Factor 1 | Factor 2 | Factor 3 | ||
| A1 | 0.110 | 0.842 | 0.169 | 0.750 |
| A2 | 0.134 | 0.834 | 0.148 | 0.736 |
| A3 | 0.152 | 0.848 | 0.112 | 0.755 |
| A4 | 0.151 | 0.841 | 0.128 | 0.747 |
| A5 | 0.126 | 0.846 | 0.166 | 0.759 |
| B1 | 0.838 | 0.159 | 0.146 | 0.750 |
| B2 | 0.851 | 0.134 | 0.142 | 0.762 |
| B3 | 0.854 | 0.152 | 0.143 | 0.773 |
| B4 | 0.838 | 0.122 | 0.125 | 0.732 |
| B5 | 0.858 | 0.113 | 0.125 | 0.765 |
| C1 | 0.095 | 0.157 | 0.789 | 0.656 |
| C2 | 0.154 | 0.154 | 0.756 | 0.619 |
| C3 | 0.182 | 0.159 | 0.773 | 0.656 |
| C4 | 0.124 | 0.117 | 0.796 | 0.663 |
| Brand Image | Brand Perception | Purchase Intention | |
|---|---|---|---|
| Brand image | 1 | ||
| Brand perception | 0.330 ** | 1 | |
| Purchase intention | 0.366 ** | 0.348 ** | 1 |
| Unstandardized Coefficients | Standardized | t | p | ||
|---|---|---|---|---|---|
| B | Std. Error | Beta | |||
| Constant | 2.012 | 0.102 | – | 19.787 | 0.000 ** |
| Brand image | 0.343 | 0.032 | 0.330 | 10.821 | 0.000 ** |
| 0.109 | |||||
| Adjusted | 0.108 | ||||
| F | , | ||||
| D-W value | 1.927 | ||||
| Unstandardized Coefficients | Standardized | t | p | Collinearity Statistics | |||
|---|---|---|---|---|---|---|---|
| B | Std. Error | Beta | VIF | Tolerance | |||
| Constant | 1.944 | 0.093 | – | 20.972 | 0.000 ** | – | – |
| Brand image | 0.236 | 0.026 | 0.282 | 9.156 | 0.000 ** | 1.122 | 0.891 |
| Brand perception | 0.206 | 0.025 | 0.255 | 8.300 | 0.000 ** | 1.122 | 0.891 |
| 0.192 | |||||||
| Adjusted | 0.190 | ||||||
| F | , | ||||||
| D-W value | 1.600 | ||||||
| Purchase Intention | Brand Perception | Purchase Intention | |
|---|---|---|---|
| Constant | 2.358 ** (29.170) | 2.012 ** (19.787) | 1.944 ** (20.972) |
| Brand image | 0.307 ** (12.174) | 0.343 ** (10.821) | 0.236 ** (9.156) |
| Brand perception | – | – | 0.206 ** (8.300) |
| Sample size | 962 | 962 | 962 |
| 0.134 | 0.109 | 0.192 | |
| Adjusted | 0.133 | 0.108 | 0.190 |
| F value |
| Item | c Total Effect | a | b | Value of Intermediary Effect | (95% BootCI) | Direct Effect | Test Conclusion |
|---|---|---|---|---|---|---|---|
| Brand image ⇒ Brand perception ⇒ Purchase intention | 0.307 ** | 0.343 ** | 0.206 ** | 0.071 | 0.062∼0.108 | 0.236 ** | part of an intermediary |
| Model 1 | Model 2 | Model 3 | |
|---|---|---|---|
| Constant | 3.295 ** (134.651) | 3.295 ** (141.180) | 3.283 ** (146.977) |
| Brand image | 0.307 ** (12.174) | 0.295 ** (12.233) | 0.260 ** (11.147) |
| Gender (1 = male, 2 = female) | – | −0.540 ** (−9.816) | −0.581 ** (−11.018) |
| Brand image × Gender | – | – | −0.583 ** (−9.639) |
| Sample size | 962 | 962 | 962 |
| 0.134 | 0.213 | 0.282 | |
| Adjusted | 0.133 | 0.211 | 0.280 |
| F value | |||
| 0.134 | 0.079 | 0.070 | |
| value | – |
| Model 1 | Model 2 | Model 3 | |
|---|---|---|---|
| Constant | 3.295 ** (134.651) | 3.295 ** (135.942) | 3.292 ** (136.401) |
| Brand image | 0.307 ** (12.174) | 0.302 ** (12.084) | 0.297 ** (11.904) |
| Age | – | 0.087 ** (4.415) | 0.085 ** (4.322) |
| Brand image × Age | – | – | 0.066 ** (3.357) |
| Sample size | 962 | 962 | 962 |
| 0.134 | 0.151 | 0.161 | |
| Adjusted | 0.133 | 0.149 | 0.158 |
| F value | |||
| 0.134 | 0.017 | 0.010 | |
| value |
| Model 1 | Model 2 | Model 3 | |
|---|---|---|---|
| Constant | 3.295 ** (134.651) | 3.295 ** (135.558) | 3.243 ** (128.762) |
| Brand image | 0.307 ** (12.174) | 0.337 ** (12.813) | 0.309 ** (11.859) |
| Education | – | −0.076 ** (−3.740) | −0.042 * (−2.038) |
| Brand image × Education | – | – | 0.143 ** (6.405) |
| Sample size | 962 | 962 | 962 |
| 0.134 | 0.146 | 0.181 | |
| Adjusted | 0.133 | 0.144 | 0.179 |
| F value | |||
| 0.134 | 0.012 | 0.035 | |
| value |
| Variable | Model 1 | Model 2 | Model 3 |
|---|---|---|---|
| Constant | 3.295 ** (134.651) | 3.295 ** (134.875) | 3.258 ** (132.059) |
| Brand image | 0.307 ** (12.174) | 0.294 ** (11.322) | 0.292 ** (11.480) |
| Monthly income range | – | 0.042 * (2.050) | 0.026 (1.298) |
| Brand image × Monthly income range | – | – | 0.127 ** (6.295) |
| N | 962 | 962 | 962 |
| 0.134 | 0.138 | 0.172 | |
| Adj. | 0.133 | 0.136 | 0.169 |
| F | |||
| – | 0.004 | 0.034 | |
| – |
| Model 1 | Model 2 | Model 3 | |
|---|---|---|---|
| Constant | (134.651) | (61.748) | (62.583) |
| Brand image | 0.307 ** (12.174) | 0.294 ** (11.506) | 0.122 * (2.118) |
| Occupation: manufacturing (ref.) | – | – | – |
| Occupation: education | – | 0.047 (0.575) | −0.022 (−0.261) |
| Occupation: healthcare | – | −0.053 (−0.694) | −0.042 (−0.565) |
| Occupation: finance | – | −0.125 (−1.549) | −0.111 (−1.406) |
| Occupation: government | – | 0.052 (0.450) | 0.014 (0.118) |
| Occupation: construction & Real Estate | – | −0.225 ** (−2.773) | −0.263 ** (−3.236) |
| Occupation: other | – | 0.041 (0.326) | 0.048 (0.386) |
| Brand image × education | – | – | 0.449 ** (5.318) |
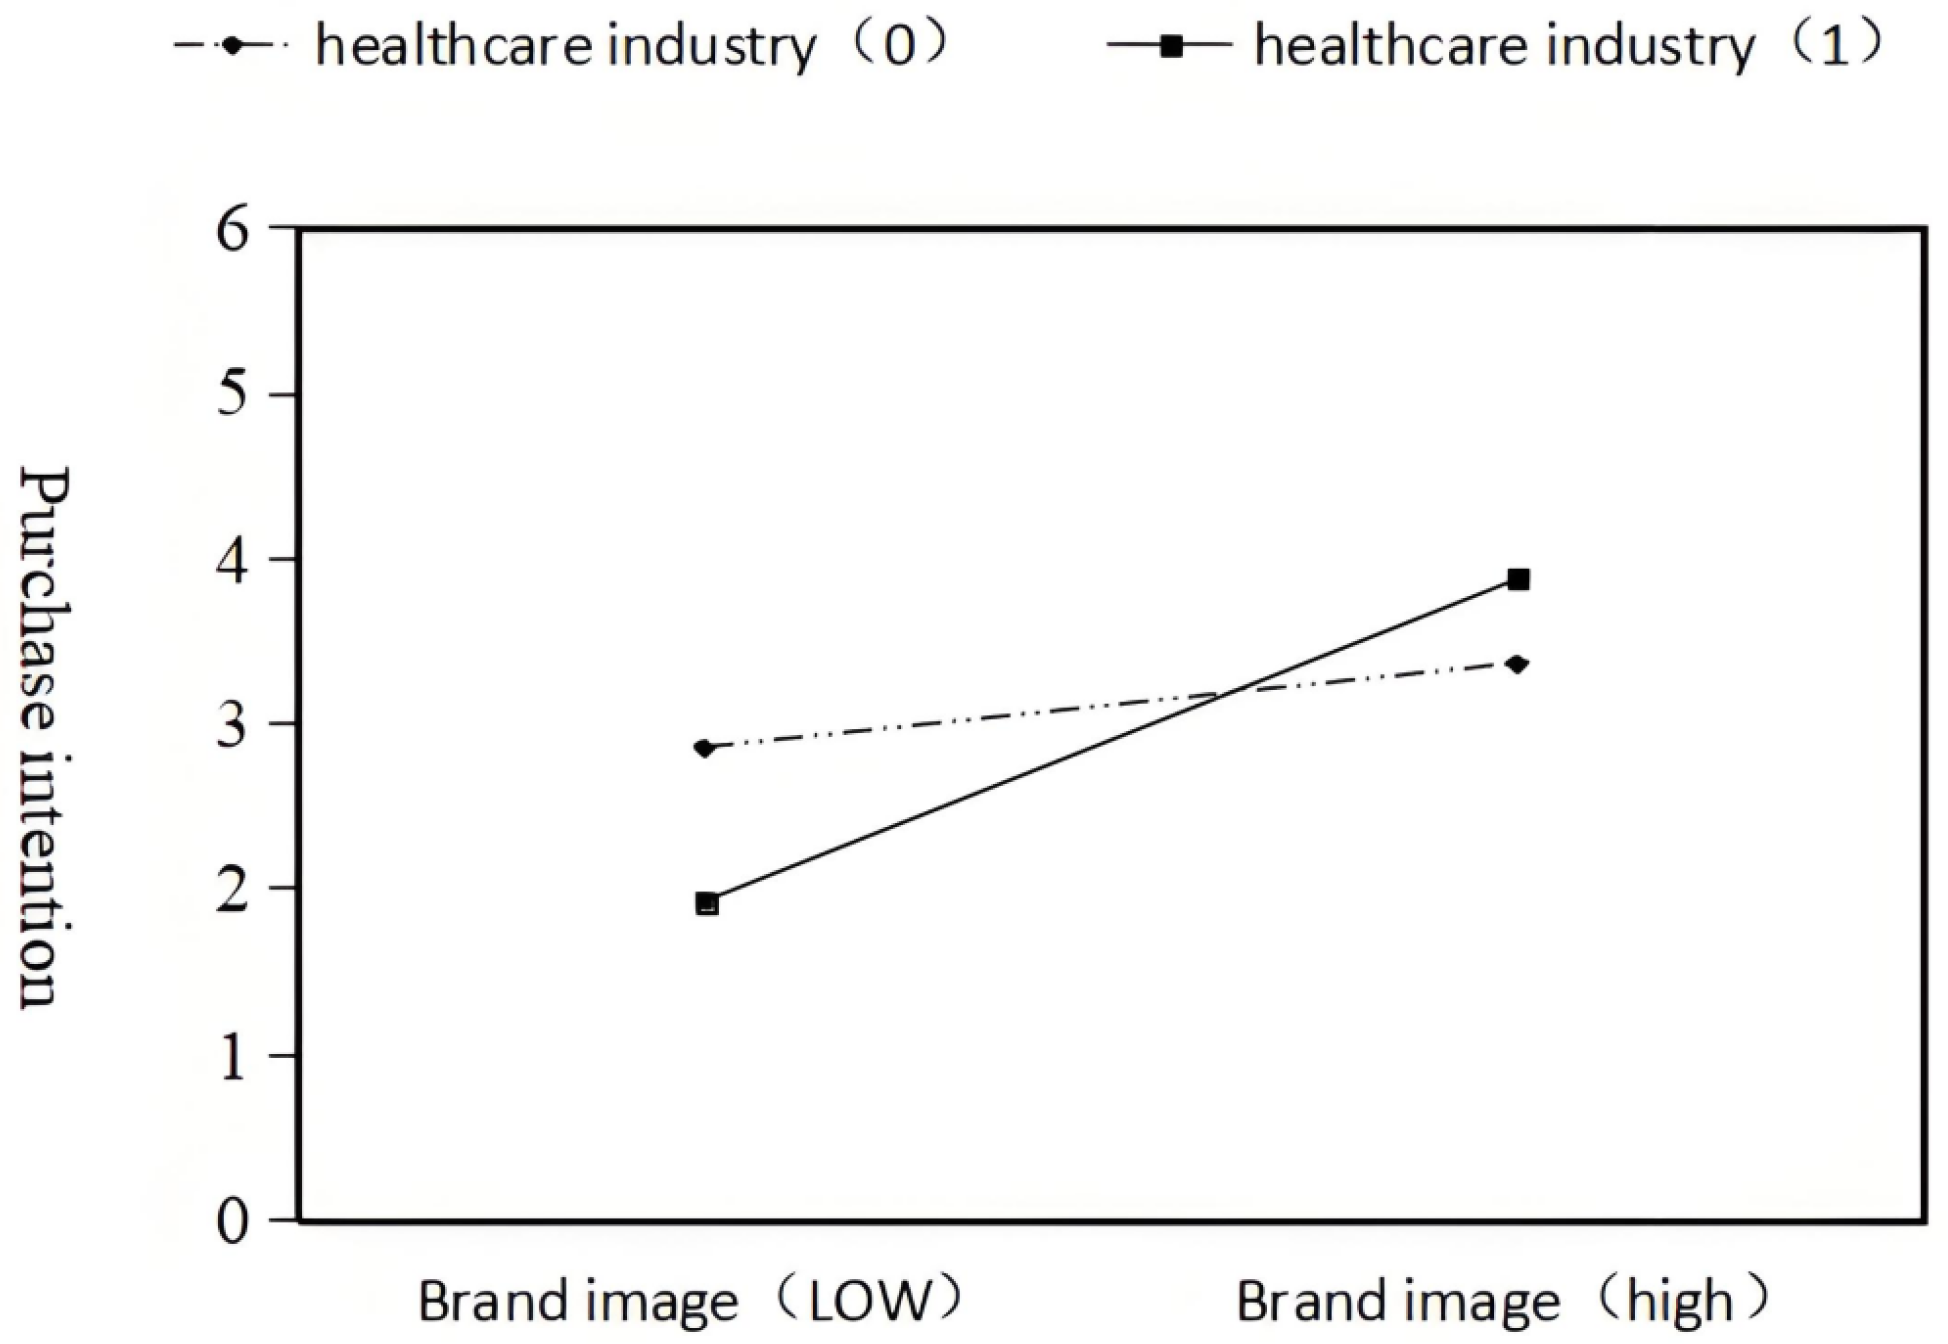
| Brand image × healthcare | – | – | 0.180 * (2.351) |
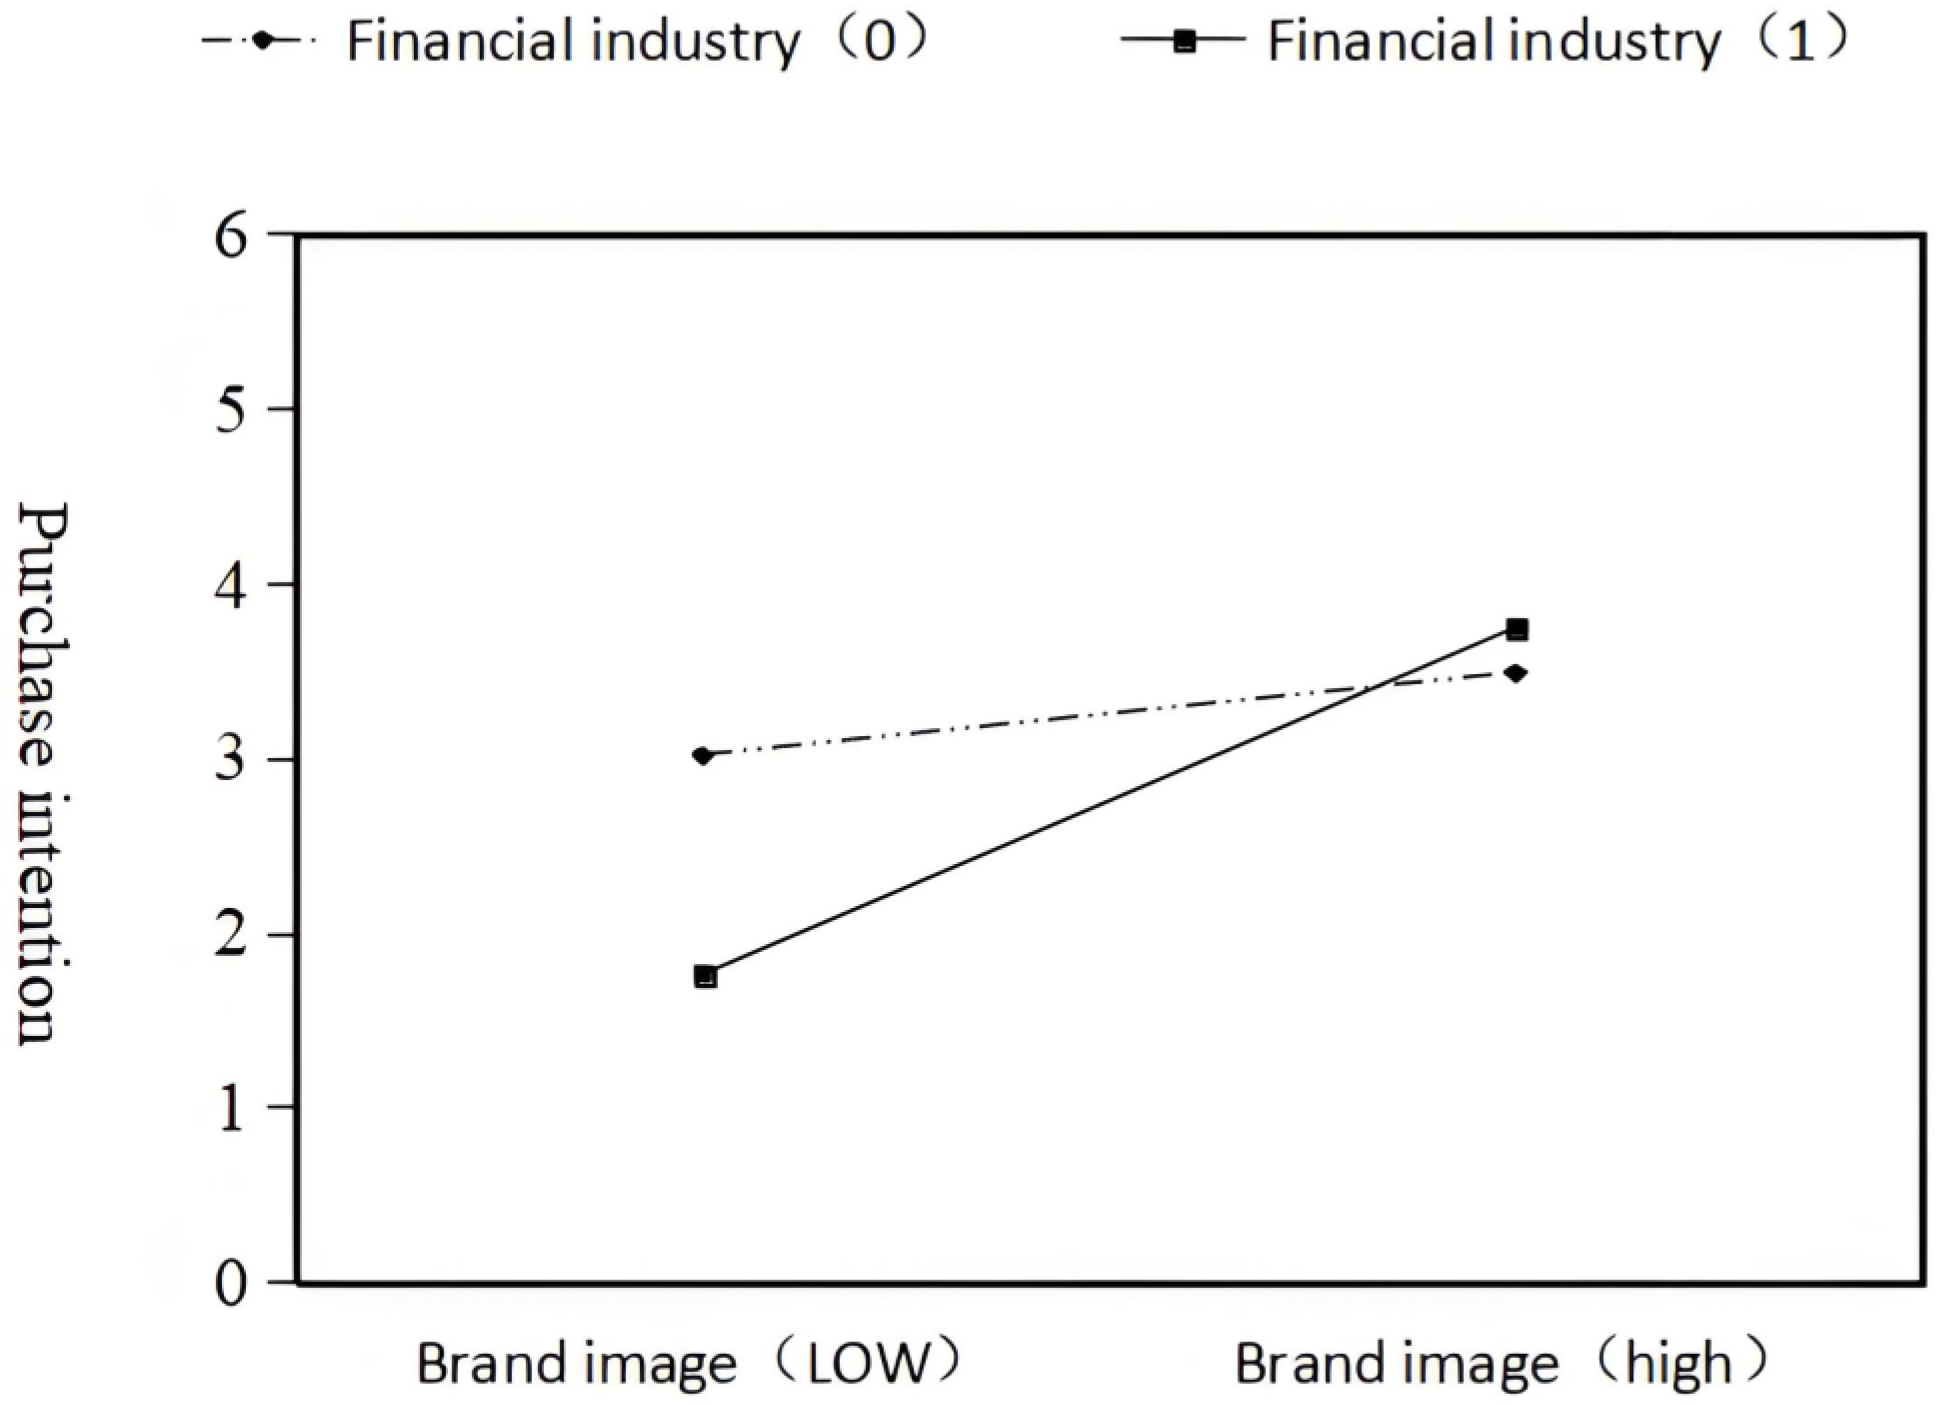
| Brand image × finance | – | – | 0.189 * (2.209) |
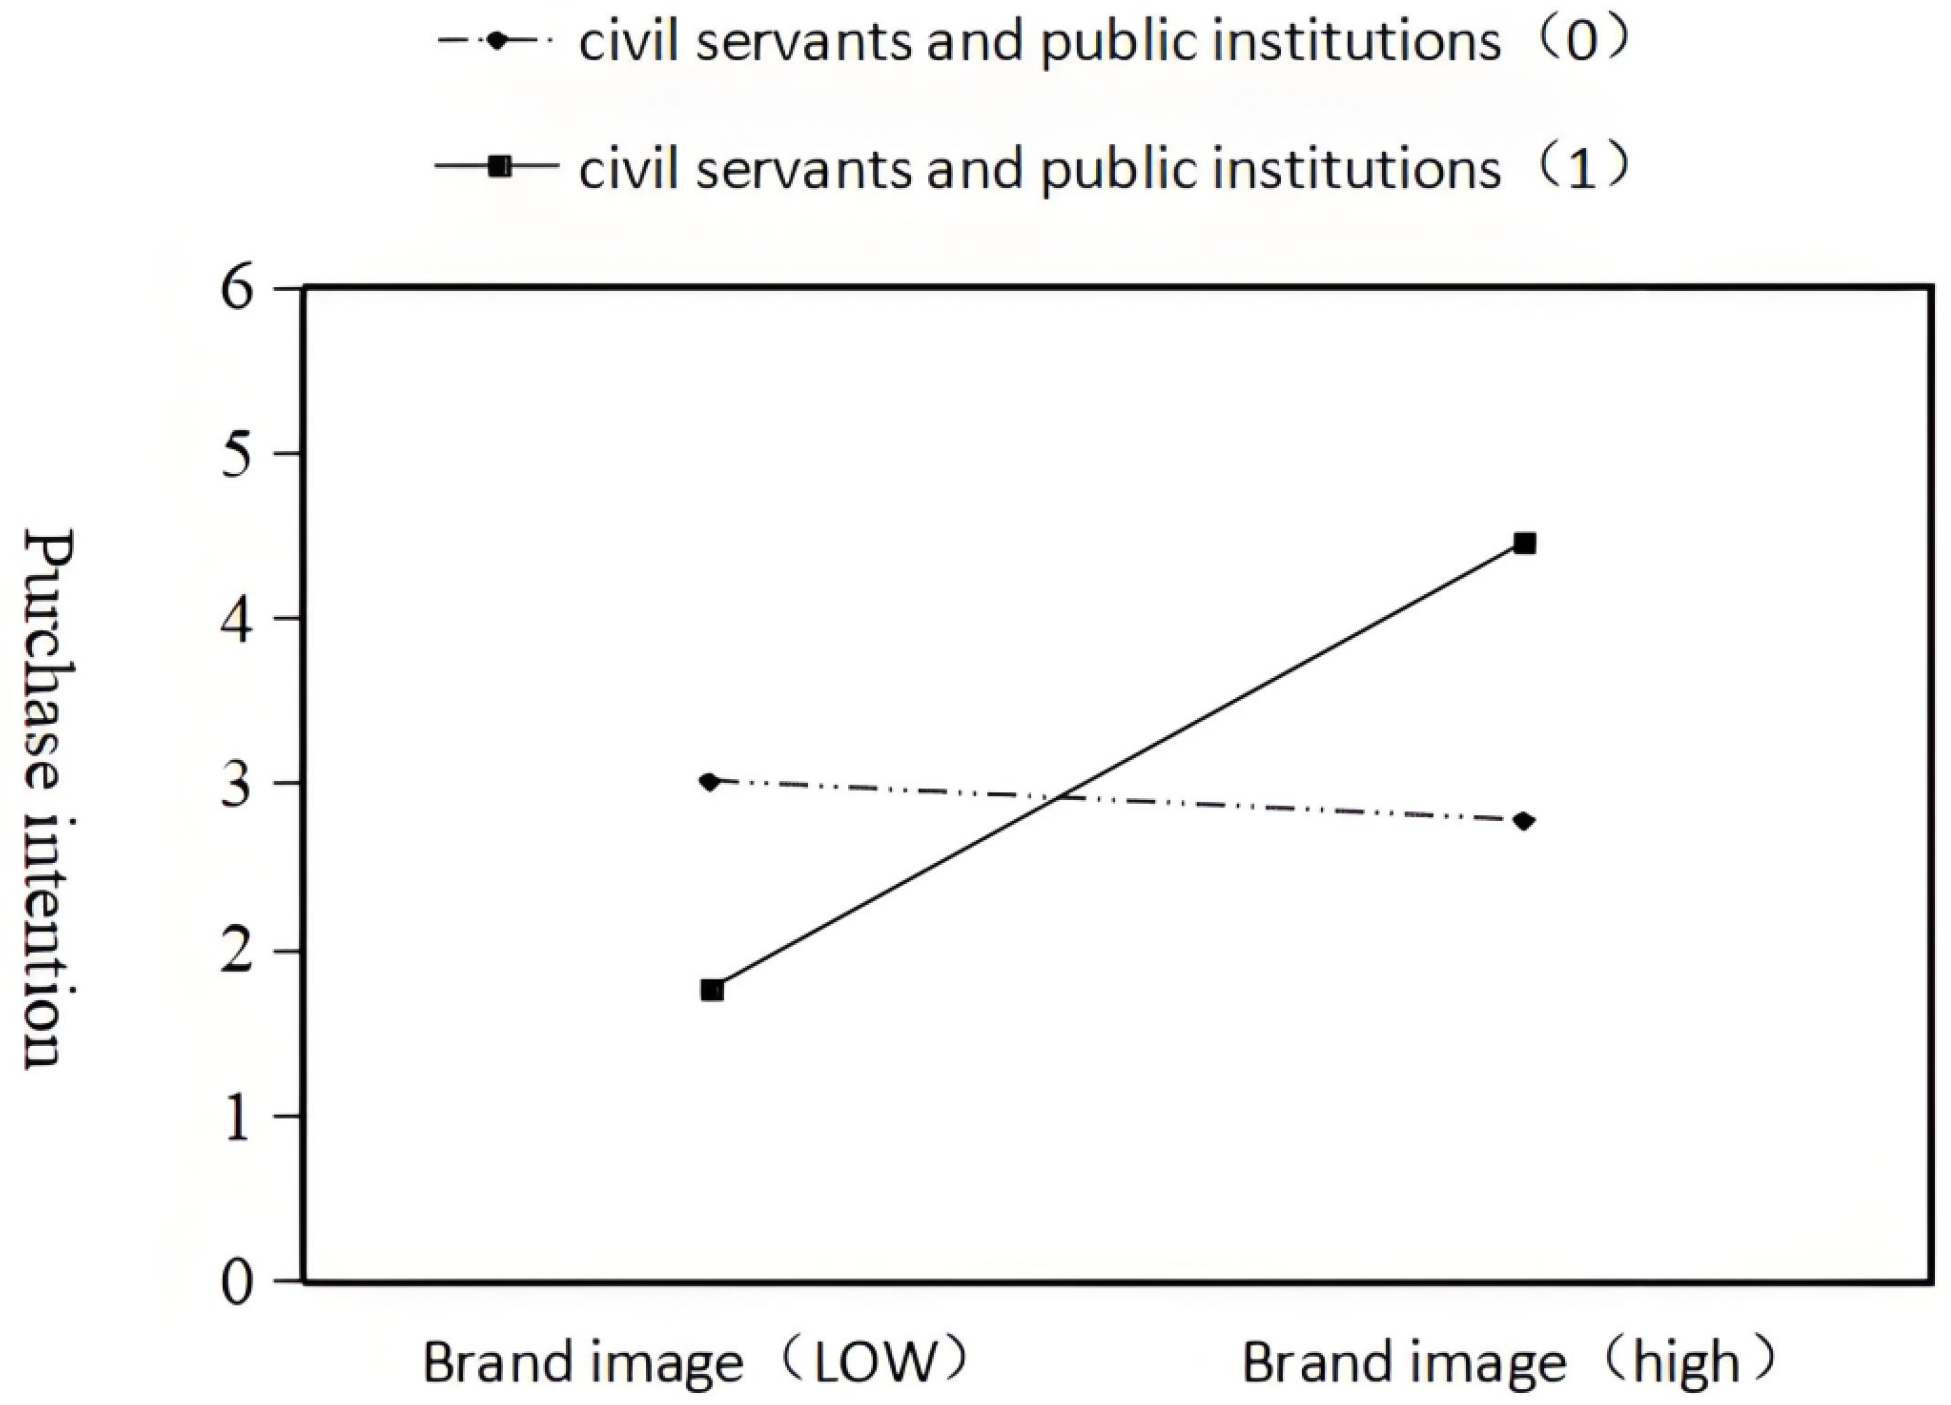
| Brand image × government | – | – | 0.366 ** (3.142) |
| Brand image × construction & Real Estate | – | – | −0.041 (−0.459) |
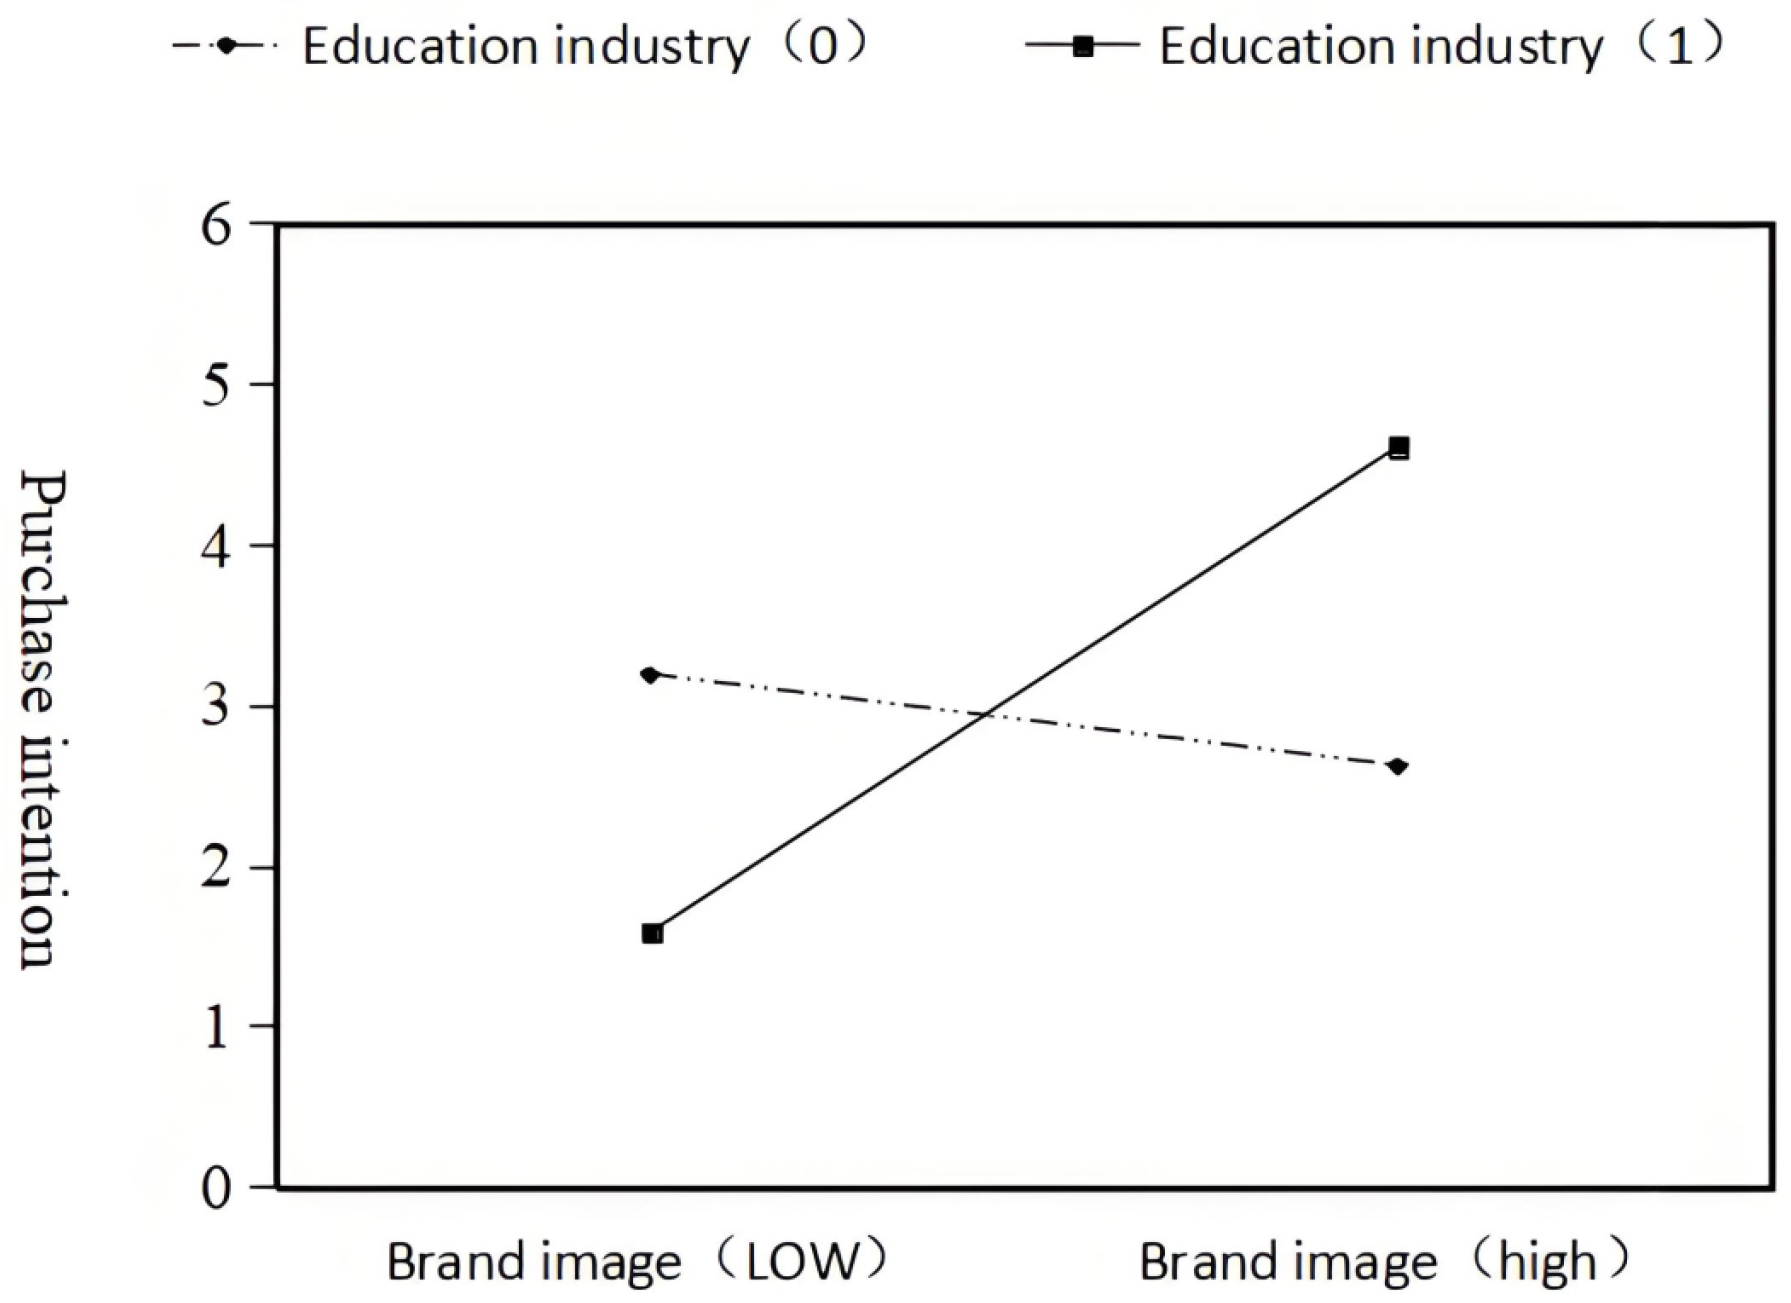
| Brand image × other | – | – | 0.127 (1.023) |
| Sample size | 962 | 962 | 962 |
| 0.134 | 0.147 | 0.184 | |
| Adjusted | 0.133 | 0.141 | 0.172 |
| F value | , | , | , |
| 0.134 | 0.013 | 0.037 | |
| value | , | , | , |
Disclaimer/Publisher’s Note: The statements, opinions and data contained in all publications are solely those of the individual author(s) and contributor(s) and not of MDPI and/or the editor(s). MDPI and/or the editor(s) disclaim responsibility for any injury to people or property resulting from any ideas, methods, instructions or products referred to in the content. |
© 2025 by the authors. Published by MDPI on behalf of the World Electric Vehicle Association. Licensee MDPI, Basel, Switzerland. This article is an open access article distributed under the terms and conditions of the Creative Commons Attribution (CC BY) license (https://creativecommons.org/licenses/by/4.0/).
Share and Cite
Jiang, M.; Zhou, F.; Peng, L.; Wan, D. A Study of the Social Identity of Electric Vehicle Consumers from a Social Constructivism Perspective. World Electr. Veh. J. 2025, 16, 403. https://doi.org/10.3390/wevj16070403
Jiang M, Zhou F, Peng L, Wan D. A Study of the Social Identity of Electric Vehicle Consumers from a Social Constructivism Perspective. World Electric Vehicle Journal. 2025; 16(7):403. https://doi.org/10.3390/wevj16070403
Chicago/Turabian StyleJiang, Meishi, Fei Zhou, Ling Peng, and Dan Wan. 2025. "A Study of the Social Identity of Electric Vehicle Consumers from a Social Constructivism Perspective" World Electric Vehicle Journal 16, no. 7: 403. https://doi.org/10.3390/wevj16070403
APA StyleJiang, M., Zhou, F., Peng, L., & Wan, D. (2025). A Study of the Social Identity of Electric Vehicle Consumers from a Social Constructivism Perspective. World Electric Vehicle Journal, 16(7), 403. https://doi.org/10.3390/wevj16070403