Abstract
The focus of this paper is to seek means of increasing induction motor efficiency to a comparable level to a permanent magnet motor. Harmonic and high-frequency losses increase the rotor core and copper loss, often limiting IM efficiency. The research in this study focuses on reducing rotor core and copper losses for this purpose. An accurate finite element model of a prototype motor is developed. The accuracy of this model in predicting the performance and losses of the prototype motor is verified with experiments over a 32 Hz–125 Hz supply frequency range. The verified model of the motor is used to identify the causes of the rotor core and copper losses of the motor. It is found that the air gap flux density of the motor contains many harmonics, and the slot harmonics are dominant. The distribution of the core loss and the copper loss is investigated on the rotor side. It is discovered that up to 35% of the rotor copper losses and 90% rotor core losses occur in the regions up to 4 mm from the airgap where the harmonics penetrate. To reduce these losses, one solution is to reduce the magnitude of the air gap flux density harmonics. For this purpose, placing a sleeve to cover the slot openings is investigated. The FEA indicates that this measure reduces the harmonic magnitudes and reduces the core and bar losses. However, its effect on efficiency is observed to be limited. This is attributed to the penetration depth of flux density harmonics inside the rotor conductors. To remedy this problem, several FEA-based modifications to the rotor slot shape are investigated to place rotor bars deeper than the harmonic penetration. It is found that placing the bars further away from the rotor surface is very effective. Using a 1 mm sleeve across the stator’s open slots combined with a rotor tapered slot lip positions the bars slightly deeper than the major harmonic penetration depth, making it the optimal solution. This reduces the bar loss by 70% and increases the motor efficiency by 1%. Similar loss reduction is observed over the tested supply frequency range.
1. Introduction
Since the late 20th century, electric propulsion has revolutionized transportation across various sectors, including automobiles, locomotives, airplanes, and buses [1]. The growing popularity of electric vehicles (EVs) and their increasing energy demands have raised significant concerns regarding energy efficiency and cost management. Consequently, there is an urgent need for highly efficient, cost-effective, and reliable machine drives to address these challenges. Two primary machine types dominate traction applications: variable-speed induction motors (IMs) and permanent magnet synchronous motors (PMSMs) [2]. While PMSMs offer higher efficiency, they face notable drawbacks, including the high cost of rare-earth materials and maintenance requirements [3,4]. On the other hand, IMs generally have lower efficiency compared to PMSMs of similar size. However, with advancements in efficiency, IMs presents a compelling alternative for EV applications, balancing performance and cost-effectiveness [5,6].
Improving the efficiency of IMs requires a focus on efficient control strategies and loss reduction methods. A thorough understanding and analysis of the nature of losses are essential to achieve this. Losses in IMs can be broadly categorized into fundamental losses and harmonic losses. Fundamental losses occur at the operational frequency, while harmonic losses, which are part of stray load losses, are generated at higher frequencies. Fundamental losses can be mitigated by using materials with superior properties, whereas harmonic losses can be minimized through improved design methodologies that target specific loss components. Significant research has been dedicated to loss analysis in IMs to enhance efficiency through loss reduction [7,8,9]. Aarniovuori et al. [10] conducted a detailed loss analysis of a 37 kW inverter-driven IM, adhering to standards IEC 60034-2-1 [11] and IEC 60034-2-3 [12]. Zhang et al. [13] investigated the loss characteristics of IMs with rotor skew and analyzed the effects of inter-bar currents.
Through research on loss analysis, high-frequency harmonic losses were identified as a critical factor that causes the efficiency degradation of IMs [14,15]. Dems et al. [16,17] reviewed various methods for improving IM efficiency through loss analysis, emphasizing the importance of reducing harmonic losses to enable operation across a wide frequency range. The authors in [18] quantified stray load losses and harmonic flux density values within the machine core, providing insights into the internal loss mechanisms. Similarly, Ertan et al. [19] investigated high-frequency components in IMs by analyzing harmonic components and their associated losses. Numerous studies have highlighted the stray load losses within the motor core, frequently attributing these to tooth harmonic losses occurring on the surface of the rotor or stator teeth. Gao et al. [20] evaluated stray load losses caused by additional eddy currents in rotor bars and identified further losses in the stator core arising from harmonic losses in rotor conductors.
A significant contributor to stray load losses in induction motors (IMs) is the harmonic loss component of rotor copper losses, primarily caused by large eddy currents induced in the rotor bars [20,21,22]. These eddy currents play a major role in stray load losses, while the impact of harmonics on the end rings is negligible [23]. Carbonieri et al. [24] emphasized the complexity of the rotor side of IMs as a key reason for employing transient finite element analysis (FEA) methods to better understand and mitigate these losses. There is a pressing need for a straightforward approach to minimize these losses across a wide speed range [13,16,17]. Studies by Dorel et al. [5], Rapp [25], Kondo et al. [8], and Zhang et al. [13] have revealed significant copper losses in rotor bars, primarily driven by large eddy currents concentrated at the top of the bars, regardless of rotor skew or inverter power supply. These high-frequency eddy currents not only increase losses but also cause localized heating issues, often referred to as “hot spots”, which can further degrade efficiency and reliability.
Building on the understanding of stray load losses in induction motors (IMs), particularly the rotor copper losses caused by large eddy currents, research on effective reduction methods remains limited. Two primary approaches to mitigating these losses include minimizing harmonic components and modifying the rotor slot shape. Rapp [25] explored the impact of filtering inverter current ripples to reduce large eddy currents in rotor bars, suggesting that design modifications could be a highly effective solution. Agarwal et al. [26] proposed a slot modification technique by introducing a rotor slot opening angle to reduce stray load losses. Similarly, Chang et al. [27] provided guidelines for reducing stray load losses by directing harmonics toward the rotor teeth. Kondo et al. [8] presented a comprehensive design strategy to enhance IM efficiency by altering the rotor slot shape and positioning rotor bars at three different depths to reduce rotor copper losses. However, these approaches often introduce trade-offs, such as increased inverter capacity requirements or higher current levels due to changes in the number of turns or increased slot leakage. These challenges highlight the need for further research to achieve efficient rotor copper loss reduction across a wide range of speeds and frequencies, which is especially critical for traction motors operating under diverse conditions.
The impact of harmonics on IMs is significantly influenced by the design of stator slots, as slotting is a major contributor to harmonic generation. This is particularly evident in traction motors, which typically use preformed windings placed in open stator slots. The open-slot design amplifies the harmonic effects, leading to increased losses. To address this, semi-closed slots are widely recommended in the literature as an effective solution for reducing harmonics and associated losses [27,28]. Ertan et al. [7] investigated the use of semi-closed slots in high-power-density IMs and demonstrated their potential to enhance efficiency by minimizing harmonics while studying the effects of magnetic loading on losses. However, the adoption of semi-closed slots introduces challenges, particularly in the placement of preformed coils, making the manufacturing process more complex. To overcome this limitation, researchers are exploring alternative slot closure strategies that balance loss reduction and automation of the manufacturing process. Takahashi et al. [29] proposed the use of magnetic wedges in IMs with open stator slots, achieving a 32% reduction in harmonic and tooth surface losses. These advancements underscore the critical role of stator slot design in mitigating harmonic impacts and improving overall efficiency, particularly in traction motors operating under demanding conditions.
In conclusion, the literature review underscores the critical need for effective methods to minimize harmonic losses, which contribute to additional losses in rotor conductors and lamination. While some studies have explored strategies such as placing rotor conductors deeper by leaving the top of the slot empty, the placement depth of rotor bars remains a design challenge. Current practices often rely on the designer’s experience, highlighting the need for more systematic guidelines and information on optimal bar placement to mitigate harmonics effectively. To the best of the author’s knowledge, minimizing harmonic losses in rotor bars remains a significant challenge, and the precise placement of rotor bars at specific depths is an ongoing area of research aimed at enhancing the efficiency of induction motors (IMs) for EVs. Table 1 provides a summary of research focused on reducing rotor copper losses, offering insights into the importance of determining the penetration depth for the rotor bar placement to minimize harmonics across a wide frequency range. Improper placement of rotor bars can adversely affect key performance parameters, such as efficiency, power factor, and increased inverter current level. For instance, Kunihiro et al. [30] proposed a 1 MW IM with a modified rotor slot design that positioned rotor bars deeper while mentioning the rotor slot cooling area across the air gap was increased five times, which increased efficiency but slightly decreased the power factor. Similarly, Li et al. [31] attempted to reduce losses by clipping conductors at the top of the slot, which, although reducing certain losses, ultimately compromised overall efficiency. These findings highlight the delicate balance between rotor design and machine performance, emphasizing the need for further innovation in this field.

Table 1.
Research efforts in reducing the harmonic rotor copper loss of IMs.
This paper proposes a novel physical design modification applicable to all existing induction motors (IMs) to reduce stray load losses in rotor bars and enhance overall efficiency. The proposed design incorporates optimally placed rotor bars and an electromagnetic sleeve across the stator bore, reducing the harmonic portion of rotor copper loss by 80% (0.73 kW to 0.15 kW) and rotor core loss by 65% (0.35 kW to 0.12 kW). The primary goal of this research is to close the performance gap between IMs and permanent magnet (PM) motors, providing a cost-effective and robust solution, particularly for EV applications in light railway systems. The proposed loss reduction approach based on a verified FE model of a manufactured prototype motor on which accuracy of the motor performance and loss component prediction is demonstrated using finite element analysis (FEA) over a wide operating speed range. This work can be considered an extension of our previous research, which focused on the estimation of high-frequency losses in motor lamination [19]. While earlier studies primarily examined the effects of harmonics on core loss, the current research delves deeper into harmonic losses in rotor conductors, a topic that has not been extensively studied. It demonstrates that harmonics penetrate rotor conductors in a manner similar to the rotor core, offering valuable insights into mitigating harmonic-induced rotor copper losses and advancing the understanding of loss reduction strategies in variable speed induction motors.
This article is organized as follows: Section 2 provides the validation of finite element analysis based on the experimental results. It also gives the characteristics of the IM under investigation, describing the experimental test setup, the numerical solution approach, and the loss evaluation methodology. Section 3 presents an analysis of the loss distribution results and identifies the harmonic losses for reduction. Section 4 introduces the proposed design changes aimed at reducing rotor core losses and bar losses and discuss the results and evaluates the impact of the proposed methods. Finally, Section 5 concludes the study, offering key insights and outlining directions for future research.
2. Prototype Motor Characteristics and Measurement Setup
A state-of-the-art high-performance inverter-driven traction IM is designed and manufactured in 2021 for the Ankara metro trains. The specifications of the prototype IM are detailed in Table 2. This motor is used to validate the finite element (FE) model of the prototype motor via comparison of measurement and FE analysis results.
Table 2.
Specifications of the manufactured Prototype IM for Ankara metro trains.
Key features of this design include open stator slots, cooling vents both on the stator and rotor sides, H-class insulated distributed stator winding, rotor bars (not skewed), and end rings constructed from copper–chromium–zirconium (CuCrZr) alloy. The core comprises 0.5 mm thick Cogent Steel 50JN-530 lamination. Please note that this design has cooling vents on both the stator and rotor sides.This motor is tested at a supply frequency range of 32 Hz–125 Hz.
A simplified schematic of the measurement test setup is provided in Figure 1, while the actual measurement setup is depicted in Figure 2. Figure 1 shows that a variable frequency drive powers the prototype IM. A digital power analyzer measures the input power, power factor, and voltages, while a dynamometer, including a torque transducer and tachometer, measures the torque and speed. The IM features a compact, robust, totally enclosed design with an external fan and durable iron frame, as shown in Figure 2. The temperature readings are taken by thermocouples placed on the outer frame, the air outlet, and inside the winding using the resistance measurement method. The temperature rise of the test motor was measured via the winding resistance measurement method.
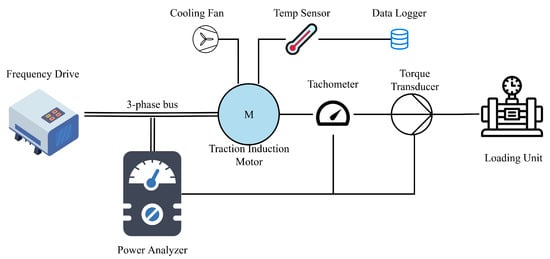
Figure 1.
Measurement test setup configuration.
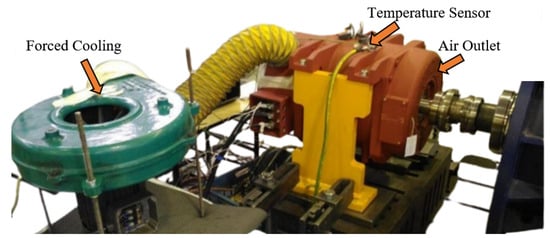
Figure 2.
The experimental test setup.
2.1. Experiments and Measurement Standards
Experiments were conducted on the prototype motor over a frequency range of 32 Hz to 125 Hz to evaluate its performance. Table 3 provides the standards [32,33,34,35] applied during the measurements. The no-load and load test results are performed at the same test frequencies. The no-load test and load test results are given in Appendix A, Table A3, and in Table A1 while the detailed loss segregation is given in Table 4. During the tests, for power measurement, the PWM output of the motor drive was filtered for frequencies up to 75 Hz, and for tests above 75 Hz supply frequency, tests were performed without the sinus filter. The operating temperature of the motor was measured 119 °C at the rated power and load operation. In contrast, at the maximum power operation (180 kW), the operating temperature was measured as 140 °C.
Table 3.
Tests performed on prototype motor according to standards.
Table 4.
Measured and calculated loss distribution from FEA method at rated power 125 kW, rated load 575 Nm.
2.2. Segregation of Losses from Measurements
Performance evaluation of the prototype motor was conducted through loss segregation according to EN 60034-2-1:2015, dividing motor losses into components, namely stator copper loss, core loss, rotor core loss, friction windage loss, and stray load loss. The measured performance parameters such as efficiency, power factor, and stray loss were also obtained from loss segregation. The efficiency of the motor can be calculated in two different ways. Direct efficiency is the ratio of measured output power to input power ratio. Indirect efficiency is calculated as follows:
where is the output power calculated from the input power according to the standard and is the summation of loss components obtained from loss segregation. In this paper, the indirect efficiency method is used in presenting results. Table 4 displays the measurement results at the rated power of the prototype motor while driven at the rated voltage and frequency. The measured results show an efficiency of 93.5% for the prototype motor. The detailed loss segregation-based evaluation over a wide frequency range is given in Appendix A, Table A1.
To study what measures can be taken to reduce the copper and core losses, it is essential to have a model which is capable of predicting motor performance and losses accurately. In Section 2.3, the FEA model of the prototype motor developed for this purpose is described and its accuracy is illustrated.
2.3. Numerical Solution of the Prototype Motor
This section outlines the FEA methodology, covering geometry meshing, boundary conditions, and post-processing steps. To predict the losses of a motor, a transient time-stepped 3D solution is needed. However, a 3D solution is very time-consuming; therefore, a 2D time-stepped FEA approach is preferred. The 3D effects of end rings and windings are taken into account as proposed by Ansys Maxwell. Figure 3a illustrates the 2D geometry used for the FEA, which includes the frame, stator, and rotor cooling vents. The FEA utilizes the standard coupled circuit approach, as detailed by Smith et al. [36], effectively capturing the influence of saturation, deeper rotor bars, and harmonic effects. The coupled circuit equations are further explained in [37]. In modeling the prototype motor, pole pair symmetry is employed to ensure the rotor slot number remains an integer. Zero vector potential is assigned on the outer edge of the frame to define the out-of-bound region. The skin effect in rotor bars and magnetic saturation in core lamination are considered while the skin effect on the stator conductors and inter-bar currents on the rotor side are neglected. The voltage, operating temperature, and rotor speed are adjusted in accordance with the test conditions simulated. With a convergence criterion of , Ansys® terminates the solution upon reaching steady state. The average FEA solution time is about 90 min when the motor is simulated under load. An initial mesh is refined by selectively assigning finer meshes to key areas. To ensure accurate FEA simulations, careful mesh refinement is crucial. This study employs two common mesh refinements: one based on skin depth to account for surface losses and another based on length to define mesh size. The fine details of the meshes near the air gap and teeth area are visible in Figure 3b, ensuring that the calculated results accurately align with the measured results. The B-H curve of the material is given in Figure A1 and material characteristics are given in Appendix A, Table A5. The Bertotti’s core loss Equation (2) in [38] serves as the basis for the core loss calculation using the method developed by Lin et al. [39] for 2D and 3D numerical solutions.
where is the total core loss which includes the contribution from hysteresis, classical eddy current loss, and excess loss due to non-uniform magnetic field distribution at fundamental frequency. is the hysteresis loss coefficient, f is the supply frequency, B is peak magnetic flux density within the core material, is classic eddy current loss coefficient, and is excess loss coefficient found from the lamination data. Loss coefficients are given in Appendix A, Table A5.
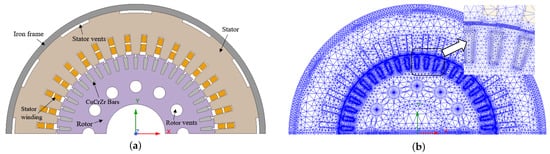
Figure 3.
(a) Two-dimensional geometry of the prototype motor for the FEA method. (b) Refined mesh of the 2D geometry with fine details on the critical areas.
Calculation of Loss Components
Once the problem is solved, fundamental frequency core loss, stator copper loss, and rotor copper loss are easy to calculate. Core loss and rotor copper loss including harmonics can be calculated from non-model objects which is discussed in Section 3. The FEA total loss includes the summation of copper and core losses. To determine indirect efficiency, the friction windage loss, obtained through experimental testing, is added to the FEA total loss .
where the is the core loss, is the rotor copper loss, is the friction windage loss measured from the experimental testing for the specific frequency, and is the standard three-phase stator copper loss where I is the software-derived stator current and is the stator phase resistance at the operating temperature. The total input power can be calculated as
where is the output power calculated from product of torque and angular speed. Thus, indirect efficiency can be calculated as
The power factor can now be calculated from the standard analytical expression. The power factor is calculated from the input power and the software derived stator phase current.
where and are phase voltage and stator phase current, respectively.
Table 4 provides a comparative analysis of IEC-based loss segregation with performance evaluation and FEA-based performance evaluation, including the harmonic loss, under equivalent loading conditions. The rated efficiency of the prototype motor was measured at 93.5% and calculated as 93.67% from FE solution. This is an excellent prediction accuracy. However, looking into other parameters, such as current and power factor and the breakdown of motor losses, it is necessary to determine whether the model created is acceptably accurate. The detailed FEA loss evaluation over the tested frequency range is given in Appendix A, Table A2.
Figure 4a presents the percentage error between the measured and calculated losses for the prototype motor over a wide frequency range of 32 Hz–125 Hz. As can be observed from Figure 4a, the prediction accuracy for all the variables considered is less than 5% and is very good. Please note that the error in total loss calculation is estimated by considering the stray loss component. Figure 4b provides valuable insights into the accuracy of the FEA model by presenting the error between measured and computed motor performance parameters such as stator current, power factor, and efficiency levels. Please note that FEA model does not take into account friction windage loss in current calculation. However, friction windage loss is small and do not affect current prediction accuracy very much as seen in Table 4. However, Figure 4b shows that the percentage error over a wide speed range is less than 1.2% in the prediction of the performance of the prototype motor. The results indicate that the FEA model developed is very good and predicts motor behavior well in the frequency range.
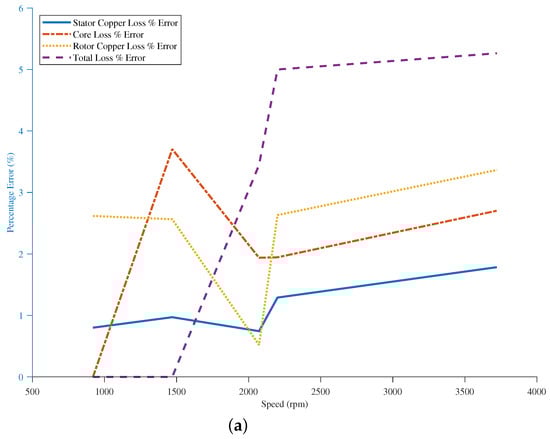
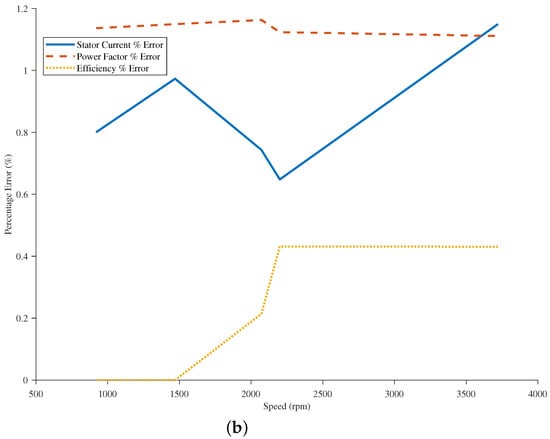
Figure 4.
(a) Percentage error in estimated loss components of prototype motor at rated load. (b) Percentage error in estimated current, power factor, and efficiency of prototype motor at rated load.
Please note that the loss calculated by the software is the fundamental frequency loss component. Therefore, the post-processing approach proposed by Ansys® Maxwell is employed to estimate the core and rotor copper losses including the harmonic losses through non-model objects. Section 3 describes the way harmonic losses are calculated in this study.
3. Harmonic Loss Calculation of the Prototype Motor
In Ansys® Maxwell, to calculate the rotor bar loss and core loss distribution, including the harmonic losses, non-model objects must be defined in the areas of the structure where these losses are significant. These non-model objects are virtual entities that do not contribute to the electromagnetic solution and serve as post-processing tools to extract localized loss distribution [40]. For this purpose, the field solution data are saved over multiple time steps to perform post-processing. This loss distribution method is a standard method where built-in formulas (core and ohmic loss) in the Ansys® field calculator can find the losses on the non-model objects.
Multiple circular non-model objects are arranged in stator teeth, rotor teeth, rotor bar, and back core area of the motor to analyze the overall distribution of losses during post-processing as shown in Figure 5. In this study, non-model objects on the rotor side are placed so that the contribution of a particular set of harmonic loss is estimated. This is possible because harmonics penetrate the rotor teeth or bar only to a certain depth determined by their frequency. This issue is discussed in Section 3.1. Based on the harmonic analysis and penetration depth of harmonics of the air gap flux density distribution, four non-model objects are placed on the rotor teeth. The first non-model object is placed on the top 4 mm teeth section, second in the following 4 mm–6 mm, third in the succeeding 6 mm–9 mm, and a final one for the rest of the teeth. With this approach, the total loss occurring in the rotor teeth can be calculated by summing up the losses found for each segment. Since each segment is chosen considering the penetration depth of harmonics, an idea of the contribution of specific harmonics to the total teeth loss can be obtained.
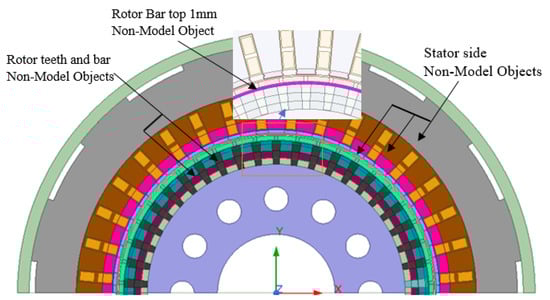
Figure 5.
Circular non-modeled objects placement to capture the harmonic core and rotor bar losses.
A different approach is adopted for calculating the harmonic loss in the rotor bars since the distribution of harmonic loss along the depth of a rotor bar is important. Non-model objects for the bars are placed at the top 1 mm bar section and 1 mm–2 mm top section for surface loss analysis. The rest of the bar is divided into 6 mm sections. This loss distribution can be seen in Table 4. The non-modeled objects near the core and rotor conductors’ surface are arranged according to the harmonics’ penetration depth to analyze the losses due to harmonics, which is further explained after introducing the penetration depth in Section 3.1. The non-model objects and the loss calculation method are further explained in the Ansys® Maxwell help manual [40].
3.1. Air Gap Harmonics and Penetration Depth
The magnetic field distribution in the air gap should ideally be close to a sinusoidal wave for smooth motor operation. However, saturation, winding distribution, and slotting distort the magnetic field, leading to harmonics. These harmonics contribute to stray losses, noise, and vibrations within the motor core and conductors. The flux density distribution of the prototype motor in the air gap while running at rated load (125 kW, 70 Hz) is presented in Figure 6.
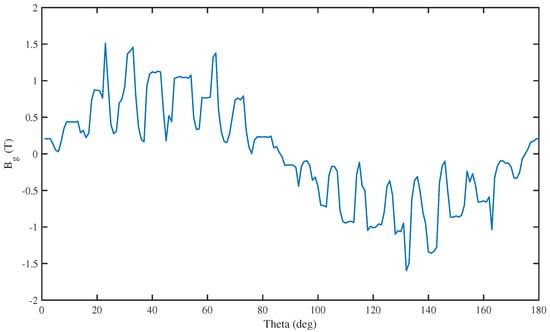
Figure 6.
Magnetic field distribution in the air gap under a pole pair at 125 kW, 70 Hz, rated load operation.
Harmonics in the air gap cause an additional loss on the rotor core surface and rotor bars. This is because these harmonics create a wave in the air gap, creating eddy currents in the magnetic material and copper bars. Harmonic flux, except the fundamental component of flux, can not penetrate deep into the core as discussed in [19,41]. Therefore, it can be assumed that the contribution of a particular harmonic to core or copper loss occurs up to their penetration depth . In this study, the penetration depth of a harmonic is calculated based on (7).
where is the penetration depth of the ith harmonic, is source frequency, and is the frequency of the ith harmonic. After obtaining the harmonics, the penetration depth of the harmonics was calculated to identify the area to arrange the non-model objects. Penetration depth calculation, serving as an analytical indicator, highlighted the areas susceptible to elevated losses. Table 5 displays the FFT analysis result of the air gap flux density of the prototype motor obtained from FE analysis at the rated frequency operation. The contribution of a specific harmonic to eddy current loss is roughly proportional to the square of the frequency of the harmonic and the square of its flux density magnitude as given in (2). To identify which harmonics are significant, the product of each harmonic is also presented in Table 5 as . This factor is called the impact factor of the harmonic in this study, and it indicates how significant a particular harmonic is in creating additional core or copper loss. A higher number of indicates a significant loss from that harmonic. Harmonics of the form are associated with MMF harmonics, where m is an integer. The slotting harmonics appear in the orders of and , where q and r represent the number of stator and rotor slots per pole, respectively [27]. For the case considered, the most significant harmonics affecting the motor’s losses arise from slotting, representing 17th and 19th harmonics penetrating up to 4 mm on the rotor side. Following this finding, the first non-model object for rotor surface core loss and rotor bar loss calculation is chosen as a section covering the top 4 mm of the rotor teeth and the top 1 mm of the bar (4 mm from the airgap), respectively.
Table 5.
Air gap flux density level of the prototype motor and impact factor of harmonics at 125 kW, 70 Hz, rated load condition.
3.2. Loss Distribution Analysis
For clarity, a detailed analysis of the loss distribution on the rotor side of the prototype motor is provided here at rated power from Table 4 and at maximum power. This analysis is possible due to the placement of non-model objects on the motor geometry to extract localized core and rotor bar loss data, as discussed in Section 3. The results show the losses in these areas as the non-model objects were placed at the top 4 mm, 6 mm, and 9 mm regions on rotor teeth. Table 6 highlights that 90% of the rotor core loss is located near the surface of the rotor teeth due to harmonics and only 5% of rotor core losses are outside the penetration depth of 4 mm which signifies the importance of the arrangement of the non-model objects. Please note that the rotor bar harmonic loss is much higher than the harmonic loss in the teeth material. The maximum possible reduction in rotor copper loss is to reduce it to the fundamental frequency loss level. Therefore, if this can be achieved, the maximum efficiency expectation is 94.4% due to eliminating harmonic loss on the rotor side core and copper bars. Table 6 shows that 35% of the rotor bar losses occur at the top 1 mm of the bar, while it is noticeable that 5% of the bar loss occurs in the top 1 mm–2 mm of the rotor bar. Most of this loss is due to the air gap flux density harmonics penetrating the rotor bar. Figure 7 highlights the large concentration of eddy currents and the higher ohmic loss near the surface of the rotor bar. It can be seen that the current density at the top of the bar is about 40 A/m while the rest of the bar is at 8 A/m. The presence of rotor slot harmonics on the stator side of an IM is less significant. Due to the distributed winding configuration, it only contributes to flux pulsations in the stator tooth.
Table 6.
Rotor core loss and bar loss distribution of the prototype motor at rated output at 70 Hz, 575 Nm load and maximum output power 75 Hz, 775 Nm load.
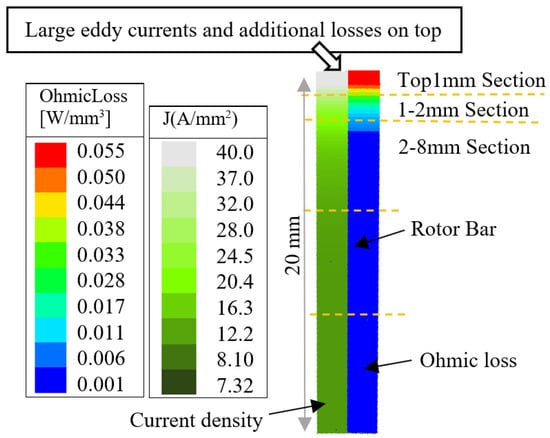
Figure 7.
Current density and the copper loss in the rotor bars of the prototype motor at 125 kw, 70 Hz, rated load.
Losses stemming from harmonics can be reduced by reducing the harmonic magnitude or taking measures to reduce the eddy current magnitude they create. This paper focuses on reducing harmonic losses and increasing motor efficiency. Please note that decreasing the losses also means the operating power of the motor can be increased since the cooling system is designed to remove heat energy without harmonic loss reduction. Thus, the power density of a motor can be increased. Alternatively, one can keep the rated power the same and operate the motor at a higher efficiency.
4. Proposed Design Changes to Reduce Harmonic Losses
4.1. Design Improvement Process
The investigation in Section 3.2 illustrates that the core and copper losses due to harmonics significantly contribute to the total losses of the motor. Two options to reduce harmonic losses are investigated here. The first option is an attempt to reduce the harmonics by placing an electromagnetic sleeve across the open stator slots, reducing both the surface loss on the rotor side and the losses in the rotor bars due to harmonics. The second option includes the sleeve and places the rotor bars deeper than the penetration depth of significant harmonic with the highest impact factor, reducing the copper losses in the bars. In the FE solution performed for this purpose, the boundary conditions, the materials, and the simulation criteria are the same as the prototype model. Please note that placing the rotor bars away from the rotor surface and leaving the slot top empty is mentioned in the literature without giving any bar placement detail [8,30,31].
4.2. Reducing Magnitude of Harmonics Using Electromagnetic Sleeve
Traction motors in general and the prototype motor have open slots since they employ preformed stator winding coils placed into the stator slots via the slot opening. The slot openings are the main source of the harmonics in the air gap, as discussed in Section 3.1, and slot harmonics are dominant, as indicated by their loss impact factor. Semi-closed slots significantly reduce the harmonics; however, due to performed coil insertion, this solution does not apply to the present problem. In the study here, inserting a magnetic sleeve to cover the slot openings is proposed. To keep the stator inner diameter constant, the stator lips are reduced as much as the thickness of the sleeve. This sleeve is assumed to be made from the same core material. To find out the optimal thickness of the sleeve, FEA analysis of a motor is performed with the same geometry and the same rotor structure and stator winding as the prototype motor but with a sleeve, as shown in Figure 8. Three cases are investigated where the sleeve thickness is changed from 0.5 mm to 1.5 mm in 0.5 mm steps (thickness of the lamination material). The boundary conditions of these solutions and the convergence criteria are the same as those of the prototype model and the materials. The variation of the core loss and the copper loss of the three cases are presented in Table 7. The air gap harmonics, core loss, rotor copper loss, sleeve loss, and efficiency are presented for each sleeve thickness.
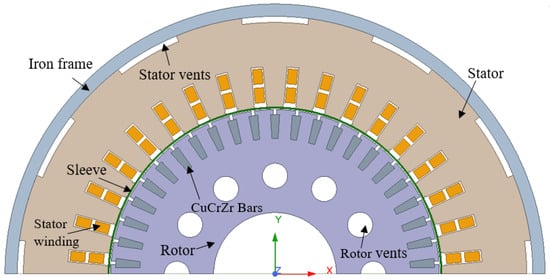
Figure 8.
Prototype motor with a sleeve across the stator bore to close the stator open slots.
Table 7.
Effect of sleeve thickness on the on the magnitude of harmonics and loss components of the prototype motor at rated power 125 kW, 70 Hz and rated load condition.
From Table 7, a 1 mm sleeve appears to be optimal. This sleeve reduces the 17th harmonic peak flux density by 40% and reduces the the eddy current loss impact factor by 65% (111,000 to 40,000). However, the latter is not shown due to space constraints. The reduction in harmonic content also decreases the rotor surface core loss by 66%. However, the rotor core loss is far less significant than the rotor bar loss. Please note that the sleeve loss is also calculated by defining it as a non-model object. It must be noted that although the rotor core loss decreases, the sleeve loss almost cancels the benefit. The rotor copper loss decreases with 1 mm sleeve by about 220 W, which is significant. The loss in the top 1 mm of the rotor bars shows a substantial decrease of 55% with increasing sleeve thickness, which is a key contributor to the decrease in rotor copper loss. However, the effect of employing the sleeve on total rotor copper loss is less pronounced, achieving only a 10% reduction. As discussed in Section 3.2, the maximum achievable efficiency is 94.4% without any harmonic loss on the rotor side. By placing a 1 mm sleeve, a value very close to this is achieved, 94%. This highlights the need for further optimization of the rotor slot design and placement of the bars in the slot so that the rotor bar loss can be further decreased.
4.3. Rotor Bar Placement Method
This section investigates the reduction in rotor bar copper loss by placing the bars deeper than the penetration depth of harmonics and the effect of shaping the rotor slot opening. In this study, the bar area is kept the same during all the modifications to ensure that the motor’s steady-state speed remains constant at the original value and that the fundamental copper loss does not change. Table 6 displays how the copper loss due to harmonics is distributed along the bar’s depth. It can be noticed from this table that 35% of the bar copper loss occurs in the top 1 mm and 66% in the first 8 mm from the rotor surface. Please note that the rotor bar of the prototype motor is placed at 3.7 mm below the rotor surface, as shown in Figure 9a. From these observations, it can be deduced that placing the rotor bar 6 mm below the surface could reduce the total bar loss by 40%. This is because the penetration of significant air gap harmonics can be avoided in this manner. As seen from Table 5, all significant harmonics are those greater than 11th harmonic frequency, and 6 mm depth from the rotor surface is their maximum penetration depth.
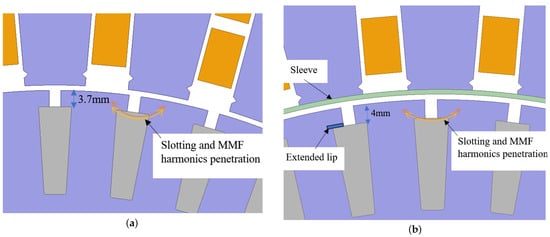
Figure 9.
(a) Prototype motor; rotor bar placed at 3.7 mm depth. (b) Extended lip design; bar placed at 4 mm deep from surface to avoid the 17th harmonic.
Given these findings, three modifications of the slot design are investigated while keeping a 1 mm sleeve over the stator slot openings. In the first case, the rotor teeth lip thickness is increased to 4 mm from the original 3.7 mm to achieve deeper rotor bar placement as shown in Figure 9b. The second case employs a tapered slot lip to position rotor bars deeper at 4.4 mm, as seen in Figure 10a. This tapered slot lip design offers several advantages: it enabls deeper placement of the rotor bars, provides structural support to the bars, and can divert harmonics from the slot area to the teeth region. The guidelines of Agarwal [26] and Chang [27] inspired this improved design to mitigate and redirect harmonics. Finally, the third case is the empty top slot design illustrated in Figure 10b. In this case, the thickness of the lip is similar to prototype motor. However, the rotor bar is placed 6 mm away from the rotor surface by leaving a 2 mm space assumed to be filled by a non-magnetic wedge.
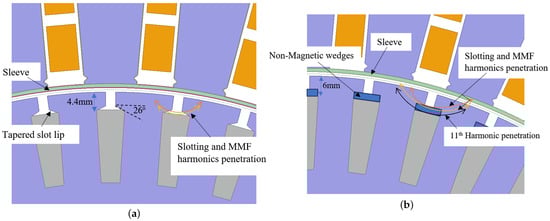
Figure 10.
(a) Tapered slot lip design; bar placed at 4.4 mm depth to avoid 17th and higher harmonics. (b) Empty top slot design; bar placed at 6 mm avoiding 11th and higher harmonics.
Evaluation of the Slot Shaping Research
The slot shaping design strategies discussed in Section 4.3 are evaluated in FEA using the verified motor model. The results of this study at the rated frequency and power are presented in Table 8. This table presents the percentage of the losses along the depth of rotor bars to the total bar loss of the prototype motor. This table indicates that all of the proposed slot design modifications result in a significant reduction in rotor copper loss. It is noticeable that the empty top slot design achieves the same level of loss reduction as the tapered slot lip design; however, it also produces a 1% increase in stator current. The extended lip design exhibits slightly higher surface losses, resulting in lower efficiency than the tapered slot lip design. Please note that the estimated rotor copper loss for all designs varies within a 3% margin. The tapered slot lip design promises higher efficiency than the other options. The detailed loss evaluation of the design changes is in Appendix A, Table A4.
Table 8.
Rotor bar loss distribution with performance parameters for the design changes compared to the prototype motor in FEA at 70 Hz, 125 kW, rated load.
4.4. Tapered Slot Lip Design Performance and Rotor Losses over the Speed Range
A traction motor operates in a wide speed range. Here, the tapered slot lip design is studied to determine whether this design effectively reduces the rotor bar loss over the 32 Hz–125 Hz supply frequency range. Figure 11 presents the comparison of the total rotor copper loss components of the prototype motor and the tapered slot lip design. The top graph in Figure 11a illustrates that the estimated copper loss in the top 1 mm of the rotor bar is drastically reduced for all operating frequencies. The remaining bar copper loss is attributed almost entirely to the fundamental frequency copper loss. The rotor bar loss in Figure 11b indicates the harmonic loss reduction on the top of the bar is about 30% over the frequency range. Figure 11c displays the total rotor copper loss, including the end ring copper loss. Table 9 compares the performance of the prototype motor with the tapered lip motor design with a sleeve. From this table, it can be observed that the total core and copper loss is reduced by 0.8 kW. This reduced loss is due to eliminating air gap harmonic loss in the core and the rotor bars. As a result, the motor current virtually remains unchanged, the power factor is increased, and the motor’s efficiency rises almost to the predicted limit at 94.3%. The top 1 mm rotor bar loss is reduced by about 72% compared to the prototype motor (0.7 kW to 0.2 kW), while the harmonic portion of the total rotor copper loss is reduced by 80% (0.75 kW to 0.15 kW).
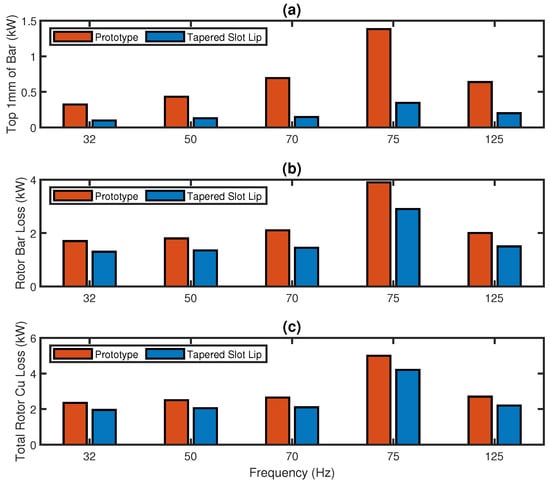
Figure 11.
Rotor copper loss components of the prototype and tapered slot lip design over 32 Hz–125 Hz frequency range. (a) Bar loss for the top 1mm of bar, (b) Total rotor bar loss, (c) Total rotor copper loss.
Table 9.
Comparison of the FEA based performance parameters of the prototype motor and tapered slot lip design, 125 kW, 70 Hz, and rated load operation.
5. Conclusions
This research focuses on reducing the rotor side harmonic losses of a traction induction motor and increasing its efficiency to a comparable level to a permanent magnet motor. This paper concentrates on reducing the rotor core and copper loss component of the total loss. For this purpose, an FEA model of a prototype motor is developed, and its accuracy is verified by experiments. This model is then used to identify the distribution of the losses in the rotor core and rotor bars. Analysis of the air gap harmonics of the prototype motor indicate that the dominant harmonics are due to stator slotting. It is known that the penetration depth of harmonics to the core and rotor bars depends on the harmonic frequency. When the distribution of the core losses on the rotor side is studied, it is observed that the loss in the rotor teeth and bars concentrates near the surface of the rotor in the region where the air gap harmonics penetrate. It is discovered that up to 35% of the rotor copper losses and 90% rotor core losses occur in the regions up to 4 mm from the airgap where the harmonics penetrate.
To reduce harmonic losses on the rotor side, placing a magnetic sleeve on the stator bore to reduce air gap harmonic magnitude is investigated. It is found that 1 mm sleeve thickness is optimal and reduces both the core loss and bar loss. However, a detailed investigation indicates that the rotor bar losses are reduced only by about 10%, and a significant portion of the rotor copper loss occurs at the top portion of the bar and is attributed to the air gap harmonics. To reduce the rotor bar harmonic losses, modification of the shape of the rotor slot and placing the rotor bars deeper than the penetration depth of the significant harmonics are investigated. Three cases are studied where the stator lip thickness is increased to place the rotor bars deeper, stator lips are tapered to place the bars deeper, and finally, the top of the slot is empty to place the bars deeper. All of these measures reduce the harmonics. However, tapered slot lips are easier to manufacture and keep the bars in place. The effect of the proposed measures is investigated over a wide speed range, and similar findings at rated frequency are observed.
In short, for the prototype motor, the proposed measures reduce the rotor bar losses by 30% and total rotor copper losses by 20% according to simulation results. The combined FEA here performed indicates that to design a higher efficiency induction motor; the rotor slot shaping must be made to place the bars deeper than the penetration depth of the air gap harmonics. A sleeve over the stator slot openings helps reduce the harmonic magnitude in the air gap flux density. However, the rotor core loss due to the harmonics is only about 15% of the rotor copper loss, and using a sleeve is not likely cost-effective. In any case, the proposed measures can improve the efficiency of the prototype motor by 1%, and similar improvement can be obtained for any IM. This last result evidently requires further investigation on a test bench. The results hold significance in minimizing the harmonic losses, increasing the efficiency level, and making rotor copper losses comparable to rotor copper loss at fundamental frequency.
Rotor copper loss of an IM can be reduced further by using lower resistivity materials for the rotor bars, reducing bar current (by changing stator winding turns or changing rotor bar number), or increasing bar area. Nearly 30% of the total motor loss is stator core loss for the prototype motor. Reducing this loss is also possible by using better core loss materials or altering the outer diameter–bore diameter ratio. These issues are currently being investigated to manufacture the next prototype.
Author Contributions
Conceptualization, M.S.S. and H.B.E.; methodology, M.S.S., H.B.E. and M.U.K.; software, M.S.S.; validation, M.S.S., H.B.E. and M.S.A.; formal analysis, M.S.S. and H.B.E.; investigation, M.S.S., H.B.E. and M.U.K.; writing—original draft preparation, M.S.S., H.B.E., M.S.A. and M.U.K.; writing—review and editing, M.S.S., H.B.E. and M.U.K.; visualization, M.S.S., M.S.A. and M.U.K.; supervision, H.B.E. All authors have read and agreed to the published version of the manuscript.
Funding
This research received no external funding.
Institutional Review Board Statement
Not applicable.
Informed Consent Statement
Not applicable.
Data Availability Statement
The original contributions presented in this study are included in the article. Further inquiries can be directed to the corresponding author.
Conflicts of Interest
The authors declare no conflicts of interest.
Abbreviations
The following abbreviations are used in this manuscript:
| FEA | Finite element analysis |
| FE | Finite element |
| IM | Induction motor |
| PMSM | Permanent magnet synchronous motor |
| PF | Power factor |
| EV | Electric vehicle |
| B-H Curve | Electromagnetic field magnetization curve |
| IEC | International electro-technical commission |
| EN | European standards |
| CU | Copper |
Appendix A
Table A1.
Prototype motor measurements under load at different frequencies according to EN 6034-2-1:2015.
Table A1.
Prototype motor measurements under load at different frequencies according to EN 6034-2-1:2015.
| Parameter | Unit | 32 Hz | 50 Hz | 70 Hz | 125 Hz | 75 Hz |
|---|---|---|---|---|---|---|
| Temperature | °C | 119 | - | - | - | 140 |
| Stator current | A(rms) | 174.9 | 174.7 | 174.9 | 172 | 233 |
| Line voltage | V | 230.4 | 360 | 504 | 504 | 540 |
| Stat. copper loss | kW | 2.9 | 2.9 | 2.9 | 2.8 | 5.39 |
| Rotor copper loss | kW | 1.91 | 2 | 1.92 | 2.08 | 3.94 |
| Core loss | kW | 0.98 | 1.62 | 2.58 | 1.85 | 2.7 |
| Input power | kW | 62.0 | 95.8 | 133.7 | 134.5 | 194.3 |
| Output power | kW | 55.9 | 88.5 | 125 | 125 | 180 |
| Torque | Nm | 575 | 574 | 576 | 323 | 774.6 |
| Power factor | - | 0.88 | 0.87 | 0.86 | 0.9 | 0.89 |
| Total loss | kW | 6.2 | 7.3 | 8.7 | 9.5 | 14.3 |
| Efficiency | % | 90.0 | 92.4 | 93.5 | 92.9 | 92.6 |
Table A2.
Prototype motor performance from the developed FE model.
Table A2.
Prototype motor performance from the developed FE model.
| Parameter | Unit | 32 Hz | 50 Hz | 70 Hz | 125 Hz | 75 Hz, 180 kW |
|---|---|---|---|---|---|---|
| Temperature | °C | 119 | - | - | - | 140 |
| Stator current | A(rms) | 173.4 | 173 | 173.5 | 171 | 230 |
| Line voltage | V | 230.4 | 360 | 504 | 504 | 540 |
| Stat. copper loss | kW | 2.85 | 2.81 | 2.85 | 2.76 | 5.3 |
| Rotor copper loss | kW | 2.38 | 2.55 | 2.68 | 2.15 | 5 |
| Core loss | kW | 0.98 | 1.7 | 2.53 | 1.9 | 2.6 |
| Input power | kW | 61.9 | 96.5 | 133.4 | 134.5 | 193.1 |
| Output power | kW | 55.7 | 89.2 | 125.5 | 125.5 | 180 |
| Torque | Nm | 574 | 580 | 579 | 325 | 775 |
| Power factor | - | 0.88 | 0.87 | 0.86 | 0.9 | 0.89 |
| Total loss | kW | 6.2 | 7.3 | 8.4 | 9 | 13.3 |
| Efficiency | % | 90.0 | 92.4 | 93.7 | 93.3 | 93.1 |
Table A3.
Prototype motor, no load test results according to EN 60034-2-1:2015.
Table A3.
Prototype motor, no load test results according to EN 60034-2-1:2015.
| Parameter | Unit | 32 Hz | 50 Hz | 70 Hz | 125 Hz |
|---|---|---|---|---|---|
| Stator current | A(rms) | 67.1 | 67.3 | 67.8 | |
| Line voltage | V | 230.4 | 360 | 504 | 504 |
| Stat. copper loss | kW | 0.33 | 0.34 | 0.34 | 0.07 |
| Core loss | kW | 0.98 | 1.62 | 2.57 | 1.85 |
| Input power | kW | 62.0 | 95.8 | 133.7 | 134.5 |
| Power factor | - | 0.052 | 0.053 | 0.055 | 0.11 |
| Winding resistance | ohm | 0.052 | 0.053 | 0.055 | 0.11 |
| Supply | - | Sinus | Sinus | Sinus | PWM |
| Test condition | - | cold | cold | cold | cold |
Table A4.
Comparison of FEA results of prototype motor and design improvement strategies for rotor copper loss reduction, 125 kW, 70 Hz, rated load operation.
Table A4.
Comparison of FEA results of prototype motor and design improvement strategies for rotor copper loss reduction, 125 kW, 70 Hz, rated load operation.
| Parameter | Prototype | Extended | Tapered | Empty Slot |
|---|---|---|---|---|
| Current (A) rms | 173.5 | 173.5 | 173.6 | 174.3 |
| Pout (kW) | 125 | 125 | 125.5 | 125 |
| Slip (%) | 1.5 | 1.6 | 1.6 | 1.62 |
| Rotor Cu loss (kW) | 2.68 | 2.25 | 2.1 | 2.15 |
| Rotor bar loss (kW) | 2.1 | 1.5 | 1.45 | 1.5 |
| Stator copper loss (kW) | 2.85 | 2.85 | 2.85 | 2.89 |
| Sleeve loss | - | 0.13 | 0.13 | 0.13 |
| Core loss (kW) | 2.53 | 2.3 | 2.3 | 2.35 |
| Total loss (kW) | 8.4 | 7.75 | 7.6 | 7.7 |
| Efficiency (%) | 93.7 | 94.2 | 94.3 | 94.2 |
| Stator core loss (kW) | ||||
| First 4 mm | 0.11 | 0.11 | 0.1 | 0.12 |
| Total stat. core loss (kW) | 2.1 | 2 | 2 | 2 |
| Rotor core loss (kW) | ||||
| Rot. first 4 mm | 0.11 | 0.10 | 0.11 | 0.11 |
| 4 mm to 9 mm | 0.01 | 0.01 | 0.01 | 0.01 |
| Total rot. core loss (kW) | 0.35 | 0.12 | 0.12 | 0.13 |
| Rot. bar loss (kW) | ||||
| Top 1 mm bar | 0.7 | 0.26 | 0.2 | 0.2 |
| Top 2 mm bar | 0.8 | 0.44 | 0.34 | 0.36 |
| 2 mm–8 mm | 0.58 | 0.46 | 0.44 | 0.45 |
| 8 mm–14 mm | 0.4 | 0.37 | 0.36 | 0.36 |
| 14 mm–20.6 mm | 0.33 | 0.31 | 0.3 | 0.33 |
| Total bar loss (kW) | 2.1 | 1.6 | 1.45 | 1.5 |
Table A5.
Material properties for the prototype motor.
Table A5.
Material properties for the prototype motor.
| Parameter | Value |
|---|---|
| Core material | Cogent steel 50 JN-530 |
| Relative permeability | Non-linear B-H |
| Conductivity | 2.8 MS/m |
| Mass density | 7700 kg/ |
| Core loss coefficients | |
| 513 | |
| 0.49 | |
| 4.13 | |
| Rotor cage | CuCrZr |
| Conductivity 25 °C | 47MS/m |
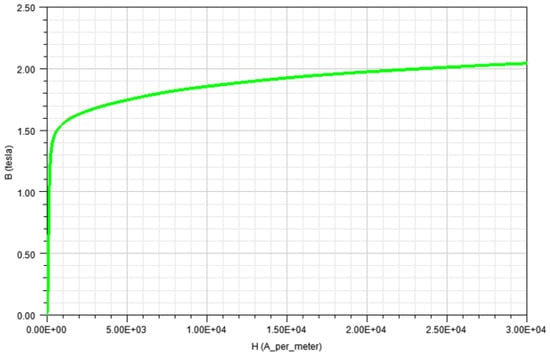
Figure A1.
Non-linear B-H magnetization curve of Cogent steel 50JN-530.
References
- Guo, Y.; Liu, L.; Ba, X.; Lu, H.; Lei, G.; Yin, W.; Zhu, J. Designing High-Power-Density Electric Motors for Electric Vehicles with Advanced Magnetic Materials. World Electr. Veh. J. 2023, 14, 114. [Google Scholar] [CrossRef]
- Paul, S.; Han, P.W.; Chang, J.; Chun, Y.D.; Lee, J.G. State-of-the-art review of railway traction motors for distributed traction considering South Korean high-speed railway. Energy Rep. 2022, 8, 14623–14642. [Google Scholar] [CrossRef]
- Nategh, S.; Boglietti, A.; Liu, Y.; Barber, D.; Brammer, R.; Lindberg, D.; Aglen, O. A Review on Different Aspects of Traction Motor Design for Railway Applications. IEEE Trans. Ind. Appl. 2020, 56, 2148–2157. [Google Scholar] [CrossRef]
- Popescu, M.; Di Leonardo, L.; Fabri, G.; Volpe, G.; Riviere, N.; Villani, M. Design of Induction Motors With Flat Wires and Copper Rotor for E-Vehicles Traction System. IEEE Trans. Ind. Appl. 2023, 59, 3889–3900. [Google Scholar] [CrossRef]
- Dorrell, D.G.; Knight, A.M.; Popescu, M.; Evans, L.; Staton, D.A. Comparison of different motor design drives for hybrid electric vehicles. In Proceedings of the 2010 IEEE Energy Conversion Congress and Exposition, Atlanta, GA, USA, 12–16 September 2010; pp. 3352–3359. [Google Scholar] [CrossRef]
- Riviére, N.; Villani, M.; Popescu, M. Optimisation of a High Speed Copper Rotor Induction Motor for a Traction Application. In Proceedings of the IECON 2019—45th Annual Conference of the IEEE Industrial Electronics Society, Lisbon, Portugal, 14–17 October 2019; Volume 1, pp. 2720–2725. [Google Scholar] [CrossRef]
- Ertan, H.B.; Siddique, M.S.; Koushan, S.; Azuaje-Berbecí, B.J. Designing High Power Density Induction Motors for Electric Propulsion. In Proceedings of the 2022 IEEE 20th International Power Electronics and Motion Control Conference (PEMC), Brasov, Romania, 25–28 September 2022; pp. 553–558. [Google Scholar] [CrossRef]
- Kondo, M.; Miyabe, M.; Ebizuka, R.; Hanaoka, K. Design and Efficiency Evaluation of a High-Efficiency Induction Motor for Railway Traction. Electr. Eng. Jpn. 2016, 194, 15–23. [Google Scholar] [CrossRef]
- Enokizono, M.; Shimoji, H.; Horibe, T. Effect of stator construction of three-phase induction motors on core loss. IEEE Trans. Magn. 2003, 39, 1484–1487. [Google Scholar] [CrossRef]
- Aarniovuori, L.; Rasilo, P.; Niemelä, M.; Pyrhönen, J.J. Analysis of 37-kW Converter-Fed Induction Motor Losses. IEEE Trans. Ind. Electron. 2016, 63, 5357–5365. [Google Scholar] [CrossRef]
- IEC 60034-2-1:2014; Rotating Electrical Machines—Part 2-1: Standard Methods for Determining Losses and Efficiency From Tests (Excluding Machines for Traction Vehicles). International Electrotechnical Commission (IEC): Geneva, Switzerland, 2014.
- IEC 60034-2-3:2013; Rotating Electrical Machines—Part 2–3: Specific Test Methods for Determining Losses and Efficiency of Converter-Fed AC Induction Motors. International Electrotechnical Commission (IEC): Geneva, Switzerland, 2013; Technical Specification.
- Zhang, D.; Yi, J.; Zhu, H.; Ahmad, T.; Zhao, H.; Goh, H.H.; Zhang, Y.; Wu, T. The Electromagnetic Losses Analysis of Inverter-Fed Induction Motor Accounting for Interbar Current and Rotor Slip Frequency. IEEE Trans. Transp. Electrif. 2022, 8, 1155–1167. [Google Scholar] [CrossRef]
- Cheaytani, J.; Benabou, A.; Tounzi, A.; Dessoude, M. Stray Load Losses Analysis of Cage Induction Motor Using 3-D Finite-Element Method With External Circuit Coupling. IEEE Trans. Magn. 2017, 53, 1–4. [Google Scholar] [CrossRef]
- Yamazaki, K.; Haruishi, Y. Stray load loss analysis of induction motor-comparison of measurement due to IEEE standard 112 and direct calculation by finite-element method. IEEE Trans. Ind. Appl. 2004, 40, 543–549. [Google Scholar] [CrossRef]
- Dems, M.; Komeza, K. Designing an Energy-Saving Induction Motor Operating in a Wide Frequency Range. IEEE Trans. Ind. Electron. 2022, 69, 4387–4397. [Google Scholar] [CrossRef]
- Dems, M.; Komeza, K.; Rodriguez, H. Methods for increasing the efficiency of an asynchronous motor with increased speed fed from the PWM inverter. Int. J. Appl. Electromagn. Mech. 2018, 57, 61–71. [Google Scholar] [CrossRef]
- Gorginpour, H.; Oraee, H.; Abdi, E. Calculation of Core and Stray Load Losses in Brushless Doubly Fed Induction Generators. IEEE Trans. Ind. Electron. 2014, 61, 3167–3177. [Google Scholar] [CrossRef]
- Ertan, H.B.; Leblebicioglu, K.; Avenoglu, B.; Pirgaip, M. High-Frequency Loss Calculation in a Smooth Rotor Induction Motor Using FEM. IEEE Trans. Energy Convers. 2007, 22, 566–575. [Google Scholar] [CrossRef]
- Gao, Y.; Sanmaru, T.; Urabe, G.; Dozono, H.; Muramatsu, K.; Nagaki, K.; Kizaki, Y.; Sakamoto, T. Evaluation of Stray Load Losses in Cores and Secondary Conductors of Induction Motor Using Magnetic Field Analysis. IEEE Trans. Magn. 2013, 49, 1965–1968. [Google Scholar] [CrossRef]
- Williamson, S.; Lim, L.; Smith, A. Transient analysis of cage-induction motors using finite-elements. IEEE Trans. Magn. 1990, 26, 941–944. [Google Scholar] [CrossRef]
- Gault, J.S. Rotor-bar currents in squirrel-cage induction motors. Electr. Eng. 1941, 60, 784–791. [Google Scholar] [CrossRef]
- Williamson, S.; Schiferl, R. An Investigation of the Influence of Deep-Bar Effect on the Resistance of Cage Rotor End-Rings. In Proceedings of the 1986 Annual Meeting Industry Applications Society, Orange Walk, Belize, 3–7 October 1986; pp. 852–857. [Google Scholar]
- Carbonieri, M.; Leonardo, L.D.; Bianchi, N.; Tursini, M.; Villani, M.A.; Popescu, M. Cage Losses in Induction Motors Considering Harmonics: A New Finite Element Procedure and Comparison With the Time-Domain Approach. IEEE Trans. Ind. Appl. 2022, 58, 1931–1940. [Google Scholar] [CrossRef]
- Rapp, H. Examination of additional rotor-losses in inverter-fed induction machines. In Proceedings of the IECON ’93—19th Annual Conference of IEEE Industrial Electronics, Maui, HI, USA, 15–19 November 1993; Volume 2, pp. 881–886. [Google Scholar]
- Agarwal, P.D.; Alger, P.L. Saturation Factors for Leakage Reactance or Induction Motors. Trans. Am. Inst. Electr. Eng. Part III Power Appar. Syst. 1960, 79, 1037–1042. [Google Scholar] [CrossRef]
- Chang, S.S.L. Physical Concepts or Stray Load Loss in Induction Machines [includes discussion]. Trans. Am. Inst. Electr. Eng. Part III Power Appar. Syst. 1954, 73, 10–12. [Google Scholar] [CrossRef]
- Dordea, T.; Hoancă, V.; Păun, Ş.; Biriescu, M.; Madescu, G.; Liuba, G.; Mot, M. Direct-Drive Induction Motor for Railway Traction Applications. Proc. Rom. Acad. Ser. A 2011, 12, 239–248. [Google Scholar]
- Takahashi, A.; Sugimoto, S.; Ito, M.; Tamiya, S.; Fujii, K.; Endo, M. High-Efficiency Technology for Railway-Vehicle Traction Motors. In Proceedings of the 2020 23rd International Conference on Electrical Machines and Systems (ICEMS), Hamamatsu, Japan, 24–27 November 2020; pp. 2114–2117. [Google Scholar] [CrossRef]
- Kunihiro, N.; Nishihama, K.; Iizuka, M.; Sugimoto, K.; Sawahata, M. Investigation Into Loss Reduced Rotor Slot Structure by Analyzing Local Behaviors of Harmonic Magnetic Fluxes in Inverter-Fed Induction Motor. IEEE Trans. Ind. Appl. 2017, 53, 1070–1077. [Google Scholar] [CrossRef]
- Li, H.; Klontz, K.W. Rotor design to reduce secondary winding harmonic loss for induction motor in hybrid electric vehicle application. In Proceedings of the 2016 IEEE Energy Conversion Congress and Exposition (ECCE), Milwaukee, WI, USA, 18–22 September 2016; pp. 1–6. [Google Scholar] [CrossRef]
- EN 60034-1:2017; Rotating Electrical Machines—Part 1: Rating and Performance. European Committee for Electrotechnical Standardization (CENELEC): Brussels, Belgium, 2017.
- EN 60034-2-1:2015; Rotating Electrical Machines—Part 2-1: Standard Methods for Determining Losses and Efficiency from Tests (excluding Machines for Traction Vehicles). European Committee for Electrotechnical Standardization (CENELEC): Brussels, Belgium, 2015.
- IEC 60349-2, Ed. 2.0:2010; Electric Traction—Rotating Electrical Machines for Rail and Road Vehicles—Part 2: Electronic Converter-Fed Alternating Current Motors. International Electrotechnical Commission (IEC): Geneva, Switzerland, 2010.
- IEC 60349-1:2010; Electric Traction—Rotating Electrical Machines for Rail and Road Vehicles—Part 1: Machines Other Than Electronic Converter-Fed Alternating Current Motors. International Electrotechnical Commission (IEC): Geneva, Switzerland, 2010.
- Smith, A.; Healey, R.; Williamson, S. A transient induction motor model including saturation and deep bar effect. IEEE Trans. Energy Convers. 1996, 11, 8–15. [Google Scholar] [CrossRef] [PubMed]
- Repo, A.K. Numerical Impulse Response Tests to Identify Dynamic Induction-Machine Models. Ph.D. Dissertation, Helsinki University of Technology, Espoo, Finland, 2008. [Google Scholar]
- Bertotti, G. General properties of power losses in soft ferromagnetic materials. IEEE Trans. Magn. 1988, 24, 621–630. [Google Scholar] [CrossRef]
- Lin, D.; Zhou, P.; Fu, W.; Badics, Z.; Cendes, Z. A dynamic core loss model for soft ferromagnetic and power ferrite materials in transient finite element analysis. IEEE Trans. Magn. 2004, 40, 1318–1321. [Google Scholar] [CrossRef]
- Ansys. Ansys Maxwell Help Manual; Version 2022 R2; Ansys: Canonsburg, PA, USA, 2022. [Google Scholar]
- Lipo, T.A. Introduction to AC Machine Design; Wiley-IEEE Press: New York, NY, USA, 2017. [Google Scholar] [CrossRef]
Disclaimer/Publisher’s Note: The statements, opinions and data contained in all publications are solely those of the individual author(s) and contributor(s) and not of MDPI and/or the editor(s). MDPI and/or the editor(s) disclaim responsibility for any injury to people or property resulting from any ideas, methods, instructions or products referred to in the content. |
© 2025 by the authors. Published by MDPI on behalf of the World Electric Vehicle Association. Licensee MDPI, Basel, Switzerland. This article is an open access article distributed under the terms and conditions of the Creative Commons Attribution (CC BY) license (https://creativecommons.org/licenses/by/4.0/).