1. Introduction
1.1. EV Adoption Globally and Challenges in Underprivileged Developing Countries
Electric vehicles have become an important technology in reducing global greenhouse gas emissions [
1], combating climate change, and transitioning toward sustainable transportation systems [
2]. In 2022, global EV sales exceeded 10 million units, marking a 55% increase from the previous year and accounting for 14% of all new car sales [
3]. For instance, Norway, China, and the United States have adopted EVs driven by comprehensive policy frameworks and innovative technologies [
4]. Over the next 20 years, EVs are expected to generate notably more electricity demand. Demand for EV batteries is projected to increase four-and-a-half times by 2030 and, subsequently, almost seven times by 2035. The rapid adoption of EVs will result in an enormous increase in upgrades to infrastructure and electricity generation to support the increasing amount of EVs on the road. At the same time, they incorporate public and private investments in infrastructure development. Specifically, Norway aims to achieve over 80% of its EV market share in 2022, reinforced and supported by zero carbon emission zones and a nationwide charging system [
5]. In contrast, EV adoption is still in the infant stage due to a lack of infrastructure, accessibility, customer ignorance, and confidence [
6]. People are unaware of how charging networks will work for them without electricity [
7]. In addition, potential customers are heavily price-sensitive and highly concerned about EVs’ high upfront costs [
8]. Such matters worsened the EV implication in light of the lack of local investors and production, which ultimately rely on imports only. Inadequate government assistance, tax, and policy support, exemplified by incoherent relevant carbon emission laws, insufficient incentives, and unplanned national vision, is another issue facing developing countries [
9].
Socio-economic differences further complicate the adoption of EVs by different social classes [
10]. In low-income developing countries, the basic need for electricity cannot maintain its 24/7 continuity due to a shortage of resources, technologies, conventional grid systems, and inefficient workers [
11]. Again, income inequalities among different social classes, such as the rich, middle-class, and poor, or urban and rural areas, limit EV adoption. Urban elites have the money, but they do not have enough concern about futuristic scenarios and carbon emissions. Furthermore, most developing countries rely on coal-based electricity generation, which increases environmental concerns. At the same time, several developing countries like Bangladesh adopted quick rental electricity through private sectors producing electricity using fossil fuel, condensed natural gas (CNG), and coal to support the government-owned electricity grid. Such initiatives provide temporary solutions but increase costs and carbon emissions as they focus on supply rather than environmental damages. To reduce emissions, EVs can help the community by requiring less electricity and developing much greener energy initiatives [
12]. In this scenario, policymakers must establish relevant policies [
13] and construct laws encouraging people to consider electronic vehicles. To gain popularity among the citizens, a country needs adequate investments in renewable energy, reasonably priced EVs, and public–private partnerships, which are vital to encourage sustainable EV adoption in these areas.
1.2. Problem-Identifying Barriers to EV Adoption
The adoption of EVs faces notable barriers in developing countries, hindering potential transformation toward environmentally friendly sustainable transportation. This study examines a developing country’s perspective as Bangladesh’s population is increasing exponentially, now 174.9 million people, and projections are 214.7 million by 2050 [
14]. To deal with such populations, they must improve their infrastructures, transportation plans, energy demands, and vehicle types to tackle the challenges and reduce pollution. Many countries are already eradicating environmental problems through hybrid vehicles and EVs to reduce carbon emissions. Carbon emissions are primarily sources from industries and vehicles that use fossil fuels as a burning resource and generate power supplies for their daily operations. The world produces more than 37 billion tonnes of carbon through these processes that have never been healed through natural and artificial processes. Environmental loads are piling up daily, creating atmospheric changes for adverse climate changes. At the same time, conventional structure, economic status, and policy challenges impede widespread adoption. The discussion below is based on Supply-Side Barriers (Manufacturing/Technology), Demand-Side Barriers (Consumer Awareness/Adoption), and Institutional Barriers (Policy/Infrastructure) to implementing HEVs and EVs from developing countries’ perspectives, which are as follows:
1.2.1. Institutional Barriers (Policy/Infrastructure)
Policy and Regulatory Barriers [
15]: Developing countries often lack consistent countrywide innovative strategies to promote any transformation like EVs, resulting in disjointed policies and weak incentives. Developing nations always respond lately to transformations due to a lack of scientific knowledge and are afraid of government initiatives for regulations and subsidies. Any developing countries’ governments commonly fail to support adequate subsidies, tax rebates, and breaks, or any other types of financial motivations to inspire EV consumption and infrastructure change. In contrast, developing countries face pressing issues, such as economic instability, poor healthcare, fundamental infrastructures, and poverty eradication. For them, financial support for EVs and infrastructure is limited, often due to competing national priorities rather than a simple lack of willingness. This policy and regulatory vacuum demoralize private entrepreneurs from stepping forward to invest and adopt new processes for transformed products like EVs.
Inadequate infrastructure [
16,
17]: The second barrier is establishing a new structure for charging stations and making it accessible to urban and rural areas. Most developing nations face unstable electricity supplies, too, making things challenging for highly electricity-reliable vehicles. Such infrastructural inefficiency decreases potential consumer confidence and confines the feasibility of EV usage, mainly in rural and semi-urban areas.
1.2.2. Supply-Side Barriers (Manufacturing/Technology)
Environmental Concerns [
17,
18,
19]: Developing countries’ worrying reliance on fossil-fuel-based electricity undermines innovative EVs’ environmental paybacks. Such standard practices create skepticism about EVs’ overall impact. Without a transition to cleaner energy sources, EV adoption may not achieve its intended sustainability goals.
Economic Challenges [
17,
18,
20]: EVs need high upfront costs, which are unaffordable for middle-class people in developing nations. The current practice is to produce fossil-fuel vehicles through local manufacturing and assembly industries depending on imported vehicles. Local manufacturers (extension of a mother company) used to receive dual financial support from car manufacturers, dealers, and financial institutions to handle overly price-sensitive markets. Additionally, the limited availability of such reasonable financing options restricts EV selling toward higher and moderate-income groups, excluding the mass population living under the poverty line.
Technological Gaps and Supply Chain Constraints [
21,
22]: Developing countries rely heavily on importing technologies rather than innovating them in their own countries. Such limitations create challenges in accessing innovative HEV and EV technologies due to supply chain limitations and the high import cost of essential vehicle components. For instance, the Bangladesh government imposes 600–800 percent taxes for luxury vehicles, which restricts the affordability of high-quality EVs in local markets. These challenges impact the supply chain as they interfere with procurement, manufacturing, and distribution by increasing costs, further impacting sourcing of EV components, restricting local manufacturing capability, and generating logistical inefficiencies in installing battery supply and infrastructure for charging.
1.2.3. Demand-Side Barriers (Consumer Awareness/Adoption)
Limited Buyer Awareness and Trust [
16,
20]: Before a customer makes a buying decision, they have to have enough understanding of the product features. People in developing countries lack understanding and education on EV features, benefits, maintenance knowledge, finance requirements, and long-term savings calculations. Such awareness creates hesitancy in adopting EVs. Many misconceptions about EV reliability, weather sensitivity, battery lifespan, and upfront costs further diminish consumer trust.
Urban–Rural Disparities [
23]: In developing countries, most facilities are concentrated in major cities, and the rest struggle to have minimal facilities like roads and highways, high-end product accessibility, maintenance and repair facilities, and charging infrastructure. Moreover, EV-related customer services are often located in urban areas, leaving rural areas underserved. This discrepancy limits the spread of EV adoption to regions with improved infrastructure and financial resources.
Thus, the above barriers highlight limited global practice adaptability to developing countries. Despite the worldwide momentum toward adopting HEVs and EVs, the transferability of efficacious practices from developed to developing nations remains inadequate. Developed countries like Norway and the Netherlands have applied robust policy agendas, widespread charging infrastructure, and monetary incentives, motivating EV adoption. However, these models may not work for developing countries due to their unorganized socio-economic and infrastructural conditions, creating a noteworthy research gap. Developing countries face fundamental challenges such as conventional power grids, urban–rural budget divides, and imperfect local manufacturing capabilities for EVs and their maintenance. These issues render many globally successful strategies, such as extensive subsidies or reliance on high-cost charging networks, unsuitable or unsustainable in these regions. Additionally, the high dependency on coal-based energy in developing countries reduces the environmental benefits of EVs, a factor often overlooked in global practices. While existing studies highlight the effectiveness of policies like tax rebates and infrastructure investment in developed economies, little research focuses on how these measures can be tailored to developing countries’ financial, infrastructural, and cultural realities. This study focuses on government incentives and regulatory systems [
24] and ignores the disruptive impact of unstable grids on EV charging networks [
25], where facility limitations and unpredictable electricity supply provide significant barriers [
11]. This research gap underlines the importance of local strategies and policies for the specific challenges related to switching to efficient EV technologies in regions with limited resources.
Based on the above discussions, this study comprehensively examines the market challenges, potential, and solutions for EV adoption in developing countries. While EVs have immense potential as a sustainable, environment-friendly transportation alternative, developing countries face unique challenges that explain their limited implementation. This study aims to discover these dynamics and present actionable perceptions to hasten EV market development. The objectives of the studies are as follows:
To examine EV adoption trends, challenges, and policy barriers in developing nations, highlighting market potential and identifying region-specific obstacles to widespread adoption. Then, analyze barriers such as infrastructure limitations, high costs, and policy gaps alongside the potential of emerging EV markets driven by urbanization, environmental awareness, and a growing middle class.
To build a system dynamics simulation model on a transportation fleet case to examine costs, carbon emissions, revenues, fuel consumption, and maintenance expenses. Then, analyze and compare the current transportation scenario with hybrid and electric vehicle (EV) adoption to assess the operational, economic, and environmental impacts of adopting sustainable transportation solutions in fleet operations. It provides a possible scenario to identify key barriers and opportunities for sustainable fleet transitions.
To propose actionable recommendations and policy strategies for overcoming barriers and tailoring global EV adoption practices to developing nations’ socio-economic and infrastructural contexts.
The rest of the paper is organized from the literature review on HEV and EV acceptance and challenges confronting developing countries. The method explains the case study method and system dynamics simulation modeling. Subsequently, model calibration and data sources are discussed; subsequent major findings on functional, ecological, and economic impacts are demonstrated. The study then provides policy recommendations before advocating for additional research directions.
2. Literature Review
2.1. Overview of Global EV Adoption Trends
The adoption of EVs has skyrocketed because of technological advances, supportive policies, and consumer consciousness of environmentalism. The worldwide sales of EVs reached a record high of 10 million in 2022, up 55 percent from the previous year, while EVs gained a 14% market share [
3]. Government support, infrastructure, and financial variables affect geographical adoption tendencies.
Table 1 highlights key global trends, adopted countries, instances, and features driving EV adoption. For example, Norway and China emphasize policy-driven growth based on government subsidies and tax exemptions, which are consequential in significant market shares. Infrastructure development, led by the USA and Germany, focuses on extensive charging and renewable energy networks. Cost advantage is crucial in Southeast Asia and India, where affordable EV models are provided for economically price-sensitive customers. Urban-centric growth in Europe and Japan emphasizes shorter commutes and dense populations, whereas BYD and Tesla’s technological advances promote innovative battery innovation and fully autonomous driving capabilities. Nevertheless, since both South Africa and India depend significantly on coal-based power, environmental advantages are reduced by coal-centric energy problems. Export-driven manufacturing, which South Korea and China primarily drive, spotlights competitive trade and manufacturing marketplaces, pushing the growth of EVs globally. These trends demonstrate an array of geographically specific strategies that strike an equilibrium between infrastructure, cost-effectiveness, and technology despite tackling environmental and economic challenges.
2.2. Infrastructure Challenges in Developing Regions
Infrastructure is an essential requirement for implementing any idea. Infrastructure is the main barrier to adopting EVs in developing countries. Such infrastructural challenges limit accessibility, trustworthiness, and consumer confidence, encumbering the transformation of environmentally friendly transportation. The most significant barriers to the widespread use of EVs in developing countries are presented in
Table 2. EV usefulness is limited to the absence of charging infrastructure in nations like Bangladesh and Nigeria and frequent interruptions resulting from unstable power grids. In South Africa and India, weakened consumer confidence is due to the same problem. Due to dense charging infrastructure in cities, countryside regions have been squeezed out, as demonstrated by urban–rural inequalities in Kenya and Indonesia. EV adoption continues to be hindered by grid capacity constraints in countries like Vietnam and Pakistan, where overloaded infrastructures are unable to cope with increasing demands. The installation of required charging networks has been impeded because of high infrastructure expenses in Ghana and the Philippines due to a lack of financing. Ultimately, the absence of access to innovative recharging equipment in Uganda and Cambodia hampers EV adoption. These challenges draw attention to the organizational and systematic barriers that prevent EV adoption from becoming widespread in developing nations.
Table 2 below summarizes key infrastructure challenges, instances, and their impacts on EV adoption:
2.3. Policy Frameworks and Regulatory Gaps
Policy frameworks and regulatory gaps significantly influence the adoption of EVs in developing countries. While developed nations like Norway have implemented robust policies, including subsidies, tax incentives, and zero-emission mandates, developing regions often lack cohesive strategies tailored to their specific challenges. This absence of a structured policy environment hinders private-sector investment and limits consumer adoption. The policy barriers to EV adoption in developing nations are presented in
Table 3. EVs are beyond range for lower-income groups in Bangladesh and India because of a lack of monetary incentives. Customers and manufacturers in South Africa and Brazil remain hesitant amid scattered policies. In countries like India, dependence on coal reduces the environmental advantages associated with EVs. Infrastructure development in Vietnam and Nigeria is being slowed down because of a lack of collaboration between the public and private sectors. In Southern Asia and Sub-Saharan Africa, inefficient national strategies have failed to create trust and bring in investors. In African and Southeast Asian nations, a disproportionate reliance on imported EV technology increases costs. In Latin America, inadequate planning for cities leads to charging infrastructure bottlenecks. South Asian and Brazilian deferred regulations regarding emissions have impeded EV adoption. In South Asia and Indonesia, insufficient access to transportation systems limits the use of EVs in public transportation, reducing their impact.
2.4. Market Potential and Key Barriers in Developing Countries
The market potential for EVs in developing countries is significant, driven by rising urbanization, increasing environmental awareness, and a growing middle class. Nations such as India, Brazil, and South Africa are witnessing an uptick in demand for affordable and sustainable transportation solutions, offering promising opportunities for EV market growth. However, this potential is hindered by several key barriers that limit widespread adoption.
Table 4 covers the primary challenges to EV adoption in developing countries in addition to the market potential. The demand for sustainable and affordable transportation grows in South Africa and India as a consequence of increasing urbanization. The prospective market for EVs grows with the expanding middle classes in Brazil and Indonesia. Price-sensitive markets consider it challenging to manage the high upfront costs in Nigeria and Bangladesh. In Southeast Asia and Africa, dependence on imports increases the cost of EVs and limits their accessibility. Lower-income people in Brazil and Vietnam are neglected mainly because of a lack of financing alternatives. The use of EVs is limited in semi-urban and rural regions in Kenya and Pakistan simply because of inadequate charging infrastructure. The deployment of charging infrastructure faces obstacles from South Africa and India’s unstable power grids. In Sub-Saharan Africa, the urban–rural divide restricts the adoption of EVs in rural areas. In Bangladesh and Brazil, policy and regulatory gaps prevent investment and diminish customer confidence.
Ten million EVs were sold globally in 2022, a 55% increase from 2021 [
3], indicating the meteoric rise of EV adoption triggered by favorable regulations, technology improvements, and increasing environmental awareness. Yet, unique challenges that limit accessibility and consumer confidence are encountered in developing countries, such as a lack of infrastructure, unreliable power grids, and high upfront costs. The adoption of EVs is further hindered because of the lack of cohesive policy frameworks and public–private partnerships, especially in semi-urban and rural regions. This study aims to fill these gaps through highlighting significant problems and proposing specific solutions like improving charging infrastructure, promoting affordable EV models, and advocating modifications to laws that encourage equitable and long-term EV adoption in developing countries. To do so, a case study is conducted to examine the possible scenarios when they transform their transportation fleet into partial hybrids and EV adoptions to observe the favorable parameter changes using simulation modeling.
3. Research Methodology
3.1. Research Design
This study adopts a mixed-method integrating system dynamics modeling and case study to discover the transportation-related challenges and prospects in light of Bangladeshi livestock farms with a separate transport fleet operating 142 vehicles of various types. Bangladesh is one of the excellent countries to consider for research as it is now the 35th largest economy (
https://bida.gov.bd (accessed on 11 November 2024)), though it has been known as a poor and densely populated region for a long time. In Bangladesh, GDP per capita is USD 2620, the wealthiest 10% control 41% of total income, and the Gini coefficient (income or wealth inequality) is 33.4, indicating moderate inequality. Food expenditures account for 45.8% of household income, reflecting economic challenges (IMF.org (accessed on 10 November 2024)). Bangladesh has progressed significantly in terms of roads and highways, livestock, garments, consumer goods, and many other sectors like steel, cotton, glass, cars, and appliances. The case industry uses its 142 vehicles to carry typical products like chicken, day-old chicks, poultry and dairy feed, milk, milk-related value-added products like yogurt, pasteurized milk, and flavored drinks, and horticulture products like fruits, vegetables, paddy, and corn. This study only considers product carrying and 21 private vehicles used in internal project areas and for higher executives to commute from one unit to another unit for inspections. This research also assesses vehicles using diesel, octane, and compressed natural gas (CNG). An average is calculated per mile to avoid the complexity of different modes of gasoline usage in different vehicles. The research mainly focuses on understanding the future transformation of EVs or hybrid vehicles to hypothetically analyze the economic, operational, and infrastructural benefits and challenges. The design incorporates the following:
System Dynamics (SD) Approach [
56]: The study deployed the SD simulation model and simulated the interconnected variables to observe transitioning to hybrids and EVs and find possible changes in operational costs, carbon emissions, and efficiency.
Case Study Approach [
57]: This study considers a case transportation fleet owned by a giant livestock conglomerate in Bangladesh. They have more than 200 vehicles operating nationwide, and this study finds 142 that are used for the supply and distribution of their products. Consequently, a system dynamics simulation model was developed to consider their transport operational data and replicate its current processes. Later, hypothetical values are considered input to understand future transformations in light of key indicators. The case industry is one of the largest farms in terms of producing and transporting day-old chicks, milk, and livestock feed production and marketing of their products all over Bangladesh. Bangladesh is a small country of approximately 95,000 square miles, and the case farm’s vehicles move more than 550,000 miles per month.
The mixed method helps design the model through a qualitative and quantitative understanding of the transportation networks. This design confirms a comprehensive understanding of theoretical modeling and practical implications, which will bridge the gap between systematic investigations and industry realities.
3.2. System Dynamics (SD) Simulation Model Development
SD is a simulation modeling technique that focuses on modifying interrelated components over time [
56,
58]. It is often utilized in transportation modeling [
12,
13,
17,
18] to assess the impact of policies, designing infrastructure, and transitioning to environmental sustainability. Since it can integrate feedback loops and time delays [
56], SD is an effective instrument for analyzing the deployment of HEV and EV in the transport fleet of businesses in emerging economies. This study examines the operational, economic, and ecological consequences of transitioning to greener modes of transportation employing SD. The SD model is developed to simulate the transportation dynamics based on mileage traveled in one month using their vehicles. The study used the Vensim 6.01b application to draw a simulation model [
18], replicating the current process and scenario analyses using hypothetical data. This model accumulated data from 142 vehicles that operate for commercial, private, milk transport, and egg transport vehicles. The key variables are listed in
Table 5, along with their value and units as below:
Fleet Composition: The type and number of vehicles. The model simplified the categories into Private Vehicles and Product-Carrying Vehicles.
Fuel Consumption: Differentiating between diesel, octane, and CNG fuel sources.
Fuel Costs: The total fuel costs combined make an average per-mile cost.
Operational Metrics: Operational metrics rely on vehicle mileage (Bangladesh measures in kilometers but converted to miles for modeling purposes), maintenance costs (repairs, spare parts), fuel costs, and consumption efficiency.
Carbon Emissions: Most vehicles use diesel, and only 20 percent use octane and CNG. The study estimates carbon emissions based on average mileage and fuel consumption. The average is nearly 1.46 kg of carbon emissions while driving one mile by a 5-ton semi-truck.
The model integrates feedback loops, such as cost versus profit and wear-and-tear impacts on vehicle availability, to provide dynamic insights into the system.
3.3. Data Collection
This study collected primary and secondary data to ensure thorough coverage of transportation information from the case industry and general information. The transportation logbook from the case livestock industry and their supply chain operations all over the country provided the primary data. This farm operates more than 200 vehicles of different kinds, but its records show 142 vehicles operated primarily for carrying products from various destinations. The study kept 21 vehicles from private usage, maintaining records for high mobility. The study did not include the rest of the vehicles due to a lack of mobilities and logbook records, as these vehicles run within particular projects for internal movement. For example, every project is 25 to 50 acres of land, and they need internal vehicles for stuff and feed and other ingredients’ movements internally. They use some golf carts that are battery-operated and environmentally friendly. This study excludes those internally used golf carts from the vehicle sample. The transportation data in
Table 5 were collected at the end of 2023, considering the time frame for 12 months, January to December, both the dry and wet seasons, and then calculating the monthly average. Initially, the cost figures are reported in Bangladeshi Taka (BDT) and converted to USD based on the central bank’s annual rate varying from 115 to 123 BDT = 1 USD. Outlier values were reviewed, and extreme fluctuations (political, transport, and labor strikes) were excluded to maintain data consistency. Through in-depth, open-ended interviews with the logistics manager and fleet operators, key operational information was collected, including miles, consumption of fuel, repair costs, and vehicle utilization rates. The study extracts scholarly research papers from journals, periodicals, and reputed websites for theoretical support. For example, standard carbon emission per mile was extracted from literature and EV manufacturing vehicle websites and cross-checked among different sources.
3.4. Case Farm Selection
The case study methods deployed to justify the study consider the developing country’s environment. This research purposively chose large-scale single livestock farms for their scale of operations and diverse fleet operations. This farm has the largest dairy in Bangladesh and is among the top few companies considering day-old chick production and marketing in the country. They produce 10 million chicks per month and distribute them to more than two thousand small–medium poultry farmers all over Bangladesh through 15 different zonal offices and 150 agents. They also produce 40,000 tons of livestock feed for commercial and internal consumption. They have their own Grant Stock (GP) and Parent Stock (PS) farms, where they hatch ten million chicks at a hatching capacity in a month. This farm is one of the few that represents typical transportation challenges facing constantly dealing with supply chain complexities. They also maintain their logbook for authentic information for managerial decisions, tax, and value-added tax (VAT) purposes. Their transportation operations highlight air and noise pollution, cost inefficiencies, fossil fuel dependence, seasonal fluctuations, frequent accidental expenses, and unexpected maintenance costs. Their urban and rural coverage is also helpful in understanding the limitations of charging infrastructure and consistent electricity supplies, making it an ideal topic for studying EV adoption in the livestock supply chain.
3.5. Simulation Model on a Case Industry Transportation Fleet
3.5.1. Mental Model
In order to thoroughly understand the complicated transportation processes, cost factors, and revenue generation associated with fleet management, in-depth interviews with managers, operators, and staff involved in transport logistics were carried out to develop the mental model. According to insights acquired through these interviews, important variables such as gasoline usage, maintenance costs, driver costs, and income sources are interrelated. Respondents highlighted the impact of fleet composition decisions, including adopting EVs and hybrids to reduce expenses and efficiency in operation. Furthermore, governmental fees, tolls, and greenhouse gases have been addressed in addition to techniques for maximizing fuel efficiency and mileage. The mental model provides a comprehensive structure to assess the functional, economic, and ecological impacts of transitioning to sustainable automotive technologies in fleet management using stakeholders’ operational expertise and actual life experience. This collaborative approach ensures that the framework is an effective instrument for policy formulation and choice-making and precisely reflects the actual state of fleet management.
3.5.2. Monthly Transportation Costs
For a fleet of 142 vehicles,
Table 6 illustrates the monthly transportation expenses for each subsequent category: Chicks, Feed, Commercial, Private, Milk, Egg, and Project transport types. It shows data regarding total miles driven, repair costs, tolls, driver wages, costs of gasoline, and taxes. Chicks’ transportation costs were the highest, traveling 269,057 miles and leading to heavy fuel (4,098,678), maintenance (793,373), and driver pay (746,418) expenses. On the other hand, the Project classification has the lowest expenses and the least mileage (9069). The mean price per mile is determined, and the total expenditures for all categories are displayed at the end of the table. Fuel costs 16.83, repair expenses 4.01, toll expenses 2.09, driver wages and food costs 2.75, and government tax costs 0.64. The operational necessities, along with the expense allocation of the various vehicle types in the transportation fleet, are emphasized through this information. All the calculations are converted in light of per mile traveling of a vehicle and calculated in the Bangladeshi currency of Taka (BDT). Later, the simulation model converted all the values from BDT to USD.
4. Transportation Fleet Simulation Model
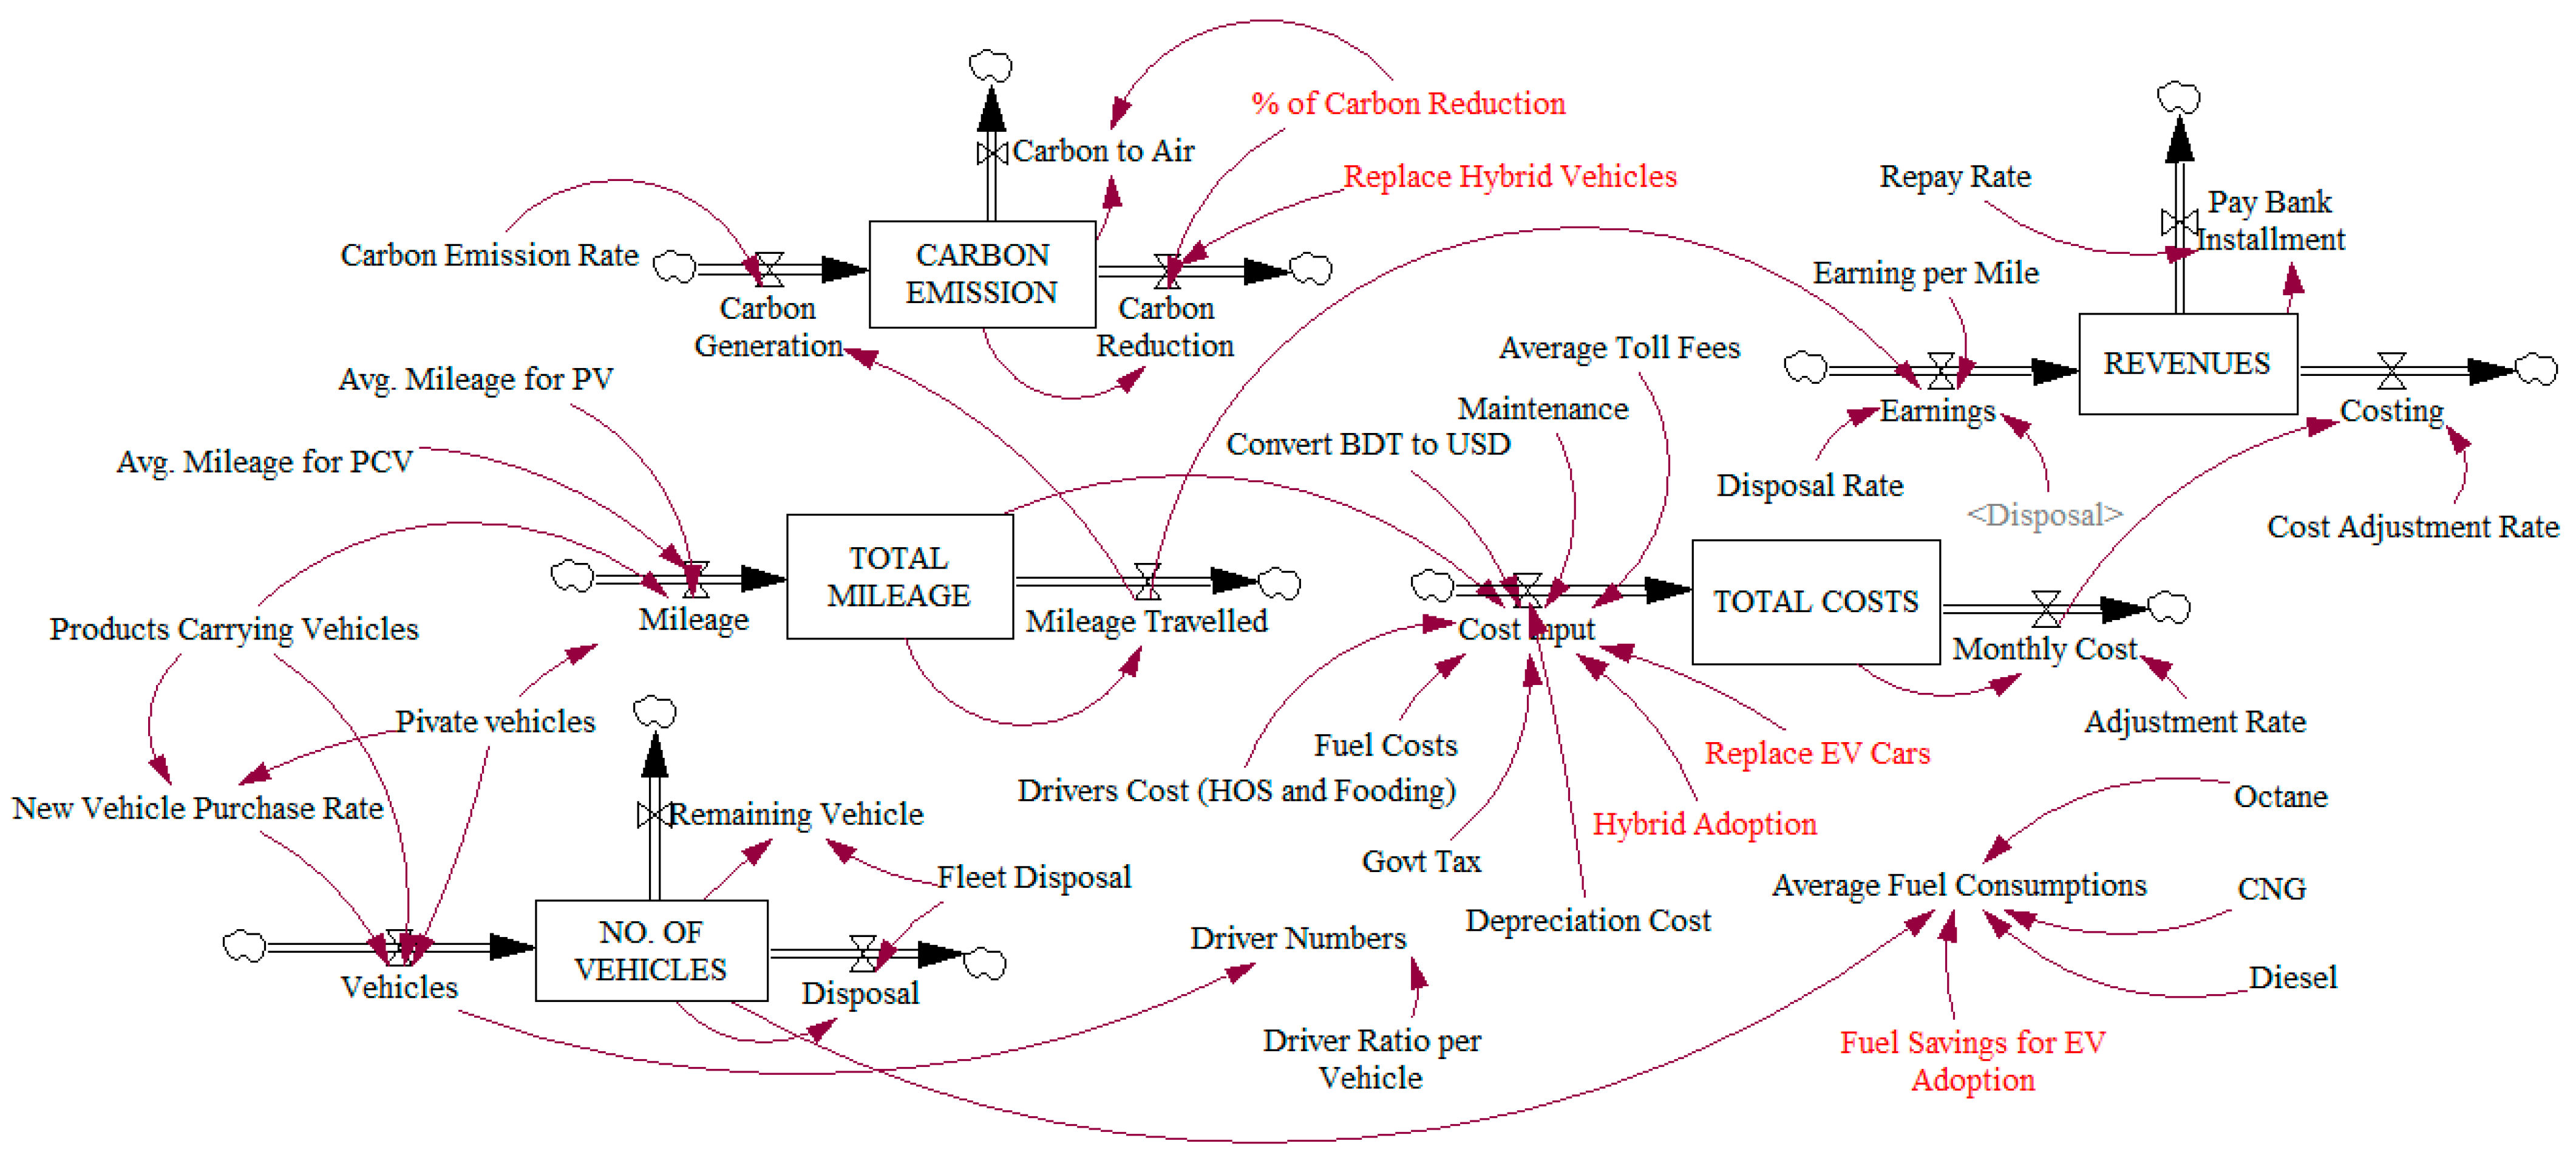
Figure 1 provides an inclusive system dynamics model for analyzing the economic, environmental, and operational impacts of vehicle adoption and fleet management, mainly focusing on hybrid and electric vehicle (EV) integration. While addressing their interdependencies, the model encompasses key variables, including carbon emissions, total mileage, operational costs, and revenues. Greenhouse gas emissions are categorized into Scope 1, 2, and 3, which help organizations structure their carbon reduction strategies [
59]. According to Mckinsey’s article [
59], the livestock carbon emissions fall under both Scope 1 and 3 emissions, where Scope 1 involves direct emissions from fermentation processes and managing manure, and Scope 3 encompasses indirect emissions from upstream processes such as feed production, land use modifications, and downstream effects which includes processing, transportation, and supply chain operations. The model also highlights factors like fuel consumption, maintenance, government taxes, and driver costs, offering a framework for evaluating the transition to sustainable transportation options in a fleet management system.
The model’s core components include Carbon Emissions, Total Costs, and Revenues, with feedback loops capturing the impact of variables like mileage, vehicle types, and fuel consumption. For instance, carbon emissions are affected by the total mileage and the adoption of hybrid and EV technologies, which contribute to carbon reduction. Similarly, total costs are influenced by vehicle maintenance, fuel consumption (CNG, diesel, and octane), and toll fees, with potential cost savings achieved through EV adoption. Revenues are determined by operational efficiency, earnings per mile, and cost adjustments. This model serves as a decision-making tool, enabling stakeholders to evaluate the economic feasibility and environmental benefits of transitioning to hybrid and EV fleets. Simulating the effects of replacing fossil-fuel-powered vehicles with sustainable alternatives provides insights into potential cost savings, carbon reduction, and the long-term sustainability of fleet operations. This approach is particularly relevant for industries seeking to balance profitability with environmental responsibility.
4.1. Stock Variables: The Stock Variables Below Are the Main Factors to Compare Among Vehicle Choices
Represents the total fleet size, which impacts overall transportation operations.
Directly connected to Fleet Disposal (removal of older vehicles) and New Vehicle Purchase Rate, affecting the fleet composition.
Influences Total Mileage, as more vehicles lead to higher cumulative distance covered.
The fleet size determines Driver Numbers and Driver Ratio per Vehicle, contributing to labor costs.
Transition to hybrid vehicles or EVs (via Replace Hybrid Vehicles and Replace EV Cars) reshapes the fleet for sustainability.
Represents the cumulative distance covered by the fleet.
Affected by the type of vehicles, with separate considerations for Avg. Mileage for PVs (Private Vehicles) and Avg. Mileage for PCVs (Product-Carrying Vehicles).
Directly influences Fuel Costs, Maintenance, and Toll Fees, which feed into Total Costs.
Higher mileage from fossil-fuel vehicles increases carbon emissions, while hybrid and EV adoption reduces the emission rate.
Drives Revenues, as mileage is a key factor in calculating earnings per mile.
It captures all expenses, including Fuel Costs, Maintenance, Toll Fees, Driver Costs, and Government Taxes.
Influenced by Fleet Disposal (older vehicles are more expensive to maintain) and the adoption of Hybrid Vehicles and EV Cars, which reduce fuel and maintenance expenses.
Higher mileage increases costs, particularly for fossil-fuel vehicles, but fuel savings from EV adoption mitigate these impacts.
Directly affects revenues, as cost adjustments can improve profit margins.
Connected to Cost Adjustment Rate, allowing for operational efficiency evaluation.
Represents income generated from fleet operations, determined by earnings per mile and total mileage.
Dependent on operational efficiency, as higher Total Costs reduce profit margins.
Influenced by the repayment rate, which reflects installment payments for new vehicles, including hybrids and EVs.
Disposal Rate contributes to revenues through the sale of decommissioned vehicles.
A strong focus on sustainability (via hybrid and EV adoption) increases long-term profitability by reducing operational costs and carbon penalties.
It reflects total greenhouse gas emissions from the fleet, which are influenced by the carbon emission rate and total mileage.
High emissions are driven by fossil-fuel vehicles, while Hybrid Vehicles and EV Cars significantly reduce carbon output.
Connected to the percentage of carbon reduction, which tracks the environmental impact of adopting sustainable technologies.
Carbon reduction strategies influence policy compliance and operational reputation, indirectly affecting Revenues.
Long-term reductions in emissions align with lower fuel consumption and maintenance costs, as seen in the Total Costs variable.
4.2. Model Calibration
The system dynamics model was calibrated using red-inked variables to ensure accuracy in critical decision-making factors. The calibrated variables include % of Carbon Reduction, Replace Hybrid Vehicles, Replace EV Cars, Hybrid Adoption, and Fuel Savings for EV Adoption. These variables were adjusted based on corporate transportation logs, ensuring alignment with real-world operational data. Specifically, the values of these variables were changed to “No Carbon Reduction” to 35% carbon emission, zero percent to 50% HEVs, 15% adoption of EVs and 40% fuel savings, respectively. The model’s validity was confirmed through trend validation against historical fleet performance, consistently predicting transportation cost trends, carbon emissions, and fuel consumption. While the current study did not conduct an extensive sensitivity analysis, the robustness of the model was tested by adjusting input variables and observing their impact on overall system behavior. Future research may incorporate more variable changes to see the model behavior.
5. Findings and Discussion
5.1. Simulated Results for Current Scenario vs. Hybrid and EV Adoption
The simulation results reveal notable distinctions between the current transportation model and adopting hybrid vehicles and EVs. The findings across key variables strongly support transitioning to hybrid and EV technologies to enhance operational efficiency, reduce costs, and align with sustainability goals. However, as there is no evidence of EVs being available for 5-ton trucks, it is difficult to assess their feasibility. Thus, hybrid vehicles emerge as the better option.
5.2. Carbon Emissions:
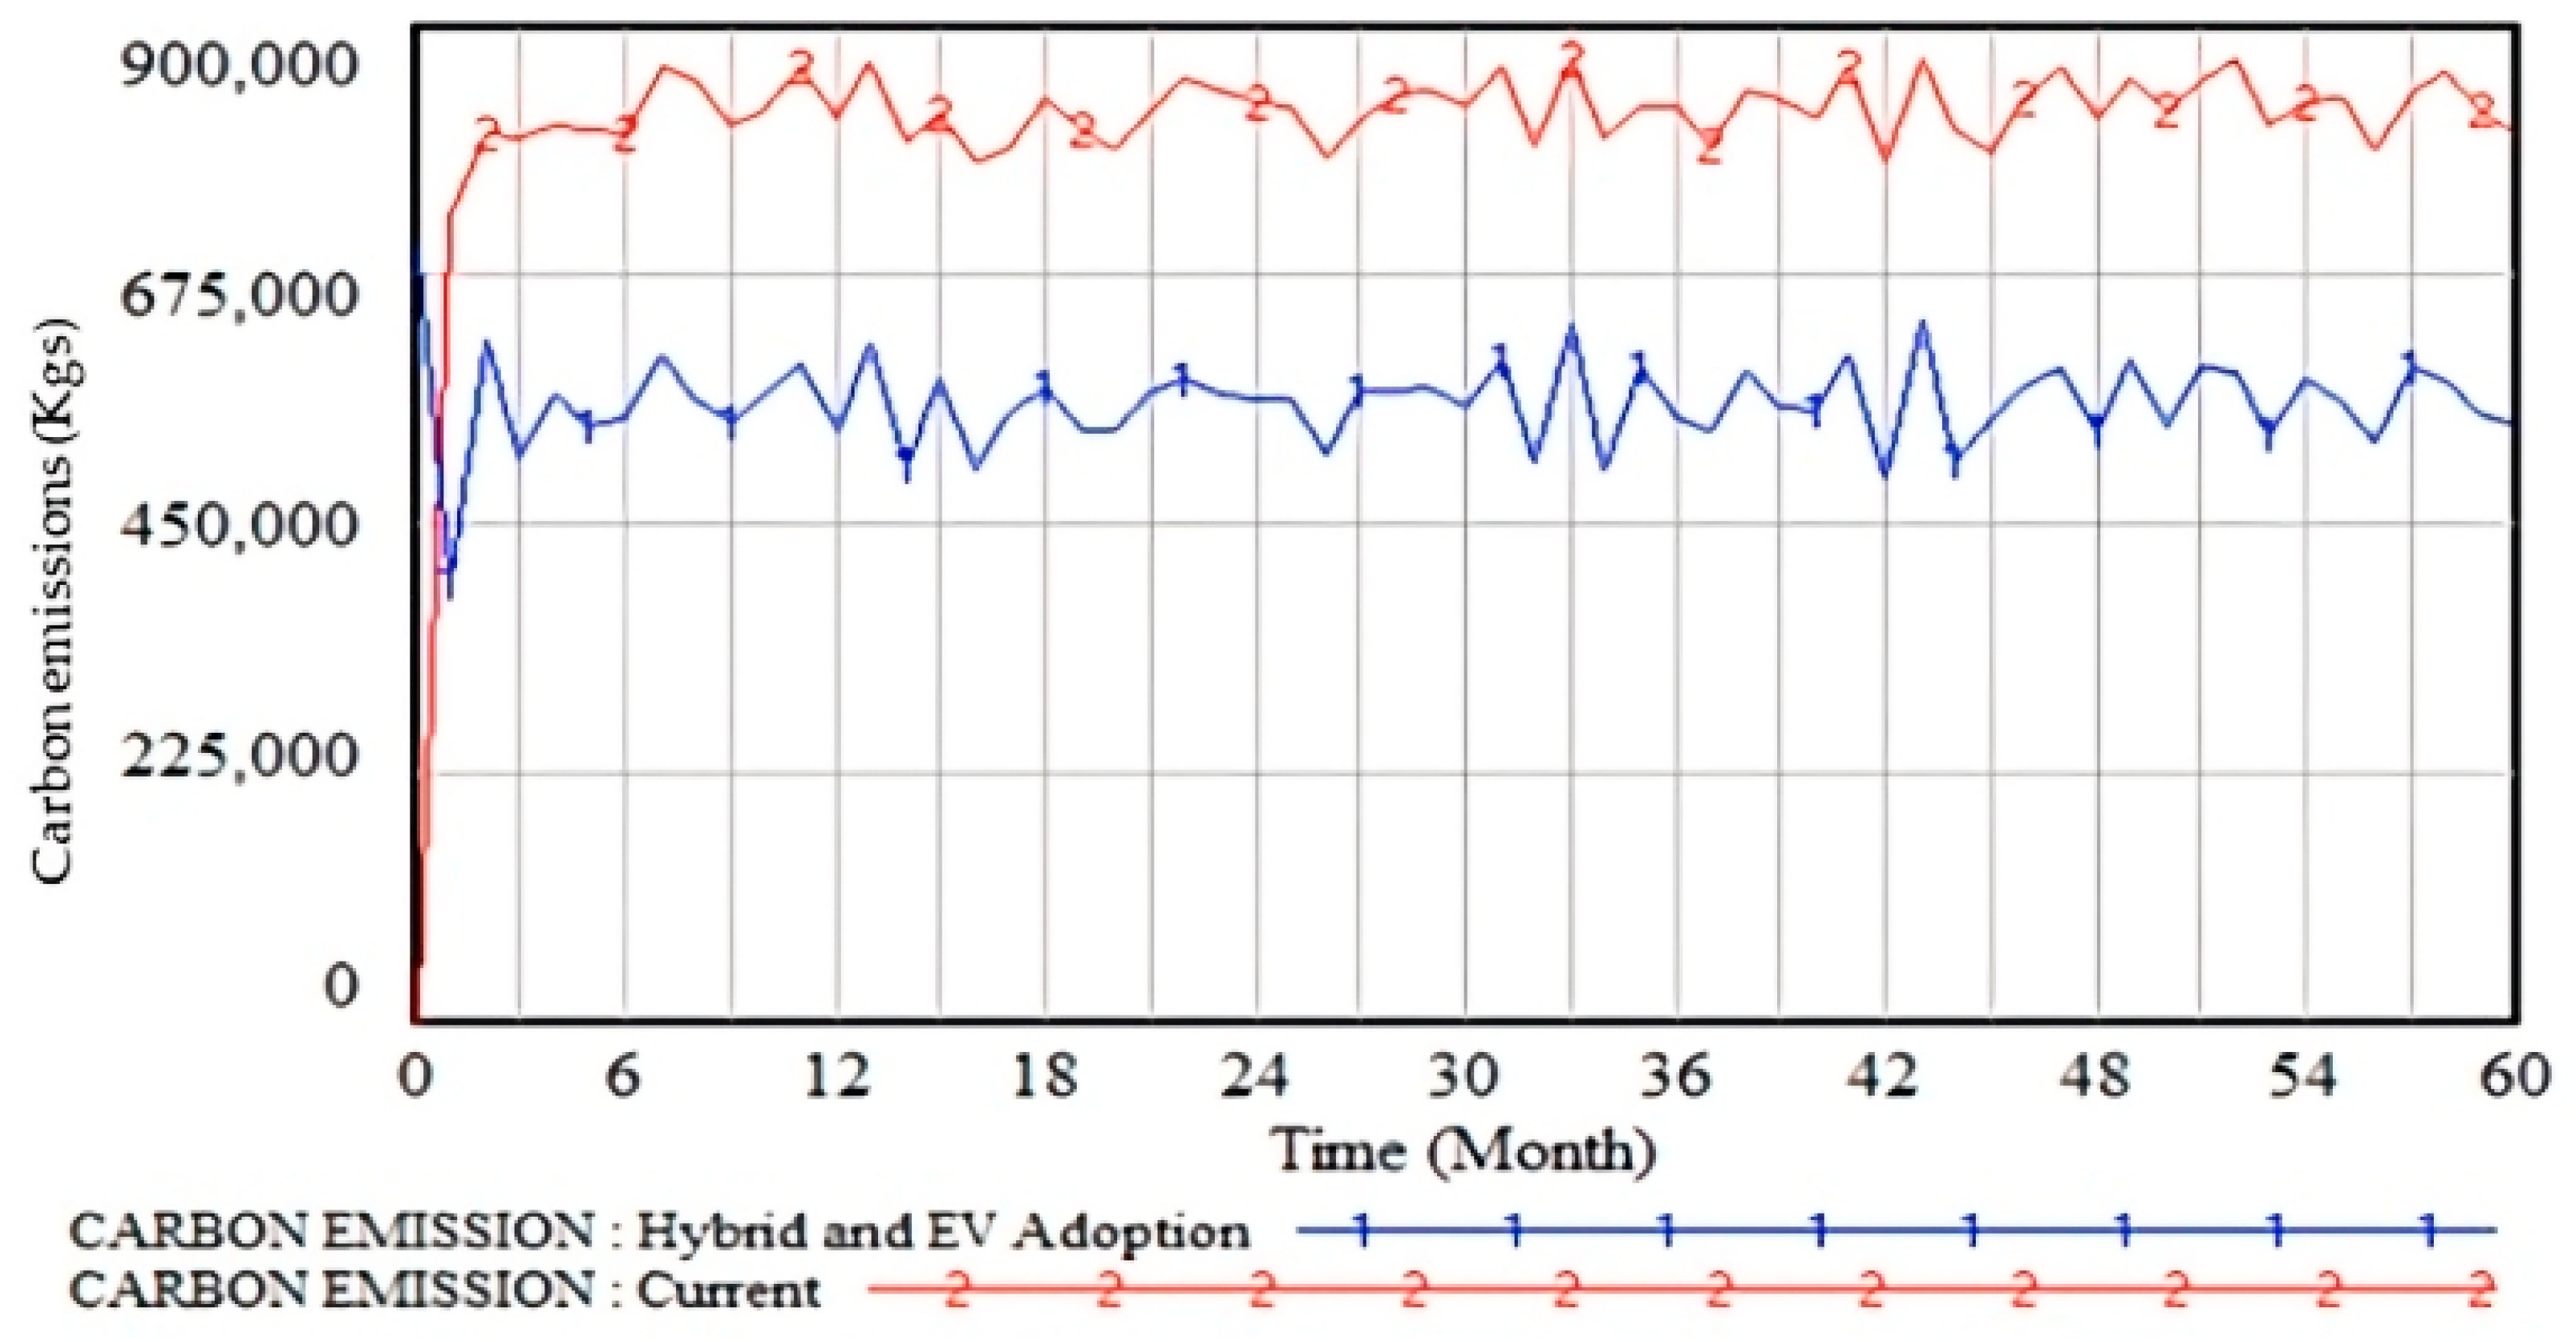
The current system generates significant carbon emissions, primarily driven by fossil-fuel-based vehicles. High mileage and inefficient fuel consumption further contribute to an unsustainable environmental footprint. In the hybrid and EV adoption scenario, carbon emissions are drastically reduced due to the energy efficiency of hybrid vehicles and the zero-emission nature of EVs.
Figure 2 compares carbon emissions under the current process (red line) with the “Hybrid and EV adoption” scenario (blue line) over 60 months.
Figure 2 demonstrates that, under the current situation, carbon emissions often stay high, differing around 800,000–829,000 kg monthly throughout the captured period. However, hybrid and electric vehicle (EV) mixed fleets became more popular, and emissions significantly dropped, with an average 530,000–590,000 kg per month and a 34–38% decrease in overall emissions. Hybrid and EV adoption significantly reduces carbon emissions, showcasing the environmental benefits of transitioning from fossil-fuel-based systems to sustainable vehicle technologies. This demonstrates the financial viability of transitioning to hybrid and EV technologies. The simulation highlights a substantial carbon reduction percentage, showing the environmental benefits of transitioning to cleaner vehicle technologies. Reducing carbon emissions enhances environmental sustainability and aligns with global climate goals, improving the organization’s reputation and compliance with regulatory standards.
5.3. Total Costs
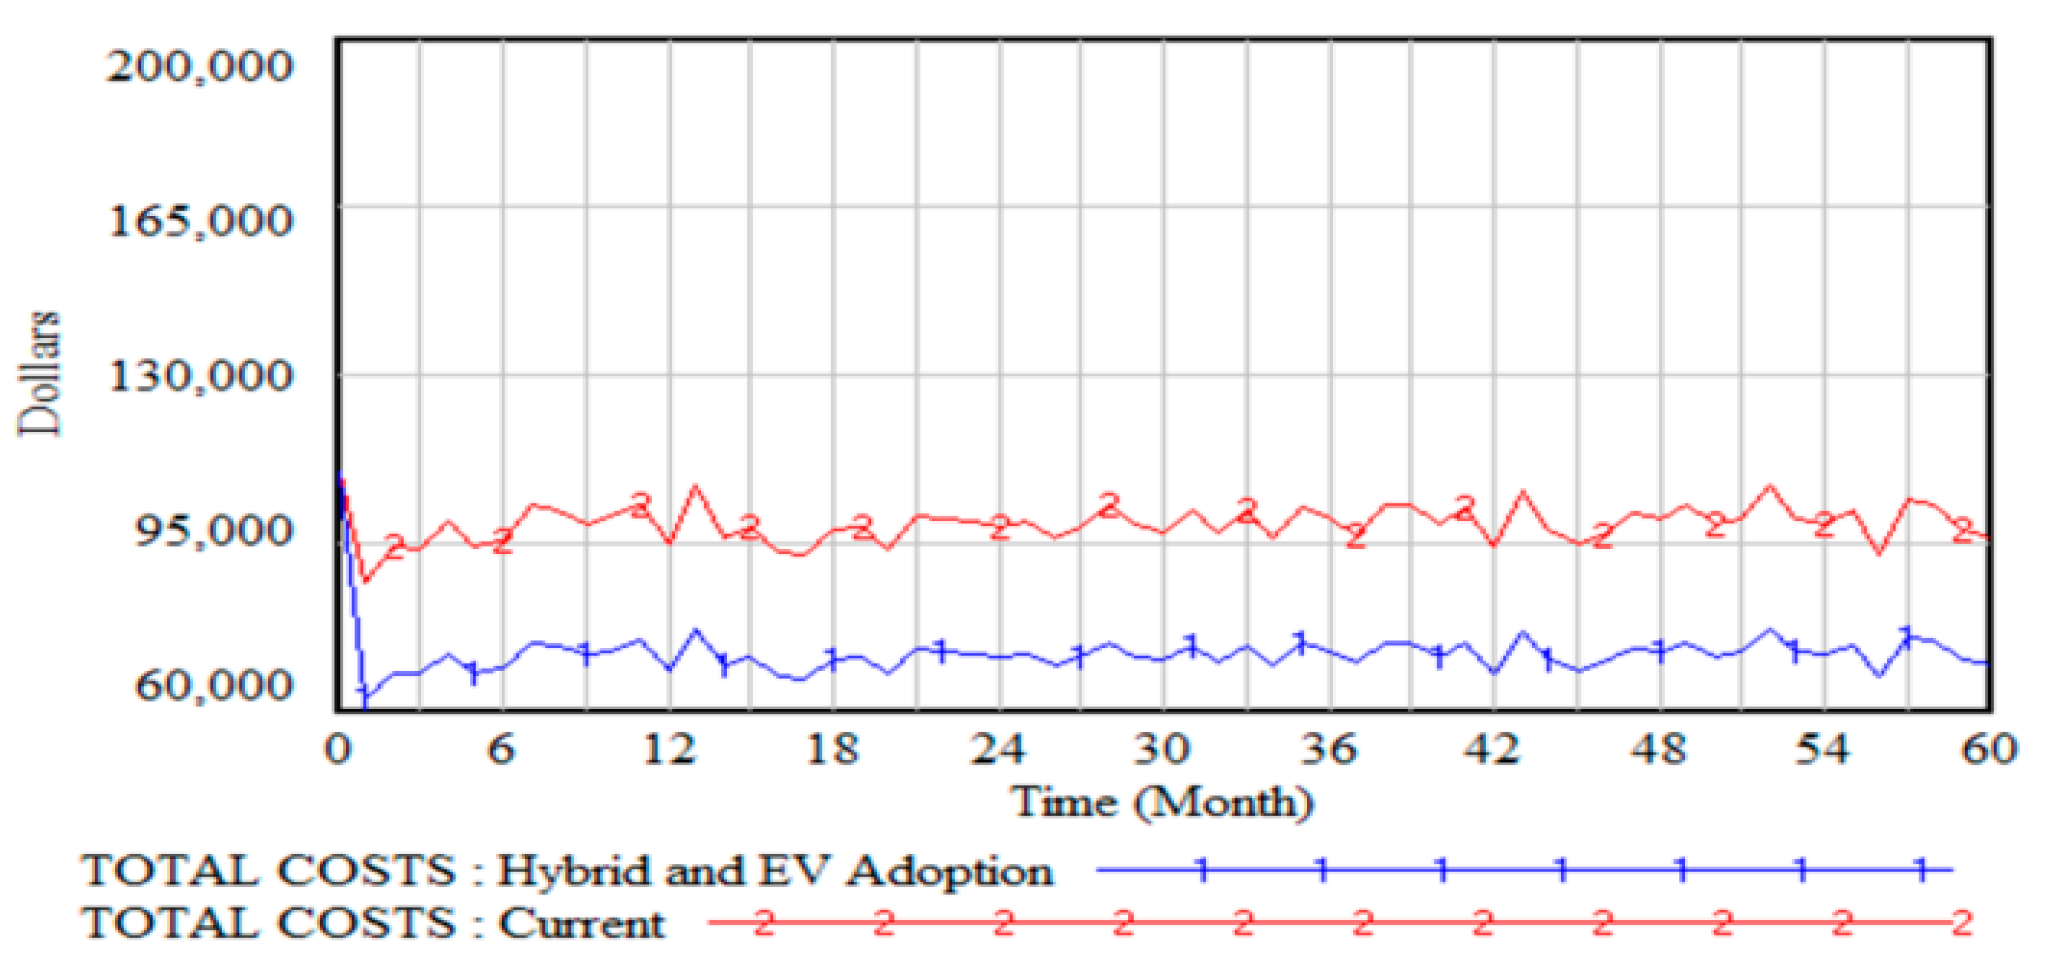
Operational costs are high in the current scenario due to significant spending on fuel, frequent maintenance of older vehicles, and toll fees. Rising fuel prices further exacerbate the cost inefficiencies of the current system.
Figure 3 shows the total costs under the current process (red line) and the hybrid and EV adoption scenario (blue line) over 60 months. In the hybrid and EV adoption scenario, costs remain consistently lower, reducing from approximately USD 95,000 in the current system to around USD 67,000, reflecting a 27–30% reduction in fuel consumption and maintenance expenses. This demonstrates the financial viability of transitioning to hybrid and EV technologies. In the hybrid and EV adoption scenario, total costs decrease significantly, primarily driven by lower fuel consumption, reduced maintenance requirements for EVs, and energy savings. While there is an initial investment in vehicle replacement, the long-term financial benefits outweigh these costs. Hybrid vehicles, in particular, provide a feasible and cost-effective solution for reducing operational costs.
5.4. Total Mileage and Fuel Savings
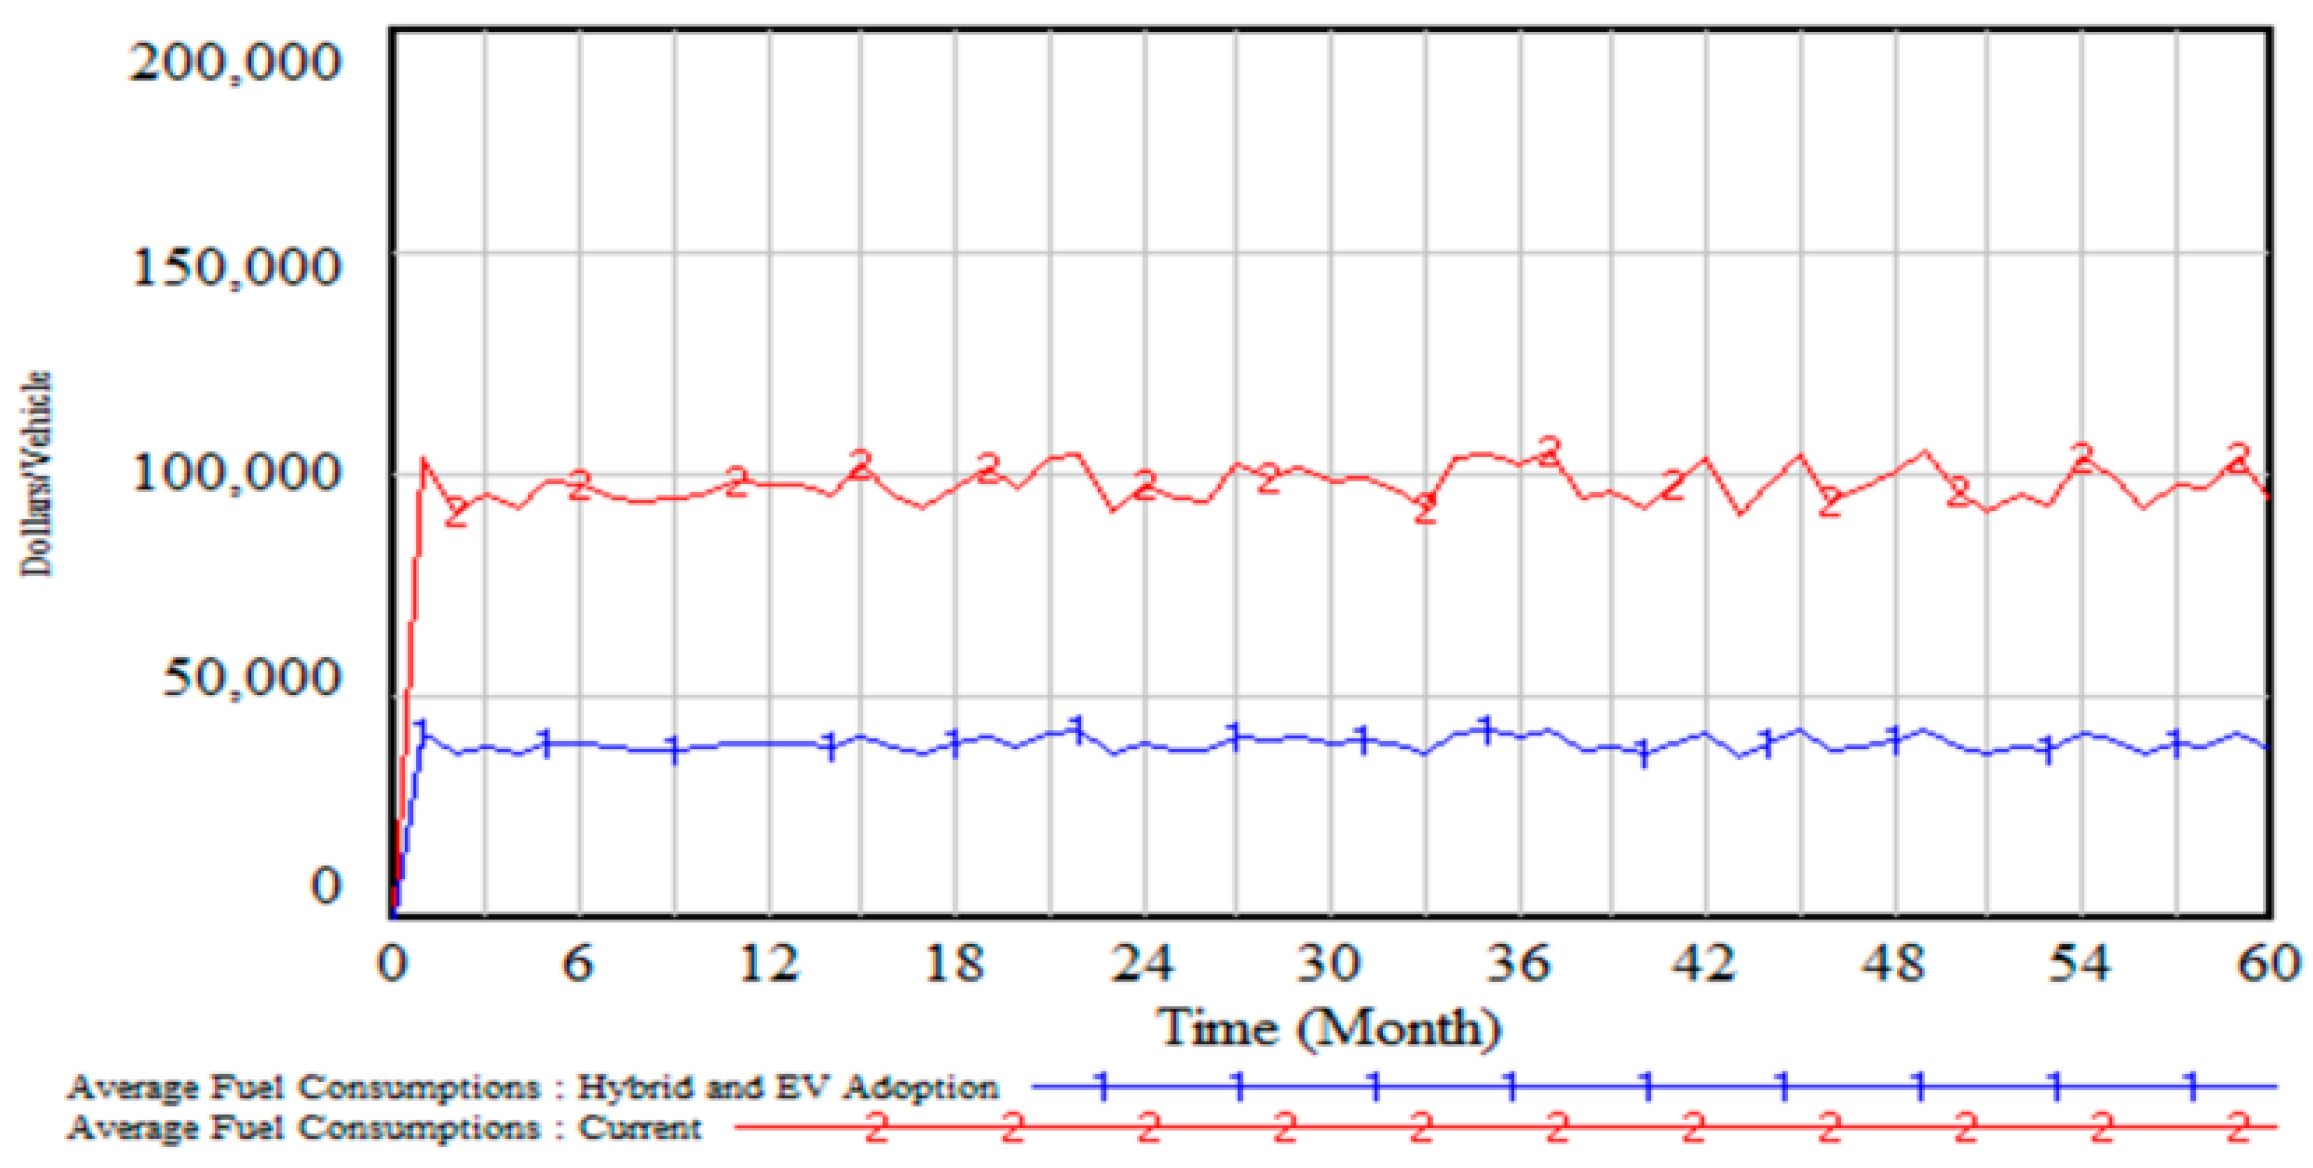
The fleet generates substantial mileage using fossil-fuel vehicles, leading to higher carbon emissions and fuel expenses. The operational inefficiencies of older vehicle technologies exacerbate these challenges.
Figure 4 demonstrates the average fuel consumption under the current process (red line) and the ‘Hybrid and EV adoption’ scenario (blue line) over 60 months. The hybrid and EV adoption scenario significantly reduces fuel consumption, consistently maintaining levels around USD 37,000 compared to the current process, which averages approximately USD 91,000, representing a more than 60% reduction in fuel usage. This highlights the fuel efficiency and cost-saving potential of transitioning to hybrid and electric vehicle technologies. Total mileage remains constant in the hybrid and EV adoption scenario, but the environmental and financial impact per mile is significantly reduced. Hybrid vehicles and EVs demonstrate better mileage efficiency and optimized energy use, improving overall operational efficiency. Transitioning to hybrid vehicles and EVs enhances energy efficiency and maximizes the operational output of mileage, reducing environmental and economic strain.
5.5. Revenues
Revenues in the current scenario are limited by high operational costs, which reduce profitability despite steady earnings per mile.
Figure 5 compares revenues under the current process (red line) and the hybrid and EV adoption scenario (blue line) over 60 months. The hybrid and EV adoption scenario consistently generates higher revenues, reaching approximately USD 2.6 million compared to USD 2.5 million in the current process, representing roughly a 2–3% increase in total revenues. The upfront costs absorb additional revenues from the EV-transformed scenarios; otherwise, the revenues would look much greater than this. This reflects improved profitability due to reduced operational costs and enhanced efficiency with hybrid and EV technologies. The economic inefficiencies of fossil-fuel-based fleets hinder long-term growth potential. In the hybrid and EV adoption scenario, increased profitability is achieved due to reduced operational costs. Lower fuel expenses, minimal maintenance, and the improved reliability of hybrid vehicles and EVs enable better financial performance. Additionally, compliance with environmental regulations avoids potential fines, further supporting revenue growth. Hybrid vehicles, being more readily available for larger trucks, offer a reliable way to boost revenues while transitioning to sustainable practices.
5.6. Fleet Size and Composition
The current fleet comprises fossil-fuel-powered vehicles with varying energy efficiencies and high maintenance needs. Fleet disposal and replacement are infrequent, leading to operational inefficiencies. The hybrid and EV adoption scenario modernizes the fleet with cleaner technologies, reducing fuel dependency and improving overall efficiency. Transitioning to hybrid vehicles is particularly practical given the lack of EV availability for 5-ton trucks, ensuring cost efficiency and reliability while supporting sustainability initiatives. In contrast, the 3-ton EV trucks can be alternative options as the case industry operates approximately 40 trucks that are carrying small loads from one facility to another facility of the farm. The simulated results clearly demonstrate that adopting hybrid and EV technologies offers substantial benefits over the current fossil-fuel-based system. Key variables such as carbon emissions, total costs, revenues, and operational efficiency show marked improvements, making the transition an economically and environmentally sound decision. However, due to the lack of evidence for the feasibility of EVs for 5-ton trucks, hybrid vehicles are the better immediate option. They provide a balanced solution by reducing operational costs, improving sustainability, and ensuring the reliability of transportation operations. Hybrid adoption ensures long-term efficiency while paving the way for the gradual integration of EVs as their technology advances.
Table 7 compares the key variables of two scenarios—current operations and hybrid/EV adoption over 60 months. In the hybrid/EV scenario, average fuel consumption drops significantly, from 39,092 L in month 5 to 37,530 L in month 60, compared to the consistently higher consumption in the current scenario. Carbon emissions also reduce drastically, with 537,967 kg in month 5 under the hybrid/EV scenario versus 807,196 kg in the current scenario, showcasing substantial carbon reduction over time. Revenues are higher in the hybrid/EV scenario, reaching 2.578 million USD in month 60 compared to 2.498 million USD in the current scenario. Adopting hybrid and electric vehicles led to a 34% reduction in carbon emissions, reducing an average of ~810,000 kg in the present scenario to ~540,000 kg over 60 months. In addition, total operating costs decreased by 28%, from USD 95,947 to USD 69,322, consequently highlighting the economic benefit of moving to electric and hybrid fleets. Total costs in the hybrid/EV model are consistently lower, demonstrating cost efficiency through reduced fuel and maintenance expenditures. The number of vehicles and total mileage remains constant across both scenarios, highlighting the operational scale’s stability while improving sustainability and profitability through hybrid/EV adoption. This comparison underscores the economic and environmental benefits of transitioning to hybrid and EV technology.
The above investigation of the operational, financial, and ecological implications of converting to hybrid vehicles and EVs is feasible using the transportation fleet simulation framework developed for the case industry. According to the investigation, adopting EV and hybrid technologies offers multiple benefits, such as lower operating costs, higher revenues, and decreased carbon emissions. The simulation demonstrates how environmentally friendly fleet management strategies may enhance overall efficiency and profitability by including important variables like gasoline use, maintenance, carbon emissions, and revenue generation. The absence of EVs for larger trucks makes hybrids the most feasible option at the moment; however, they additionally provide an equitable approach to reduce reliance on fossil fuels and integrate operations with environmental goals. The company intends to accomplish financial and ecological advantages for the transportation sectors for a long time; this evaluation highlights the importance of specific investments in infrastructure, fleet modernization, and government support. The findings indicate that effectively embracing hybrid vehicles ensures cost savings and operation reliability while providing a foundation for the future integration of electric cars as technology advances.
6. Emerging Opportunities for EV Markets in Developing Nations
Based on the above analyses from the transport fleet model from a case industry, the study listed several emerging opportunities for the EV market in developing nations, which are as follows:
Emerging EV Markets in Developing Nations: Any nation with a growing middle-class population is becoming a potential EV market due to rapid urbanization, which raises environmental awareness. For instance, India, Brazil, South Africa, and Bangladesh are countries with growing populations along with moderate education, infrastructural developments, and technological learning and facilities. These factors create opportunities for EV growth, especially in urban and semi-urban regions.
Barriers to EV Adoption: Despite the promising potential, EV adoption in developing nations remains low due to economic constraints, limited infrastructure, and policy gaps. High upfront costs, inadequate charging infrastructure, and unreliable electricity are common challenges faced in countries like India and Nigeria.
Urban-Centric Market Trends: The EV market in countries like Brazil is largely concentrated in urban centers, with rural areas having limited access. Similarly, India has seen growth in electric two-wheelers and three-wheelers, but the electric car and bus markets remain underdeveloped due to affordability and infrastructure limitations.
Dependence on Imported EV Models: Many nations rely heavily on imported EV models, driving up costs and limiting accessibility for middle- and lower-income groups. The lack of local manufacturing prevents economies of scale, making EVs less competitive and widely affordable.
Progress Through Localized Initiatives: Some countries are making strides through innovative approaches. Kenya has seen growth in electric motorcycles driven by rising fuel costs and local startup support, while Indonesia is leveraging its nickel reserves to attract EV battery manufacturers and promote localized production.
Need for Targeted Policies and Investments: Developing nations must adopt targeted strategies, including promoting affordable EV models, expanding charging infrastructure, and creating incentives. These measures can help address barriers and leverage the growth potential of EV markets across diverse regions and demographics.
7. Recommendations for Tailoring Global Practices to Local Contexts
The above discussions and results were communicated with the industry representatives to verify possible recommendations for local perspectives. Every country is unique in terms of infrastructure, perceptions, capability, and governance. This study finds some useful recommendations for local perspectives based on global practices on EVs.
Promote Affordable EV Models: To cater to price-sensitive consumers, governments must prioritize producing and promoting affordable EV models such as two-wheelers, three-wheelers, and small electric cars. India’s focus on electric scooters and auto-rickshaws is a successful example of targeting affordability and accessibility, making EVs more viable for the general population.
Develop Scalable Charging Infrastructure: Establishing cost-effective and scalable charging infrastructure is essential for widespread EV adoption. Leveraging solar-powered charging stations can address electricity reliability issues while simultaneously integrating renewable energy into the EV ecosystem, reducing the reliance on conventional energy sources.
Implement Tailored Policy Incentives: Clear and consistent policy frameworks, such as subsidies for manufacturers, reduced taxes on EV imports, and concessional financing for buyers, are crucial for lowering barriers to EV adoption. Additionally, region-specific policies should focus on rural electrification and underserved areas to ensure equitable access to EV technology.
Encourage Public–Private Partnerships: Governments should collaborate with private firms to accelerate charging networks and Infrastructure deployment. As demonstrated in the United States, public–private partnerships can ensure widespread coverage, leveraging private sector expertise and investment to create a sustainable EV ecosystem.
Foster International Collaborations: Partnerships with global automakers and battery manufacturers can facilitate technology transfer and reduce production costs. Developing nations should also seek funding from international bodies to support EV initiatives, accelerate local production, and build a robust and sustainable transportation network.
8. Future Consideration: A Balanced Perspective on Partial and Complete EV Adoption
One of the objectives of this study is to consider EVs for future operations. Interestingly, this study finds hybrid vehicles are the most feasible option based on current infrastructure and vehicle availability in the marketplace. However, small EVs and 3-ton EV trucks are available in the market, and future innovation will undoubtedly increase the EV truck capacity. To get ahead of the competition, business houses should consider the future adoption of EV trucks partially on their transport fleet to be more cost-effective. This study shares the output of the model with the respondents and takes further opinions regarding EV trucks. The respondents are cautiously excited about implementing EVs in their fleet, but at the same time, they want to make sure it will help them reduce their long-term costs and bring convenience. The opportunities and challenges below need to be considered while adopting EV trucks in the future.
Lower Operating Costs: EVs will further reduce fuel expenses and decrease maintenance costs because they have fewer moving parts. At the same time, decision-makers must watch the uncertainties and volatility of fuel costs, technological advancement, availability, and other relevant factors.
Higher Energy Efficiency: The respondents believe EVs convert up to 80% of energy into motion, compared to 40% for hybrids and 20–30% for ICE vehicles. They provide a logic of slow-moving Bangladeshi highways supporting EVs. They also mentioned that their farm maintains 24/7 high-capacity generators, and charging will not be an issue. Their different facilities are located within a 150–250-mile radius, supporting their statements. In contrast, energy efficiency is relative based on individual industry perspectives and their operational scopes. Every firm assesses its situation before amalgamating new vehicles in its fleet.
Relatively Stable Energy Costs: Unlike volatile fuel prices, electricity from renewable sources, such as biogas from wastes, can offer predictable and lower costs. Again, stability may change over time as the world is highly concerned about future energy requirements and their sources.
Government Incentives: Tax credits, subsidies, and minimized import duties will help businesses make EV adoption more affordable. However, the government’s future actions are unpredictable, as the policymakers ultimately determine future EV adoption.
Environmental and Regulatory Benefits: Reducing emissions helps businesses comply with carbon tax policies and sustainability targets. Nevertheless, such benefits depend on the behavior of regulatory variables while implementing such vehicles.
Research and Development: The present literature is insufficient in the developing country. Thus, more research and development are expected to expose real-life cases based on quick transportation technological transformation.
Hybrid vehicles serve as a stepping stone in the present scenario from the developing country’s perspective. However, businesses should consider partial or complete EV adoption by investing in infrastructure and tracing industry advancements for long-run economic and ecological benefits.
9. Policy Recommendations
This study also provides short-term, medium-term, and long-term policy recommendations, recognizing that developing nations’ transition to partial or complete EV technology needs to be gradual due to their challenging economic, infrastructural, and policy environments. The transformation is complicated and requires additional expensive infrastructure and customers’ positive perceptions of EV technology.
Short-term policy on introducing incentives and pilot infrastructure projects: In the short term, governments in developing countries should focus on creating financial incentives to make EVs more affordable. For example, subsidies for EV buyers, tax reductions, and concessional financing options can significantly lower consumer entry barriers. The government can put requirements to avail subsidies by encouraging a company to adopt local manufacturing at a certain percentage (e.g., 30–50%) of their fleet need to be electric. Pilot projects to build localized charging infrastructure in urban centers can also serve as test cases for larger-scale implementation. Another example is to create public–private partnerships that can accelerate these projects, ensuring cost-effective solutions and quick deployment. To make it available where energy sources are unstable, solar or wind power renewable energy sources can help to attract people’s attention to EVs. For instance, subsidized solar-powered charging stations could address affordability and energy reliability issues. The respondents from the case industry also opined that their practical knowledge related to EVs is limited, and the government and NGOs did not promote these alternative options. However, they are confident that they can manage charging from Biogas electricity and realistically make it possible to deploy renewable sources like solar and wind. All they need is to receive comprehensive guidance along with subsidies from the government.
Medium-term policy on developing nationwide infrastructure and fostering partnerships: The focus should shift toward expanding EV infrastructure nationwide over the medium term. Developing a comprehensive charging station network, particularly in underserved rural areas, is critical to promoting widespread adoption. Governments must partner with private firms and international organizations to secure funding and technical expertise. For instance, India’s FAME (Faster Adoption and Manufacturing of Electric Vehicles) initiative is a valuable model, combining infrastructure development with policy support. Similarly, Bangladesh has made gradual progress in electric three-wheelers (e-rickshaws), which have gained popularity despite limited charging infrastructure. Countries like Ukraine have also used global partnerships to advance green energy infrastructure and EV regulations, indicating that collaborating with international stakeholders can accelerate the technical development and infrastructure of the structure [
60]. Furthermore, standardizing EV regulations across regions and vehicle categories will reduce uncertainty for manufacturers and investors, encouraging them to participate in the market.
Long-term policies on building renewable-integrated EV ecosystems and robust regulatory frameworks: In the long term, integrating renewable energy into EV ecosystems is essential to maximize their environmental benefits. Investments in renewable energy sources, such as solar and wind, should be prioritized to power EV charging networks sustainably. Robust regulatory frameworks must be established to ensure long-term market stability and innovation. Bangladesh, for example, started solar-powered charging facilities for electric three-wheelers, indicating how distributed renewable energy can be utilized to encourage EV acceptance among regions with unreliable grids. India is also establishing EV charging stations related to solar energy projects to lower EV carbon footprint and improve energy security. In addition, policies that promote domestic EV manufacturing can reduce reliance on imports, lowering costs and boosting local economies. International collaborations can further support the development of technology and infrastructure tailored to the needs of developing nations.
10. Conclusions
This study underlines the potential of HEVs and EVs as sustainable transportation solutions for developing countries and also identifies considerable adoption hurdles. Major issues include poor infrastructure, hefty upfront expenses, and fragmented policy frameworks. The investigation highlights localized approaches geared to emerging nations’ socio-economic and infrastructure realities. The case study scenario analyses of the system dynamics simulation models also demonstrated better outcomes in inducing carbon emission and transportation expenditures through EV adaptation. At the same time, the initial investment goes high along with country and company infrastructures. The repair cost and location are other issues to solve before they go for partial and full EV adoption. Affordable EVs, scalable charging solutions, and targeted financial incentives are needed to close these gaps. The model examines 15% HEV and EV adoption through a simulation model and finds better carbon emission outcomes and reduced costs. When it comes to infrastructure, government policy, and up-front costs, companies are worried about taking all these challenges themselves. The respondents agree that the future is for EVs to minimize costs and protect the environment. They also expect to collaborate with the government, NGOs, and businesses to solve existing bottlenecks better. The case industry also opined that step-by-step progress is the best option to monitor the transformations and their consequences. A complete adoption may have negative consequences, which will be risky for the firm. The promising thing is that the focus on electric two- and three-wheelers in Bangladesh shows the usefulness of creating tactics to meet local needs. However, such scattered developments are insufficient to establish a solid infrastructure to adopt EVS. By adopting these personalized solutions, developing nations may reap the benefits of EVs, including lower emissions, energy security, and economic growth. Governments, industry, and international organizations must collaborate on EV transformation for global and country causes. Worldwide knowledge and funding are needed to speed infrastructure and technology transfer in developing nations. UN and World Bank partnerships can provide finance and technical expertise for significant projects. Collaborations with major automakers and renewable energy sources can reduce costs and innovate. Creating egalitarian and sustainable EV ecosystems that solve local and global issues requires international cooperation. Future studies should examine how cultural norms and consumer behavior affect EV adoption in underdeveloped nations. Social acceptance, environmental awareness, and attitudes toward new technology vary by area and influence market demand. Research should integrate renewable energy sources into EV charging networks because many emerging nations use coal-based electricity. Cost-effective and scalable alternatives like solar-powered charging stations can optimize EVs’ environmental benefits while addressing energy dependability concerns. In poorer countries, longitudinal studies are needed to assess the economic effects of EV adoption. Research should examine how EV adoption affects local manufacturing, job generation, and economic growth. Understanding these dynamics can help policymakers create sustainable environmental and economic solutions.


