Abstract
Eco-driving is a key strategy for reducing energy consumption and emissions in electric vehicles (EVs) and internal combustion engine (ICE) vehicles. However, research gaps remain regarding its effectiveness across different driving environments, vehicle types, transmission systems, and contexts. This research evaluates eco-driving efficiency in urban and interurban settings, comparing small (Caceres) and large (Madrid) cities and assessing EVs ICE with direct, manual, and automatic transmissions. The authors conducted a large-scale driving experiment in Spain, with over 500 test runs across different road types. Results in the large city show that eco-driving reduces energy consumption by 30.4% in EVs on urban roads, benefiting from regenerative braking, compared to 10.75% in manual ICE vehicles. Automatic ICE vehicles also performed well, with 29.55% savings in local streets. In interurban settings, manual ICE vehicles achieved the highest savings (20.31%), while EVs showed more minor improvements (11.79%) due to already optimized efficiency at steady speeds. The small city showed higher savings due to smoother traffic flow, while single-speed transmissions in EVs enhanced efficiency across conditions. These findings provide valuable insights for optimizing eco-driving strategies and vehicle design. Future research should explore AI-driven eco-driving applications and real-time optimization to improve sustainable mobility.
1. Introduction
Transportation significantly contributes to global greenhouse gas (GHG) emissions and energy consumption, accounting for around 25% of total emissions and a considerable portion of urban pollution [1]. The urgent need to address environmental impacts has prompted the exploration of various strategies, one of which is the promotion of eco-driving techniques. These techniques include maintaining constant speed, avoiding sudden accelerations, and anticipating traffic conditions. Research has shown that these practices can significantly reduce fuel consumption and CO2 emissions in vehicles with internal combustion engines (ICEs) [2].
Introducing electric motors has significantly reduced CO2 emissions from road transport, making electric vehicles (EVs) a crucial element in sustainable mobility strategies. However, in addition to the environmental benefits of electrification, optimizing energy consumption remains a significant challenge.
Eco-driving techniques can help maximize battery efficiency and extend the range of these vehicles. Research has demonstrated the relevance of these techniques; however, there are limited studies on their efficiency with automatic transmissions and intercity traffic, where speed variations and energy recuperation are critical to overall efficiency. Recent studies have proposed real-time energy-aware ecological driving control strategies to optimize energy consumption in intelligent electric vehicles, addressing the need for efficient eco-driving techniques in varying traffic conditions [3]. Understanding and quantifying the effectiveness of these strategies is essential for enhancing EV performance and ensuring their successful integration into future transportation networks.
There is substantial research on the impact of EV technologies on eco-driving fuel savings from multiple perspectives, such as driving strategy optimization, stated-preference surveys, traffic simulation, driving simulation, and the use of mobile apps. However, we have found scarce empirical data comparing the savings of ‘normal’ driving behavior and eco-driving with EVs. Similarly, modern automatic transmissions in ICEs are known to be more fuel-efficient than older technologies. Still, there is a lack of data in real traffic conditions on how eco-driving techniques affect their fuel consumption relative to a contemporary manual transmission ICE. Thus, this current research explores the effectiveness of eco-driving techniques in energy savings by comparing the outputs related to present-day EVs, manual ICEs, and automatic ICEs within different road contexts and cities. It also aims to formulate policy recommendations for implementing eco-driving strategies in cities of varying sizes and traffic conditions.
The manuscript is structured as follows: Section 1 introduces eco-driving and its role in energy efficiency, particularly for electric vehicles (EVs). Section 2 reviews existing literature on eco-driving techniques and the impact of transmission types. Section 3 describes the methodology and its application to case studies in Madrid and Caceres, including data collection methods. Section 4 presents the results, analyzing energy savings across vehicle types and road segments. Section 5 discusses key findings, emphasizing the role of transmission type in efficiency, and finally, Section 6 includes the conclusions and policy recommendations for optimizing eco-driving strategies.
2. Literature Review
2.1. Eco-Driving Techniques and Their Impact
Eco-driving has become recognized as an effective strategy for reducing fuel consumption and emissions. Fafoutellis et al. [4] provided a comprehensive overview of technologies and methods for eco-driving. They emphasized the importance of driving behavior, route selection, and data-driven feedback mechanisms in enhancing fuel efficiency. Similarly, Yuhan et al. [5] stressed that eco-driving training and in-vehicle feedback devices can immediately reduce fuel consumption and emissions. Still, they noted that these effects often diminish over time.
Recent studies, including those by García et al. [6], have analyzed eco-driving in small cities, showing its effectiveness even in uncongested environments. Their findings indicate that eco-driving can significantly lower fuel consumption, especially among novice drivers. Additionally, Thibault et al. [7] integrated macroscopic energy models with real-time traffic data to optimize eco-driving techniques for EVs, highlighting their potential for energy savings.
2.2. Applications for Electric Vehicles
The transition to EVs has brought new challenges and opportunities for eco-driving and eco-routing. Bai et al. [8] proposed a hybrid framework based on reinforcement learning to optimize eco-driving strategies for connected and automated vehicles at signalized intersections, resulting in significant energy savings. Similarly, Zhu et al. [9] developed a deep reinforcement learning framework designed for hybrid electric vehicles, demonstrating significant reductions in fuel consumption.
Kavas-Torris and Guvenc [10] evaluated eco-driving strategies for connected and autonomous vehicles (CAVs) using microscopic traffic simulations. They highlighted the potential to improve fuel efficiency while maintaining traffic flow. Chada et al. [11] evaluated user acceptance and driving performance in predictive eco-driving assistance systems for electric vehicles, showing significant improvements in energy savings and driver satisfaction.
These studies emphasize the need to incorporate advanced technologies, such as machine learning and vehicle-to-infrastructure communication, into eco-driving strategies for emerging vehicle technologies.
2.3. Transmission Systems and Their Role in Energy Efficiency
The efficiency of EVs is significantly influenced by their transmission systems. While many EVs utilize single-speed transmissions due to their simplicity and reliability, recent studies suggest that multi-speed transmissions can enhance performance and energy efficiency. For instance, a simulation-based study compared a single-speed reduction gearbox to a five-speed manual transmission in a retrofitted EV, finding that the manual transmission offered higher efficiency under an optimal gear-shifting strategy [12].
Similarly, research on two-speed transmission designs for EVs indicates that reducing the motor’s rotational speed during high-speed driving can improve efficiency, addressing the limitations of single-speed systems at higher velocities [13]. These findings highlight the importance of further investigation into transmission configurations, especially as EV adoption increases. Understanding how different transmission types affect energy consumption across various driving conditions is crucial for optimizing eco-driving techniques and developing more efficient EVs.
2.4. Small Cities and Diverse Contexts
Although eco-driving has been extensively studied in metropolitan areas, there is limited research on its application in smaller cities. Studies, such as those conducted by Coloma et al. [14], have demonstrated that eco-driving can reduce energy consumption in non-congested environments. These findings emphasize the adaptability of eco-driving techniques to different urban dynamics.
Additionally, Xu et al. [15] emphasized the importance of integrating eco-driving with vehicle-to-infrastructure technologies. They suggested that smaller cities could serve as testbeds for innovative eco-driving strategies, given their simpler traffic patterns.
While there is extensive research on eco-driving, there is still a need for detailed studies with real driving data regarding its impact in EVs, according to transmission type in cars with ICE (manual vs. automatic), and among various roadway contexts. This research work covers the following key areas:
- More focus on EVs: most studies prioritize ICE vehicles, resulting in a lack of research on how eco-driving can effectively reduce energy consumption in EVs.
- Understanding the impact on interurban roads: while urban environments have been extensively studied, there is little information on the performance of eco-driving strategies on highways and interurban roads.
- Comparison across diverse urban scales: few studies systematically compare the effectiveness of eco-driving techniques in small cities (e.g., Caceres, Spain) versus large metropolises (e.g., Madrid, Spain).
- Exploring the eco-driving effectiveness regarding the transmission type: Despite the growing interest in eco-driving, there is a limited understanding of how transmission type—manual versus automatic vs. direct—affects energy efficiency under different driving conditions. Given that EVs predominantly feature automatic transmissions, further investigation is needed to determine whether transmission type influences eco-driving effectiveness and energy consumption, particularly in urban versus interurban settings.
3. Materials and Methods
This section describes the tasks needed to obtain comparable time series data to analyze the effect of vehicle type, road context, and city scale on eco-driving energy savings and how they were implemented in the case studies carried out in this investigation in November 2024 in Madrid and Caceres (Spain). The first subsection establishes the scope of this study. Then, the data necessary to attain meaningful results dictate the design of a driving experiment. The planning of the experiment is a crucial step. Finally, the raw data must be prepared and processed after the test to reach the sought-after results. Appendix A includes the details of the eco-driving strategy implementation.
3.1. Scope of the Study
The main variable of this work is the driving style, with two possibilities: the driver knows nothing about eco-driving techniques or knows and applies them. This paper’s practical application selected drivers with no prior eco-driving knowledge.
This study also compares the vehicle type. Following the findings of the literature review, three categories of vehicles were chosen for the case study: combustion engines with manual transmission, combustion engines with automatic transmission, and EVs, which, but for some very niche examples [16,17], always have direct transmissions. Table 1 summarizes the characteristics of the cars available to us during this study. The primary objective has been assessing the proportional impact of eco-driving on energy consumption across three vehicle categories: electric vehicles (EVs), internal combustion engine (ICE) vehicles with manual transmission, and ICE vehicles with automatic transmission. Rather than focusing on absolute fuel or energy savings, our approach evaluates the relative reduction in consumption achieved through eco-driving techniques. Figure 1 shows the electric vehicles used in Caceres and Madrid.

Table 1.
Summary of the cars that were utilized in the experiment.
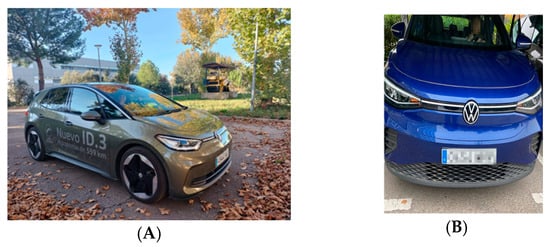
Figure 1.
Electric cars used in the experiment. (A) ID.3 in Caceres. (B) ID.4 Madrid.
The characteristics of the road also influence the effectiveness of eco-driving principles. Accordingly, the experiment is replicated in different routes (scenarios) that could have various types of road sections. The case study selected to apply the driving experiment includes routes in Madrid, as an example of a large metropolis with a complex transportation network and high urban density (5460 inh/km2), and Caceres as a small city, which is located in the largest municipality in Spain (1750 km2) with a population of 96,441 inhabitants (55 inh/km2) [18]. Figure 2 shows their location on the Iberian Peninsula and two pictures illustrating their typology.
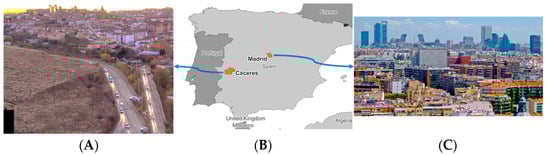
Figure 2.
Map of the case study. (A) Caceres. (B) Location of both cities. (C) Madrid.
Based on the possible number of interruptions on a road segment, the routes followed in the driving experiment were categorized into three types of road sections: local street, arterial urban road, and interurban road, which includes all the non-urban road sections in the study area. Table 2 illustrates the characteristics of the road sections, exhibiting the variations in length, speed limits, and average slope across different road types extracted from the experiments in Madrid and Caceres.
Table 2.
Road sections characteristics.
Road segments of the Madrid experiment are located more on the urban network of local (39.05 km) and arterial urban roads (50.19 km) compared to Caceres (8.23 km and 33.71 km, respectively). In contrast, Caceres’ experiment covers more interurban roads (214.42 km) than Madrid (114.69 km). Speed limits differ between the two cities. While local streets in Madrid range from 20 to 30 km/h, the Caceres case study allows a broader range of 20 to 40 km/h. Madrid’s arterial metropolitan roads have a speed limit of 30–50 km/h, while Caceres allows greater speeds of 40–80 km/h. Both cities have interurban roads with speed limits ranging from 80 to 120 km/h.
In terms of average slope, Madrid’s local streets (3.2%) have a somewhat higher gradient than those in Caceres (2.8%), but arterial urban (2.6%) and interurban roads (2.3%) in Madrid have softer slopes than those in Caceres (3.3% and 2.9%, respectively). These variances illustrate the disparities in road infrastructure and terrain between the two cities that are likely to affect energy consumption on the road.
To ensure consistency, each vehicle is driven under two conditions: first, in a conventional driving style without prior eco-driving knowledge and then applying eco-driving techniques after a dedicated training session. The same drivers operate the same vehicles in both conditions, eliminating variability due to differences in driving habits or vehicle characteristics. This methodology provides practical insights into the effects of eco-driving. However, it does not aim to represent the full diversity of vehicle models available on the market today.
3.2. Experiment Design and Planning
This experiment requires two sets of data. The vehicle’s on-board diagnostic (OBD) holds the first one, which is used to compute the vehicle’s energy consumption (‘’) and traveled distance (‘’) between consecutive readings and . In the EVs of our case study, OBDs provide their battery history data as accumulated values in kWh of electric energy discharged (‘’) and charged (‘’, due to regenerative braking) at the time of the ith reading. The balance (‘’) of these measurements between readings and provides the energy consumption of the electric car during that period. In ICEs, the OBD reports the evolution of the fuel consumption rate (volume/time). Calling the instant when the ith reading occurs ‘’ and the average fuel consumption rate between readings and ‘’, the fuel volume spent between and (‘’) is known. Finally, could also be calculated using a conversion factor (energy/volume) [19] ‘’ corresponding to the fuel under use. Equation (1) shows these formulas. In our case study, we accessed the real-time consumption through the OBD II protocol [20]. Since this measurement is not part of the open part of the specification, we had to choose a proprietary device compatible with a manufacturer group that produces several car brands popular in Spain, shown in Figure 3.
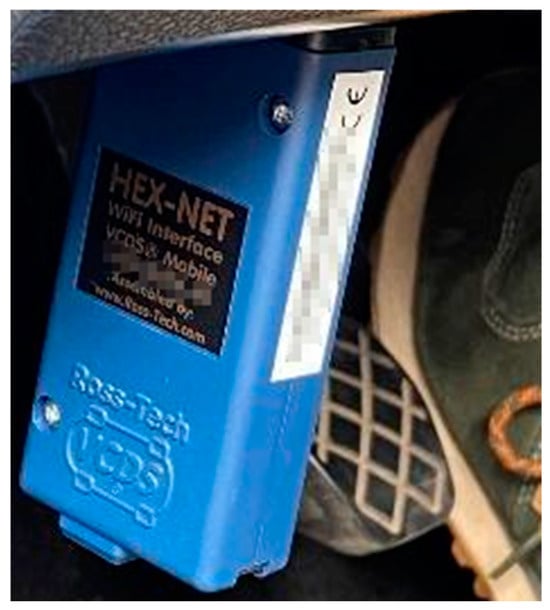
Figure 3.
Ross-Tech VCDS HEX-NET device used to extract data from the cars’ OBD systems.
In a similar manner, the traveled distance can be calculated knowing , , and the corresponding average speed (‘’), also obtained from the OBD, as Equation (2) shows. It is worth mentioning that European regulations compel car companies to use speedometers that consistently report a speed less or equal to the real one, with a maximum error of 4 km/h plus 10% of the actual speed [21]. Similar regulations are in effect globally to ensure drivers do not inadvertently exceed the speed limit. Thus, the OBD reading should always be lower than what the speedometer at the dashboard shows, particularly at higher speeds.
The second data set’s main variable is the vehicle’s position over time, which is used to classify the consumption data according to road type. It is obtained from smartphone navigation sensors. We provided test drivers with mobile phones with an app developed by researchers from the Computer Science Faculty of the University of Extremadura (UEx) that records its position according to its navigational sensors. Moreover, we also recorded the vehicles’ speeds using a mobile phone. This was carried out because, unlike the mobile phone data, the OBD records were not in sync with the official time in our case study. Speed records from both data sources allowed us to find the lag between them and sync their readings. Also, as explained in the next paragraph, we substituted OBD speed readings with navsat speed readings when the former was inaccurate in one of the vehicles of our case study.
The accuracy of the sensors utilized during the experiment should be considered. Particularly, speed can present challenges. On the one hand, navsat relies on the Doppler shift of the signals coming from the satellites and can be very precise, especially if the refresh rate is frequent enough to correctly measure speed during twists and turns (e.g., in the ±0.5 km/h to ±0.2 km/h or even lower) [22,23]. However, factors that decrease satellite visibility, like weather phenomena, vegetation, buildings, or tunnels, degrade navsat performance. On the other hand, the accuracy of a car’s sensors in measuring speed relies on knowing the tires’ circumference. Thus, any alteration in their dimensions (e.g., replacing tires, changing their pressure, the effect of wear and tear) will require recalibrating the speed sensors of the car. The case study of this paper utilizes OBD speed readings of all vehicles except the EV in a small city, where navsat speed was used instead. Further explications are shown in Section 3.3.1.
Test subjects should have no prior knowledge of eco-driving to attain comparable and meaningful results. They should drive the same route in the same traffic circumstances, first driving as usual and then applying eco-driving. In the case study, this was achieved by scheduling the driving sessions of each subject in the same periods during the peak hours of consecutive, similarly behaving days (i.e., working days from Tuesday to Thursday). After the first session, the subjects attended a seminar showing them the eco-driving techniques they had to apply during the second one.
Electric vehicles’ autonomy must also be considered while designing the experiment since the capacity of their batteries will likely not be enough to carry out the whole experiment. In our case study, the UPM provided exclusive access to an electric charger in the parking lot, while in Caceres, it was necessary to schedule visits to a fast-charging station.
The operations during the experiment should be organized to safely make efficient use of everyone’s time and available resources. Drivers should follow pre-designed routes that cover the road categories of interest and start and end in convenient locations for changing shifts, parking the vehicles, and conducting eco-driving seminars. Driving turns should be scheduled with a time margin relative to the worst expected times of the routes, preventing shift start time delays. In the case study, we had the vehicles available for two days. The chosen start locations were the Universidad Politécnica de Madrid (UPM) and the School of Technology of the UEx. The design of the driving turns considered Google Maps’ worst travel time estimate for the data and time of the experiment, adding a margin of at least fifteen min. The drivers operated the vehicles during the busiest traffic hours for no more than three consecutive hours each, less than the legal limit in Spain (four and a half hours). Table 3 illustrates the organization of shifts and schedules in each city. In Madrid, operations were carried out in morning, midday, and afternoon shifts. In contrast, Caceres utilize four consecutive shifts, two in the morning and two in the afternoon. It is important to note that Caceres is a small city and does not experience traffic congestion throughout the day.
Table 3.
Driving turns schedule.
A copilot was necessary to help the driver navigate the specified route safely, manage the data recording equipment, and annotate each route’s conditions and unexpected events, for instance, what the weather was like or whether there was any detour or incident. In this paper’s case study, the role of the copilots was crucial. In a few instances, they detected communication losses between the OBD device and the recording laptop and could resume recording with minimal loss. In one case, a traffic disturbance impeded fully following the planned route, and the copilot swiftly contacted the researchers to decide the best alternative course. The Madrid use case hired thirteen students, four women and nine men, who acted as pilots or copilots according to their availability and possible roles. In Caceres, the experiment was conducted by nine students: five men and four women. Some students could only be copilots because the rental car insurance would not cover them.
The organizers should provide each pilot–copilot team with the means to make their task as safe and easy as possible, with printed and digital help to follow the programmed route. We supplied our teams with a booklet that summarized all the runs that had to be made, how files should be named for unequivocal identification, and navigation information, both as printed maps and as QR codes that loaded in Google Maps the route that had to be followed so they could use the app’s navigation assistance. Since Google Maps provides the ‘best’ route between an origin and a destination by default and our routes were designed to gather enough data for each road type instead, we had to fix multiple intermediate points in the app to ensure its route coincided with ours.
3.3. Data Preparation
This section describes the transformations applied to the raw data recorded by the OBD and the mobile phone until the data needed to study how eco-driving efficiency changes depending on the type of vehicle, city, and road were ready. The output of this section should be a table for each route, providing the information shown in Table 4:
Table 4.
Output of pre-processing the data from each route.
Figure 4 and Figure 5 show an example of the raw OBD data from two driving sessions of the same person with an ICE manual car in Caceres on consecutive days (before and after the eco-driving seminar) at the same hour and following the same 42 km route. Traffic conditions were similar in both sessions. The average speed and consumption were 67 km/h and 2.56 L for normal driving and 65 km/h and 2.34 L for eco-driving. Speeds are slightly lower and smoother while eco-driving, reducing unnecessary accelerations and braking. The annotation ‘A’ in both figures highlight the interurban segment of the route, where speeds were much more uniform when applying eco-driving techniques. Eco-driving also requires anticipating traffic, reducing the number of full stops, as seen in the last 10 min of the route (annotation ‘B’, one stop instead of three). The eco-driving techniques helped to attain a reduction in consumption of 8.6%.
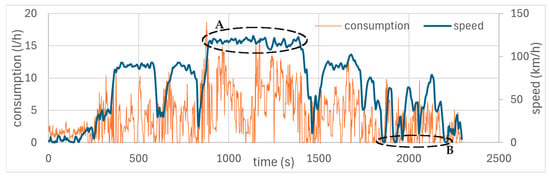
Figure 4.
Speed and consumption of a driver in a manual ICE vehicle following one of the routes of the experiment on a working Wednesday around 10:30, before learning eco-driving techniques, where, A highlights the interurban segment of the route and B refers to one stop.
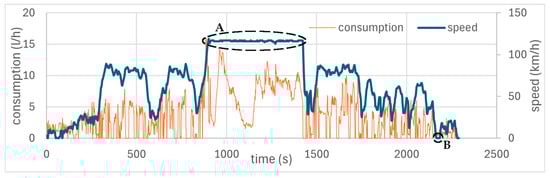
Figure 5.
Speed and consumption on the same conditions (driver, vehicle, route, time) the following day (a working Thursday), after learning eco-driving techniques, where, A highlights the interurban segment of the route and B refers to one stop.
3.3.1. Calculate the Lag Between OBD and Mobile Phone (If Necessary)
A later step (Section 3.3.4) requires labeling each datum recorded by the OBD according to the road type where the vehicle was at that moment. In our case study, the latter was obtained from a navsat trajectory recorded with a medium-segment mobile phone. We faced the obstacle that the time series provided by the two devices are not synchronized: the OBD sets t = 0 each time it starts recording. At the same time, our mobile phone app reported navsat readings with Coordinated Universal Time (UTC) timestamps. Depending on how OBD and navsat data are available in other case studies, this step may or may not be needed.
In our case study, we solved this issue by comparing the vehicle speeds provided by the OBD and the mobile phone’s navsat sensors. As can be seen in the example of Figure 6, both devices provide very similar records, which were used to determine the lag between their time series for each driving session. This way, we could link through time fuel consumption from the OBD to the positions of the vehicle from the mobile phone.
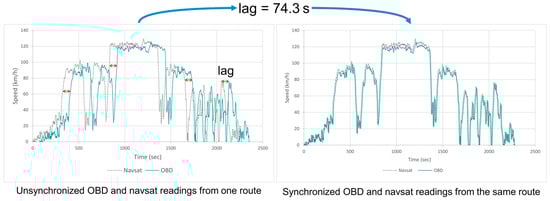
Figure 6.
Synchronization of OBD device and mobile phone readings during a driving session.
3.3.2. Account for Missing or Useless Data
The second step is to check for any gaps in the data due to reported or unreported issues during the experiment, like driving off the route or OBD connectivity failures. Figure 7 shows an example from the use case, where the OBD device did not record for several minutes until the copilot could start the recording again. This incident will create two time series from the OBD, with different lag values with respect to the mobile phone data.
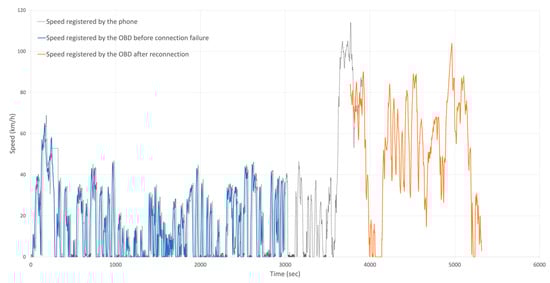
Figure 7.
Example of a driving session where the connection to the OBD was lost for 10 min.
Also, the corresponding data outside the routes should be excluded if the stipulated routes were not followed. In our case study, this happened on two occasions: once, due to public works in one of the routes that made the drivers deviate for a few minutes until they got back on track, and on another occasion, due to human error.
3.3.3. Resampling
The time series data from the OBD devices and mobile phones should be converted to the same sampling frequency. In this paper, we downsampled the data to 1 Hz using average pooling: all data points within each second were averaged to create a single representative.
3.3.4. Road Type Identification
The next step is to label the data according to the road type the vehicle is on in each instant. To this end, the boundary events when the vehicle enters and exits each road type should be identified. All measurements between these belong to the same road type. We used a Jupyter Notebook (version 6.5.2) running Python 3.10.8 to visualize the vehicles’ trajectories in our use case.
After this, the output of the preparation step will be ready. Table 5 and Table 6 show samples from two driving sessions:
Table 5.
Sample from a driving session in a car with a combustion engine and manual transmission.
Table 6.
Sample from a driving session in an electric car.
3.3.5. Data Processing
This section’s objective is to calculate the energy savings that eco-driving causes in each of the scenarios (‘’) that arise from classifying the data: three (car types, ‘’) × three (road types, ‘’) × two (city types, ) = eighteen scenarios, as Equation (3) illustrates.
The savings in each scenario (‘’) are calculated as the reduction in the average consumption rate, measured as energy/length, expressed as a percentage. As shown in Equation (4), ‘’ identifies the driving mode, and ‘’ is the average consumption attained in scenario (e.g., an electric car on urban collector roads of a metropolis), while driving in mode (e.g., ‘’). Equations (5) and (6) show the formulas for electric and combustion cars, respectively. In the latter case, the relative energy savings are independent of the fuel type.
After the relative energy savings are calculated for all scenarios, the following section presents and analyses them.
4. Results
This section illustrates and explains the results of the experimentally recorded benefits of applying eco-driving techniques. The benefits presented in the current study are the reduction in aggressive acceleration/deceleration and the savings in energy (fuel/battery) consumption for electric (single-speed transmission) and combustion (manual and automatic transmission) vehicles.
First, it is worth presenting the global effect of eco-driving by exploring the driving behavior among various vehicle types to have the sense of reduction in aggressive behavior presented in the acceleration and deceleration, as well as the change in driving parameters that affects energy consumption, such as average speed and vehicle stopping time. Table 7 shows these parameters extracted and calculated from the clean dataset for manual ICEs, automatic ICEs, and EVs in Madrid and Caceres.
Table 7.
Driving behavior among vehicle types.
Table 7 presents the results related to the effect of eco-driving on improving speed homogeneity, which is represented by a reduction in aggressive (maximum) acceleration and deceleration. It makes sense that eco-driving techniques would result in lower acceleration and deceleration (means and standard deviation), indicating more harmonic flow, better traffic efficiency, and consequently energy savings [24]. In addition, compared to ICE vehicles, EVs most likely exhibit reduced acceleration and deceleration, suggesting smoother braking, which is related to their power in regenerative braking.
In addition, compared to eco-driving, the brisker acceleration/deceleration in normal driving yields a slightly higher average speed and shorter stop durations (when expressed per distance). Furthermore, EVs’ instant torque and regenerative braking maintain higher average speeds and exhibit shorter stop intervals. In a comparison between Madrid and Caceres, the lighter traffic flow conditions in small cities provided higher average speeds and shorter durations of vehicle stops.
On the other hand, the direct results of this investigation, indicated by the energy consumption (L/100 km, kWh/100 km), are shown in Table 8. However, to be comparable (for different vehicle types), the reduction in these consumptions (the energy savings) of eco-driving techniques in the experiment scenarios is provided in Figure 8. It distinguishes the results by road type (local, arterial, and interurban) and vehicle type (manual ICE, automatic ICE, and EV). Additionally, it provides the results for Madrid and Caceres cities, representing a large and a small city, respectively.
Table 8.
Fuel (energy) consumption among different driving behaviors.
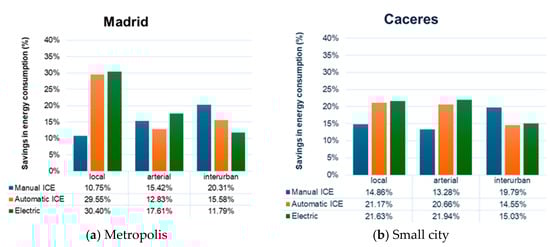
Figure 8.
Eco-driving savings in each of the eighteen scenarios of the experiment.
Figure 8 shows a variety in energy consumption reduction (%) among the factors studied in the metropolis (Madrid). In the local streets, the eco-driving benefits achieved with automatic ICEs and EVs (29.55%, 30.40%) are triple those with manual ICEs (10.75%). This is likely related to the efficiency of their transmissions in stop-and-go circumstances. The automatic ICE vehicles of our experiment use dual-clutch transmissions, which provide higher efficiency than conventional automatic transmissions [25]. In contrast, due to instant torque, EVs’ single-speed transmission can stop the car entirely with little or no energy wasted (no idling). The reason behind the greater benefits of eco-driving with automatic ICE and single-speed EVs may be that operating a vehicle on local streets during peak hours requires the most attention and a higher rate of driving operations. Drivers may struggle to apply newly acquired eco-driving techniques, particularly if they have relatively little experience, as in our experiment. Since automatic ICEs and single-speed EVs efficiently take some of the workload from the subjects, they can concentrate on the other principles of eco-driving besides adequate gear shifting: speed moderation, increasing the distance to the previous car, situational awareness, avoiding sudden accelerations, and anticipating the evolution of nearby traffic to minimize breaking.
In the case of arterial road segments, the reduction related to eco-driving techniques is moderate and relatively similar for the three vehicle types (manual ICEs: 15.42%, automatic ICEs: 12.83%, and EVs: 17.61%). A possible reason for the highest reduction in EVs is that smoother driving allows the EVs’ regenerative braking to capture more kinetic energy instead of utilizing their conventional braking systems. The manual ICE surpasses the automatic ICE in this scenario, possibly because the less demanding driving conditions allow for better gear shift operation. In the automatic ICE vehicle, even though anticipating traffic and avoiding unnecessary stops reduces fuel consumption, the driver’s control over efficiency is limited by being unable to change gears when deemed appropriate. In conclusion, ICEs show low to moderate energy consumption reduction due to eco-driving, but they are less efficient than EVs in Madrid’s congested arterial roads.
On the other hand, looking at roads outside urban environments (interurban roads, such as motorways and highways) provided different results. The manual ICE gained the best savings in interurban road segments (20.31%) compared to the automatic ICE and electric vehicles (15.58%, 11.79%). Mainly, this is related to maintaining a relatively constant speed and avoiding unnecessary acceleration, which significantly improves fuel economy in the manual ICE. The drivers have likely been able to fully apply the eco-driving techniques in interurban traffic’s less demanding driving conditions. The automatic ICE shows a moderate benefit level (15.58%) due to smoother shifting, avoiding aggressive acceleration, and fewer downshifts. For EVs, eco-driving has fewer benefits because EV performance is already high at steady speeds. Nevertheless, avoiding excessive speed causes some energy savings (11.79%).
Figure 8, in contrast, shows the results by road type and vehicle type in Caceres (a small city). A similar pattern regarding the reduction by vehicle type has resulted in urban roads in Caceres City (local street and arterial road). These results are likely related to the fact that the traffic streaming conditions in arterial roads are comparable to that of local streets in small cities. Smooth acceleration, effective regenerative braking in EVs, and smooth gear transmission on urban roads provided better benefits for EVs and automatic ICEs than manual ICEs. However, anticipating traffic still reduces fuel wasted by stops and starts, providing good fuel savings by eco-driving using a manual ICE.
Interurban roads permit less aggressive acceleration and maintaining steadier speeds, reducing energy losses. Accordingly, the benefit of eco-driving is significant in the case of manual ICEs. In contrast, the higher efficiency of EVs and automatic ICEs at steady speed conditions means the savings are not higher than those registered by manual ICEs.
Furthermore, the results of contrasting large and small cities could be explained in two main observations. First, a manual ICE is more beneficial in small cities when comparing eco-driving savings on local streets. This may be caused by smoother traffic and fewer stops related to congestion in small cities. For the same reason, the benefits related to eco-driving presented by EVs and automatic ICEs are less than those offered in a large city. Second, in small cities, a higher average speed and more consistent traffic flow on arterial roads are demonstrated in higher energy savings and better performance, which resulted in a similar pattern to the local street.
Finally, these results could be summarized according to vehicle type. If the gear shifting is optimized in manual ICEs, providing smooth acceleration and maintaining driving momentum, a notable reduction in fuel consumption could be obtained, especially on interurban roads. Smooth driving in automatic ICEs minimizes gear shifting and enhances fuel economy. In EVs, regenerative braking and avoiding high values of acceleration/deceleration maximize their energy consumption efficiency, especially in urban roads.
5. Discussion
Our study reveals that eco-driving practices significantly enhance energy efficiency across various vehicle types and driving conditions. Notably, the impact of eco-driving varies between urban and interurban settings. In urban areas, characterized by frequent stops and variable speeds, eco-driving can substantially reduce fuel consumption and CO₂ emissions. For instance, a study by Lovejoy and Handy [26] found that eco-driving tactics, such as smooth acceleration and deceleration, can improve fuel economy and reduce tailpipe emissions per mile traveled.
When comparing different city sizes, the effectiveness of eco-driving remains significant. Research indicates that eco-driving strategies benefit large, congested cities and smaller urban areas. Sanguinetti et al. [27] explored how a smartphone-based eco-driving application influenced driver behavior in different urban contexts. Their findings demonstrated that drivers in smaller cities adopted eco-driving techniques more consistently, leading to more significant reductions in fuel consumption. In comparison, traffic congestion sometimes hindered the full benefits of eco-driving interventions in larger cities.
The type of vehicle propulsion also plays a crucial role in eco-driving outcomes. While traditional ICE vehicles improve fuel efficiency through eco-driving, EVs exhibit distinct advantages. A study by Zhen et al. [28] highlighted that eco-driving trajectory planning for EVs in urban environments can reduce energy consumption without compromising mobility.
Furthermore, our findings align with previous research emphasizing the potential of multi-speed transmission for increased energy efficiency. Vehicles with multi-speed transmission can optimize motor operating points, enhancing energy savings. Lacock et al. [12] examined how multi-speed transmission configurations in EVs can reduce energy consumption by dynamically adjusting gear ratios based on driving conditions, demonstrating efficiency gains in urban and interurban environments. This is consistent with studies that have shown the benefits of multi-speed gearboxes in improving the efficiency of electric drivetrains. For example, research by Han et al. [29] demonstrated that co-optimizing speed and gearshift control in battery electric vehicles using preview information can lead to greater energy efficiency than typical approaches.
Collectively, these insights underscore the multifaceted benefits of eco-driving across different environments, city sizes, vehicle types, and transmission systems. Our research contributes to this body of knowledge by demonstrating that tailored eco-driving practices can lead to substantial energy savings and emission reductions across diverse driving scenarios.
The main limitation of this study is that the drivers were young university students between 20 and 28 years old. Even though in at least one study, fuel savings due to eco-driving training resulted independently of age [30], more research covering all age groups would be necessary. Also, the cultural and legal environment of the experiment (Spanish society and driving regulations) may limit the extrapolation of its findings to other situations.
Another limitation is the lack of control over the vehicle warm-up period. Since engine oil, transmission oil, and other drivetrain components require time to reach optimal operating temperature, their impact on energy efficiency could be significant, particularly in internal combustion engine (ICE) vehicles. Previous studies suggest that conventional vehicle transmissions may take up to 30 min to fully warm up, which could influence fuel consumption and driving efficiency [31]. In the case of electric vehicles (EVs), the absence of a hot engine or aftertreatment devices near the transmission could result in different warm-up characteristics, which remain largely unexplored. While our study focused on real-world driving conditions without differentiating between warm-up and fully stabilized driving periods, future research should consider incorporating temperature data to refine energy efficiency assessments.
Also, the scope of this research is necessarily limited by the available resources: three different car models during two days in two different cities. For instance, we cannot compare the environmental impact of manual shifting transmission and automatic shifting technologies.
Lastly, there is the inherent variability in vehicle specifications, particularly engine power and efficiency, across the models used in the experiment. While our primary objective was to evaluate the proportional impact of eco-driving rather than absolute fuel or energy consumption differences, variations in engine displacement and manufacturer-specific efficiency may have influenced the results. For instance, the automatic ICE vehicles tested in our study include models with different engine capacities (e.g., 1000 cc vs. 2000 cc), which could inherently affect fuel efficiency regardless of driving behavior. Additionally, as the study was conducted with the vehicles available to us, the findings may not be fully generalizable to all vehicle types and configurations currently on the market. Nevertheless, the real-world driving approach provides valuable insights into the effectiveness of eco-driving techniques across different vehicle categories. Future research should aim to standardize vehicle selection further and expand the sample to encompass a broader range of powertrains and driving conditions.
6. Conclusions
This study has comprehensively analyzed the impact of eco-driving techniques on energy efficiency across different driving environments, vehicle types, and transmission systems. Our findings demonstrate that eco-driving can significantly reduce energy consumption in both EVs and ICE vehicles. However, its effectiveness varies depending on urban versus interurban settings, city size, and transmission type. Key findings include the following:
Eco-driving benefits all vehicle types but is most effective for EVs and automatic ICE vehicles in urban environments. In dense traffic conditions with frequent stop-and-go movements, EVs showed the highest energy savings due to regenerative braking and optimized power management. Automatic ICE vehicles also benefited, although to a lesser extent, due to their smoother acceleration and better idling control.
Manual transmissions perform better in interurban settings. Unlike urban environments where frequent gear shifts can reduce efficiency, manual ICE vehicles demonstrated more significant fuel savings in interurban scenarios, where maintaining a steady speed minimizes unnecessary acceleration. This aligns with prior research highlighting the energy-saving potential of manual transmissions in highway driving [32].
City size influences eco-driving effectiveness. In smaller cities like Caceres, eco-driving led to more consistent savings across different road types due to lower congestion and smoother traffic flow. In contrast, in larger cities like Madrid, eco-driving strategies were less effective on arterial roads due to frequent disruptions caused by congestion, reinforcing the need for adaptive eco-driving policies based on an urban scale [33].
Transmission type plays a crucial role in energy efficiency. Our review found that multi-speed transmission in EVs could improve energy savings by optimizing motor efficiency across varying speeds. Several studies advocate for multi-speed gearboxes in electric drivetrains to enhance efficiency under diverse driving conditions [34].
These results provide valuable insights for policymakers, vehicle manufacturers, and urban planners. The implementation of eco-driving strategies should be tailored based on road type, city size, and vehicle characteristics to maximize energy efficiency.
One of the key challenges in improving eco-driving and eco-routing applications is the need for high-quality empirical data to calibrate predictive models effectively. Future research should focus on generating and analyzing real-world driving data to enhance the accuracy and reliability of eco-routing tools, such as the EcoTraffic App [35]. By integrating empirical insights into these applications, researchers can refine energy consumption models, optimize route recommendations, and improve overall system efficiency. This approach will enable the development of more effective, data-driven strategies for energy-efficient driving, benefiting individual drivers and broader transportation networks.
Author Contributions
J.B. was responsible for the experiment conducted in Madrid, while M.G. oversaw the experiment in Caceres. Both contributed to the writing of the manuscript. T.M. handled the analysis of the driving data, and J.F.C. collaborated on the essays and contributed to the manuscript writing. All authors have read and agreed to the published version of the manuscript.
Funding
This research is part of the project TED2021-132696B-I00 funded by Spain’s Ministry of Science, Innovation and Universities (MCIN) through the State Research Agency (AEI) with grant id MCIN/AEI/10.13039/501100011033/ and by the European Regional Development Fund (ERDF), “A way to build Europe”.
Institutional Review Board Statement
Not applicable.
Informed Consent Statement
Not applicable.
Data Availability Statement
The data presented in this study are available on request from the corresponding author.
Acknowledgments
The authors would also like to thank Santano Automoción Volkswagen and Audi dealership for providing the cars used in Caceres.
Conflicts of Interest
The authors declare no conflict of interest.
Appendix A. Eco-Driving Strategy Implementation
To ensure a standardized and replicable approach to eco-driving, this study applied a structured set of eco-driving principles during the experimental phase. The strategies implemented by the drivers were divided into key areas, focusing on acceleration patterns, gear selection, speed moderation, and anticipation techniques. These strategies were adapted according to the vehicle type and road environment:
- 1.
- Acceleration and Deceleration Control
Drivers were instructed to apply gradual and smooth acceleration instead of aggressive throttle inputs.
Braking was minimized by allowing the vehicle to decelerate naturally whenever possible, with EV drivers maximizing regenerative braking to recover energy.
In manual ICE vehicles, drivers were advised to shift gears at lower RPMs to avoid excessive fuel consumption.
- 2.
- Gear Selection Optimization (for manual ICE vehicles)
Early upshifting was encouraged, shifting to higher gears as soon as possible without overloading the engine.
Engine braking was utilized where appropriate to reduce fuel usage without unnecessary braking.
- 3.
- Speed Moderation and Cruise Control
Drivers were instructed to maintain a steady speed, avoiding unnecessary fluctuations.
Maintaining a moderate yet constant speed on interurban roads was emphasized as it leads to lower fuel or energy consumption.
Where applicable, cruise control was used to maintain optimal speeds, particularly for automatic ICE and single-speed EVs.
- 4.
- Anticipation and Traffic Awareness
Participants were trained to anticipate traffic flow, reducing unnecessary stops and sudden speed changes.
Sufficient distance was maintained between vehicles to allow for smoother braking and acceleration.
Navigation apps were used to predict congestion and adjust driving patterns accordingly.
- 5.
- Vehicle-Specific Strategies
EVs: Maximizing regenerative braking, avoiding rapid acceleration, and preemptive energy management were emphasized.
Automatic ICE vehicles: Smoother acceleration techniques and coasting when feasible were applied.
Manual ICE vehicles: Efficient gear shifting and controlled acceleration were prioritized.
These eco-driving techniques were systematically implemented during the second driving session, allowing for direct comparisons with conventional driving styles.
References
- IEA–International Energy Agency-IEA. Available online: https://www.iea.org/reports/global-energy-review-co2-emissions-in-2021-2 (accessed on 7 January 2025).
- Garcia-Castro, A.; Monzon, A. Using floating car data to analyse the effects of ITS measures and Eco-driving. Sensors 2014, 14, 21358–21374. [Google Scholar] [CrossRef]
- He, H.; Liu, D.; Lu, X.; Xu, J. ECO Driving Control for Intelligent Electric Vehicle with Real-Time Energy. Electronics 2021, 10, 2613. [Google Scholar] [CrossRef]
- Fafoutellis, P.; Mantouka, E.G.; Vlahogianni, E.I. Eco-driving and its impacts on fuel efficiency: An overview of technologies and data-driven methods. Sustainability 2021, 13, 226. [Google Scholar] [CrossRef]
- Huang, Y.; Ng, E.C.Y.; Zhou, J.L.; Surawski, N.C.; Chan, E.F.C.; Hong, G. Eco-driving technology for sustainable road transport: A review. Renew. Sustain. Energy Rev. 2018, 93, 596–609. [Google Scholar] [CrossRef]
- García, M.; Coloma, J.F.; Wang, Y. Eco-Driving in Small Cities. Driving Performance in Relation to Driver’s Profile. In Transportation Research Procedia; Elsevier: Amsterdam, The Netherlands, 2018; Volume 33, pp. 267–274. [Google Scholar]
- Thibault, L.; De Nunzio, G.; Sciarretta, A. A Unified Approach for Electric Vehicles Range Maximization via Eco-Routing, Eco-Driving, and Energy Consumption Prediction. IEEE Trans. Intell. Veh. 2018, 3, 463–475. [Google Scholar] [CrossRef]
- Bai, Z.; Hao, P.; Shangguan, W.; Cai, B.; Barth, M.J. Hybrid Reinforcement Learning-Based Eco-Driving Strategy for Connected and Automated Vehicles at Signalized Intersections. IEEE Trans. Intell. Transp. Syst. 2022, 23, 15850–15863. [Google Scholar] [CrossRef]
- Zhu, Z.; Gupta, S.; Gupta, A.; Canova, M. A Deep Reinforcement Learning Framework for Eco-driving in Connected and Automated Hybrid Electric Vehicles. IEEE Trans. Veh. Technol. 2021, 73, 1713–1725. [Google Scholar] [CrossRef]
- Kavas-Torris, O.; Guvenc, L. A Comprehensive Eco-Driving Strategy for Connected and Autonomous Vehicles (CAVs) with Microscopic Traffic Simulation Testing Evaluation. arXiv 2022, arXiv:2206.08306. [Google Scholar]
- Chada, S.K.; Görges, D.; Ebert, A.; Teutsch, R.; Subramanya, S.P. Evaluation of the Driving Performance and User Acceptance of a Predictive Eco-Driving Assistance System for Electric Vehicles. Transp. Res. Part C Emerg. Technol. 2022, 153, 104193. [Google Scholar] [CrossRef]
- Lacock, S.; du Plessis, A.A.; Booysen, M.J. Electric Vehicle Drivetrain Efficiency and the Multi-Speed Transmission Question. World Electr. Veh. J. 2023, 14, 342. [Google Scholar] [CrossRef]
- Jeong, W.; Han, J.; Kim, T.; Lee, J.; Oh, S. Two-Speed Transmission Structure and Optimization Design for Electric Vehicles. Machines 2023, 12, 9. [Google Scholar] [CrossRef]
- Coloma, J.F.; García, M.; Wang, Y.; Monzón, A. Green eco-driving effects in non-congested cities. Sustainability 2018, 10, 28. [Google Scholar] [CrossRef]
- Xu, Z.; Jiang, T.; Zheng, N. Developing and analyzing eco-driving strategies for on-road emission reduction in urban transport systems-A VR-enabled digital-twin approach. Chemosphere 2022, 305, 135372. [Google Scholar] [CrossRef] [PubMed]
- White, E. Honda Is Reportedly Developing a Synthetic Manual Transmission for EVs. Available online: https://insideevs.com/features/693877/toyota-ev-manual-transmission-tested/ (accessed on 27 January 2025).
- Sean, O. Ford Made an Electric Mustang with a Manual Transmission. Available online: https://www.theverge.com/2019/11/5/20950148/ford-electric-mustang-manual-prototype-stick-shift-lithium-sema-2019 (accessed on 27 January 2025).
- Ministerio de Economía. Web del INE. Available online: https://www.ine.es/ (accessed on 16 January 2024).
- Sustainable Energy Authority of Ireland Conversion Factors. Available online: https://www.seai.ie/data-and-insights/seai-statistics/conversion-factors (accessed on 22 January 2025).
- CSS Electronics OBD2 Explained-A Simple Intro. 2024. Available online: https://www.csselectronics.com/pages/obd2-explained-simple-intro (accessed on 22 January 2024).
- Economic Commission for Europe of the United Nations (UN/ECE). Regulation No 39-Uniform Provisions Concerning the Approval of Vehicles with Regard to the Speedometer Equipment Including Its Installation; Publications Office of the European Union: Luxembourg, 2010; pp. 40–48. [Google Scholar]
- VBOX Automotive GPS Accuracy. Available online: https://vboxautomotive.co.uk/index.php/en/how-does-it-work-gps-accuracy (accessed on 19 February 2025).
- Martucci, A.; Cerasuolo, G.; Petrella, O.; Laracca, M. On the calibration of GNSS-based vehicle speed meters. Sensors 2020, 20, 591. [Google Scholar] [CrossRef]
- Coloma, J.F.; García, M.; Fernández, G.; Monzón, A. Environmental Effects of Eco-Driving on Courier Delivery. Sustainability 2021, 13, 1415. [Google Scholar] [CrossRef]
- Vacca, F.; De Pinto, S.; Karci, A.E.H.; Gruber, P.; Viotto, F.; Cavallino, C.; Rossi, J.; Sorniotti, A. On the energy efficiency of dual clutch transmissions and automated manual transmissions. Energies 2017, 10, 1562. [Google Scholar] [CrossRef]
- Lovejoy, K.; Handy, S. Policy Brief on the Impacts of Eco-driving on Passenger Vehicle Use and Greenhouse Gas Emissions Technical Background Document; California Air Resources Board of the California Environmental Protection Agency: Washington, DC, USA, 2013. [Google Scholar]
- Sanguinetti, A.; Kurani, K.; Davies, J. The many reasons your mileage may vary: Toward a unifying typology of eco-driving behaviors. Transp. Res. D Transp. Env. 2017, 52, 73–84. [Google Scholar] [CrossRef]
- Zhen, H.; Mosharafian, S.; Yang, J.J.; Velni, J.M. Eco-driving Trajectory Planning of a Heterogeneous Platoon in Urban Environments. IFAC-Pap. 2022, 55, 161–166. [Google Scholar] [CrossRef]
- Han, K.; Li, N.; Kolmanovsky, I.; Girard, A.; Wang, Y.; Filev, D.; Dai, E. Hierarchical Optimization of Speed and Gearshift Control for Battery Electric Vehicles Using Preview Information. In Proceedings of the 2020 American Control Conference (ACC), Denver, CO, USA, 1–3 July 2020; pp. 4913–4919. [Google Scholar]
- Jeffreys, I.; Graves, G.; Roth, M. Evaluation of eco-driving training for vehicle fuel use and emission reduction: A case study in Australia. Transp Res D Transp Env. 2018, 60, 85–91. [Google Scholar] [CrossRef]
- Jehlik, F.; Iliev, S.; National Laboratory, A.; Wood, E.; Gonder, J. Investigation of Transmission Warming Technologies at Various Ambient Conditions; SAE International: Warrendale, PA, USA, 2017. [Google Scholar]
- Fei, X.; Wong, S.V.; Azman, M.A.; Liu, P.; Han, Y. Investigation of Drive Performance of Motors in Electric Loaders with Unequal Transmission Ratios—A Case Study. World Electr. Veh. J. 2024, 15, 459. [Google Scholar] [CrossRef]
- Coloma, J.F.; Garcia, M.; Boggio-Marzet, A.; Monzón, A. Developing Eco-Driving Strategies considering City Characteristics. J. Adv. Transp. 2020, 2020, 2083074. [Google Scholar] [CrossRef]
- Kim, J.; Ahn, J.; Jeong, S.; Park, Y.G.; Kim, H.; Cho, D.; Hwang, S.H. Driving Control Strategy and Specification Optimization for All-Wheel-Drive Electric Vehicle System with a Two-Speed Transmission. World Electr. Veh. J. 2024, 15, 476. [Google Scholar] [CrossRef]
- Sánchez-Cordero, I.; Lozano-Pinilla, J.R.; Mántaras, D.A.; Benavente, J.; Coloma, J.F.; García, M.; Luque, P.; Monzón De Cáceres, A.; Rivadeneira Muñoz, A.M.; Vicente-Chicote, C. Eco-Traffic APP: Una arquitectura orientada a servicios para la identificación de eco-rutas y de tramos adecuados para eco-driving. In Actas de las XIX Jornadas de Ciencia e Ingeniería de Servicios (JCIS 2024); Resinas, M., Ed.; Sistedes: Gipuzkoa, Spain, 2024. [Google Scholar]
Disclaimer/Publisher’s Note: The statements, opinions and data contained in all publications are solely those of the individual author(s) and contributor(s) and not of MDPI and/or the editor(s). MDPI and/or the editor(s) disclaim responsibility for any injury to people or property resulting from any ideas, methods, instructions or products referred to in the content. |
© 2025 by the authors. Published by MDPI on behalf of the World Electric Vehicle Association. Licensee MDPI, Basel, Switzerland. This article is an open access article distributed under the terms and conditions of the Creative Commons Attribution (CC BY) license (https://creativecommons.org/licenses/by/4.0/).