Abstract
Extracting 3D skeletons from point clouds is a challenging task in computer vision. Most existing deep learning methods rely heavily on supervised data requiring extensive manual annotation. Consequently, re-labeling is often necessary for cross-category applications, while the process of 3D point cloud annotation is inherently time-consuming and expensive. Simultaneously, existing unsupervised methods often suffer from significant skeleton point deviations due to limited capabilities in modeling local structures. To address these limitations, we propose Graph-SENet, an unsupervised learning-based graph neural network method for skeleton extraction. This method integrates dynamic graph convolution with a multi-level feature fusion mechanism to more comprehensively capture local geometric relationships. Through a multi-dimensional unsupervised feature loss, it learns the structural representation of skeleton points, significantly improving the precision and stability of skeleton point localization under annotation-free conditions. Furthermore, we propose a graph autoencoder structure optimized by cosine similarity to predict topological connections between skeleton points, thereby recovering semantically consistent and structurally complete 3D skeleton representations in an end-to-end manner. Experimental results on multiple datasets, including ShapeNet, ITOP, and Soybean-MVS, demonstrate that Graph-SENet outperforms existing mainstream unsupervised methods in terms of Chamfer Distance and F1-score. It exhibits superior accuracy, robustness, and cross-category generalization capabilities, effectively reducing manual annotation costs while enhancing the completeness and semantic consistency of skeleton recovery. These results validate the application potential and practical value of Graph-SENet in 3D structure understanding and downstream 3D analysis tasks.
1. Introduction
Skeleton extraction, as a core task of object shape analysis, aims to extract an abstract representation from image data or point cloud data that characterizes the object’s geometric structure and topological connectivity. This compact skeletal structure not only preserves the key topological features of the original object’s shape (such as branches, loop structures, or hierarchical relationships), but also provides an essential description for understanding the object’s geometric attributes, motion patterns, and functional characteristics, serving as a bridge connecting low-level geometric data and high-level semantic understanding. Currently, skeleton extraction technology has been widely applied in many fields, such as shape recognition, 3D reconstruction [1,2,3], segmentation [4,5], shape matching [6,7], pose estimation [8,9,10], action recognition [11], and agricultural cultivation management [12].
In recent decades, researchers have conducted extensive research on object skeleton extraction [13,14,15,16,17,18]. Due to the lack of depth information, 2D images struggle to effectively describe object occlusion and overall structure [19], limiting their application in complex scenes. With the development of 3D sensing technology, research has gradually shifted towards information-richer 3D point cloud data [20,21,22]. Furthermore, to achieve complete skeleton modeling, how to reasonably topologically connect the extracted skeleton points is also one of the key issues, and related research has also been conducted on the effective connection of skeleton points [23,24,25]. This paper will summarize the various aforementioned methods along with their advantages and limitations.
Skeleton extraction algorithms based on 2D images: In 2D images, the skeleton is represented as the object’s centerline extracted through thinning operations. Currently, skeleton thinning algorithms are mainly divided into two categories [13,14,15]: iterative (pixel-based) and non-iterative (non-pixel-based). Iterative methods use pixels as the basic unit and extract the skeleton by progressively iterating to remove non-skeleton pixels from the image. This type of method has the advantages of algorithm simplicity and ease of implementation, but it heavily relies on the binarization quality of the image and is susceptible to noise. Furthermore, multiple iterative operations may also incur significant computational costs. Non-iterative methods are typically based on geometric or mathematical transformations, calculating global image information to directly generate the skeleton from a global perspective. This type of method mainly includes distance transform, curvature calculation, and watershed methods. These methods greatly reduce computational overhead, but they are prone to producing pseudo-skeletons for images with complex structures or multi-connected regions. Although 2D image data has been widely used in skeleton extraction tasks, its lack of depth information prevents it from reflecting the object’s 3D morphology in space. This easily leads to problems such as skeleton positioning deviation and loss of structural information, making it difficult to meet the demand for high-precision spatial structure reconstruction.
With the development of computer vision and 3D sensing and scanning technology, the acquisition of point clouds has become more convenient than ever before. 3D point clouds not only provide richer spatial information, but also faithfully represent the geometric morphology and detailed structure of objects, providing more detailed data support for skeleton extraction in complex scenes. Therefore, many researchers have applied 3D point cloud technology to skeleton extraction tasks. Performing object structure analysis in 3D space has higher robustness and accuracy. Currently, skeleton extraction algorithms based on 3D point clouds can be roughly divided into the following three categories:
Traditional Geometry-Based Skeleton Extraction Algorithms: This category of algorithms primarily relies on information such as geometric proximity, topological connectivity, and curvature to extract compact representations of target shapes. The core objective of these methods is to reduce redundancy while preserving the intrinsic structure of the original shape as much as possible, thereby enhancing the efficiency of shape analysis and processing. Among them, Cao et al. [26] proposed a Laplacian-based contraction algorithm for skeleton extraction. By iteratively optimizing Laplacian smoothing constraints, it causes the point cloud to gradually contract inward while maintaining the overall topological structure, generating the object’s skeleton representation after multiple iterations. As this method requires constructing adjacency relationships using k-nearest neighbors (KNN) and a Laplacian matrix, it demands that the input point cloud model possesses sufficient point density and is noise-free. Consequently, Huang et al. [27] proposed an L1-medial skeleton extraction algorithm for extracting and smoothing skeletons from point cloud models. This method can generate object skeletons from incomplete data through distance field optimization and global constraints. However, this approach only achieves favorable results when the object’s point cloud shape is simple, and the construction of the distance field requires voxelization, where the voxel resolution parameter directly impacts the result quality. Tagliasacchi et al. [28] introduced a generalized Rotational Symmetry Axis (ROSA) method, which can effectively extract skeletons from incomplete point cloud models. Nonetheless, this method assumes the object shape is cylindrical and requires accurate point normals, while also necessitating preprocessing for noise and outliers, lacking generality for non-cylindrical object shapes. Jiang et al. [29] proposed a graph-contraction-based skeleton extraction algorithm. This method treats the tree skeleton as a combination of edge and node relationships and defines a corresponding energy function. This function consists of a contraction term and a topology-preserving term that prevents the point cloud from contracting in local principal directions. The contraction term constraints the minimization of the sum of graph geodesic distances to the k-nearest geodesic neighbors. It then extracts the contracted tree skeleton points via downsampling and performs topological connections. However, this method involves high computational complexity as it requires recalculating graph geodesics at each iteration.
Although traditional geometric methods have achieved considerable success in skeleton extraction tasks at the current stage, in practical applications, they are sensitive to noise and sampling density, entail significant computational overhead, and require fine-tuning of parameters for different objects to obtain better skeleton extraction results. These limitations make them difficult to apply in complex 3D scenes. In recent years, with the development of deep learning technology, deep learning-based skeleton extraction methods have gradually become a research hotspot. Such methods utilize data-driven approaches for feature learning, extract structural information from point clouds, avoid tedious parameter adjustment, and possess stronger adaptability and generalization capabilities.
Methods based on supervised deep learning: Zhou et al. [30] used the PointNet network combined with a ridge regression loss to extract features from human body point cloud data at the point level, achieving human skeleton point extraction under supervision. Qin et al. [31] proposed a PointSkelCNN network based on an x-transformation operator, which converts 3D human skeleton extraction into offset vector regression and human body segmentation, and integrates a disambiguation strategy to improve the robustness of joint point regression, finally extracting the human skeleton. Vasileiadis et al. [32] voxelized the human point cloud, extracted features through a 3DCNN network, and then compared them with 15 manually calibrated joint parts, outputting a 3D maximum likelihood map for each joint to obtain key points to complete the 3D pose estimation task. Arindam et al. [33] proposed an Mmpose-NLP network, which extracts features from simulated radar point clouds between two consecutive frames after voxelization and aggregation using seq2seq, and further uses sparse categorical cross-entropy to predict the final skeleton points. However, the aforementioned skeleton extraction models mostly rely on keypoint labels in the point cloud data to supervise the model’s training and learning, assisting the model in completing the task of extracting skeleton points from the point cloud. However, annotating 3D data, whether choosing point-wise annotation or keypoint annotation, involves enormous workload and cost. In addition, 3D annotation lacks unified quantitative metric supervision. The definition of point-wise scope and keypoint by annotators is based on experience, which leads to strong subjectivity in the annotation results and an unguaranteed annotation quality, consequently affecting the model’s performance in subsequent training. Therefore, some researchers have also carried out a series of research studies on the problem of how to extract object skeleton points in unsupervised networks.
Methods based on unsupervised deep learning: Jakab et al. [34] proposed a keypoint extraction network, KeypointDeformer, with a Siamese network as the main body. By introducing a farthest point keypoint regularization loss function, it treats the initialized farthest points as a noise prior on the keypoint locations. As the model trains, it minimizes the Chamfer distance between the predicted keypoint and the sampled points, enabling the predicted keypoint to be evenly distributed on the object’s surface. Shi et al. proposed an unsupervised aligned keypoint detector [35] based on an autoencoder architecture, which predicts point-wise scores through the encoder and performs weighted averaging to obtain keypoint, and further proposed a Composite Chamfer Distance (CCD) loss function applied to constrain the generation locations of the keypoint. Lin et al. [36] used PointNet as the basic architecture and proposed a joint loss function based on geometric transformations, achieving the extraction of object skeleton points. However, in the aforementioned literature, the feature extraction part mostly uses PointNet. This network aggressively max-pools all point feature maps into a single global feature, causing the local correlations between points not to be learned by the network, resulting in the loss of local features, and leading to the problem of skeleton point extraction deviation.
Skeleton point connection methods: In addition, most current deep learning methods mainly focus on the extraction of skeleton points. Regarding the problem of how to topologically connect the extracted skeleton points to form a skeleton, most rely on manual connection. Such an operation is not conducive to the automated processing and analysis of high-throughput data. Therefore, some researchers have conducted related research on the problem of achieving end-to-end automated connection of skeletons. Liu et al. [37] proposed a network with FCGF as the backbone, converting the object skeleton extraction problem into a problem of corner localization and corner connection. Li et al. [38] proposed a deep neural network, WireframeNet, that converts point clouds into wireframes. The network predicts a set of edge points from the original point cloud by learning geometric transformations, and finally analyzes the connectivity between the edge points to construct a complete wireframe structure. Luo et al. based on the [39] model encoded sufficient raw point cloud contour information to predict the existence probability of potential connection points, and queried the probability of connection between two connection points. In the aforementioned research studies, the problem of connecting the points and edges of the skeleton is simplified into the problem of connecting the edge points and wireframes of polyhedra, and the skeleton structure extracted by these algorithms resembles a mesh grid shape, and does not possess the original topological structure of the object.
In summary, existing skeleton extraction methods exhibit significant limitations at various stages. Two-dimensional image-based methods lack depth information, making it difficult to represent complete spatial structures. Consequently, current research has gradually shifted towards 3D point cloud data; however, traditional 3D geometric methods rely on complex parameter settings and are highly sensitive to noise and sampling density. Supervised deep learning models have improved robustness to a certain extent, but they still require extensive manual annotation, incurring high costs and limited generalization capabilities. While unsupervised methods address the issue of high annotation costs, they may suffer from feature loss or skeleton point deviation during local structure modeling.
Addressing the common issues of skeleton point deviation and insufficient local structure representation in unsupervised methods, the Graph-SENet proposed in this paper introduces dynamic graph convolution to replace global pooling structures. This approach enables more effective modeling of local geometric features, demonstrating superior capability and specificity in feature modeling and topological recovery. regarding skeleton topological connection, many deep learning methods still rely on manual connection. Meanwhile, existing automated connection methods often simplify the skeleton connection problem into edge point or wireframe prediction. The resulting structures resemble polyhedral meshes rather than the original tree-like topological structure of the object, thus failing to meet the requirements for fine-grained structure analysis. Our method integrates a graph autoencoder with a direction vector-based cosine similarity thresholding mechanism to achieve the automatic prediction of connection relationships between skeleton points, thereby extracting high-quality tree-like semantic skeletons.
Therefore, the main innovations of the method proposed in this paper include the following points:
- Aiming at the problems that deep learning methods for extracting skeleton points from point clouds require extensive annotated information, and that feature extraction suffers from information loss and data redundancy. This paper proposes a novel unsupervised skeleton point extraction network, Graph-SENet. By introducing a DGCNN into the encoder part of feature extraction and combining it with a multi-layer feature fusion strategy, the network’s ability to extract local neighborhood features from point cloud data is enhanced; and further proposes a novel point-to-point multi-dimensional feature unsupervised loss function to strengthen the network’s perceptual ability for skeleton point location extraction, achieving uniform extraction of object skeleton points under unsupervised conditions, significantly reducing the cost of manual annotation, effectively avoiding the impact of subjective manual annotation on model performance, and ensuring the objective consistency of the skeleton point extraction results.
- Aiming at the problem that after current deep learning networks extract skeleton points from point clouds, they require manual topological connection to form a skeleton, making it difficult to achieve full end-to-end learning. This paper proposes a connection prediction network centered on a GAE and fused with the skeleton point extraction network, combining a prior connection strategy and a topological connection optimization strategy, to learn and optimize the potential skeleton connection relationships in the point cloud, achieving full process end-to-end learning from point cloud to skeleton, reducing the manual cost of skeleton point post-processing, and significantly improving the efficiency of skeleton extraction.
2. Materials and Methods
This paper starts from the spatial structural characteristics of 3D point clouds. Due to the fact that point clouds naturally possess a non-Euclidean data distribution form and geometric properties of local irregularity, this makes it difficult to directly apply traditional convolutional neural networks during modeling. In contrast, Graph Neural Network (GNN), by constructing graph structures, can flexibly represent the unstructured adjacency relationships in point clouds and effectively capture the local geometric connections between points during feature propagation; therefore, GNNs have become an ideal backbone choice for processing point cloud data. Based on the above analysis, this paper designs an unsupervised graph neural network model, Graph-SENet, which can accurately localize skeleton points from point cloud data and extract the object’s skeletal topological structure. The overall architecture for automated skeleton extraction using the method proposed in this paper is shown in Figure 1. mainly including three modules: the point cloud preprocessing module, the skeleton point extraction network, and the topological connection module.
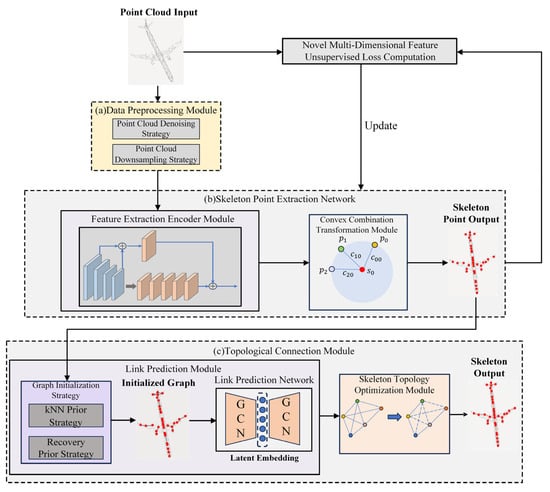
Figure 1.
Flowchart of the unsupervised skeleton extraction algorithm. (a) Data preprocessing module. (b) Skeleton point extraction network, in the feature extraction encoder module, dynamic graph convolution is utilized for feature extraction of the point cloud effectively combining the fusion of global and local features, and through convex combination and the proposal of a new type of point-to-point unsupervised loss function, the skeleton points are effectively extracted from the input point cloud. extract skeleton points from the input point cloud. (c) Topological connection module, using graph initialization strategy to construct a local graph structure for the extracted skeleton points, and inputting the local graph structure into the connection prediction network to predict the potential skeleton connections in the point cloud, and further improving the reasonableness of the skeleton connections through the topological connection optimization module.
Data preprocessing module: This module consists of a point cloud data cleaning strategy and a data downsampling strategy. The function of point cloud data cleaning is to remove outliers, duplicate points, and background noise interference from the original point cloud, improve the point cloud quality, and ensure the effectiveness and robustness of subsequent network input; downsampling sparsifies the point cloud through methods such as random sampling to reduce computational complexity, while preserving the overall structural features of the object, ensuring the geometric consistency of subsequent skeleton point extraction.
Skeleton point extraction network: This network is composed of a feature extraction encoder module and a convex combination transformation module. The feature extraction encoder module mainly includes dynamic graph convolutional layers and multilayer perceptron layers, wherein, the dynamic graph convolutional layer reconstructs the graph structure in each forward propagation process based on the extracted point features; through the construction of dynamic graph neighborhoods, it can capture richer geometric relationships and structural features, providing more effective features for subsequent skeleton point classification; the multilayer perceptron is an artificial multi-convolutional layer, which is mainly responsible for further performing non-linear mapping based on the local features extracted by the graph convolution. The convex combination transformation module utilizes the potential sparse structural features in the point cloud to find optimal linear combination centers in the local neighborhoods of the original point cloud, enabling the network to focus on keypoint with more distinct features. Finally, the network achieves regression prediction from the preprocessed point cloud to the skeleton points through the constraint of the multi-dimensional unsupervised loss function.
Topological connection module: This module consists of a connection prediction module and a skeleton topological connection optimization module. The connection prediction module is mainly composed of a graph initialization strategy and a connection prediction network. The graph initialization strategy constructs an initial adjacency graph through the K-nearest neighbors algorithm and the mapping between skeleton points and the clean point cloud, forming a basic graph structure representation to provide an initial input graph for the graph autoencoder. The connection prediction network, based on a graph autoencoder architecture, extracts the latent embedding (Latent Embedding) of skeleton points through the encoder, and uses a decoder to predict whether a connection relationship exists between any pair of points, thereby generating a candidate skeleton connection graph. The skeleton topological connection structure optimization module, on the basis of the preliminary connection graph, further introduces geometric priors for structural optimization, removing pseudo-connections, repairing missing connections, and improving the accuracy and coherence of the skeleton topological structure. Through the aforementioned joint network training, the algorithm proposed in this paper can achieve end-to-end accurate extraction of the object skeleton.
2.1. Data Preprocessing
The datasets used in this experiment mainly include the following three, and Figure 2 shows samples of the point cloud datasets from each dataset and their corresponding processing:
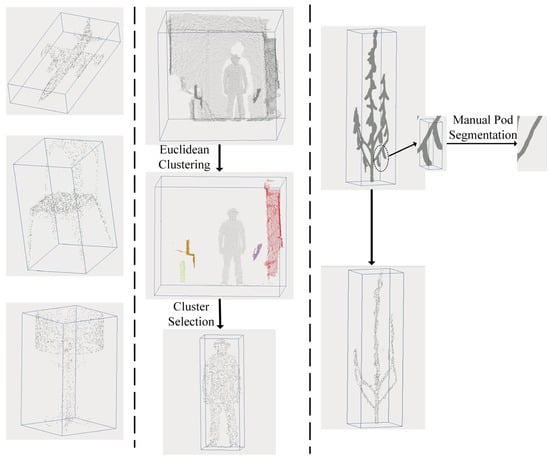
Figure 2.
Sample point cloud dataset presentation. The first column represents the ShapeNet dataset, the second column represents the ITOP dataset, and the third column represents the Soybean-MVS dataset.
- The general object dataset: ShapeNet [40]. This is a large-scale annotated 3D point cloud dataset widely used in the fields of 3D vision and geometric deep learning. This dataset contains over 51,300 high-quality CAD models that have been manually created and cleaned. Specifically, following the method of et al. [41], this paper selected 3 representative categories for research: chairs, airplanes, and table lamps. Since the 3D CAD objects were originally stored as meshes, we resampled the meshes into point clouds and uniformly downsampled them to 2000 points via random downsampling, covering a total of 8600 point clouds, with a training set/test set split ratio of 8:2.
- The human body dataset: ITOP [42]. This dataset is a 3D human pose estimation benchmark dataset constructed based on a ToF (Time-of-Flight) depth sensor, with its core data collected by a Microsoft Kinect v2 device. It specifically includes 15 different actions from 20 individuals. The depth sensor provides two depth image data acquisition viewpoints. One corresponds to the top viewpoint, while the other corresponds to the front viewpoint. To better extract the human limb skeleton, we used 8000 point cloud data generated from the front viewpoint acquisition as the research object, with the training set/test set split ratio also being 8:2. After performing point cloud reconstruction on the depth images collected by the depth sensor, we found that in addition to the human body, the point cloud data also contained a large amount of foreground and background noise point clouds. Therefore, this paper utilized a method based on threshold filtering and Euclidean clustering for point cloud data cleaning [30] to segment the human body from the complex background noise, and uniformly downsampled the human body point clouds to 2000 points.
- The soybean dataset: Soybean-MVS [43]. This dataset consists of 102 3D soybean plant models reconstructed using Multi-View Stereo (MVS) technology. The dataset spans the entire soybean growth period, including five varieties, and color data is included in the point clouds (XYZRGB format). Although this dataset provides branch segmentation annotation data for the soybean dataset, for soybeans in the mature stage, researchers are more concerned with plant architecture parameters rather than segmentation parameters. However, the point clouds of soybean plants in the mature stage in this dataset have a large number of pod point clouds attached to the branches. For the skeleton extraction network, these pod point clouds introduce unnecessary noise effects. Therefore, we used CloudCompare [44] software to manually segment the pods from the point clouds of 25 mature soybean plants to obtain clean soybean branch point cloud data, and uniformly downsampled them to 2000 points, where the training set/test set split ratio was also 8:2.
To address the issue of model robustness, we applied random downsampling to the point clouds across all datasets. The randomness of the sampling points simulates, to a certain extent, the incompleteness and non-uniformity inherent in real-world point cloud acquisition. This enables the model to learn the distribution characteristics of sparse and non-uniformly dense point clouds, thereby achieving robustness in extracting object skeletons from low-density or incomplete data.
2.2. Skeleton Point Extraction Network
The training flowchart of the skeleton point extraction network is shown in Figure 3. Among them, in the feature extraction encoder module part, this paper proposes a dynamic graph convolutional layer with stronger feature capture capabilities to adaptively and dynamically construct point cloud local geometric relationship features (introduced in Section 2.2.1), and in the loss function part, a novel multi-dimensional feature unsupervised loss function is constructed to apply unsupervised constraints on the skeleton point extraction results from multiple dimensions such as geometric position, semantic features, and local structure, guiding the model to learn the latent representation of the skeleton structure from the original point cloud more effectively, constraining the refined object skeleton point extraction, and providing more accurate prior knowledge for subsequent skeleton connection (introduced in Section 2.2.2). The improvement work for each part is introduced in detail below.
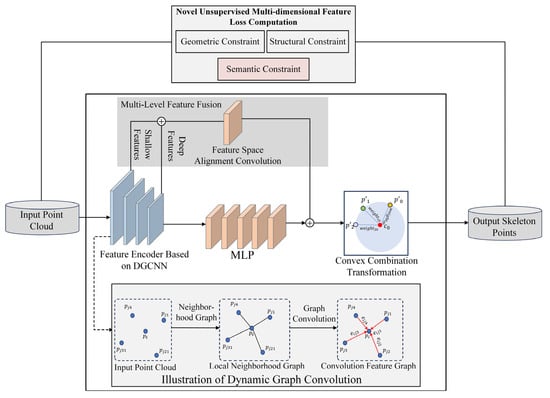
Figure 3.
The proposed skeleton point extraction network based on dynamic graph convolution, and the optimized novel unsupervised loss function.
2.2.1. Dynamic Graph Convolution Based Feature Extraction Module
In traditional point cloud feature extractors, most deep learning networks employ PointNet for feature extraction. PointNet aggregates features based on global symmetric functions; although it has an advantage in maintaining input invariance, it results in a certain degree of feature loss. Furthermore, its ability to model the local structure of point clouds is weak, making it difficult to effectively capture complex local geometric information. Particularly in non-uniformly sampled or noisy actual point cloud scenarios, this often leads to a decrease in skeleton point extraction accuracy. Therefore, given that point clouds are essentially unstructured discrete data and lack explicit topological relationships, graph structures can explicitly model the adjacency and geometric connections between points, thereby endowing the discrete point cloud with a structured representation. This paper introduces a dynamic graph convolutional network (DGCNN) into the skeleton point extraction network as the backbone structure (as shown in Figure 3), to enhance the model’s feature extraction capability.
In the DGCNN encoder, the input F-dimensional point cloud set is assumed to be denoted as , where denotes the point of the point cloud, and N is the total number of points in the input point cloud, and the simplest case is considered, where each point contains only the 3D coordinates . When performing graph convolution, a local neighborhood map needs to be constructed for the point cloud (as shown in the “Illustration of Dynamic Graph Convolution” in Figure 3). Therefore, a directed graph is further assumed to represent the local structure of the point cloud, where , denotes vertices and edges, respectively. In this paper, the initial point cloud is first constructed as a k-nearest neighbor graph using the k-nearest neighbor algorithm, and the edge features are extracted by the graph convolution operation, and finally the vertex outputs are obtained by applying the channel symmetric aggregation operation on the edge features associated with all the edges emanating from each vertex as shown in Equations (1) and (2).
where the edge feature function in Equation (1) is an asymmetric edge function, which combines the global shape structure (captured by the coordinates of the patch center to ) and the local neighborhood information (captured by ), and denotes the convolutional operation of the graph neural network; and denotes as the output of the encoder’s convolutional feature maps after aggregating the edge features.
Furthermore, to further enhance the network’s expression capability for point cloud features, this paper introduces a multi-layer feature fusion strategy into the skeleton point extraction network, to fully integrate the local and global information extracted by different deep network layers. Specifically, this study selects the output features of the n-th layer and the (n + 4)-th layer of the dynamic graph convolution modules in the feature encoder (in this study, n is taken as 1), which, respectively, represent the shallow local structural information and the deep abstract semantic information of the point cloud. And after concatenating these two layers of features along the channel dimension, convolutional operations are used to compress and fuse the feature expression dimensions, enabling them to possess stronger representation capability and semantic consistency. Through this structured multi-layer feature fusion approach, the model is enabled to simultaneously capture the detailed features and global morphological features of the point cloud, significantly enhancing the expression capability and generalization ability of the skeleton point extraction network for complex structures. Especially when facing objects with large inter-class deformation or significant local structural changes, it can still maintain high robustness and prediction accuracy.
2.2.2. Unsupervised Loss Function Optimization Based on Multi-Dimensional Features
In the task of unsupervised skeleton point extraction, how to guide the network to accurately learn the skeletal structure within the point cloud, given the absence of manually annotated information, is the core difficulty in loss function design. Existing research [36] constructs unsupervised loss functions from two aspects: geometric distribution constraint and structural consistency constraint. The former maintains geometric accuracy by measuring the degree of spatial fitness between the skeleton points and the original point cloud, while the latter enhances the coherence and structural stability of the skeleton points by introducing sampling consistency and radius regularization terms. Although these two types of constraints have improved the accuracy of skeleton extraction to a certain extent, problems such as dense distribution of skeleton points, structural redundancy, or excessive aggregation in regions often occur in actual skeleton point data, leading to insufficient overall discriminability and expressive clarity of the skeleton representation. To further address the aforementioned issues, this paper, based on the original loss function design, introduces a third key constraint dimension—semantic sparsity constraint—and further proposes an optimized unsupervised loss function with multi-dimensional feature fusion. This constraint, by constructing a uniformity loss term, performs global regulation on the spatial distribution of skeleton points, encouraging the skeleton points to exhibit a sparser, more uniform, and more discriminative distribution pattern in terms of structural semantics, thereby significantly enhancing the semantic clarity and structural expression capability of the skeleton point extraction.
Next, this paper will, starting from the loss terms designed at each level, sequentially introduce their calculation methods, constraint objectives, and their roles in the overall optimization process.
Given an input point cloud , the goal is to predict a set of skeleton points. To better cover the object’s shape, the network first predicts a set of skeleton balls , whose centers are treated as candidate skeleton points . Inspired by mathematical linear programming [45], we propose to use convex combinations to describe the relationship between the input point cloud and the predicted skeleton points:
where denotes the predicted skeleton points, and denotes the predicted weights.
Furthermore, this paper represents the radii of all skeleton sphere as a linear combination of the nearest distances from all skeleton points to the input points , and is denoted as the nearest distance from the input point cloud to the output skeleton points . The specific calculation formula is as follows:
Therefore, based on the above definitions of skeleton balls and skeleton points, the objective of this paper is transformed into designing a set of loss functions to constrain the network training to obtain the predicted convex combination weights .
First is the loss at the level of the geometric distribution constraint: the point2sphere loss (as shown in Figure 4a). The procedure for predicting skeleton points in this paper is as follows: first, a set of skeleton spheres that can characterize and cover the object’s shape is predicted from the point cloud, and then the final skeleton points are estimated based on the skeleton sphere centers. Therefore, this paper first measures the skeleton sphere reconstruction error by explicitly optimizing the coordinates of the skeleton points and their radii:
where denotes the predicted skeleton point, denotes the input point, denotes the radius of the skeleton point , and denotes the skeleton point closest to the input point . The first term constrains each input point to lie on the surface of its nearest skeleton sphere, and the second term encourages each skeleton sphere to touch its nearest input point.
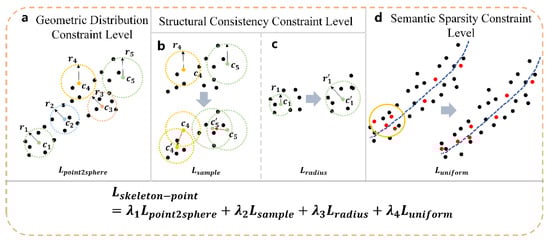
Figure 4.
Schematic diagram of the unsupervised loss function for multidimensional features in the model proposed in this paper. (a) denotes the point-to-sphere loss, which is used to generate the proposal of the initial skeleton points and their radii; (b) denotes the sampling consistency loss, which is used to adjust the center position of the skeleton points by sampling the surface of the sphere to compute the bi-directional CD from the input point cloud; (c) denotes the radius regularization loss, which improves the robustness of the algorithm against noisy points; and (d) denotes the uniformity loss, which is used to adjust the computation of the position of partially regionally clustered skeleton points (as shown in the yellow circle in middle (d)) for positional adjustment. Finally, during the training of the network, the joint multidimensional feature unsupervised loss function is utilized to help the model better learn the point cloud features and constrain the generation of skeleton point locations.
Then there is the loss at the level of the structural consistency constraint: the sampling consistency loss (as shown in Figure 4b). Although the loss function alone can make the structure of the skeleton points cover the input point cloud, this does not mean that the generated skeleton points can geometrically restore the original surface shape, i.e., a situation exists where the skeleton point positions and radii might allow the spheres to cover the point cloud, but their skeleton points exhibit large differences on the geometric surface. Therefore, this paper samples on the surface of each skeleton sphere to generate sampling points used to represent the “approximate surface” of the object, and measures the Chamfer distance (CD) between the sampling points and the input points , to constrain the surface generated by the skeleton to also be consistent with the details of the point cloud geometry:
where sampling points are generated by intersecting the sphere surface with 8 uniformly distributed directional vectors in 3D Cartesian coordinates. The bidirectional Chamfer Distance is used for better geometric alignment between sampled and original surface points.
Radius regularization loss (as shown in Figure 4c), in practical applications, this paper finds that the inscribed spheres of 3D shapes are sensitive to surface noise, that is, a sphere can be inscribed in the space between several noise points, thereby producing a tiny radius. To focus on the underlying geometry, in order to achieve better abstraction and avoid instability, therefore, we use a radius regularization loss to encourage larger radii, reducing the influence of fine noise point interference in the point cloud:
Through the joint constraint of the above loss functions, the network can estimate the positions of the skeleton points from the original point cloud. However, the generated skeleton points will exhibit the phenomenon of regional aggregation, leading to unevenly generated skeleton points, which affects the subsequent skeleton connection effect. This paper adds a uniformity loss based on the semantic sparsity constraint (as shown in Figure 4d) to the original loss function, in order to constrain the uniformity of the generated skeleton points.
First, based on the extracted skeleton points c and the corresponding sphere radii r, we iterate through each skeleton point and determine if redundancy exists in its surroundings. If redundancy exists, we calculate the number of skeleton points within its redundant range, and calculate the corresponding uniformity loss. Specifically, for each skeleton point , we search for other skeleton points within its neighborhood sphere with radius . If is satisfied, the redundancy within the neighborhood is incremented by one. When the redundancy exceeds a set threshold, the skeleton point area within that region is recorded as redundant. Therefore, this study defines the redundant neighbor set as:
where, when (which is an empirically set threshold), the region of this point is considered to have excessive density and redundancy. Next, the uniformity loss needs to be calculated for this region to optimize the skeleton point position distribution.
where denotes the set of generated skeleton points; denotes the Euclidean distance between the -th neighboring skeleton points; denotes the average of all neighboring distances, and denotes the uniformity loss calculation result.
In summary, the total loss function for the skeleton point extraction network part, , can be expressed as:
where , , , respectively represent the weighting coefficients for the , , , loss functions during the training process. In this study, we empirically set the weight ratios to , , , .
2.3. Topology Connection Module
In this part, the objective of this section is to predict connections for the extracted skeleton points to form a skeleton with a specific topological structure. Traditional skeleton connection methods rely on Euclidean distance or heuristic rules, have high algorithmic complexity, and perform poorly when handling complex topologies (such as loops, bifurcations, etc.). Therefore, in this section, this paper proposes a graph autoencoder connection prediction network based on a connection optimization strategy. This network utilizes an encoder–decoder architecture to further predict missing links by analyzing the correlations of skeleton points in the latent space. By combining reconstruction loss and an optimized connection strategy for the adjacency matrix, it optimizes the adjacency matrix, enhancing its ability to predict the connection relationships between skeleton points.
When using a graph autoencoder-based network to perform connection prediction on skeleton points, it is necessary to first construct a graph structure of the local neighborhood, to be used by the network to extract their high-dimensional latent space feature representations and to mine the inherent structures and mapping relationships within the data. Therefore, this paper adopts the following two graph neighborhood construction strategies for graph initialization.
- k-nearest neighbors strategy, after extracting the skeleton points using the skeleton point extraction network, apply the k-nearest neighbors algorithm to the skeleton points, compute the k nearest neighboring nodes, and set the corresponding edges in the adjacency matrix to 1 (indicating a connection). Among them, this paper sets k = 1, indicating that each node is only connected to its nearest node.
- Recovery priority strategy, given an input point and its two nearest skeleton points , , then a skeleton edge should exist connecting them. This is because in 3D point cloud or contour data, skeleton points are usually the center points of the object’s shape. An input point is usually located on the object’s surface, and its two nearest skeleton points are likely located at the two ends of the object’s internal “skeleton segment” corresponding to that point. Therefore, if is simultaneously close to and , this implies that and are also in the same local region of the object, and they should be connected in the true skeleton.
Based on the two graph initialization strategies above, this paper obtains an initial graph possessing partial connection links, the subsequent task is determined to be predicting the links that may exist in this graph, and making the overall links conform to the object’s shape structure to obtain the final object skeleton.
2.3.1. Graph Autoencoder-Based Connection Prediction
After performing the graph neighborhood construction operation on the extracted skeleton points, we obtain a series of discrete, undirected, and unweighted initial graphs , where denotes the M skeleton points output by the skeleton point extraction network, and denotes the set of edges. Furthermore, the graph can be encoded using an adjacency matrix to represent the edge connectivity in the graph structure. The network architecture of the graph autoencoder is shown in Figure 5. In addition to the adjacency matrix , the input data also requires node feature information. To effectively utilize the geometric correlation between the skeleton and the input point cloud points, this paper adopts a multi-source fusion approach to establish the node features, that is, the node features are jointly represented by the skeleton point coordinates , the skeleton sphere radius , and the feature output from the dynamic graph convolution, denoted as .
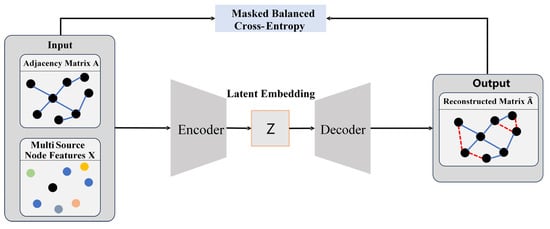
Figure 5.
Diagram of the network architecture of the graph self-encoder.
The encoder part of the GAE is composed of a residual graph convolutional structure, mainly responsible for compressing node features into the latent embedding . The decoder part of the GAE employs a vector inner product to measure the correlation of latent features to reconstruct a new adjacency matrix , as shown in Equation (13):
When training the GAE network model, the objective of this paper is to enable the reconstructed adjacency matrix to predict the unknown links in the initial adjacency matrix . Therefore, this paper introduces masked balanced cross-entropy to supervise the GAE learning:
where denotes the mask matrix, and the loss is calculated only among a specific set of candidate edges; is the element-wise product, ensuring that only items within the mask’s scope participate in the loss calculation; denotes the positive and negative sample weight coefficient, used to balance the training sample ratio between the existence and non-existence of edges; denotes the input adjacency matrix; denotes the adjacency matrix predicted and output by the model; denotes the activation function.
2.3.2. Connection Optimization Strategy
In Section 2.3.1, we utilized the GAE network to perform connection prediction on the initial graph input into the network. However, when utilizing the graph autoencoder network to output skeleton topological connections, a significant number of incorrect connections and self-loops occur. This type of connection structure is unreasonable and unnatural in the actual object skeleton structure. To ensure the generated skeleton conforms to the topological structure of a normal object, it is usually necessary to manually correct the incorrectly connected edges based on the object’s original shape. However, in practical application scenarios, the shape differences among different categories, or even different objects within the same category, are very significant. The workload of performing manual correction on a case-by-case basis is enormous and does not align with high-throughput automated data processing and analysis.
To solve the aforementioned connection error problem, this paper designs a connection optimization strategy based on cosine similarity threshold judgment. By relying on the directional distribution characteristics of edges in space, it filters out structurally unreasonable connections by matching the cosine similarity with predefined direction vectors. This method is capable of, without relying on manual intervention, effectively eliminating non-topologically consistent connected edges, while retaining connection relationships that align with the directionality of the true skeleton structure, thereby enhancing the topological naturalness and accuracy of the skeleton structure.
Point clouds are discrete points distributed in 3D space that represent the shape of an object, and any point in a 3D Cartesian coordinate system can be represented by a combination of several uncorrelated vectors. Therefore, the core idea of this strategy is: first, define eight uncorrelated direction vectors centered at the origin of the coordinate system in 3D space, which are , where is the unit vector component. Subsequently, for each connected edge, its normalized direction vector is calculated, and the cosine similarity between it and the eight aforementioned direction vectors is computed, thereby determining the spatial tendency of the edge. For each skeleton point, the number of direction vector categories corresponding to its connected edges is counted, and the reasonableness of its topological structure is judged based on this. When the connection directions of a certain point are too dense, it indicates that the connection structure of that point deviates from the natural skeleton directional characteristics, and should be regarded as a redundant connection structure. Within a tree-structured skeleton, each skeleton point typically connects geometrically to either two other points (serving as an intermediate node that links a preceding and a succeeding node) or three points (situated at a bifurcation point connecting the trunk and branches). Consequently, after the spatial tendency of the connecting edges is calculated, any excess edges should be regarded as redundant connections and pruned. Therefore, in this paper, the spatial tendency threshold for edges is set to 4. The specific implementation process of this optimization strategy is shown in Algorithm 1.
| Algorithm 1 Algorithm for skeleton edge screening strategy based on direction vector |
| Input: |
| Output: filtered adjacency matrix |
| 1: e ← 2: Define the direction vector: Directions ← [[e, e, e], [e, e, −e], [e, −e, e], [e, −e, −e], [−e, e, e], [−e, e, −e], [−e, −e, e], [−e, −e, −e]] 3: for b = 0 to B − 1 do 4: for i = 0 to N − 1 do 5: pt1 ← skel_xyz[b, i, :] current node position 6: Neighbors ← {j|[b, i, j] = 1} 7: if |Counts ← zeros(8) 8: for each j ∈ Neighbors do 9: pt2 = skel [b, j, :] 10: Edge = pt2 − pt1 11: , Directions) 12: Closest = argmax( Similarities) 13: Counts[Closest] = Counts[Closest] + 1 14: end for 15: Nums ← count(Counts > 0) 16: if Nums > 4 then 17: [b, i, :] ← 0 18: [b, :, i] ← 0 19: end if 20: end for 21: end for 22: ← max(, transpose(, 1, 2)) 23: return |
This strategy fully considers the directional characteristics of 3D object skeleton connections. For objects with long-axis structures, the connecting edges usually extend along the principal axis direction; therefore, the correct connection relationships should be concentrated in a small number of spatial directions. In contrast, points with excessively discrete connection directions are usually caused by connection errors or prediction redundancy. Through the direction vector filtering mechanism, these unreasonable connections can be automatically identified and eliminated, thereby enhancing the structural expression capability and semantic consistency of the overall skeleton. Figure 6 shows a comparison of the skeleton structures before and after the connection optimization strategy, based on the graph autoencoder’s prediction results. As shown in Figure 6a, the edge connection results predicted by the GAE network contain a large number of redundant edge connections and self-loop structures; Figure 6b shows the result optimized by the method in this paper, the main structure of the connections is clear, most of the erroneous redundant edge connections have been removed, and it possesses the ability to eliminate redundant points, significantly enhancing the topological reasonableness and shape expression capability of the skeleton.
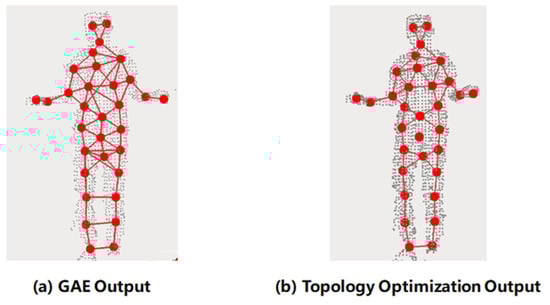
Figure 6.
Schematic of the skeleton after topological connection optimization. (a) denotes the output skeleton after GAE connection prediction; (b) denotes the skeleton result after topological connection optimization. Where the gray point set represents the input human body point cloud shape, the red nodes are the skeleton points, and the red lines represent the skeleton connection edges.
3. Results
In this section, the proposed point cloud skeleton extraction algorithm is evaluated. First, corresponding evaluation metrics are designed to assess the effectiveness of the object point cloud skeleton extraction algorithm, and based on the evaluation metrics, the algorithm proposed in this paper is used for experiments with SCAG [46], Skeleton Merger [35], and Point2Skeleton [36]. Section 3.1 introduces the metrics used to evaluate the effectiveness of skeleton extraction: CD and 3D F1-score. In Section 3.2, this paper introduces the operating environment of the proposed algorithm as well as the specific comparative experimental data and results.
3.1. Evaluation Metrics
The ultimate goal of the method proposed in this paper is to generate an accurate object skeleton structure from the original point cloud. This extraction process includes two steps: skeleton point extraction and topological connection. Therefore, this paper evaluates the accuracy of the skeleton extraction from the above two aspects, thereby validating the performance of the model proposed in this paper. Regarding the accuracy of skeleton point extraction, there are two main metrics used, namely, Chamfer distance and the 3D F1-score. Among them, the calculation formula for the Chamfer distance is as follows:
where and denote the 3D point cloud sets to be compared, denotes the original point cloud set, and denotes the extracted skeleton point set; denotes the squared L2 norm calculating the squared distance between points x and y. The forward term represents the calculation of the average squared distance from to its nearest neighbors in , and the backward term symmetrically calculates the average squared distance from to its nearest neighbors in , ensuring bidirectional consistency. The Chamfer distance measures the similarity between the skeleton points and the original point cloud from the points’ perspective; the smaller the Chamfer distance metric, the closer the distance between the extracted skeleton points and the original point cloud.
During the experimental process, we discovered that using a single Chamfer distance metric to measure model performance leads to a situation: we typically consider the extracted skeleton points to be effective when the Chamfer distance is small. However, visualization of the skeleton points and the original point cloud reveals that a small Chamfer distance can only measure whether the extracted skeleton points are inside the original point cloud, and cannot fully characterize the object’s local structure (making it difficult to measure whether the skeleton points completely cover the object’s structure). Therefore, we introduce the 3D F1-score to measure the correctness of skeleton point extraction, measuring the similarity between and through the harmonic mean between Precision and Recall. Where Precision represents the percentage of predicted points within a certain distance of the ground truth points, representing the accuracy of the prediction; Recall represents the percentage of ground truth points within a certain distance of the predicted points, representing the completeness of the prediction. The calculation formulas are as follows:
where denotes the point cloud set predicted by the model, denotes the original point cloud set, and denotes the distance threshold determined empirically. and respectively represent the and calculated at the distance threshold d. In this paper, d is set to 0.05, and a higher indicates a higher similarity between the two point sets.
Given that the majority of existing methods focus solely on skeleton point extraction and lack the capability for end-to-end reconstruction of skeleton topology, methods in the current literature capable of directly generating complete skeleton structures are extremely limited. The algorithms used for skeleton point extraction comparison in this paper, such as Skeleton Merger and SCAG, primarily emphasize the generation of skeleton points. Their topological connections typically rely on subsequent manual rules or manual annotation, constituting a semi-automatic process that fails to provide reproducible connection results suitable for direct 3D topological structure evaluation. Consequently, these methods cannot be fairly compared with the automated topology prediction framework proposed in this paper under the same evaluation system. For the reasons mentioned above, this paper adopts Point2Skeleton as the primary baseline model for the overall skeleton evaluation. Point2Skeleton is one of the few existing methods capable of simultaneously generating skeleton points and their topological connections under unsupervised conditions. It produces structured skeleton results within a consistent task setting, thereby providing a fair and representative benchmark for evaluating the skeleton topology prediction performance of our proposed method.
3.2. Comparative Experiments
In this section, based on the evaluation metrics described in Section 3.1, the algorithm proposed in this paper is compared with SCAG, Point2Skeleton, and SkeletonMerger. Section 3.2.1 introduces the experimental runtime environment, and Section 3.2.2, Section 3.2.3, and Section 3.2.4, respectively, present the results and analysis of the comparative experiments and the ablation experiments of the model.
3.2.1. Experimental Environment
The algorithm proposed in this paper was deployed on a computer platform configured with an Intel Core i7-14700k CPU processor (64 GB RAM) and a GeForce RTX 4090 GPU (24 GB) graphics card. The operating system used was Ubuntu 18.04LTS. The model’s building, training, and validation were implemented using the Python 3.10 programming language under the Pytorch 1.11.0+cu113 framework.
Specifically, when training the skeleton point extraction network model, the batch size was set to 4, the learning rate was set to 0.001, and it was trained for a total of 70 training epochs; when training the connection prediction network, the batch size was set to 4, the learning rate was set to 0.0005, and it was trained for a total of 30 training epochs. Both models were trained using the Adaptive Moment Estimation (Adam) optimizer.
3.2.2. Skeleton Point Extraction Comparison
In this study, we first conducted comparative experiments on the airplane, chair, table lamp, human body, and soybean point clouds from the three datasets mentioned in Section 2.1, and combined the CD and 3D F1-score to qualitatively evaluate the skeleton point extraction effect for various types of objects.
Figure 7 shows the visualization results of point cloud skeleton point extraction by the four skeleton extraction algorithms on different categories of object.
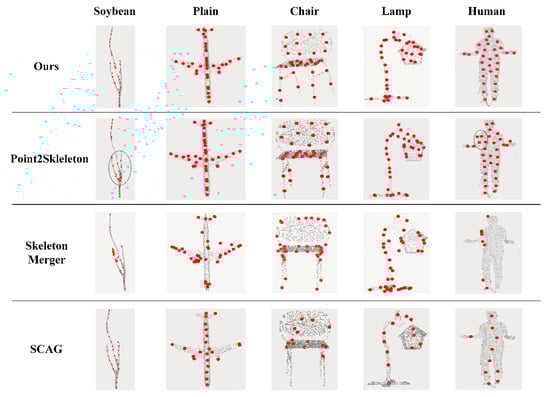
Figure 7.
Visualization comparison results of the four algorithms for extracting the object skeleton from the point cloud. The gray points are the original object point cloud and the red points are the object skeleton points extracted by the algorithms.
The visualization results of skeleton point extraction reveal the performance differences among different algorithms in structural detail restoration and skeletal completeness. Although the SCAG algorithm performed well on soybean data, this is primarily attributed to its clustering mechanism designed with soybeans as the research object, but it still has significant deficiencies in other categories of objects. For example, in the airplane model, the skeleton structures of the right wing and left tail sections were not completely extracted; in the table lamp model, SCAG only generated a small number of skeleton points on the horizontal slice layer of the lampshade, making it difficult to restore the curved structure of the lampshade; and in the chair model, this problem is even more prominent, with most skeleton points concentrated in the seat area, while the leg sections are almost entirely missing. These phenomena may be attributed to SCAG’s weak clustering ability in sparse point regions, making it difficult to effectively capture slender or low-density structures. Skeleton Merger also exhibits certain limitations in skeleton extraction. In the airplane model, this method failed to accurately restore the main skeleton of the fuselage, and some skeleton points deviated from the original point cloud distribution; in the chair model, it failed to extract the skeleton points at the lower margin of the chair back, causing the generated skeleton structure to deviate from the true geometric morphology; in the table lamp model, especially in the four-pronged base region, the phenomena of skeleton point redundancy and erroneous extraction also occurred. These problems may stem from the method’s high sensitivity to object boundaries, leading to excessive aggregation of skeleton points in edge regions. When object boundaries are blurry or adjacent sections are in close proximity, its skeleton extraction capability is markedly reduced. Point2Skeleton’s performance is relatively superior, as it is able to extract the main skeleton points more accurately in most object categories. However, this method still exhibits a certain degree of erroneous extraction phenomena. For example, in regions with complex structures or drastic morphological changes, the extracted skeleton points may exhibit slight deviation, sparsity, or redundant distribution (as shown by the gray dashed circles in the figure), indicating that its robustness when processing complex topological structures remains limited.
Based on the comprehensive analysis above and the comparative qualitative results, it is evident that the method proposed in this paper is superior to the aforementioned methods in terms of the completeness and geometric adherence of skeleton point extraction across different objects. Whether in slender structures or complex connectivity regions, the extracted skeleton points can better represent the object’s shape, exhibiting stronger robustness and adaptability.
Table 1 shows the quantitative comparison results between the skeleton extraction method proposed in this paper and three mainstream methods. Among them, SCAG represents the skeleton point extraction method based on point cloud clustering, Skeleton Merger represents the method of generating skeleton points using a point cloud fragment merging strategy, Point2Skeleton represents the skeleton point regression prediction method based on PointNet, and Proposed represents the skeleton extraction method proposed in this paper. Across the five different categories of objects from the three datasets, our method achieved superior performance on both the CD and F1 score metrics.

Table 1.
Quantitative evaluation of skeleton point extraction algorithms across three benchmark datasets.
Specifically, on the Airplane object, the proposed method achieved a CD metric of 0.0504, which is a significant decrease compared to the other algorithms, and the F1-score was 0.905, exhibiting the best performance. On the Chair object, our method’s CD value was 0.0553, representing reductions of 34.5%, 22.2%, and 8.3% compared to SCAG, Skeleton Merger, and Point2Skeleton, respectively, and the F1-score reached 0.803, significantly outperforming the other methods. On the Lamp object, the proposed method’s CD was 0.0383, a further reduction of approximately 9% compared to Point2Skeleton, while the F1-score improved to 0.932. On the Human dataset, our method’s CD value was 0.1221, which is 14.4% and 17.2% lower than Skeleton Merger and Point2Skeleton, respectively, and the F1-score was 0.8737, likewise surpassing the comparative methods. On the Soybean dataset, the proposed method’s CD metric was 0.0534, which is 49.3%, 18.72% and 10.9% lower than Skeleton Merger, Point2Skeleton and SCAG, respectively, and the F1-score reached 0.80, demonstrating good robustness.
Overall, the method proposed in this paper exhibits stable and superior performance on object point clouds of different categories and complexities, can effectively accomplish the skeleton point extraction task, and reflects strong generalization and robustness. Compared with existing advanced methods, the CD was reduced by an average of approximately 20%, indicating that the generated set of skeleton points is more accurate in terms of shape fitting; simultaneously, the F1-score improved by an average of approximately 17.5%, illustrating that the completeness and accuracy of the skeleton point extraction were significantly improved.
3.2.3. Link Prediction Comparison
From the visualization comparison results (as shown in Figure 8), it is observable that the baseline model, when performing skeleton topological connection, although it performs connection prediction on the relationships between skeleton points, the resulting skeleton resembles a mesh grid. This skeleton connection result exhibits varying degrees of self-loops and incorrect connections. Particularly when the object’s shape has wide surfaces, this algorithm exhibits more topological connection errors, making it difficult to represent the object’s original shape, which impacts the fidelity of the object skeleton extraction and is detrimental to subsequent object structure analysis. The GAE connection prediction network based on the topological connection optimization strategy proposed in this paper has, to a certain extent, improved the aforementioned unreasonable connections, extracting more complete branch skeletons and accurate topological connections, and possessing better skeletal topological structure and morphological accuracy. Although the algorithm still exhibits a small number of self-loop phenomena in parts where the object itself has a loop structure, under unsupervised learning conditions, due to the lack of supervision from original handcrafted ground-truth skeletons, this situation is considered a reasonable connection phenomenon that represents the object’s original shape.
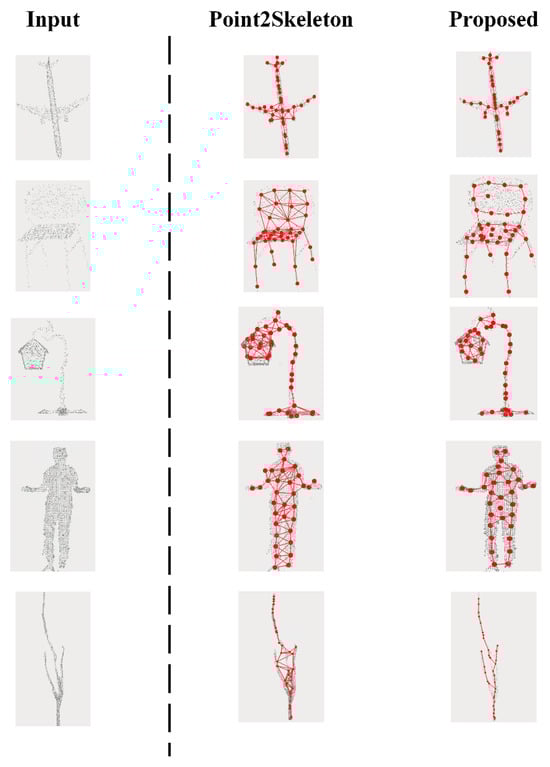
Figure 8.
Comparison of skeleton topology connection visualization, the first column on the right side of the dashed line is the baseline method and the second column on the right side of the dashed line is the method proposed in this paper.
3.2.4. Model Complexity
To evaluate the real-time performance of the proposed model, we conducted a complexity comparison between the proposed algorithm and two deep learning models: Skeleton Merger and Point2Skeleton. Table 2 displays the complexity of each compared model. Notably, in terms of inference speed, the algorithm proposed in this paper achieved improvements of 12.8% and 26.3% over Skeleton Merger and Point2Skeleton, respectively, demonstrating a significant advantage in real-time inference capabilities.
Table 2.
Statistical analysis of model complexity in comparative experiments.
3.2.5. Ablation Study
Furthermore, to investigate the impact of different model components on the experimental results, we conducted ablation experiments on the skeleton point extraction network to validate the effectiveness of our proposed modules for skeleton point extraction, as detailed in Table 3. In the ablation experiments, we conducted a quantitative comparison from two dimensions: the feature extractor module and the loss function design module. The results indicate that the choice of different modules has a significant impact on the performance of skeleton extraction. First, from the perspective of the feature extractor, DGCNN generally outperforms PointNet on all datasets, indicating that its graph convolution-based local feature modeling capability can better capture the geometric structure of the point cloud and improve the precision of skeleton point extraction. Second, regarding the loss function, introducing the improved uniformity loss can further enhance the model’s performance, especially on the ITOP dataset, where both PointNet and DGCNN show significant improvements in F1 score, indicating that the uniformity constraint effectively alleviates the problem of uneven skeleton point distribution. Overall, the “DGCNN + improved uniformity loss” combination performs optimally on the three datasets, achieving the best results in terms of both CD and F1 score, validating the effectiveness and robustness of the modules proposed in our method. Regarding the validation of the effectiveness of the skeleton topological connection, this paper has provided detailed explanations and visualizations in the preceding sections; specifics can be found in Section 2.3.2.
Table 3.
Quantitative ablation studies with different configurations.
4. Discussion and Conclusions
To address the prevalent issues in current deep learning networks for 3D skeleton extraction, such as high annotation costs, skeleton point deviations, and difficulties in structure recovery, this paper proposes Graph-SENet, an unsupervised learning-based graph neural network method for skeleton extraction, achieving the end-to-end automated generation of object skeletons from points to structures. By leveraging dynamic graph convolution and multi-level feature fusion, the proposed method effectively enhances the capability for local geometric structure modeling. Furthermore, it utilizes a multi-dimensional unsupervised loss to significantly strengthen the precision and robustness of skeleton point localization. Simultaneously, by combining a graph autoencoder with a topology optimization strategy, the method realizes the automatic prediction of skeleton connection relationships, yielding semantically consistent and structurally complete 3D skeletons. Experimental results indicate that Graph-SENet achieves the best Chamfer Distance (CD) and F1-scores across three cross-category datasets: ShapeNet, ITOP, and Soybean-MVS. Moreover, it maintains stable performance under unified hyperparameter settings, demonstrating significant advantages in precision, robustness, and cross-category generalization. These results suggest that the framework proposed in this paper not only effectively reduces the reliance on manual annotation for 3D skeleton extraction tasks but also achieves a performance breakthrough in structured skeleton recovery under unsupervised conditions, providing a reliable structural foundation for downstream 3D understanding and point cloud analysis tasks.
First, the method proposed in this paper still relies on the combination of weights for multi-dimensional feature losses during the training phase. Since optimal weight settings may vary across different object categories, this introduces a certain degree of hyperparameter sensitivity. Currently, the optimal weights are determined empirically; this process is time-consuming, and it is difficult to guarantee that each adjustment aligns with the direction of positive convergence. Therefore, future research could further explore mechanisms for the dynamic and adaptive adjustment of loss weights during the training process to reduce manual intervention, accelerate loss convergence, and enhance the robustness of the algorithm.
Second, based on the experimental results, it can be found that in the skeleton point extraction results, instances of redundant skeleton point extraction exist in certain regions, for example, the human upper limb regions and the chair backrest regions. The reason is that, compared to supervised learning, unsupervised learning lacks the supervision from manually annotated points that carry specific semantic meaning (annotation information). It can only extract points capable of representing that specific region through feature learning and loss function constraints. Although reducing the number of extracted skeleton points might ameliorate this situation, the possibility of incomplete skeleton point representation also exists. Therefore, in future work, enhancing skeleton point feature aggregation and shape representation is a possible direction for improvement.
Furthermore, point clouds in real-world scenes are often accompanied by issues such as noise, occlusion, outliers, and incomplete observations. Although sparsity has been introduced into the training data of this study through random downsampling, the robustness of the network under conditions of severe noise perturbation or extreme partial observation has not been further systematically evaluated. In future work, the applicability of the model in complex point cloud scenes can be enhanced by incorporating noise augmentation strategies and designing noise-invariant features.
Furthermore, in terms of practical application, the proposed method relies solely on a single forward pass during the inference phase. It requires neither complex post-processing nor manual intervention, exhibiting a high degree of automation, and can be directly integrated into existing point cloud processing pipelines. In field applications, simply feeding the object point cloud data collected by sensors into the model automatically generates skeleton points and their topological structures. This makes it suitable for tasks requiring immediate structural information, such as robot navigation, agricultural plant structure analysis, and rapid scene understanding. Simultaneously, we conducted a comparative statistical analysis of the computational cost, parameter size, and average test time against the comparison algorithms. The model complexity metrics of our method are 4.51 GFLOPs, 0.49 MB, and 0.708 s, respectively. Experimental results indicate that the proposed algorithm significantly outperforms the other two comparison algorithms in terms of both model complexity and real-time performance. This implies that Graph-SENet possesses the capability for real-time application in practical systems, holding significant importance for advancing 3D data analysis capabilities in fields such as autonomous driving, smart healthcare, and smart agriculture.
Author Contributions
Conceptualization, J.L. and W.Z.; methodology, J.L.; software, J.L.; validation, J.L., W.G. and W.Z.; formal analysis, J.L.; investigation, J.L.; resources, W.G. and W.Z.; data curation, J.L.; writing—original draft preparation, J.L.; writing—review and editing, W.G. and W.Z.; visualization, J.L.; supervision, W.Z.; project administration, W.Z.; funding acquisition, W.G. and W.Z. All authors have read and agreed to the published version of the manuscript.
Funding
This study was partially supported by the National Natural Science Foundation of China (NSFC) Program 62276009 and the Japan Science and Technology Agency (JST) AIP Acceleration Research JPMJCR21U3.
Institutional Review Board Statement
Not applicable.
Informed Consent Statement
Not applicable.
Data Availability Statement
The data presented in this study are available upon request from the corresponding author.
Conflicts of Interest
The authors declare no conflicts of interest.
References
- Stava, O.; Pirk, S.; Kratt, J.; Chen, B.; Měch, R.; Deussen, O.; Benes, B. Inverse procedural modelling of trees. Comput. Graph. Forum 2014, 33, 118–131. [Google Scholar] [CrossRef]
- Guo, J.; Cheng, Z.; Xu, S.; Zhang, X. Realistic procedural plant modeling guided by 3D point cloud. In Proceedings of the SIGGRAPH ‘17: Special Interest Group on Computer Graphics and Interactive Techniques Conference, Los Angeles, CA, USA, 30 July–3 August 2017; pp. 1–2. [Google Scholar]
- Guo, J.; Xu, S.; Yan, D.-M.; Cheng, Z.; Jaeger, M.; Zhang, X. Realistic procedural plant modeling from multiple view images. IEEE Trans. Vis. Comput. Graph. 2018, 26, 1372–1384. [Google Scholar] [CrossRef] [PubMed]
- Wang, Y.; Liu, Q.; Yang, J.; Ren, G.; Wang, W.; Zhang, W.; Li, F. A method for tomato plant stem and leaf segmentation and phenotypic extraction based on skeleton extraction and supervoxel clustering. Agronomy 2024, 14, 198. [Google Scholar] [CrossRef]
- Hossen, M.A.; Naim, A.G.; Abas, P.E. Deep Learning for Skeleton-Based Human Activity Segmentation: An Autoencoder Approach. Technologies 2024, 12, 96. [Google Scholar] [CrossRef]
- Li, Y.; Li, P.; Xu, M.; Wang, Y.; Ji, C.; Han, Y.; Chen, R. Topology-Aware Keypoint Detection via Skeleton-Based Shape Matching. IEEE Trans. Consum. Electron. 2024, 71, 367–378. [Google Scholar] [CrossRef]
- Zhu, H.; Zheng, W.; Zheng, Z.; Nevatia, R. Sharc: Shape and appearance recognition for person identification in-the-wild. In Proceedings of the IEEE/CVF Winter Conference on Applications of Computer Vision, Waikoloa, HI, USA, 3–8 January 2024; pp. 6290–6300. [Google Scholar]
- Zhao, Q.; Zheng, C.; Liu, M.; Chen, C. A single 2d pose with context is worth hundreds for 3d human pose estimation. Adv. Neural Inf. Process. Syst. 2023, 36, 27394–27413. [Google Scholar]
- Peng, Q.; Zheng, C.; Chen, C. A dual-augmentor framework for domain generalization in 3d human pose estimation. In Proceedings of the IEEE/CVF Conference on Computer Vision and Pattern Recognition, Seattle, WA, USA, 16–22 June 2024; pp. 2240–2249. [Google Scholar]
- Mehraban, S.; Adeli, V.; Taati, B. Motionagformer: Enhancing 3d human pose estimation with a transformer-gcnformer network. In Proceedings of the IEEE/CVF Winter Conference on Applications of Computer Vision, Waikoloa, HI, USA, 3–8 January 2024; pp. 6920–6930. [Google Scholar]
- Singh, G.; George, R.P.; Ahmad, N.; Hussain, S.; Ather, D.; Kler, R. A deep learning approach for evaluating the efficacy and accuracy of PoseNet for posture detection. Int. J. Syst. Assur. Eng. Manag. 2024, 1–10. [Google Scholar] [CrossRef]
- Zhang, W.; Peng, X.; Cui, G.; Wang, H.; Takata, D.; Guo, W. Tree branch skeleton extraction from drone-based photogrammetric point cloud. Drones 2023, 7, 65. [Google Scholar] [CrossRef]
- Sathesh, A.; Adam, E.E.B. Hybrid parallel image processing algorithm for binary images with image thinning technique. J. Artif. Intell. 2021, 3, 243–258. [Google Scholar]
- Ko, D.H.; Hassan, A.U.; Majeed, S.; Choi, J. Skelgan: A font image skeletonization method. J. Inf. Process. Syst. 2021, 17, 1–13. [Google Scholar]
- Sankar, G. Implementation of an image thinning algorithm using Verilog and MATLAB. J. Nonlinear Anal. Optim. 2022, 13, 540–546. [Google Scholar]
- Wen, C.; Yu, B.; Tao, D. Learnable skeleton-aware 3D point cloud sampling. In Proceedings of the IEEE/CVF Conference on Computer Vision and Pattern Recognition, Vancouver, BC, Canada, 17–24 June 2023; pp. 17671–17681. [Google Scholar]
- Bin, L.; Xiao-Ming, F. Research on 3D point cloud skeleton extraction based on improved adaptive k-means clustering. Acta Autom. Sin. 2022, 48, 1994–2006. [Google Scholar]
- Yang, J.; Wen, X.; Wang, Q.; Ye, J.-S.; Zhang, Y.; Sun, Y. A novel algorithm based on geometric characteristics for tree branch skeleton extraction from LiDAR point cloud. Forests 2022, 13, 1534. [Google Scholar] [CrossRef]
- Miao, T.; Zhu, C.; Xu, T.; Yang, T.; Li, N.; Zhou, Y.; Deng, H. Automatic stem-leaf segmentation of maize shoots using three-dimensional point cloud. Comput. Electron. Agric. 2021, 187, 106310. [Google Scholar] [CrossRef]
- Fu, Y.; Xia, Y.; Zhang, H.; Fu, M.; Wang, Y.; Fu, W.; Shen, C. Skeleton extraction and pruning point identification of jujube tree for dormant pruning using space colonization algorithm. Front. Plant Sci. 2023, 13, 1103794. [Google Scholar] [CrossRef] [PubMed]
- Xu, S.; Li, X.; Yun, J.; Xu, S. An effectively dynamic path optimization approach for the tree skeleton extraction from portable laser scanning point clouds. Remote Sens. 2021, 14, 94. [Google Scholar] [CrossRef]
- Zhang, W.; Zhou, H.; Dong, Z.; Liu, J.; Yan, Q.; Xiao, C. Point cloud completion via skeleton-detail transformer. IEEE Trans. Vis. Comput. Graph. 2022, 29, 4229–4242. [Google Scholar] [CrossRef]
- Tang, H.; Ding, L.; Wu, S.; Ren, B.; Sebe, N.; Rota, P. Deep unsupervised key frame extraction for efficient video classification. ACM Trans. Multimed. Comput. Commun. Appl. 2023, 19, 1–17. [Google Scholar] [CrossRef]
- Guo, Z.; Shiao, W.; Zhang, S.; Liu, Y.; Chawla, N.V.; Shah, N.; Zhao, T. Linkless link prediction via relational distillation. In Proceedings of the International Conference on Machine Learning, Honolulu, HI, USA, 23–29 July 2023; pp. 12012–12033. [Google Scholar]
- Zeb, A.; Saif, S.; Chen, J.; Haq, A.U.; Gong, Z.; Zhang, D. Complex graph convolutional network for link prediction in knowledge graphs. Expert Syst. Appl. 2022, 200, 116796. [Google Scholar] [CrossRef]
- Cao, J.; Tagliasacchi, A.; Olson, M.; Zhang, H.; Su, Z. Point cloud skeletons via laplacian based contraction. In Proceedings of the 2010 Shape Modeling International Conference, Aix-en-Provence, France, 21–23 June 2010; pp. 187–197. [Google Scholar]
- Huang, H.; Wu, S.; Cohen-Or, D.; Gong, M.; Zhang, H.; Li, G.; Chen, B. L1-medial skeleton of point cloud. ACM Trans. Graph. 2013, 32, 65:61–65:68. [Google Scholar] [CrossRef]
- Tagliasacchi, A.; Zhang, H.; Cohen-Or, D. Curve skeleton extraction from incomplete point cloud. In Proceedings of the SIGGRAPH09: Special Interest Group on Computer Graphics and Interactive Techniques Conference, New Orleans, LA, USA, 3–7 August 2009; pp. 1–9. [Google Scholar]
- Jiang, A.; Liu, J.; Zhou, J.; Zhang, M. Skeleton extraction from point clouds of trees with complex branches via graph contraction. Vis. Comput. 2021, 37, 2235–2251. [Google Scholar] [CrossRef]
- Zhou, Y.; Dong, H.; El Saddik, A. Learning to estimate 3d human pose from point cloud. IEEE Sens. J. 2020, 20, 12334–12342. [Google Scholar] [CrossRef]
- Qin, H.; Zhang, S.; Liu, Q.; Chen, L.; Chen, B. PointSkelCNN: Deep learning-based 3D human skeleton extraction from point clouds. Comput. Graph. Forum 2020, 39, 363–374. [Google Scholar] [CrossRef]
- Vasileiadis, M.; Bouganis, C.-S.; Tzovaras, D. Multi-person 3D pose estimation from 3D cloud data using 3D convolutional neural networks. Comput. Vis. Image Underst. 2019, 185, 12–23. [Google Scholar] [CrossRef]
- Sengupta, A.; Cao, S. mmpose-nlp: A natural language processing approach to precise skeletal pose estimation using mmwave radars. IEEE Trans. Neural Netw. Learn. Syst. 2022, 34, 8418–8429. [Google Scholar] [CrossRef]
- Jakab, T.; Tucker, R.; Makadia, A.; Wu, J.; Snavely, N.; Kanazawa, A. Keypointdeformer: Unsupervised 3d keypoint discovery for shape control. In Proceedings of the IEEE/CVF Conference on Computer Vision and Pattern Recognition, Nashville, TN, USA, 20–25 June 2021; pp. 12783–12792. [Google Scholar]
- Shi, R.; Xue, Z.; You, Y.; Lu, C. Skeleton merger: An unsupervised aligned keypoint detector. In Proceedings of the IEEE/CVF Conference on Computer Vision and Pattern Recognition, Nashville, TN, USA, 20–25 June 2021; pp. 43–52. [Google Scholar]
- Lin, C.; Li, C.; Liu, Y.; Chen, N.; Choi, Y.-K.; Wang, W. Point2skeleton: Learning skeletal representations from point clouds. In Proceedings of the IEEE/CVF Conference on Computer Vision and Pattern Recognition, Nashville, TN, USA, 20–25 June 2021; pp. 4277–4286. [Google Scholar]
- Liu, Y.; D’Aronco, S.; Schindler, K.; Wegner, J.D. Pc2wf: 3d wireframe reconstruction from raw point clouds. arXiv 2021, arXiv:2103.02766. [Google Scholar] [CrossRef]
- Cao, L.; Xu, Y.; Guo, J.; Liu, X. WireframeNet: A novel method for wireframe generation from point cloud. Comput. Graph. 2023, 115, 226–235. [Google Scholar] [CrossRef]
- Luo, Z.; Ma, J.; Zhou, Z.; Xiong, G. Pcpnet: An efficient and semantic-enhanced transformer network for point cloud prediction. IEEE Robot. Autom. Lett. 2023, 8, 4267–4274. [Google Scholar] [CrossRef]
- Chang, A.X.; Funkhouser, T.; Guibas, L.; Hanrahan, P.; Huang, Q.; Li, Z.; Savarese, S.; Savva, M.; Song, S.; Su, H. Shapenet: An information-rich 3d model repository. arXiv 2015, arXiv:1512.03012. [Google Scholar]
- Gwak, J. 3D Model Classification Using Convolutional Neural Network. Available online: https://www.semanticscholar.org/paper/3-D-model-classification-using-convolutional-neural-Gwak/d6f7c761fa64754d7d93601a4802da27b5858f8b (accessed on 1 December 2025).
- Haque, A.; Peng, B.; Luo, Z.; Alahi, A.; Yeung, S.; Fei-Fei, L. Towards viewpoint invariant 3d human pose estimation. In Proceedings of the Computer Vision–ECCV 2016: 14th European Conference, Amsterdam, The Netherlands, 11–14 October 2016; pp. 160–177. [Google Scholar]
- Sun, Y.; Zhang, Z.; Sun, K.; Li, S.; Yu, J.; Miao, L.; Zhang, Z.; Li, Y.; Zhao, H.; Hu, Z. Soybean-MVS: Annotated three-dimensional model dataset of whole growth period soybeans for 3D plant organ segmentation. Agriculture 2023, 13, 1321. [Google Scholar] [CrossRef]
- CloudCompare: 3D Point Cloud and Mesh Processing Software. Available online: https://www.cloudcompare.org/ (accessed on 1 December 2025).
- Bertsekas, D. Convex Optimization Algorithms; Athena Scientific: Nashua, NH, USA, 2015. [Google Scholar]
- Zhang, S.; Song, Y.; Ou, R.; Liu, Y.; Li, S.; Lu, X.; Xu, S.; Su, Y.; Jiang, D.; Ding, Y. SCAG: A stratified, clustered, and growing-based algorithm for soybean branch angle extraction and ideal plant architecture evaluation. Plant Phenomics 2024, 6, 0190. [Google Scholar] [CrossRef]
Disclaimer/Publisher’s Note: The statements, opinions and data contained in all publications are solely those of the individual author(s) and contributor(s) and not of MDPI and/or the editor(s). MDPI and/or the editor(s) disclaim responsibility for any injury to people or property resulting from any ideas, methods, instructions or products referred to in the content. |
© 2025 by the authors. Licensee MDPI, Basel, Switzerland. This article is an open access article distributed under the terms and conditions of the Creative Commons Attribution (CC BY) license (https://creativecommons.org/licenses/by/4.0/).